Abstract
Process understanding of CO2 injection into a reservoir is a crucial step for planning a CO2 injection operation. CO2 injection was investigated for Ohio oil reservoirs which have access to abundant CO2 from local coal-fired power plants and industrial facilities. In a first of its kind study in Ohio, lab-scale core characterization and flooding experiments were conducted on two of Ohio’s most prolific oil and gas reservoirs—the Copper Ridge dolomite and Clinton sandstone. Reservoir properties such as porosity, permeability, capillary pressure, and oil–water relative permeability were measured prior to injecting CO2 under and above the minimum miscibility pressure (MMP) of the reservoir. These evaluations generated reservoir rock-fluid data that are essential for building reservoir models in addition to providing insights on injection below and above the MMP. Results suggested that the two Ohio reservoirs responded positively to CO2 injection and recovered additional oil. Copper Ridge reservoir’s incremental recovery ranged between 20% and 50% oil originally in place while that of Clinton sandstone ranged between 33% and 36% oil originally in place. It was also deduced that water-alternating-gas injection schemes can be detrimental to production from tight reservoirs such as the Clinton sandstone.
1. Introduction
The technology used for CO2 sequestration in deep geologic formations is currently in the demonstration phase while no country has yet put in place a comprehensive framework to support the scaling-up of carbon capture and storage (CCS) to meet the climate targets set by the Paris agreement [1] In the interim, the utilization of captured CO2 from anthropogenic sources for improving oil recovery can bridge the gap between the present day research and pilot stage to a fully developed and commercialized CCS stage [2]. This form of carbon utilization which achieves some geological storage, also known as Carbon Capture Utilization and Storage (CCUS), is being actively promoted by the U.S. Department of Energy (DOE) through various regional carbon sequestration partnerships (RCPs) [3]. CO2-based enhanced oil recovery (CO2-EOR) technology has evolved to a mature state and is routinely applied in many oil fields where a natural and/or anthropogenic source of CO2 is readily available [4]. Additional and supplementary techniques use water and foam in with CO2 to improve its mobility and sweep in the reservoir to optimize hydrocarbon recovery [5,6].
The state of Ohio has a long history of hydrocarbon production with the majority of its production coming from the eastern part of Ohio. However, Ohio reservoirs are characterized by poor primary recovery and low reservoir pressures which fuels the case for EOR. In addition, Ohio ranks fifth in the U.S. in terms of total CO2 emissions [7], thereby making it an excellent candidate to evaluate CCUS. Consequently, Battelle Memorial Institute (Battelle), in collaboration with the Ohio Coal Development Office (OCDO), has focused on advancing towards implementation of CCUS in Ohio’s depleted oil fields using CO2 from Ohio power plants and other large, stationary point-sources of emissions. The current study was conducted as part of a project that emphasized developing a process understanding as well as the technical and economic feasibility of CCUS in Ohio, especially in Ohio’s depleted oil fields. These include the Clinton sandstone in eastern Ohio and the Copper Ridge dolomite of the Knox Group in north-central Ohio (Figure 1). These fields have provided a major share of Ohio’s oil production and are promising candidates for CO2-EOR given their low primary recovery efficiencies resulting in approximately 80% to 90% of the original oil in place to be recovered from the reservoir by secondary and tertiary methods of recovery.
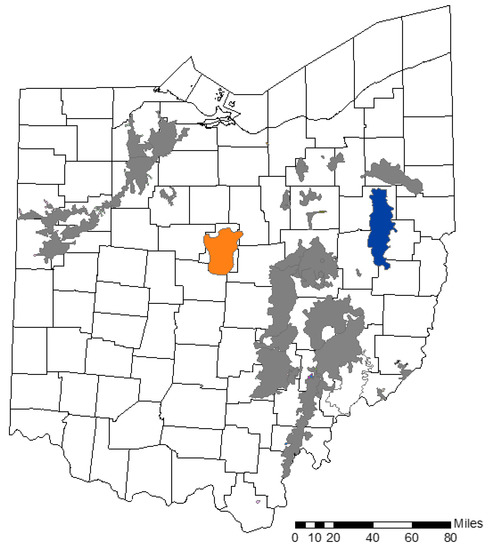
Figure 1.
Locations of the Morrow Consolidated (orange) and East Canton (blue) oilfields in Ohio. The grey regions represent other major oilfields in Ohio (after Hawkins et al.).
Recent assessments of CO2 sequestration potential in Ohio’s depleted oil fields have primarily been undertaken using simple volumetric analyses that did not consider full-scale fluid movement and displacement dynamics in an oil-CO2-brine system. Earlier assessments of CO2 EOR potential in Ohio reservoirs have utilized simple screening type models without a detailed understanding of in-situ processes or site-specific conditions [8,9]. This work seeks to bridge such gaps by ensuring that the best information available for the Clinton and the Copper Ridge reservoirs are incorporated into lab experiments that feed into pilot-scale tests in order to evaluate the potential for CO2-assisted EOR and geologic storage (co-sequestration) in Ohio’s oil fields. Laboratory experiments were conducted to develop a bench-scale process understanding as well as provide insights on tailoring pilot injection studies. This paper describes the lab experiments as an attempt to obtain a process understanding of CO2 injection into depleted Ohio reservoirs in a first of its kind study conducted in the Appalachian basin. Inferences from these studies were used to design field pilot studies that are not a subject of discussion in this paper.
2. Materials and Methods
2.1. Study Areas and Sample Acquisition
This study focused on two Ohio reservoirs that have been prolifically producing oil—namely, the Copper Ridge dolomite and Clinton sandstone. These reservoirs were chosen owing to the remaining oil reserves as well as carbon storage capacity which were evaluated in previous studies conducted by Battelle. Figure 2 shows a generalized stratigraphic column of various formations in Ohio including the Clinton sandstone and Copper Ridge dolomite.
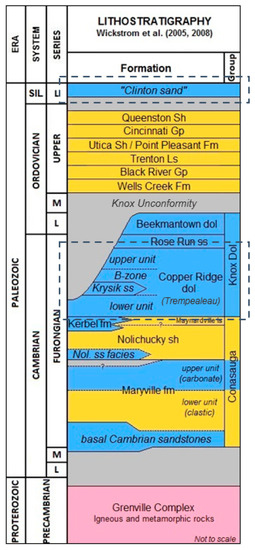
Figure 2.
Generic lithostratigraphic column showing Ohio reservoirs. The two reservoirs of interest are indicated using dotted lines.
2.1.1. Reservoirs of Interest
The Copper Ridge dolomite, also referred to as the Trempealeau formation, is a prolific and widely drilled oil and gas formation and is a part of the Knox group which also includes the Beekmantown dolomite and Rose Run sandstone (refer to Figure 2). Copper Ridge oil production comes from the porous (5%–10%) and permeable (1–100 mD) dolomite that is associated with erosional remnants from the Knox unconformity, which is a period of erosion across the Appalachian basin. The hydrocarbon source rock for this formation is believed to be Early Ordovician Utica shale [10]. Reservoir samples for the Copper Ridge dolomite were obtained from the Morrow Consolidated oilfield (MCOF), which was discovered in 1961 and followed by a surge in production and drilling activity that saw tremendous increase in oil production rates. However, rapid depletion and poor well management/drilling practices have caused a significant decline in production which can never be recovered. A limited number of water and steam floods were conducted to enhance its recovery but to little or no effect. As a result, out of the geologically estimated 177 million barrels of oil originally in place, only 36 million barrels (~20%) have been produced [11].
The Clinton sandstone, since its discovery in 1887, has been the most prolific, and thus the most drilled, oil and gas producing unit in Ohio [8,12]. The “Clinton” sandstone interval comprises a sequence of interbedded sandstones, siltstones, and shales deposited from a westward prograding delta system. Historically, the primary hydrocarbon production is from the Red “Clinton” and the upper portion of the White “Clinton”. These are often the most prolific producers of the “Clinton” Sand and thus are most often drilled. Rock and oil samples representative of the Clinton sandstone were collected from the East Canton oilfield (ECOF) which has nearly 3000 wells in the reservoir. The field is estimated to contain over 1500 million barrels of oil in geological reserves while it has only produced about 100 million barrels (~7%) to date. Table 1 lists the depth, discovery pressure, reservoir temperature, oil originally in place (OOIP), average porosity and oil API gravity of the Copper Ridge dolomite and Clinton sandstone reservoirs.

Table 1.
Morrow Consolidated and East Canton Oilfield properties (after Hawkins et al.).
2.1.2. Sample Collection
COPPER RIDGE DOLOMITE
Well selection for sampling cores was straightforward in this formation as Battelle previously carried out a core sample collection campaign in the MCOF from the Bush #5 well (API: 3411724540000) located in Morrow County (Figure 3—left). The well is currently operated by EOR Technologies LLC. Battelle had access to a repository of whole cores obtained from the well in earlier phases of the project. Bush #5 was previously evaluated as a brine disposal well and cuts through the Upper Copper Ridge, Copper Ridge “B”, and Lower Copper Ridge intervals. The Upper Copper Ridge interval that begins at 2906 ft. below the Knox unconformity was found to be the zone of interest considering it has an average porosity of 11.5%, as suggested by neutron logs. In addition, sidewall cores in this zone were found to contain hydrocarbons and the oil–water transition zone is estimated to lie in the bottom end of this zone. The zone has a gross thickness of 186 ft. and a net thickness of 166 ft. The Bush #5 well did not produce any oil or gas and hence could not be sampled for reservoir fluids. Thus, fluids were sampled from the Guy Heffley #1 well which is the closest well to the Bush #5 well. The well is operated by Fishburn Inc. and is located in Canaan township of Morrow County, a mile northeast of the Bush #5 well. Production from this well began in the year 1964 and has historically produced 75,700 bbl of oil and 4600 bbl of water.
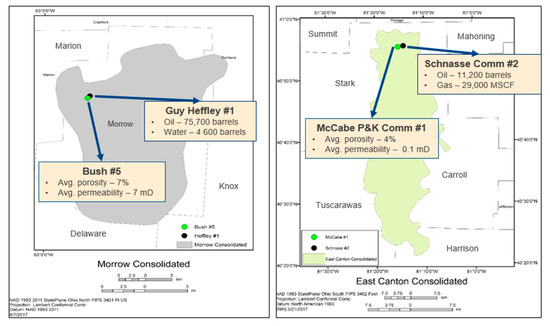
Figure 3.
Locations of wells used for sampling in Morrow Consolidated oilfield (MCOF) (left) and East Canton oilfield (ECOF) (right).
LINTON SANDSTONE
The McCabe P&K Comm #1 well, located in Stark county (Figure 3—right), was chosen as the sampling well in the ECOF as it contained satisfactory petrophysical data as well as production history which were obtained from the ODNR database. McCabe P&K Comm #1 well has been a consistent producer of oil and gas since its commencement in 1991. The well has an average producing gas-oil ratio (GOR) of about 1900 SCF/STB which indicates the volatile nature of the oil. Permeability is typically an order of magnitude lower in the Clinton sandstone compared to the Copper Ridge dolomite, hence any value above 0.1 mD was considered suitable for sampling. Fluid sampling was carried out from the W&R Schansse Comm #2 which is less than a mile away from the McCabe well. This well was chosen because it has similar characteristics to the McCabe P&K Comm #1 well and was more readily accessible. The well has produced 11,200 bbl of oil and 29,000 MSCF of gas as of the time of sampling. The average producing GOR is around 3500 SCF/STB indicating a volatile oil. Figure 4 and Figure 5 show typical well logs in the two oilfields that depict the major members of the Copper Ridge dolomite (upper, “B” zone, lower) and Clinton sandstone (CLNN1, CLNN2, CLNN3, CLNN4, CLNN5). The Copper Ridge “B” zone and lower Coper Ridge are major producing intervals in MCOF while CLNN2 and CLNN3 are the major producing intervals in ECOF.
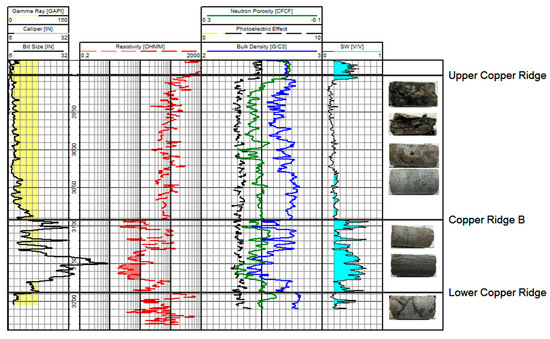
Figure 4.
Typical well log in MCOF showing major members of Copper Ridge dolomite [13].

Figure 5.
Typical well log in ECOF showing major members of Clinton dolomite [14].
2.2. Methods
2.2.1. Experimental Setup
Reservoir rock and fluid samples were shipped to The University of Texas at Austin where several core characterization and flooding tests were conducted to evaluate key reservoir petrophysical properties as well as CO2 EOR potential. Core characterization measurements included porosity and permeability to injection brine and air, and capillary pressure. Core floods included a waterflood followed by a CO2 flood, both of which were conducted at two pressures—one lower and one higher than the minimum miscibility pressure (MMP) of the reservoir.
Prior to conducting corefloods, the MMP of the two reservoirs was computed analytically using the power law model developed by Valluri et al. [15]:
MMP = 0.3123 T0.9851 MC5+0.7421
In the equation listed above, T represents the reservoir temperature in °F and MC5+ represents pentanes plus fraction—molecular weight is in g/mol. The MMP for the Copper Ridge dolomite was found to be 1326 psi when the reservoir temperature was 91 °F and had an MC5+ of 191.1 g/mol. Similarly, the MMP of Clinton sandstone was computed to be 1433 psi at 104 °F and 171.7 g/mol MC5+. Corefloods were planned based on these values with one flood above the MMP and another one below.
One-inch-diameter core plugs sampled from the wells of interest were assembled inside an aluminum one-inch core holder. The core holder and accumulators were all attached to a metal rack. Figure 6 is a schematic that describes the experimental setup with all concerned equipment. Depending on the flood being performed, one of the accumulators was connected to the core holder. Due to the nature of the reservoir crude oils, the effluent was collected inside a fume hood. A back-pressure regulator was used to control the pore pressure for the CO2 floods.
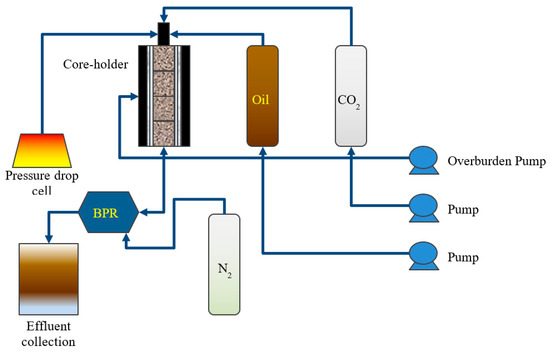
Figure 6.
Experimental setup for core characterization and injection flooding.
Core porosity was calculated from the pore volume through the application of Boyle’s law. Permeability was calculated by measuring the pressure drop during flow of nitrogen gas or formation brine when the core is 100% saturated with the respective fluid. Capillary pressure was measured through a mercury injection capillary pressure (MICP) apparatus. The MICP apparatus was an Autopore IV 9500 V1.10 made by Micromeritics Inc. (Norcross, GA, USA). The water–oil relative permeability was calculated using water flooding data and the John-Baussler-Naumann method.
In addition, wettability was measured using the pendant drop method on a Rame-Hart goniometer Chips from the provided core samples were aged in the reservoir oil for approximately three weeks at an elevated temperature of 80 °C (which was slightly higher than the reservoir temperature for both reservoirs). This was carried out to accelerate the aging process. Crude oil–water interfacial tension was also measured using reservoir formation brine as the aqueous medium.
2.2.2. Core Floods
Core floods were conducted at a commensurate flow rate with a fluid speed of 0.2 ft/day, given the tight nature of the rocks and the desire for a lower pressure drop across the core. The oil saturated rock was flooded with formation brine. The pressure drops and effluent recovery data were recorded. Following brine injection, a CO2 tertiary flood was performed at both below the MMP and above the MMP. Brine was injected from the top and flowed through the core holder and back-pressure regulator (BPR). Once the brine passed through the BPR, CO2 was injected into the core holder at an interstitial velocity of 0.2 ft/day. As with the brine injection, the effluent (including gas) and pressure drop data were collected and recorded. The pressure drop data for these experiments exhibited some oscillations as the BPR diaphragm opened and closed due to complexity of three phase flow through the BPR. At the conclusion of the CO2 injection, the core was flooded with oil to bring the sample oil saturation up to the initial saturation value.
3. Results
3.1. Core Characterization
The results for core characterization experiments are summarized in Table 2. As an initial observation, the Clinton sandstone was found to be tighter than the Copper Ridge dolomite, which was expected based on a survey of previous literature [12,14,16]. While most sandstone reservoirs have higher porosities and permeabilities, the Clinton sandstone found in eastern Ohio is very tight and it is commonly explored via hydraulic fracturing and horizontal drilling, which is uncommon for sandstone reservoirs [17]. For instance, Riley et al. [14] have conducted petrological investigations in this region using core obtained from an ECOF well and reported an average permeability of 1.05 mD for the core samples the authors tested. The reservoir quality of the Clinton sandstone improves as one moves eastward towards Pennsylvania. Another difference between the two reservoirs was their natural wettability. The Copper Ridge exhibited natural oil wetness while the Clinton sandstone was found to be mixed-wet, tending towards oil-wet.
Table 2.
Core characterization results.
Figure 7 and Figure 8 show the oil–water drainage capillary pressure and the relative permeability curves for Copper Ridge dolomite. Entry capillary pressure was found to be ca. 1.9 psia. Water–oil relative permeability was calculated using the unsteady state Johnson-Bossler-Naumann (JBN) method. The residual oil saturations were found to be 0.6 and oil relative permeability at the initial water saturation was found to be 0.14. Relative permeability to water at the residual oil saturation was found to be 0.12.
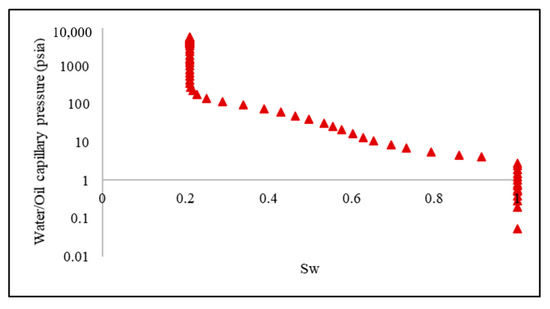
Figure 7.
Copper Ridge dolomite water–oil capillary pressure curve.
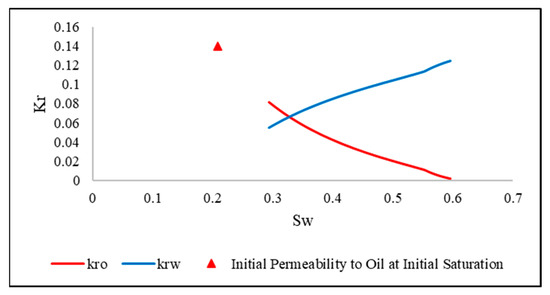
Figure 8.
Post-breakthrough water–oil relative permeability curves for Copper Ridge dolomite.
Figure 9 and Figure 10 represent the oil–water drainage capillary pressure and the relative permeability curves for the Clinton sandstone. Entry capillary pressure was found to be ca. 3 psia. Water–oil relative permeability was calculated using the JBN method, similar to the Copper Ridge dolomite. The residual oil saturation was found to be 0.58 and the oil relative permeability at the initial water saturation was found to be 0.23. Relative permeability to water at the residual oil saturation was found to be 0.04. The saturation end-points and relative permeabilities at end-points of the two formations are listed in Table 3.
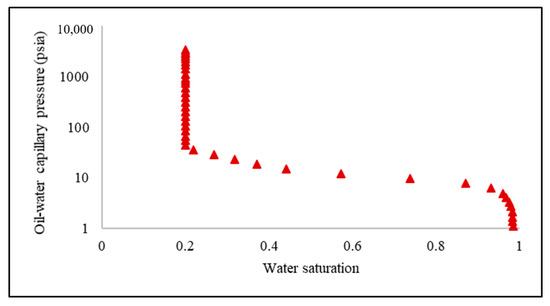
Figure 9.
Clinton sandstone oil–water capillary pressure curve.
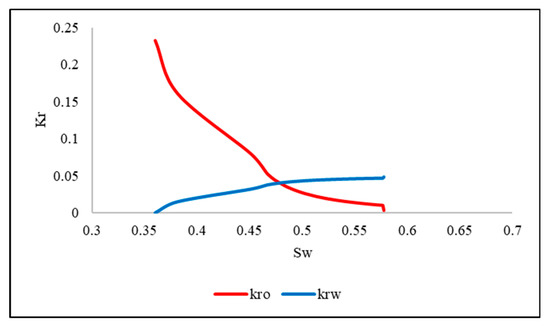
Figure 10.
Clinton sandstone water–oil relative permeability to brine.
Table 3.
Relative permeability results.
At any given water saturation, the relative permeability of oil was found to be higher in the Clinton sandstone than in the Copper Ridge dolomite. Though residual oil saturations are comparable for the two reservoirs, the Clinton sandstone seems to have a higher irreducible water saturation than the Copper Ridge dolomite which implies a stronger water wetting nature of the rock. This is beneficial for oil recovery as the oil phase is likely to move more freely in sandstone compared to the dolomite. Although the relative permeability to oil is higher in the Clinton sandstone, the lower value of water relative permeability at residual oil saturation may mean it would be harder for injected CO2 to displace the water. Hence, the resultant production responses from these two fields will reflect a combination of oil relative permeability through the pore space as well as ability of CO2 to contact and dissolve trapped oil.
3.2. CO2 Injection Schemes
Table 4 shows a summary of all the core floods performed for the two reservoirs in this study.
Table 4.
Summary of core flooding experiments.
Figure 11 and Figure 12 show the oil recovery and pressure drop across the core for immiscible (below MMP) and miscible (above MMP) injections conducted on Copper Ridge dolomite samples, respectively. The additional oil recovery from immiscible flooding is about 16% OOIP while that of the miscible flood is 26% OOIP with a higher pressure drop across the core. The miscible CO2 flood produced much more oil than the immiscible CO2 flood, as the gas was able to fully mix with the oil and displace it through the core.
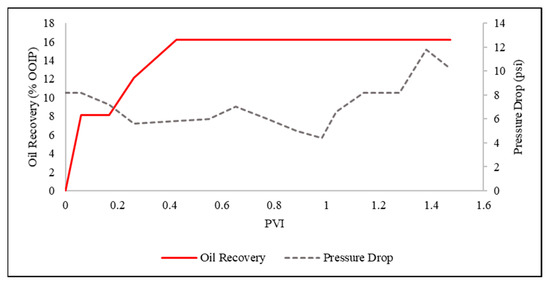
Figure 11.
Oil recovery and pressure response for the Copper Ridge dolomite immiscible CO2 flood.
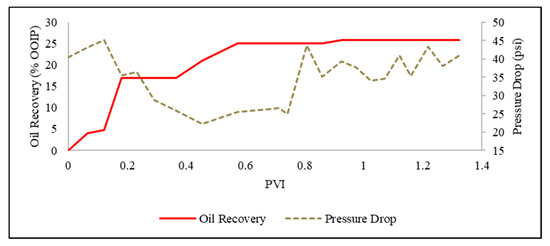
Figure 12.
Oil recovery and pressure response for Copper Ridge dolomite miscible CO2 flood.
Due to the contrast in viscosity between CO2 and oil, CO2 can finger ahead of the displaced oil, creating channels through which subsequent gas will flow through, thus lowering the sweep efficiency of the gas. Water is often injected with CO2 to mitigate this effect. However, this can also have an adverse effect if the rock is too tight, as mobility becomes a factor. For the Copper Ridge dolomite, it was shown that the miscible CO2 flood yielded more oil than the immiscible CO2 flood. Using this basis, water-alternating gas (WAG) floods were performed under miscible conditions to determine whether or not the addition of water would help improve oil recovery. Water and CO2 were injected simultaneously after the waterflood. Two ratios were used in separate WAG experiments: a 2:1 water-gas ratio, and a 1:1 water-gas ratio. These WAG ratios are typical in field projects [18]. Figure 13 compares the oil recovery performances.
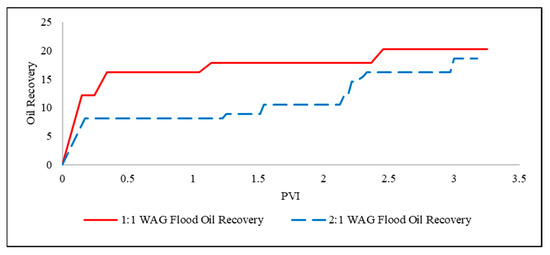
Figure 13.
Oil recovery curves for Copper Ridge dolomite miscible WAG floods.
As noticed by Gong et al. [19], addition of water to CO2 can lower the mobility of the mixture in tight reservoir core plugs, such as the ones used for this experiment. The oil recovery decreased as the WAG ratio increased. It also took longer to produce the incremental oil. In the case of the Copper Ridge dolomite (low permeability rocks), it was demonstrated that a miscible, pure CO2 flood would be the most productive option (25% recovery) as opposed to a WAG flood (20% recovery).
Figure 14 and Figure 15 correspond to the oil recovery and pressure drop profiles across the core for immiscible (below MMP) and miscible (above MMP) injections conducted on Clinton sandstone samples. The additional oil recovery from immiscible flooding is about 29% OOIP while that of the miscible flood is 26% OOIP. The pressure drop across the core was higher for the miscible CO2 injection. According to a study of U.S. CO2 field applications, it was recommended that miscible CO2 floods be applied to sandstones with permeabilities greater than 10 mD [20]. The Clinton Sandstone core plugs used in this experiment had a permeability of only 2 mD on average; CO2 flood below the MMP looked better than the miscible CO2 flood. In addition, Wang et al. [21] showed that applying tertiary CO2 flooding to a light oil, tight sandstone reservoir gives a lower oil recovery factor than secondary CO2 flooding.
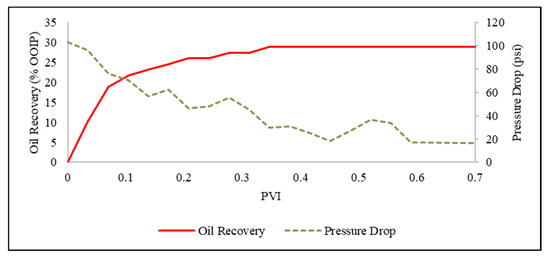
Figure 14.
Oil recovery and pressure response for Clinton sandstone immiscible CO2 flood.
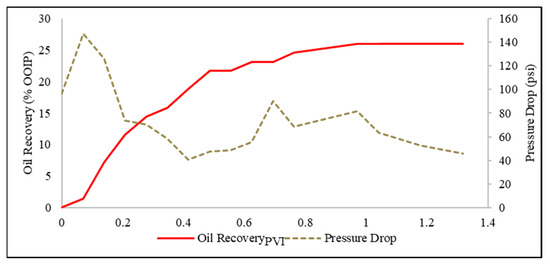
Figure 15.
Oil recovery and pressure response for Clinton sandstone miscible CO2 flood.
Another observation from these results is that the immiscible/near-miscible flood required lower pore volumes of CO2 to reach maximum recovery which is tied to the fact that immiscible CO2 acts similar to a piston and pushes the oil out while filling the pores while miscible CO2 solubilizes in the oil and drives it out, thereby leading to a higher CO2 consumption. In summary, near-miscible injection was found to be beneficial for both the reservoirs with optimum oil recovery being observed above the MMP for the dolomitic core while the recoveries below and above the MMP were similar for the tight Clinton sandstone.
The pressure drop was high for tertiary CO2 floods for the sandstone core. Water-alternating-gas floods were not conducted for sandstone reservoir samples as the pressure drops were expected to be even higher for the WAG experiments. Water creates blocks and restricts flow of CO2 thereby leading to higher pressure drops than standalone CO2 injection.
4. Discussion
There is little to no previous evidence of core characterization data and CO2 core flood analyses in Ohio oil and gas reservoirs. Sparsely available prior work focused on waterflooding and low-salinity flooding [22]. The lack of CO2 injection analyses, especially when geologic CO2 sequestration is gaining momentum in the U.S., makes this first of its kind evaluation in Ohio all the more relevant given the abundance of anthropogenic CO2 from power plants, chemical processing plants and ethanol refineries. In 2019, the annual CO2 emissions from the state topped 100 million metric tons, as reported by the Energy Information Administration. This CO2 can be used to revitalize the state’s oil and gas production which is characterized by depleted oil and gas reservoirs and wells nearing their decline. Lab experiments discussed in this paper are the first step in the process wherein developing a theoretical understanding of CO2 injection prior to field trials is crucial. The effect of injecting under miscible conditions has been well characterized and documented in the literature. However, a case-by-case evaluation is needed to fully understand the impact of miscible injection prior to designing an injection flood. This is further illustrated by Figure 16 and Figure 17 which graphically represent the oil recovery results from coreflooding experiments in the two reservoirs. The yellow portions of the bars represent incremental oil recovery from standalone or water-assisted CO2 injection and are maximum for above the MMP and almost similar for near-miscible conditions in sandstone. The Copper Ridge dolomite results for tests above the MMP suggested nearly 80% recovery of OOIP, which in reality may not be true due to the heterogeneous nature of the reservoir and the synthetic conditions such as controlled flow rate and reservoir homogeneity established at lab-scale. However, this result shows the capability of CO2 to further deplete the reservoir.
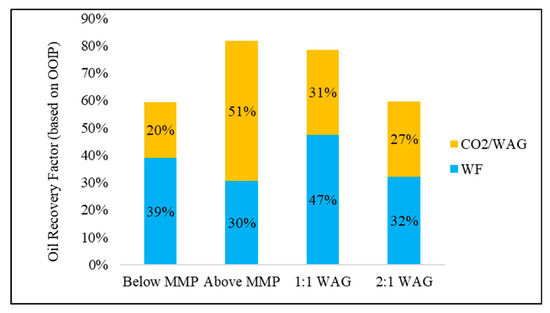
Figure 16.
Oil recovery results from Copper Ridge dolomite coreflooding tests.
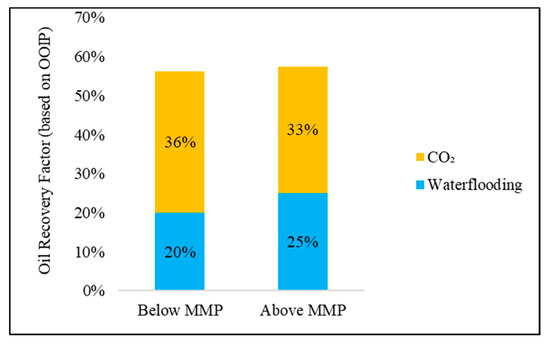
Figure 17.
Oil recovery results from Clinton sandstone coreflooding tests.
The situation is not as straightforward for the Clinton sandstone. Injection at miscible conditions produced less incremental oil compared to injection below the MMP. As discussed in the results section, this implies tight reservoirs may not necessarily respond to miscible CO2 injection as higher permeability reservoirs such as Copper Ridge do. One possible explanation for this could be the interplay of gas-drive and capillary forces which determine oil flow from the reservoir pores to the bulk oil phase. Miscibility reduces the interfacial tension between oil and gas phases which in turn reduces the capillary forces that drive oil out of narrow pore throats in tight reservoirs. This could potentially be a reason for the lower incremental recovery above the MMP in the tight Clinton sandstone. Additionally, smaller pore throats require a higher entry capillary pressure which could be a prohibitive factor for CO2 contacting a large volume of the reservoir. Consequently, a lower amount of CO2 is available to solubilize the oil trapped in tight pores of Clinton sandstone compared to the Copper Ridge dolomite. This explains the lower incremental recovery in the Clinton sandstone compared to the Copper Ridge dolomite in a miscible injection scenario.
Lab studies indicated permeabilities and pressures to be achieved during field CO2 injections. These results are particularly useful in building reservoir simulation models for the two reservoirs to estimate field performance and forecast EOR production and CO2 storage. Although lab-scale recoveries and pressure drops are not representative of field conditions, they can be used for comparing various injection schemes and screening for the most suitable ones to carry forward. In the current study, near-miscible injection was found to be beneficial for optimum oil recovery from CO2 injection.
5. Conclusions
Results obtained from core floods provided insights on additional oil recovery and potential challenges of using CO2 for revitalizing Ohio oil and gas reservoirs. The major inferences include:
- In-situ capillary pressure and relative permeability curves have been obtained, which can serve as useful inputs for dynamic reservoir simulations conducted in carbonate and sandstone reservoirs in the Appalachian region.
- Near-miscible CO2 injections are capable of recovering additional oil from Ohio reservoirs. Incremental recoveries ranged from 20% to 50% OOIP, which amounted to a 50% to 180% increase over primary recoveries (calculated as the ratio incremental to primary recovery). Primary recoveries ranged from 20% to 30% in Ohio’s carbonate and sandstone reservoirs implying there is still some additional primary production left in Ohio’s oil fields.
- In tight reservoirs, WAG injection lowers and delays incremental oil recovery. Continuous CO2 injection is preferred over WAG injection.
- Miscible injection is beneficial in medium-high permeability (1–100 mD)—e.g., in reservoirs such as the Copper Ridge dolomite. Injecting above the MMP seemed to reduce the incremental oil recovery in the tighter Clinton sandstone alluding to a dependance on capillary forces for increasing oil recovery.
Author Contributions
Conceptualization—S.M. and K.M.; methodology—S.M., M.K.V., and K.M.; analysis—J.Z. and M.K.V.; investigation—M.K.V. and K.M.; data curation—J.Z. and M.K.V.; writing—original draft preparation—M.K.V., S.M., J.Z., and K.M.; writing—review and editing—M.K.V.; funding acquisition—S.M. All authors have read and agreed to the published version of the manuscript.
Funding
This research was funded by Ohio Development Services Agency OCDO Grant OOE-CDO-D-13-24.
Acknowledgments
We thank our Battelle colleague Jackie Gerst for a review of this manuscript.
Conflicts of Interest
The authors declare no conflict of interest.
References
- Global CCS Institute; Policy Priorities to Incentivise Large Scale Deployment of CCS; Global CCS Institute. Available online: https://www.globalccsinstitute.com/resources/publications-reports-research/policy-priorities-to-incentivise-large-scale-deployment-of-ccs/. (accessed on 23 November 2019).
- Benson, S.M.; Friedman, S.J. Carbon Dioxide Capture, Utilization and Storage: An Important Part of a Response to Climate Change; Spring Issue; The Bridge, National Academy of Engineering: Washington, DC, USA, 2014; pp. 42–50. [Google Scholar]
- Rodosta, T.; Bromhal, G.; Damiani, D. U.S. DOE/NETL carbon storage program: Advancing science and technology to support commercial deployment. Energy Procedia 2017, 114, 5933–5947. [Google Scholar] [CrossRef]
- Jarrell, P.M.; Fox, C.; Stein, M.; Webb, S. Practical Aspects of CO2 Flooding—Monograph Volume 22; Society of Petroleum Engineers: Richardson, TX, USA, 2002. [Google Scholar]
- Novak, K.; Malvić, T.; Simon, K. Increased hydrocarbon recovery and CO2 management, a Croatian example. Environ. Earth Sci. 2013, 68, 1187–1197. [Google Scholar] [CrossRef]
- Novak, K.; Malvić, T.; Velić, J.; Simon, K. Increased hydrocarbon recovery and CO2 storage in Neogene sandstones, a Croatian example: Part II. Environ. Earth Sci. 2014, 71, 3641–3653. [Google Scholar] [CrossRef]
- Energy Information Administration (EIA). U.S. Energy Related Carbon Dioxide Emissions. Report published September 2018. Available online: https://www.eia.gov/environment/emissions/carbon/. (accessed on 23 November 2019).
- Riley, R.A.; Janssens, A.; Baranoski, M. Cambrian-Ordovician Knox Production Patterns and Potential for Enhanced Oil Recovery in Ohio. In Proceedings of the Fourth Annual Technical Symposium of the Ohio Geological Society, Akron, OH, USA, 9 October 1996. [Google Scholar]
- Bank, G.; Riestenberg, D.; Koperna, G. CO2 enhanced oil recovery potential of the Appalachian basin. In Proceedings of the SPE Eastern Regional Meeting, Lexington, KY, USA, 17–19 October 2007. SPE 111282. [Google Scholar]
- Ryder, R.T. Stratigraphic framework of Cambrian and Ordovician rocks across Rome trough, central Appalachian basin. Am. Assoc. Pet. Geol. Bull. 1987, 71, 1110. [Google Scholar]
- Hawkins, J.; Mishra, S.; Stowe, R.; Makwana, K.; Main, J. A revised assessment of the CO2 storage capacity and enhanced oil recovery potential in the major oil fields of Ohio. Environ. Geosci. 2017, 24, 1–13. [Google Scholar] [CrossRef]
- Pepper, J.F.; De Witt, W., Jr.; Everhart, G.M. The “Clinton” Sands of Early Silurian Age in Canton, Dover, Massillon, and Navarre Quadrangles; U.S. Geological Survey Bulletin 1003-A; U.S. Geological Survey: Reston, VA, USA, 1953; p. 13. [Google Scholar]
- Battelle. Basic and Advanced Wireline Log Interpretation in Bush #5 Well in Morrow County, Ohio; Reported Submitted to the Ohio Coal Development Office under Grant Number OOE-CDO-D-13-24; Battelle: Columbus, OH, USA, 2015. [Google Scholar]
- Riley, R.A.; Wicks, J.L.; Perry, C.J. Silurian “Clinton” Sandstone Reservoir Characterization for Evaluation of CO2-EOR Potential in the East Canton Oil Field, Ohio. Final Report submitted to US DOE under agreement number DE-NT0005115. 2010. Available online: https://www.osti.gov/servlets/purl/983930 (accessed on 23 November 2019).
- Valluri, M.K.; Mishra, S.; Schuetter, J. An improved correlation to estimate the minimum miscibility pressure of CO2 in crude oils for carbon capture, utilization, and storage projects. J. Pet. Sci. Eng. 2017, 158, 408–415. [Google Scholar] [CrossRef]
- Breen, K.J.; Angelo, C.G.; Masters, R.W.; Sedam, A.C. Chemical and Isotopic Characteristics of Brines from Three Oil- and Gas-Producing Sandstones in Eastern Ohio, with Applications to the Geochemical Tracing of Brine Sources; U.S. Geological Survey Water-Resources Investigations Report WRI 84-4314. 1985. Available online: https://pubs.er.usgs.gov/publication/wri844314 (accessed on 23 November 2019).
- Jacot, R.H.; Hopkins, C.W.; Gonzalez, D.W.; Meyer, B.R. Improving Hydraulic Fracturing Results in the Clinton Sandstone of Ohio: A Case History. In Proceedings of the Society of Petroleum Engineers Eastern Regional Meeting, Pittsburgh, PA, USA, 2–4 November 1993. [Google Scholar] [CrossRef]
- Han, L.; Gong, Y. Optimization of miscible CO2 water-alternating-gas injection in the Bakken formation. Energy Fuels 2014, 28, 6811–6819. [Google Scholar] [CrossRef]
- Gong, Y.; Gu, Y. Miscible CO2 simultaneous water-and-gas (CO2-SWAG) injection in the Bakken formation. Energy Fuels 2015, 29, 5655–5665. [Google Scholar] [CrossRef]
- Yin, M. CO2 Miscible Flooding Application and Screening Criteria; Missouri University of Science and Technology: Rolla, MO, USA, 2015. [Google Scholar]
- Wang, X.; Gong, Y. Oil recovery and permeability reduction of a tight sandstone reservoir in immiscible and miscible CO2 flooding processes. Ind. Eng. Chem. 2011, 50, 2388–2399. [Google Scholar] [CrossRef]
- Robertson, E.P. Oil recovery increases by low-salinity flooding: Minnelusa and Green river formations. In Proceedings of the SPE Annual Technical Conference and Exhibition, Tuscany, Italy, 20–22 September 2010. Paper SPE 132154. [Google Scholar]
Publisher’s Note: MDPI stays neutral with regard to jurisdictional claims in published maps and institutional affiliations. |
© 2020 by the authors. Licensee MDPI, Basel, Switzerland. This article is an open access article distributed under the terms and conditions of the Creative Commons Attribution (CC BY) license (http://creativecommons.org/licenses/by/4.0/).