1. Introduction
In an industrial context, control room panels have evolved from LEDs and gauges to computer screens with windows, associated with custom layouts and computer graphics animations. More recently, electrical power substations have benefited from the virtual reality (VR) technology by exploring the potential of this advanced user interface to complement the usual single-line diagrams [
1]. Since power systems are critical, one may not always rely solely on the state reported by the supervisory control and data acquisition (SCADA) sensors.
Some failures need a quick visual inspection for better diagnostics. To safely allow the site to be unmanned, remote visual inspection, called Remote Inspection (RI) henceforth, becomes a valuable technique. Referring to the SCADA integration, it is possible to check the network’s reported state for a disconnect switch against the one inferred from the last image [
2,
3], acquired by an RI system.
However, traditionally, such inspection systems demand a high level of diffuse attention from the user, who needs to visualize and analyze images in multiple screens or windows. The operator can be “easily overwhelmed with the task of integrating these varied forms of data into a complete global view and understanding of a scene” [
4]. In this manner, one reasonable option to be considered is the integration of RI data with the SCADA user interface. To be aligned with the concept of cyber-physical systems (CPS), one of the main features of Industry 4.0 [
5], this integration can be done to the virtual environment associated with the factory [
6,
7]. Considering the case of power substations, a field image, as captured by a RI system, can be surrounded by a tridimensional model of the nearby “as-built” structure, providing more contextual information and extending its scope. The problem of inserting an image so that their objects match their counterparts in the virtual environment is known as 2D–3D spatial image registration [
8], and it is one of the key techniques for augmented virtuality (AV) systems [
9]. Recent research work has already suggested that this technique significantly improves operator situation-awareness, especially when the camera views are unintuitive or limited [
10]. Telemetry information can also be displayed along with the virtual environment.
While many studies on AV have been published, with fields ranging from surgery [
11,
12] to gaming [
13] and teleoperation [
10], so far, none of such AV systems is aware of SCADA states. Although these works mainly concern 2D–3D registration, the captured images could be processed to infer important data. In contrast, substation inspection systems, based on image processing techniques [
14], are still not integrated with their digital twins’ counterparts (virtual power substation virtual environments).
This work proposes and evaluates a novel way of integrating these technologies, combining VR with on-line images and SCADA data in a single solution. It allows VR applications to query the last known color or thermal images for a given set of regions of interest, providing 2D–3D registration for these images. We evaluate the particular case of disconnector switches’ images, which are processed by an existing state inference machine based on computer vision techniques [
15]. The inferred states are then compared against the ones reported by SCADA. Whenever there is a discrepancy between these states, the system teleports the VR camera and triggers an alarm. This allows for a quicker system reestablishment routines and failure diagnostics. Viewing the field state from inside the operations center improves safety and reduces costs: a local operator is no longer needed just to confirm whether the power disconnector has opened or closed after a teleoperation command. Effectively, for tele-assisted installations, unnecessary travel is reduced, implying quicker and cheaper reestablishment.
The main objective of this research is to improve power substations with RI by applying augmented virtuality techniques and to demonstrate that this approach is not only feasible but also viable. In this sense, the following specific objectives are enumerated:
to identify the barriers related to real-time 2D–3D registration for RI uses, considering a scenario with multiple image sources and multiple virtual environments to be augmented;
to describe the registration process in terms of mathematical manipulations and pose estimation algorithms;
to assess the quality of the registration according to some quantitative metrics, considering not only if the virtual camera’s pose matches exactly the image capture conditions but also some poses with small variations (different points of view); and
to provide an architecture capable of integrating field images with SCADA, so that states from these two sources can be checked continuously.
The remaining of this text is structured as follows.
Section 2 presents some recent work concerning RI for power substations and some other environments. Some systems featuring 2D–3D registration are presented as well.
Section 3 gives some background on the mathematical operations for camera pose estimation, along with the method used for the spatial registration. A method for defining the focal length scale factor is presented in
Section 4. The system architecture and its implementation’s usage are presented in
Section 5. The results are explained in
Section 6 and discussed in
Section 7, along with some conclusions.
2. Related Work
Augmented virtual environments have already been used in urban video monitoring applications [
4]. Hu et al. [
16] proposed the control of virtual humanoid models’ positions, according to real humans’ positions captured by video cameras, for outdoor environments. For representative purposes, sending only positions and orientations instead of full images is an interesting strategy, since it demands much fewer network resources, comparing to real-time video streaming. Nonetheless, visual inspection is often needed for better comprehension of the problems in the inspected area.
The 2D–3D registration techniques may also be applied in systems with multiple cameras. Wu et al. [
17] proposed a framework for the fusion of large-scale surveillance images with an associated virtual environment. The system combines, in the same view: (i) a mosaic with images captured by the surveillance cameras; (ii) an overall image sent by satellite equipment; and (iii) the corresponding tridimensional model.
When multiple cameras are installed in far remote locations, a guided tour in the monitored environment is particularly interesting to aid operation. Scene-graphs might be put in place for this situation [
18]. However, some faults need immediate attention, so waiting for the tour to complete a loop is not an option.
Another application for inserting physical reality information into virtual environments is proposed for the supervision of marine systems. The system deals with the problem of developing a SCADA VR-based interface that reduces sensory overload and “provides situation awareness while maintaining operator capabilities” [
19]. However, only a single remote environment is monitored and field images are not available for further visual inspection.
Concerning power tele-assisted substations, video monitoring systems with automatic image analysis are important inspection tools. Color images can be submitted to algorithms capable of detecting people [
20], fire [
21,
22], people climbing ladders in forbidden areas [
23], oil leakage in power transformers and unwanted objects left in their nearby [
24]. [
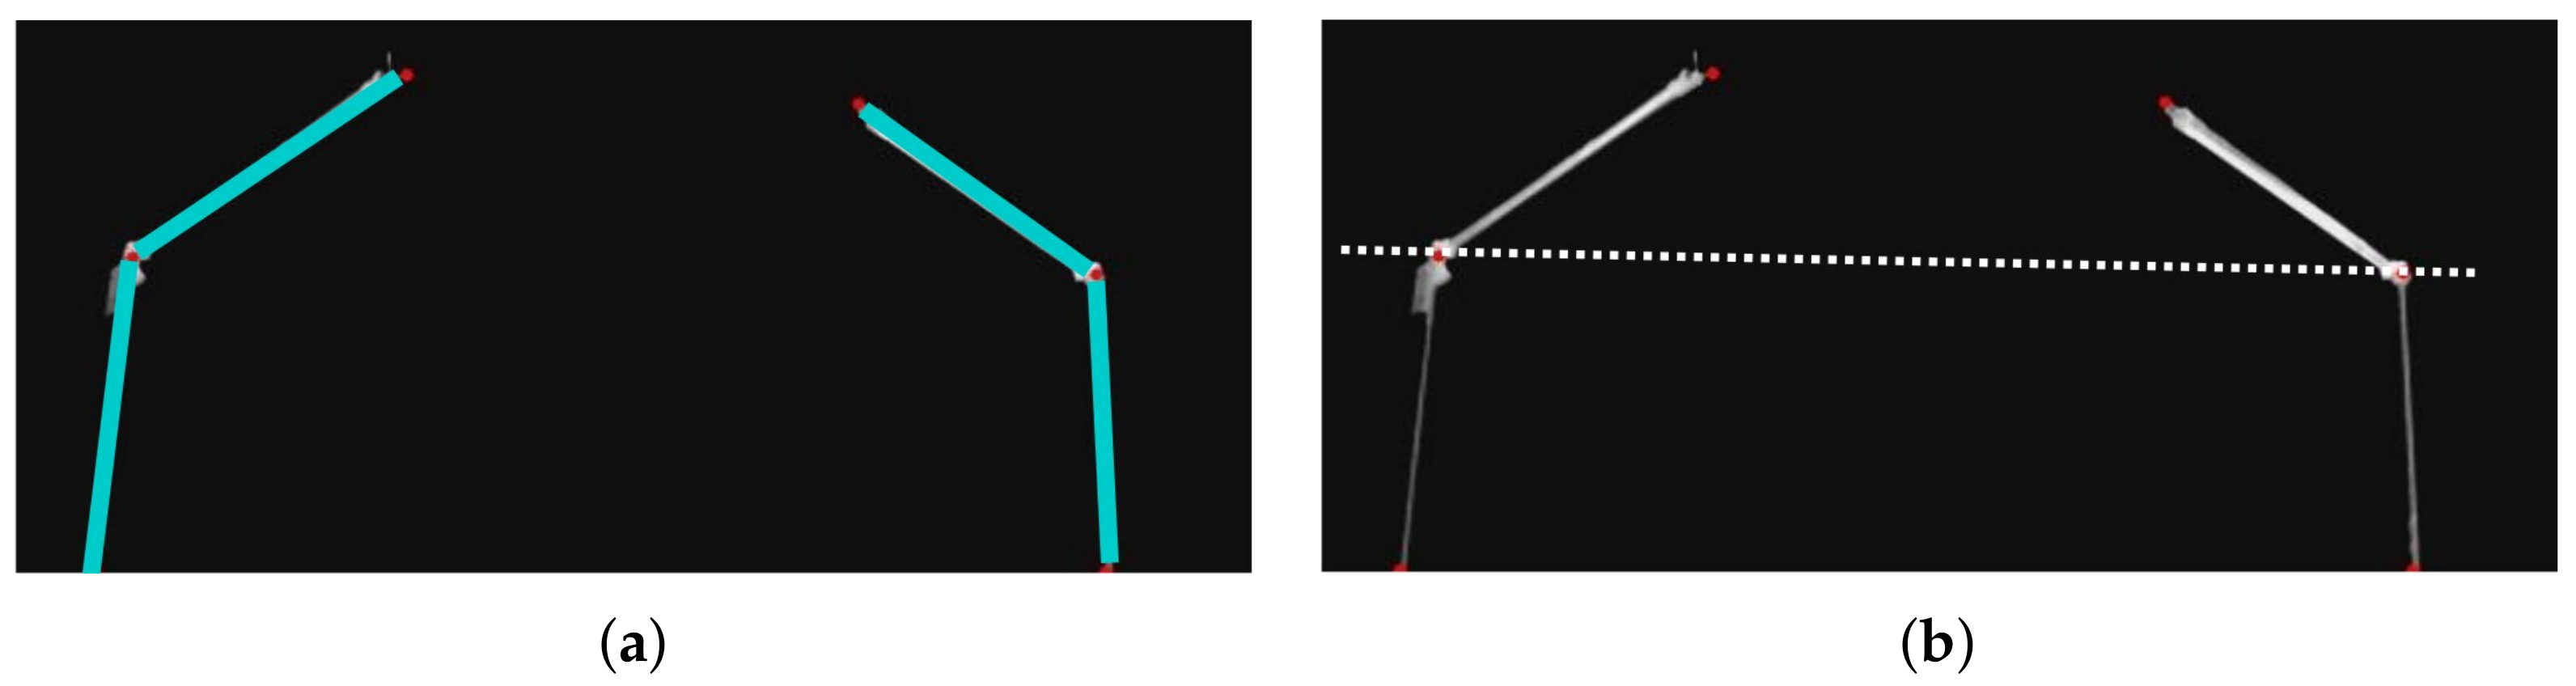
15] proposed a way of inferring disconnector switches states by processing their images. The method consists of: (i) extracting a region of interest, comprising the mobile parts of the device and the axes supporting them; (ii) applying a threshold, so that the background is removed; (iii) establishing line equations through linear regression; and (iv) checking the deflection angles to judge as either opened or closed (
Figure 1). The solution proposed in our work uses the images and the inferred states from their system.
Nevertheless, these systems lack 2D–3D registration for context-aware interpretation, as well as SCADA integration for the detection of telemetry errors.
One common strategy for the detection of irregularities is the foreground–background segmentation. Image segmentation is the computer vision process in which an image is “broken into some non-overlapped meaningful regions” [
25]. In particular, the foreground–background segmentation is, for videos, the separation of what is moving from what is static [
26], whereas, for images, the system queries a historical image database to define what is considered to be the image background [
24]. This technique can be used to detect motion near a device or to detect objects that, according to historical data, should not be there. Some researchers even suggest the adoption of actions such as deactivating remote control in an area whenever an object motion is detected there [
27] (p. 64).
Thermal images are equally important, since “the thermal effect of power devices is one of the major reasons leading to faults” [
28]. Drones with thermal cameras have already been deployed to scan faults in substations, storing pictures of insulators, which are later processed for failure diagnostics [
14]. In addition to all security issues related to drones in substations, this approach has the same limitations considering SCADA integration and situation awareness.
Alternatively, field images can be augmented with thermal sensor data [
29]. However, since telemetry data are error-prone, in this case, the inspection will be restricted to failures visible in the captured color images. It should be noted that, even with this limitation, the proposed system is integrated to SCADA data with video monitoring. Augmented reality can also be used by field operators to better visualize contextual SCADA data [
30], although the scope of this work is the opposite integration: having more field information in the operations centers.
Equipment inspection can also be realized by inspector robots [
31]. Considerably more complex, these systems combine: (i) the needed advanced techniques for the design of autonomous robots, such as route planning, collision detection, battery management, environment mapping and information fusion; (ii) machine learning; and (iii) failure detection employing computer vision routines.
Finally, when dealing with cameras equipped with pan–tilt–zoom (PTZ) control, a common scenario is to capture multiple views, multiplexed in time, so that more than one asset can be surveilled. This approach suffers from a limitation: servomotors’ motion, periodically changing their setpoints to allow different poses, generate cumulative errors that must be constantly compensated. Online camera calibration has been already evaluated for substation video monitoring [
32].
Nevertheless, none of these works provides, at the same time: (i) support for multiple installations and cameras, including both thermal and color images; (ii) integration with SCADA; and (iii) optimal spatial registration without the need of in loco camera calibration. Calibrating many remote cameras by taking pictures of the checkerboard pattern from many angles [
33] would be impractical to the operations center. Although requiring all sites to use the same camera device (or just a few models) could be an alternative, this would make the system too restrictive in terms of compatibility. Therefore, optimizing and inferring intrinsic parameters solely from the inspection images is an important feature for this kind of application. Besides, a SCADA integration, combined with the spatial registration, can significantly improve the user interface for RI systems, speeding up the visualization and contextualization of the faults inferred from the image processing routines cited above.
3. 2D–3D Spatial Registration Formulation
This section discusses the problem of inserting images acquired from field cameras into the associated virtual environments. An important requirement is to match some objects or points in the image with their correspondences in the tridimensional model. If neither the real nor the virtual camera has significant distortion and skew, one possible method for this kind of spatial registration is to estimate the camera pose, considering the field camera’s image and the intrinsic parameters of the virtual camera. This can be done by iterative and analytical methods. The overall registration quality directly affects the operator’s interpretation speed and is tightly related to the accuracy of the estimated pose, thus making this estimation crucial for RI. In addition, the large-scale scenario with multiple remote environments and cameras imposes additional constraints, needing fast spatial registration, not to compromise real-time rendering.
In this section, all vectors are column vectors and thus are transposed when displayed inline in the text.
3.1. Coordinate Systems
The perspective transformation and the spatial registration provide mappings between the image space and world space. The former relates to pixels coordinates, whereas the latter is defined based on a global Cartesian coordinate system [
34] (p. 77).
The following coordinate systems are used in this text.
Image homogeneous coordinate system (ICS):
In this coordinate system, a point
, with
, refers to a pixel in the image, located at
The vectorial function
is used in this text to denote homogeneous coordinates normalization (1):
World coordinate system (WCS):
The world positions are described with a standard right-handed (counter-clockwise) coordinate system, with the z-axis in the vertical direction.
Game engine’s coordinate system (GCS):
The software package used for composing the substation scene, namely Unity 3D [
35], has a left-handed (clockwise) coordinate system with the
y-axis in the vertical direction. Therefore, all results expressed in WCS must still be transformed to the engine’s coordinate system.
3.2. Perspective Projection Transformation
The perspective projection is a particular kind of linear transformation, capable of mapping points from world space to their correspondents in image space. Let be a point defined in world space and be the homogeneous coordinates of the pixel that is the result of the perspective projection of P in the image plane.
Considering the finite projective camera model [
36] (pp. 154–157), this transformation can be stated as:
where
is the
matrix of the camera intrinsic parameters, explained below and
is the
joint rotation–translation matrix divided up into the 3 × 3 rotation matrix
plus the translation vector
.
The camera matrix
is given by:
where
are the focal lengths,
is the skew coefficient between the
x and the
y axis and
is the optical center (principal point).
Some simplifications might be applied to special cases [
36] (pp. 154–157). If pixels are squares, we can consider
. If there is no skew effect, then
. Besides, if the origin of the image coordinate system is located precisely at the image center, then
.
3.3. Camera Pose Estimation
Let be the set of image pixels and be the set of world space points. We are interested in a set of n points in the image, , and n points in world space, , such that for each i there is a unique correspondence . Stated another way, suppose we have both image homogeneous coordinates (ICS) and their related world space coordinates (WCS) for some keypoints.
The problem of estimating the joint rotation–translation matrix,
, from the keypoints and the camera’s intrinsic parameters
is called Perspective-n-Point [
37]. This is particularly useful for establishing mappings
and
, that is, not only for the keypoints, but also for all other resulting image pixels.
Equation (2) can be reorganized splitting the joint rotation-translation matrix,
, and adjusting the matrices dimensions:
Once the pose is estimated, Equation (4) can be used to evaluate the homogeneous coordinates of the image pixel, given the coordinates of the point in world space.
The pose estimation is especially interesting for augmented and mixed reality applications since it allows the computation of a virtual object’s pose in the image coordinate system.
However, even if the intrinsic parameters are unknown, they can still assume values, due to some further simplifications, as explained in
Section 3.2, treating the camera as if it were almost ideal. In such a scenario, distortions are ignored. The principal point is defined in the image center and the focal length elements on the camera matrix assume the same value, proportional to one of the image dimensions.
César et al. [
38] compared several Perspective-n-Point (PNP) algorithms, revealing the techniques known as Efficient Perspective-n-Point Camera Pose Estimation (EPnP) [
39] and Pose from Orthography and Scaling with Iterations (POSIT) [
40] as the most robust. Both methods require the coordinates of four or more non-coplanar keypoints in the virtual world space and their corresponding coordinates in the image. The EPnP brings a non-iterative solution, of complexity O(
n), from the evaluation of a weighted sum of eigenvectors of a 12 × 12 matrix and the solution of a constant number of quadratic equations to adjust the weights. In contrast, the POSIT technique first estimates the object’s pose by solving a linear system. After this first estimation, the algorithm enters a loop where the parameters from a previous iteration are used to re-calculate the keypoints projections, which will be used instead of the original ones to repeat the pose estimation, resulting in a, presumably, more accurate result. Recently, a new method for obtaining these camera parameters without having points’ correspondences has been proposed [
41]. The system described in this paper uses the iterative PNP solver offered by the OpenCV library [
42].
3.4. Rectangular Region and Virtual Camera Parameters
Section 3.3 described the problem of estimating the camera pose, allowing the retrieval of the complete transformation from world space to image space. Stated another way, the method enables the mapping
. The inverse problem, i.e., going from the image space to the world space, is used for augmented virtuality systems and can be done analytically, once the camera pose is estimated, as shown in this section. It should be noted that more than one camera model can fulfill this mapping by different poses, depending on the focal length elements in (3). It is desired, however, to set the image as a texture for a rectangular region overlaid in the virtual environment and to teleport the virtual camera to a pose that is compatible with the VR camera intrinsic parameters, so that the photo and its surrounding virtual environment match optimally.
Let
represent a point
in WCS and
represent a point
in ICS. It is straightforward manipulate (4) to isolate the
:
Finally, let
be defined in ICS to represent the same pixel as
, such that:
Then, the right-hand side can be reorganized in the following two terms:
Since the scalar
is not bound to any specific value, the solution set corresponds to a line
ℓ, in its parametric form:
Indeed, many points in world space may result in the same projection .
Image Overlay
The action of overlaying a photo into a virtual environment, for Augmented Virtuality applications, requires determining the pose (position and orientation) of the rectangular region that will display the image in the virtual environment.
Let be an image of size dots and be the rectangular region of size in world units. Considering that the virtual environment has high geometrical fidelity, we must first assert that the target rectangular region dimensions match the image storage aspect ratio, that is, .
Now, from the set of all possible lines extracted from (8), by setting values for
in (7), let us consider
,
,
,
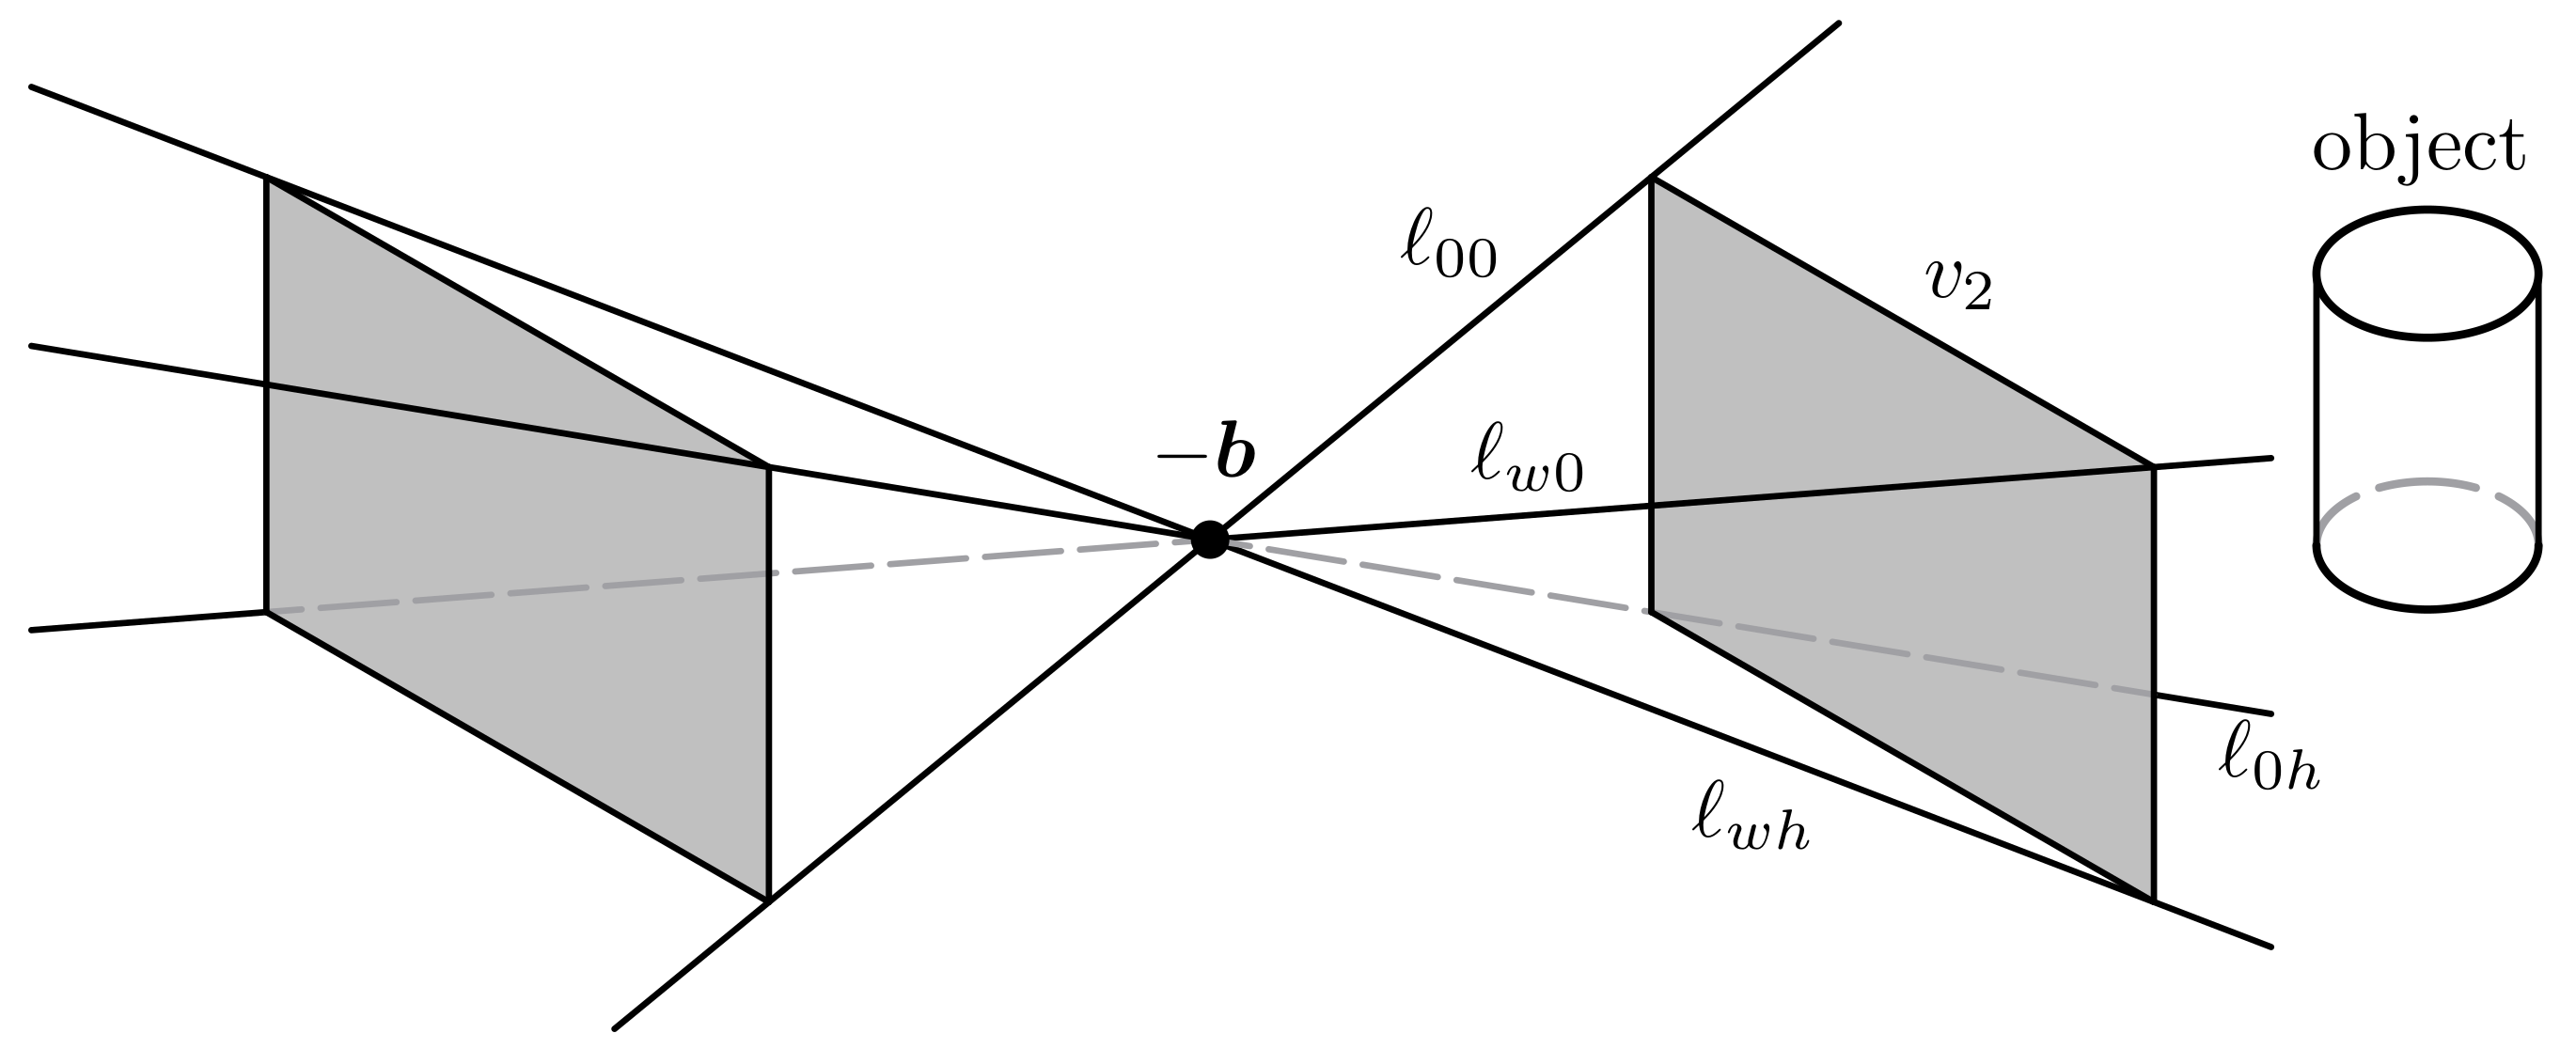
, obtained by using the image vertices. Finally, let
be the line obtained by using the image center point. All these lines, as well as all other lines obtained by (5) intercept at
, which corresponds to the estimated position of the camera (
Figure 2). Indeed, a quick inspection on (7) reveals that the term
is equal to
, thus it does not depend on the image point
Q.
The result is a right bipyramid with a rectangular base and the apex vertex located at . The relevant pyramid, associated with the camera’s viewing frustum, is the one that contains . Note that this pyramid’s base should have the smallest distance to the virtual object. The other pyramid’s direction is opposite to the camera and thus is ignored by the solution.
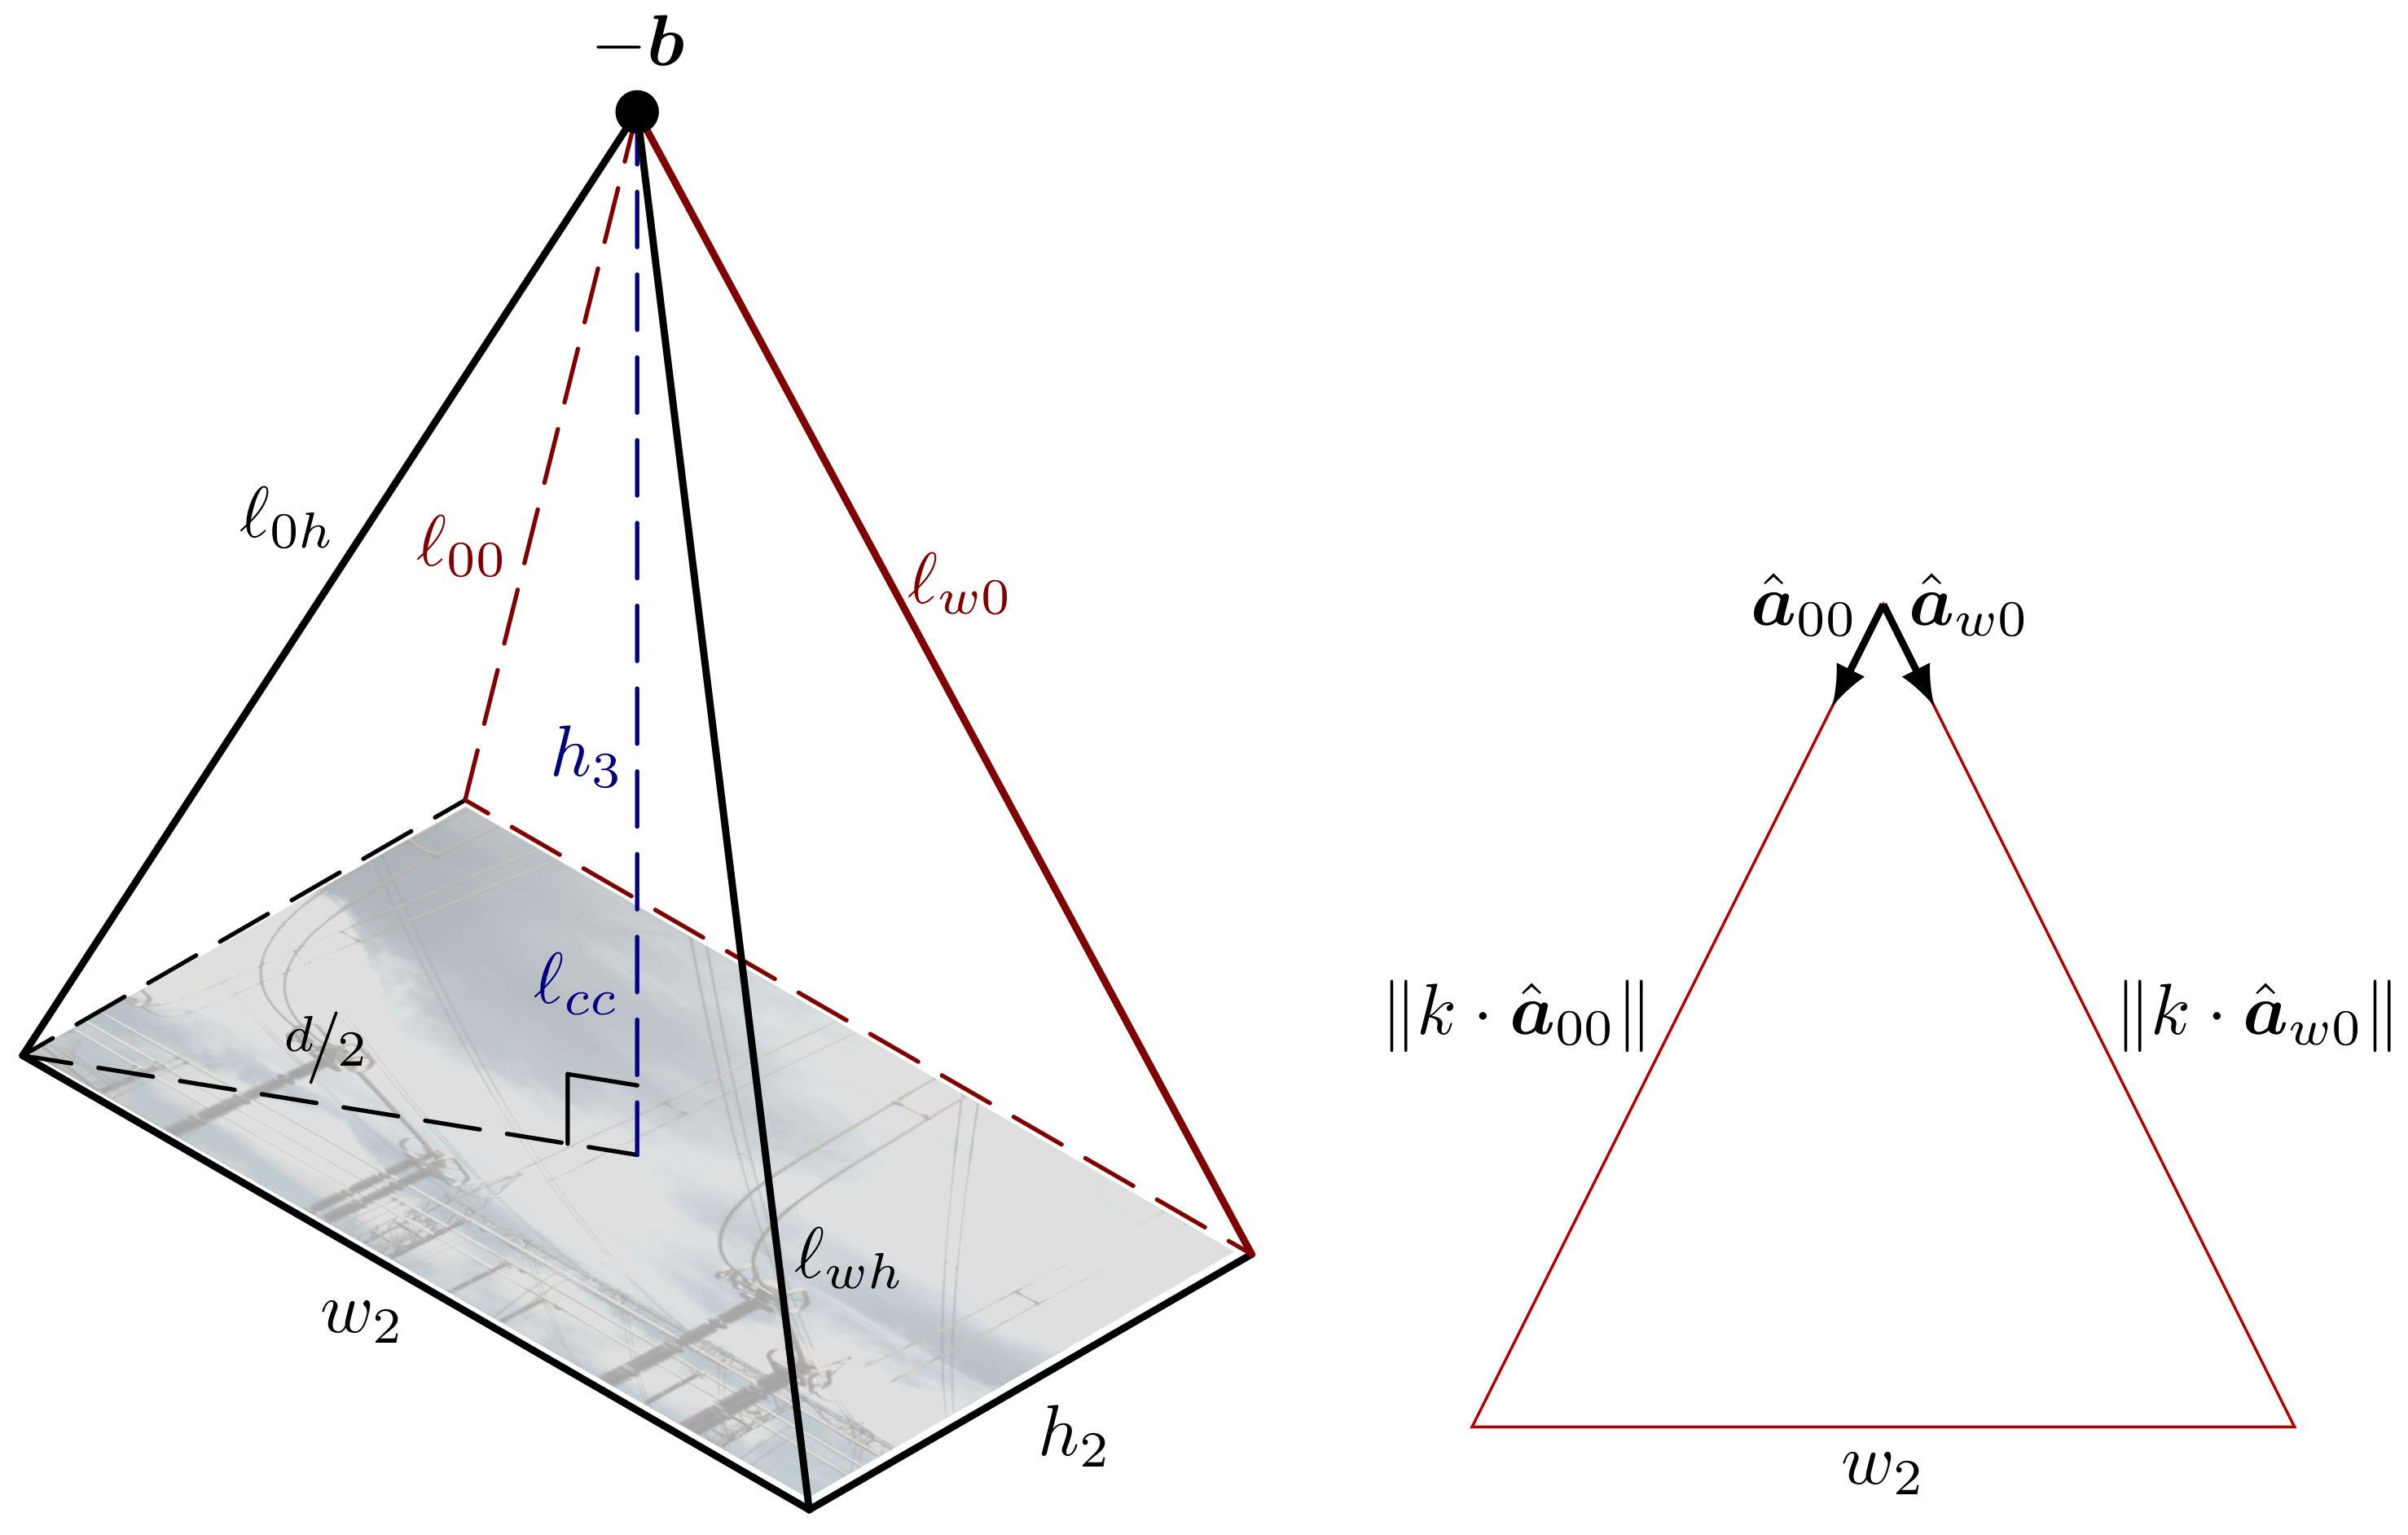
From the known variables and expressions, it is possible to determine the pyramid’s height
, as shown in
Figure 3.
Let
denote a line extracted from (8), by using some image point
Q specified as the position vector
in (7). In addition, let
be the direction vector for line
and
be the unit vector obtained from
. The coordinates of
are also known, from any line
. The target rectangular region dimensions,
and
, are also specified. Finally, the pyramid lateral faces are isosceles triangles. It is easy to determine the value of the scalar
k (9).
Since the diagonal
d of the rectangular base is given by
, the pyramid’s height
can be equally obtained with the Pythagorean theorem:
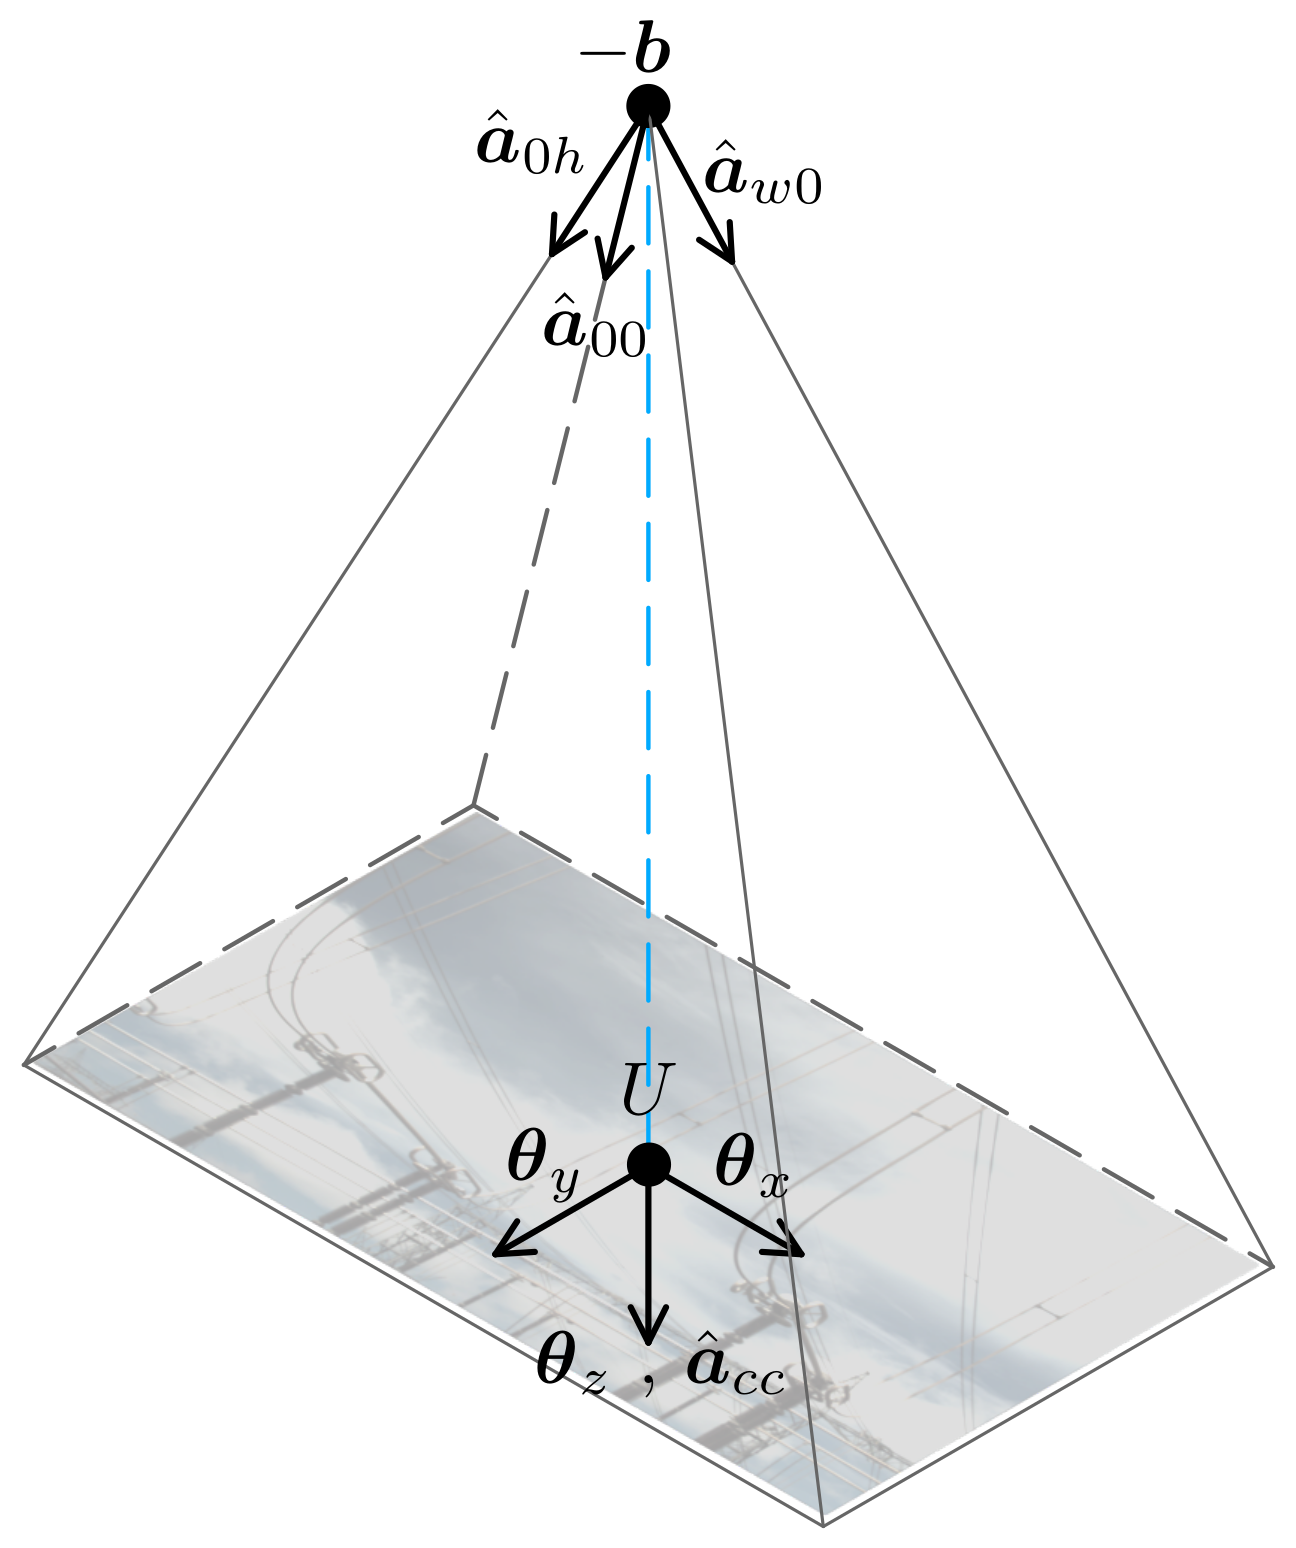
Then, it is possible to determine the
parameters needed to put it exactly in the pose that the photo was captured, namely the position vector
(referring to the point
U) and the coordinate axes
,
and
(
Figure 4).
The direction vector of
is normal to the plane that contains
and parallel to the pyramid axis, defining the direction
. The other directions can be easily calculated using the unit vectors from the edges. The following equations show all four parameters:
It should be noted that the unit vectors , and are, in fact, the rows from the estimated matrix. Indeed, the plane containing the rectangular region and the estimated camera have the same orientation.
That way, the pose of is determined so that the virtual environment can represent the conditions in which the image was taken. The virtual environment camera is positioned at and oriented according to the matrix. Besides eventual distortions and other non-ideal parameters, the real camera is likely to have a different field-of-view (FoV) from the virtual camera. Hence, the camera matrix is an important source of registration errors. Combined with the Perspective-n-Point solver errors, this can lead to bad quality results. These errors can be reduced by either calibrating the camera or applying some optimization algorithms. The latter approach is discussed in the next section.
4. Focal Length Scale Autoset Method
The RI cameras used in this work have either no mobility or fixed position presets, which is why the keypoints’ coordinates are static.
A good consequence of this constraint is that there is no need for running the Perspective-n-Point algorithm for every new image acquired. Once the VR environment knows the parameters for well positioning the overlay image and the virtual camera, the real-time operation consists only of fetching the new images and updating the overlay (a texture).
Taking into account the difficulties of having and maintaining intrinsic parameters calibration for each remote camera of the system, it is reasonable to consider methods that do not require such procedures.
Thus, an iterative method for discovering the optimal focal length was applied. Once good results are achieved, the parameters’ values are stored in a database.
The values for and are obtained by multiplying the image height, , by some scale factor , mapping from pixels to meters. The algorithm’s goal is to find the optimal value for inside a numeric range.
Our method uses a mean distance metric for the objective function (to be minimized) and a ternary-search variant.
Let us recall the symbols used in
Section 3.2 and
Section 3.3, considering a set of keypoints coordinates defined in the image,
and in the world
, such that
. Using the homogeneous coordinates normalization function (
1), the mean Euclidean distance can be formally stated as:
where
n is the number of keypoints,
is a vector with key point coordinates in the image coordinate system and
is the result of the perspective projection of the point located at
in the overlay rectangular region, considering the camera pose obtained with
.
The goal of Algorithm 1 is to find the optimal
, such that
is minimum:
| Algorithm 1 Ternary-search focal length scale factor optimization |
| 1: procedure FindOptimalF() |
| 2: , |
| 3: while or iterations limit reached do |
| 4: |
| 5: |
| 6: |
| 7: |
| 8: if then |
| 9: |
| 10: else |
| 11: |
| 12: end if |
| 13: end while |
| 14: if then |
| 15: return |
| 16: else |
| 17: return |
| 18: end if |
| 19: end procedure |
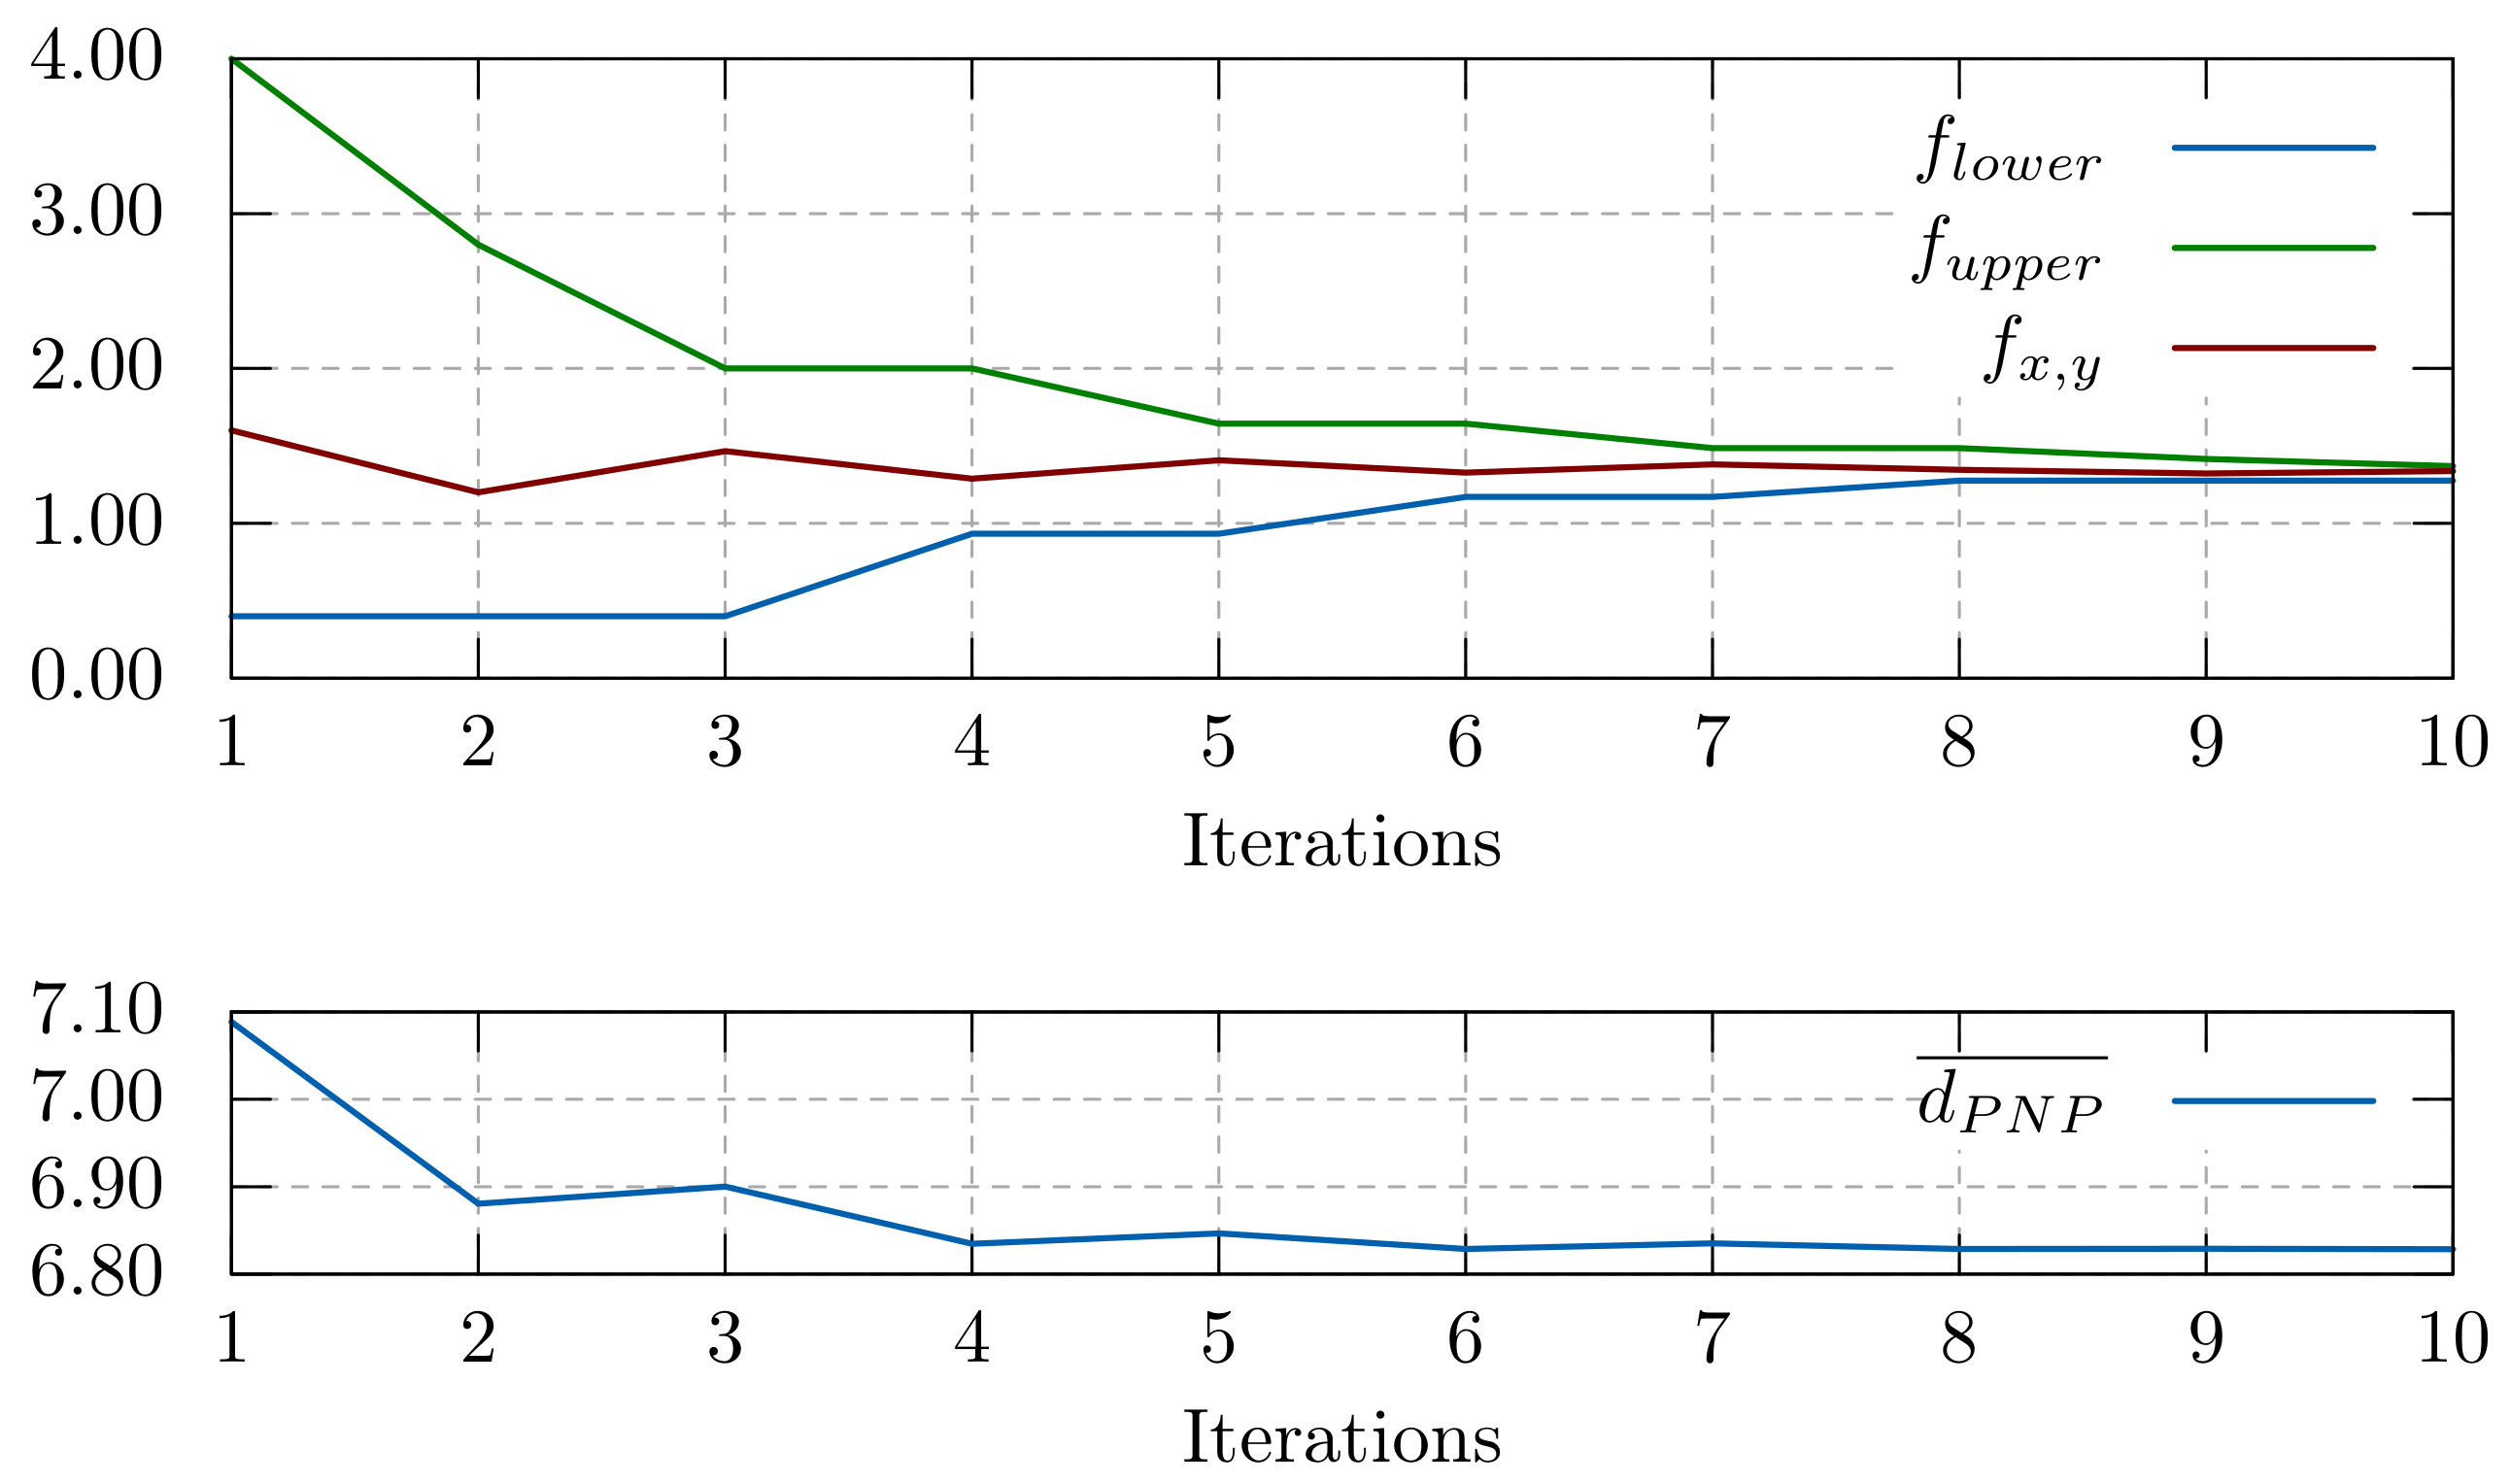
In each iteration, the search range is subdivided into four uniformly spaced values , and then the metric is evaluated in the intermediate points and , giving conditions to narrow the search range to either or . The algorithm runs with a fixed number of iterations, as shown above, or until a considerably small error is found.
5. System Architecture and User Interface
This section describes the system overall architecture, the database model for the field images, and the user interface elements.
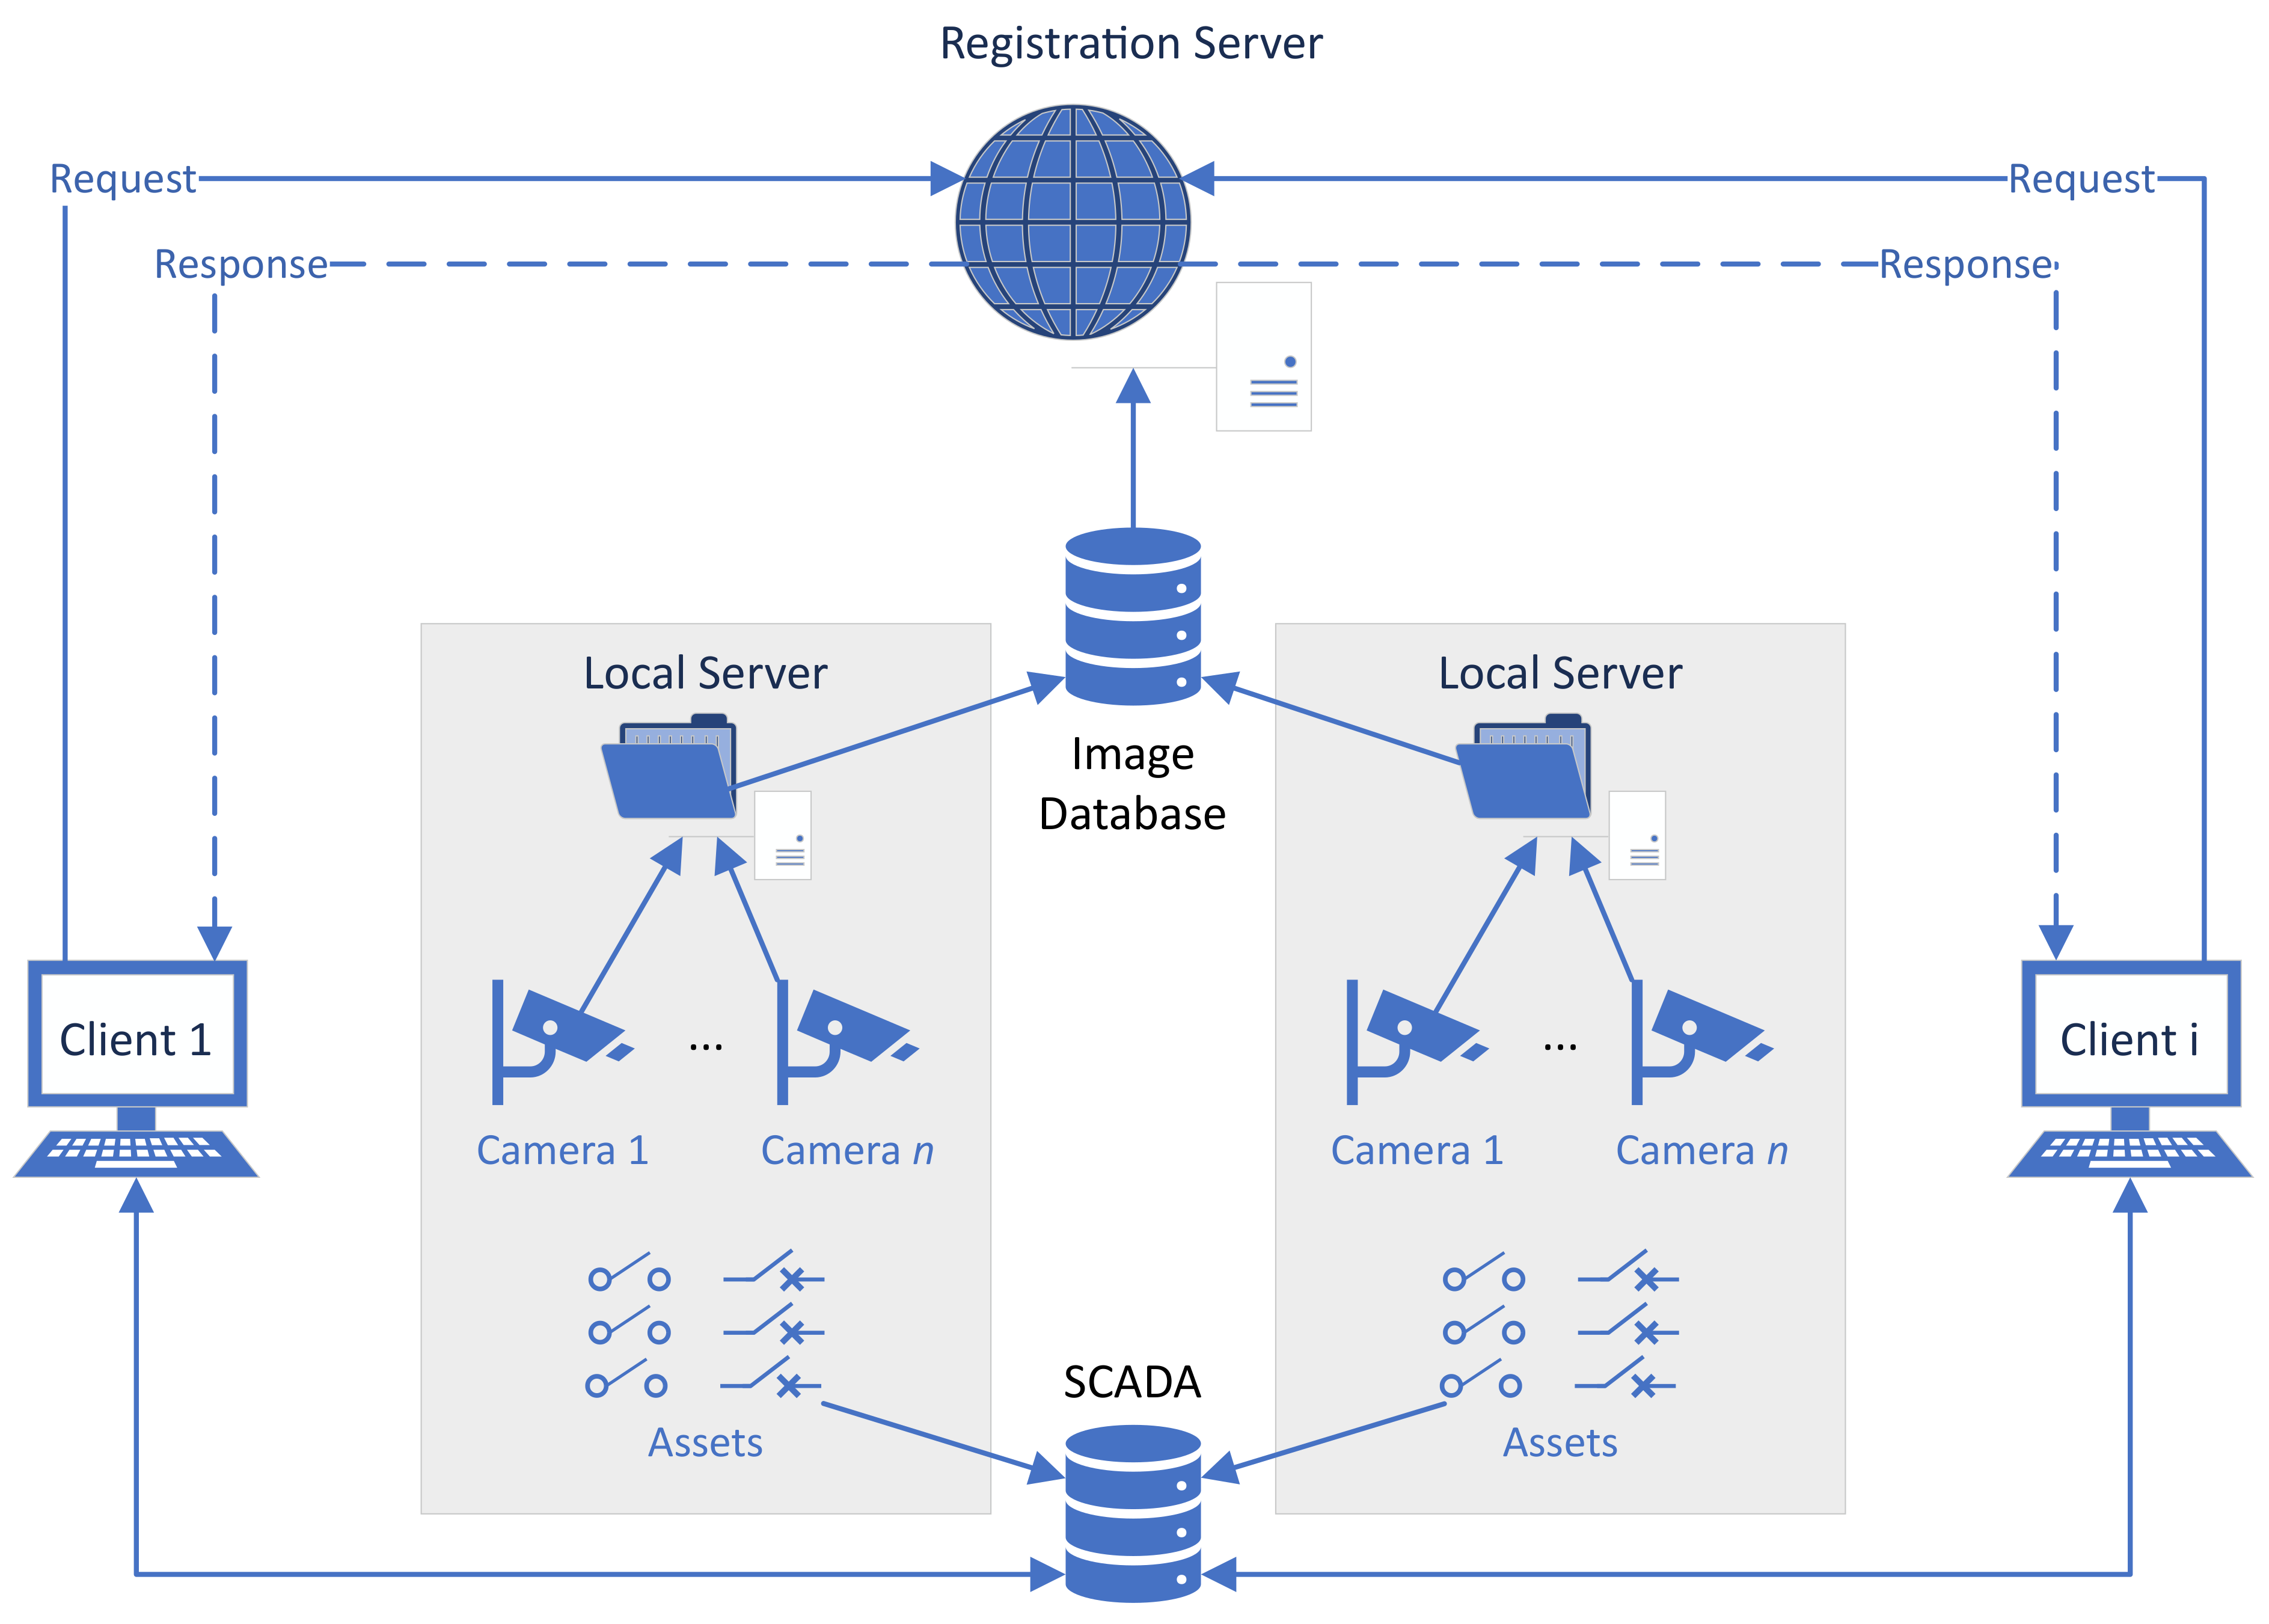
The solution deals with one or more substations with one or more cameras. Each camera is related to a single asset of interest (circuit breaker, power switch or transformer). The relation is one-to-many: although many cameras can be associated with the same asset, one single camera does not observe more than one asset. Each substation collects images and other sensory data, sending the former to an image database and the latter to the SCADA system. Both targets are located in a remote operations center. The remaining nodes of the system architecture are the registration server and clients. The registration server is used to handle 2D–3D registration requests, caching results to improve performance. The architecture is depicted in
Figure 5.
The registration web server was developed in Python 3, using the Flask micro-framework and the SQLAlchemy object-relational mapper (ORM) [
43]. The VR clients were made with the Unity 3D game engine [
35]. Finally, the image database was emulated with an SQLite [
44] file associated with a dataset of field photos.
5.1. Database Model
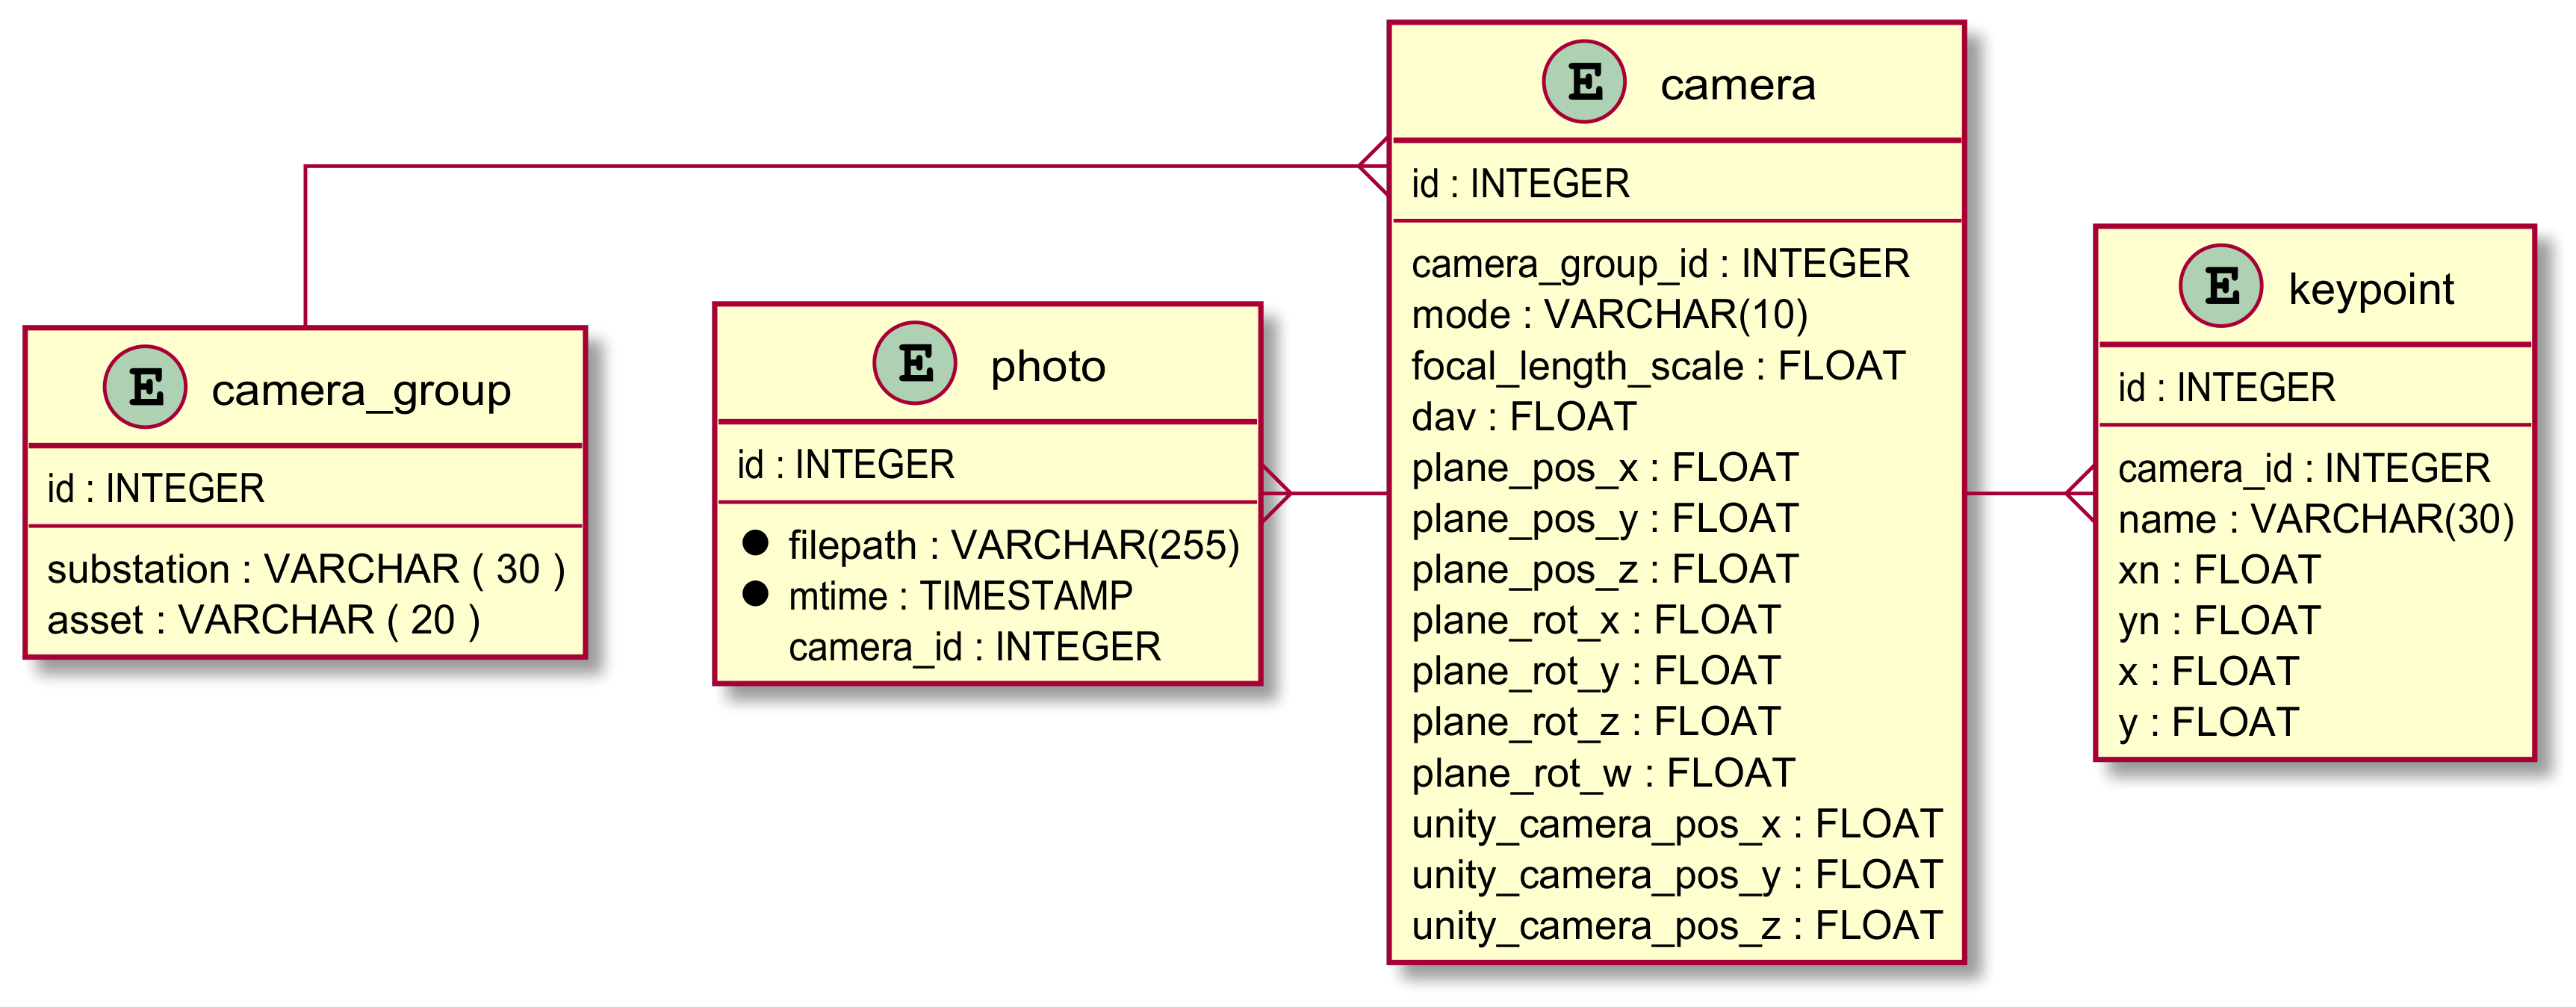
The augmented virtuality server stores data referring to the photos fetched from the image database and the 2D–3D registration metadata. A simplified data model is presented in
Figure 6.
Each substation has zero or more camera groups, which are sets of fixed-positioned cameras aimed at the monitoring of one asset. A single camera with different position presets, multiplexed in time, is treated as if it were multiple fixed cameras.
For each camera, a set of keypoints is defined. These are pixel coordinates
and normalized coordinates
of the points
from the mappings
explained in
Section 3.3.
Finally, the optimal intrinsic parameters and the results of the 2D–3D registration (pose and quality metric) are stored within the camera records. The plane rotation is stored as a quaternion , thus using four floating-point fields in the database. Considering fixed cameras, this means that the Perspective-n-Point problem does not need to be executed on each request, but only during the calibration process.
5.2. SCADA Integration
The SCADA database stores both analog values, such as the voltage in a transformer, and digital (i.e., “open” or “closed”) device states. The latter are used in our solution, specifically for the case of disconnector switches.
In this sense, the VR environment application makes HTTP requests to a middleware, periodically fetching a report with the digital states of all disconnector switches. For our RI goals, this telemetry data is combined with the on-line images, providing the automatic detection of discrepancies among these two sources. This is especially useful in cases where the switch is only partially opened, a condition not detected by standard telemetry instrumentation devices. Experiments with the system have been successfully done, where no action is taken if no error is detected. Otherwise, the system displays an alarm and gives the option to perform the 2D–3D registration, as shown in the next section.
5.3. User Interface Prototype
On startup, the VR client query the list of field cameras from the server. A red marker is added above the virtual instances of the monitored assets, indicating the initial state (no registration), as shown in
Figure 7.
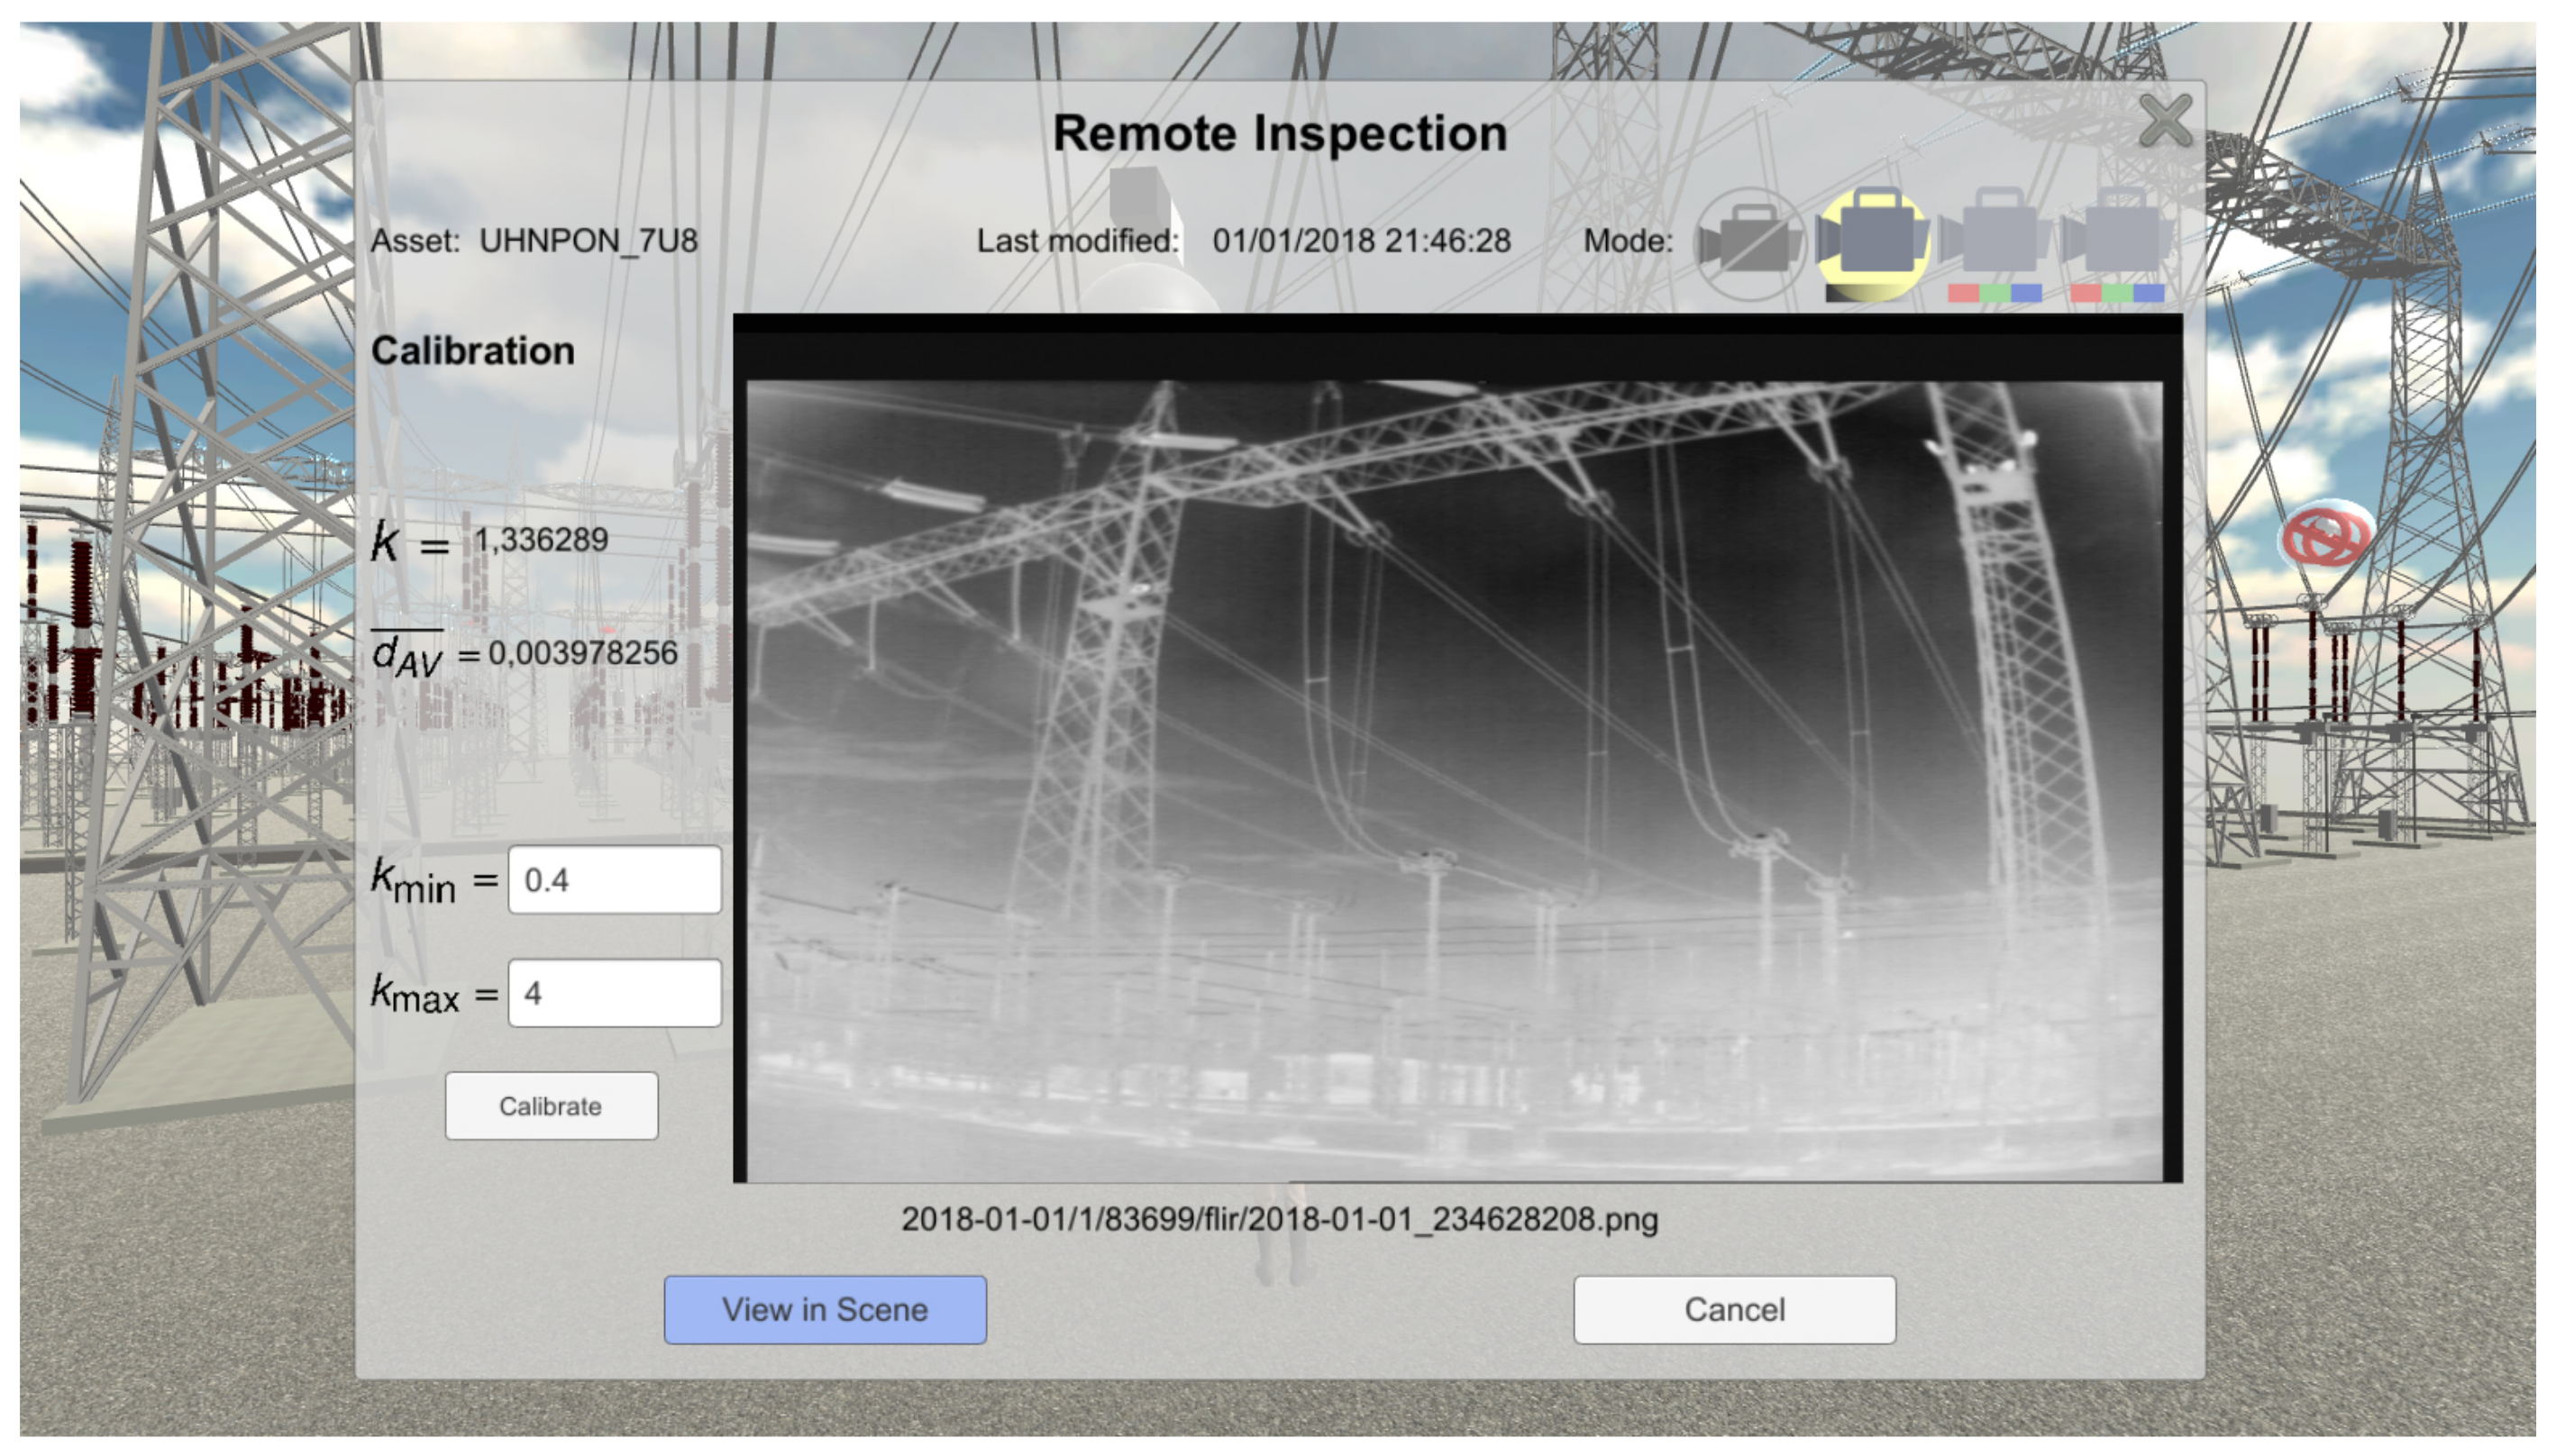
These markers are interactive, triggering a configuration dialog when clicked. The dialog (
Figure 8) allows the selection of the camera (or none), shows some metadata obtained from the server and acts as an entry point for the focal length autoset (described in
Section 4) and the 2D–3D registration.
The client evaluates the registration quality in real-time (as explained in
Section 6.1), disabling the overlay, whenever the error exceeds a threshold. In this scenario, the overlay is replaced by an icon indicating that condition. With this feature, navigation is not blocked in the augmented virtuality environment. Once the registration becomes poor, due to the high discrepancy between the virtual camera and the photo capture conditions, the overlay is simply disabled, avoiding misinterpretations from the operator.
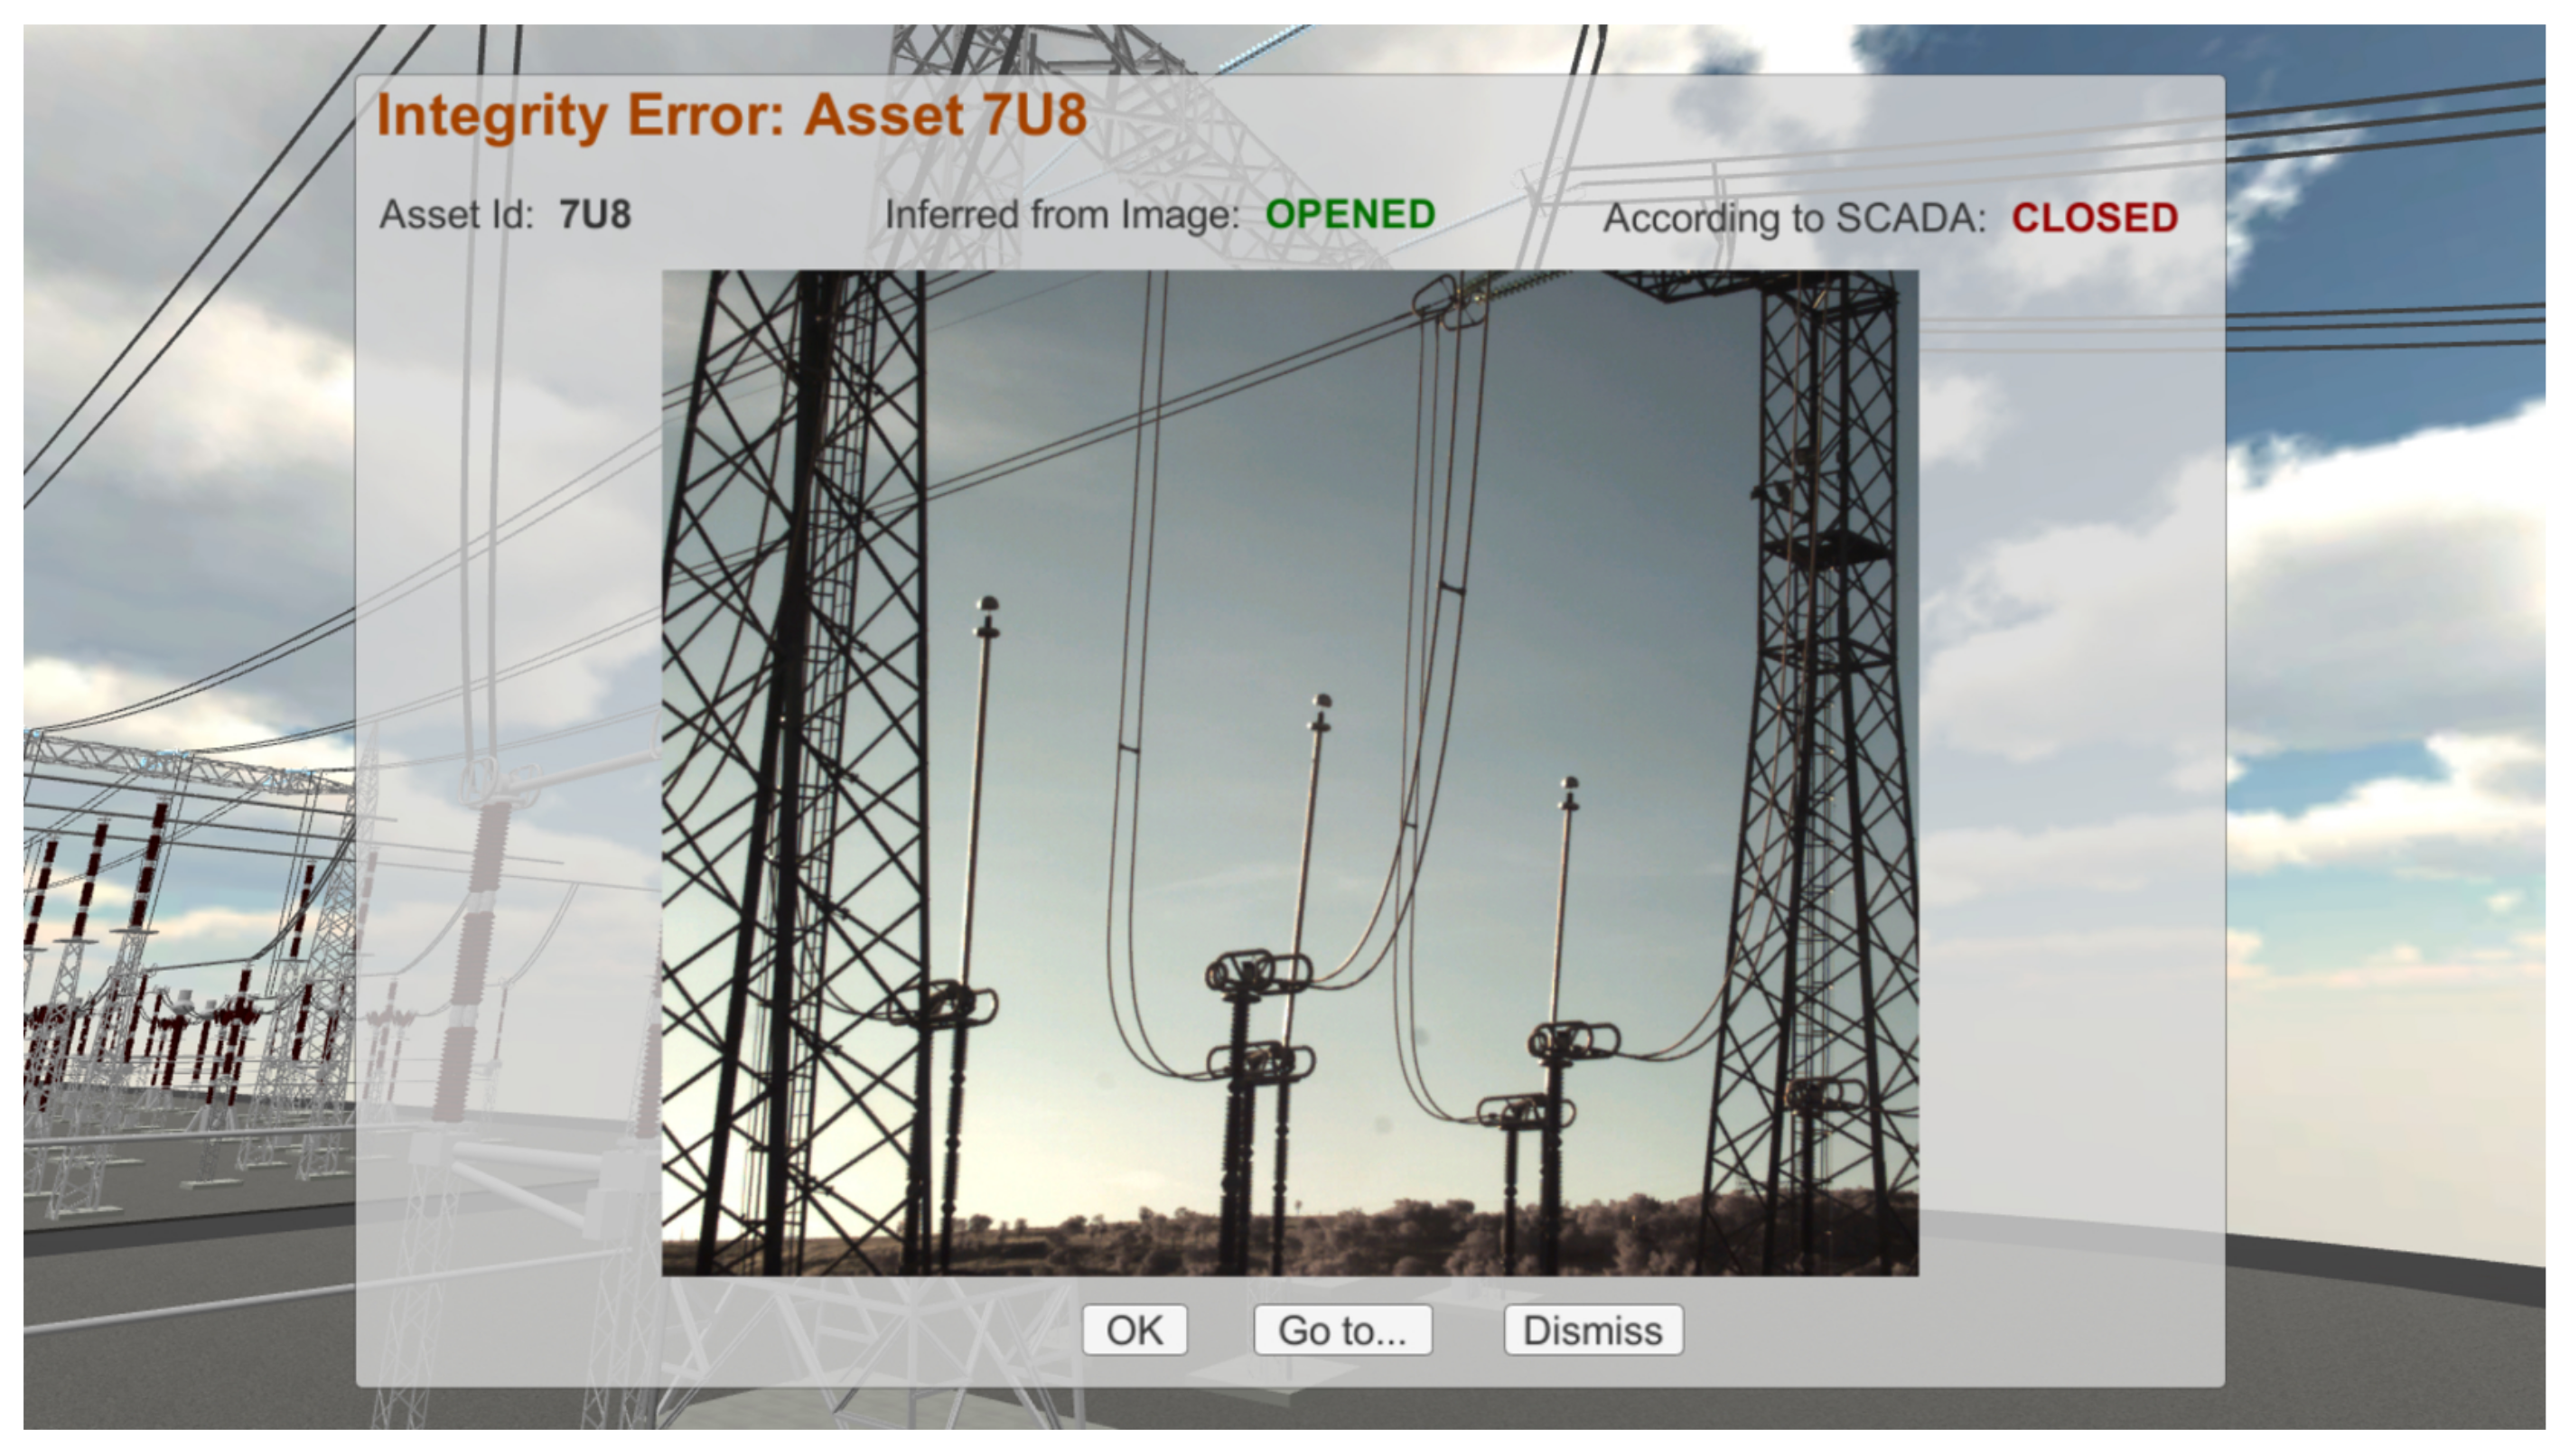
Finally, if the system detects a discrepancy between the state reported by the SCADA database and the state inferred from the image, an alarm dialog is presented to the user (
Figure 9).
The alarms can be either ignored (Dismiss button) or iconified (OK button). Alternatively, the dialog gives an option to teleport to the affected asset, for further inspection and contextualization. In this case, the environment’s viewport is changed so that the photo is overlaid in the 3D model, leaving some space on the screen edges to see the surroundings, using the camera parameters stored in the database.
Multiple incoming alarms can be iconified, resulting in alarm queues for each inspected device. To avoid duplicates, the condition responsible for triggering each alarm is used for determining the alarm’s lifecycle and identify. When this condition is no longer present, the system knows that a new, similar, discrepancy is supposed to result in a new alarm dialog.
6. Experimental Evaluation
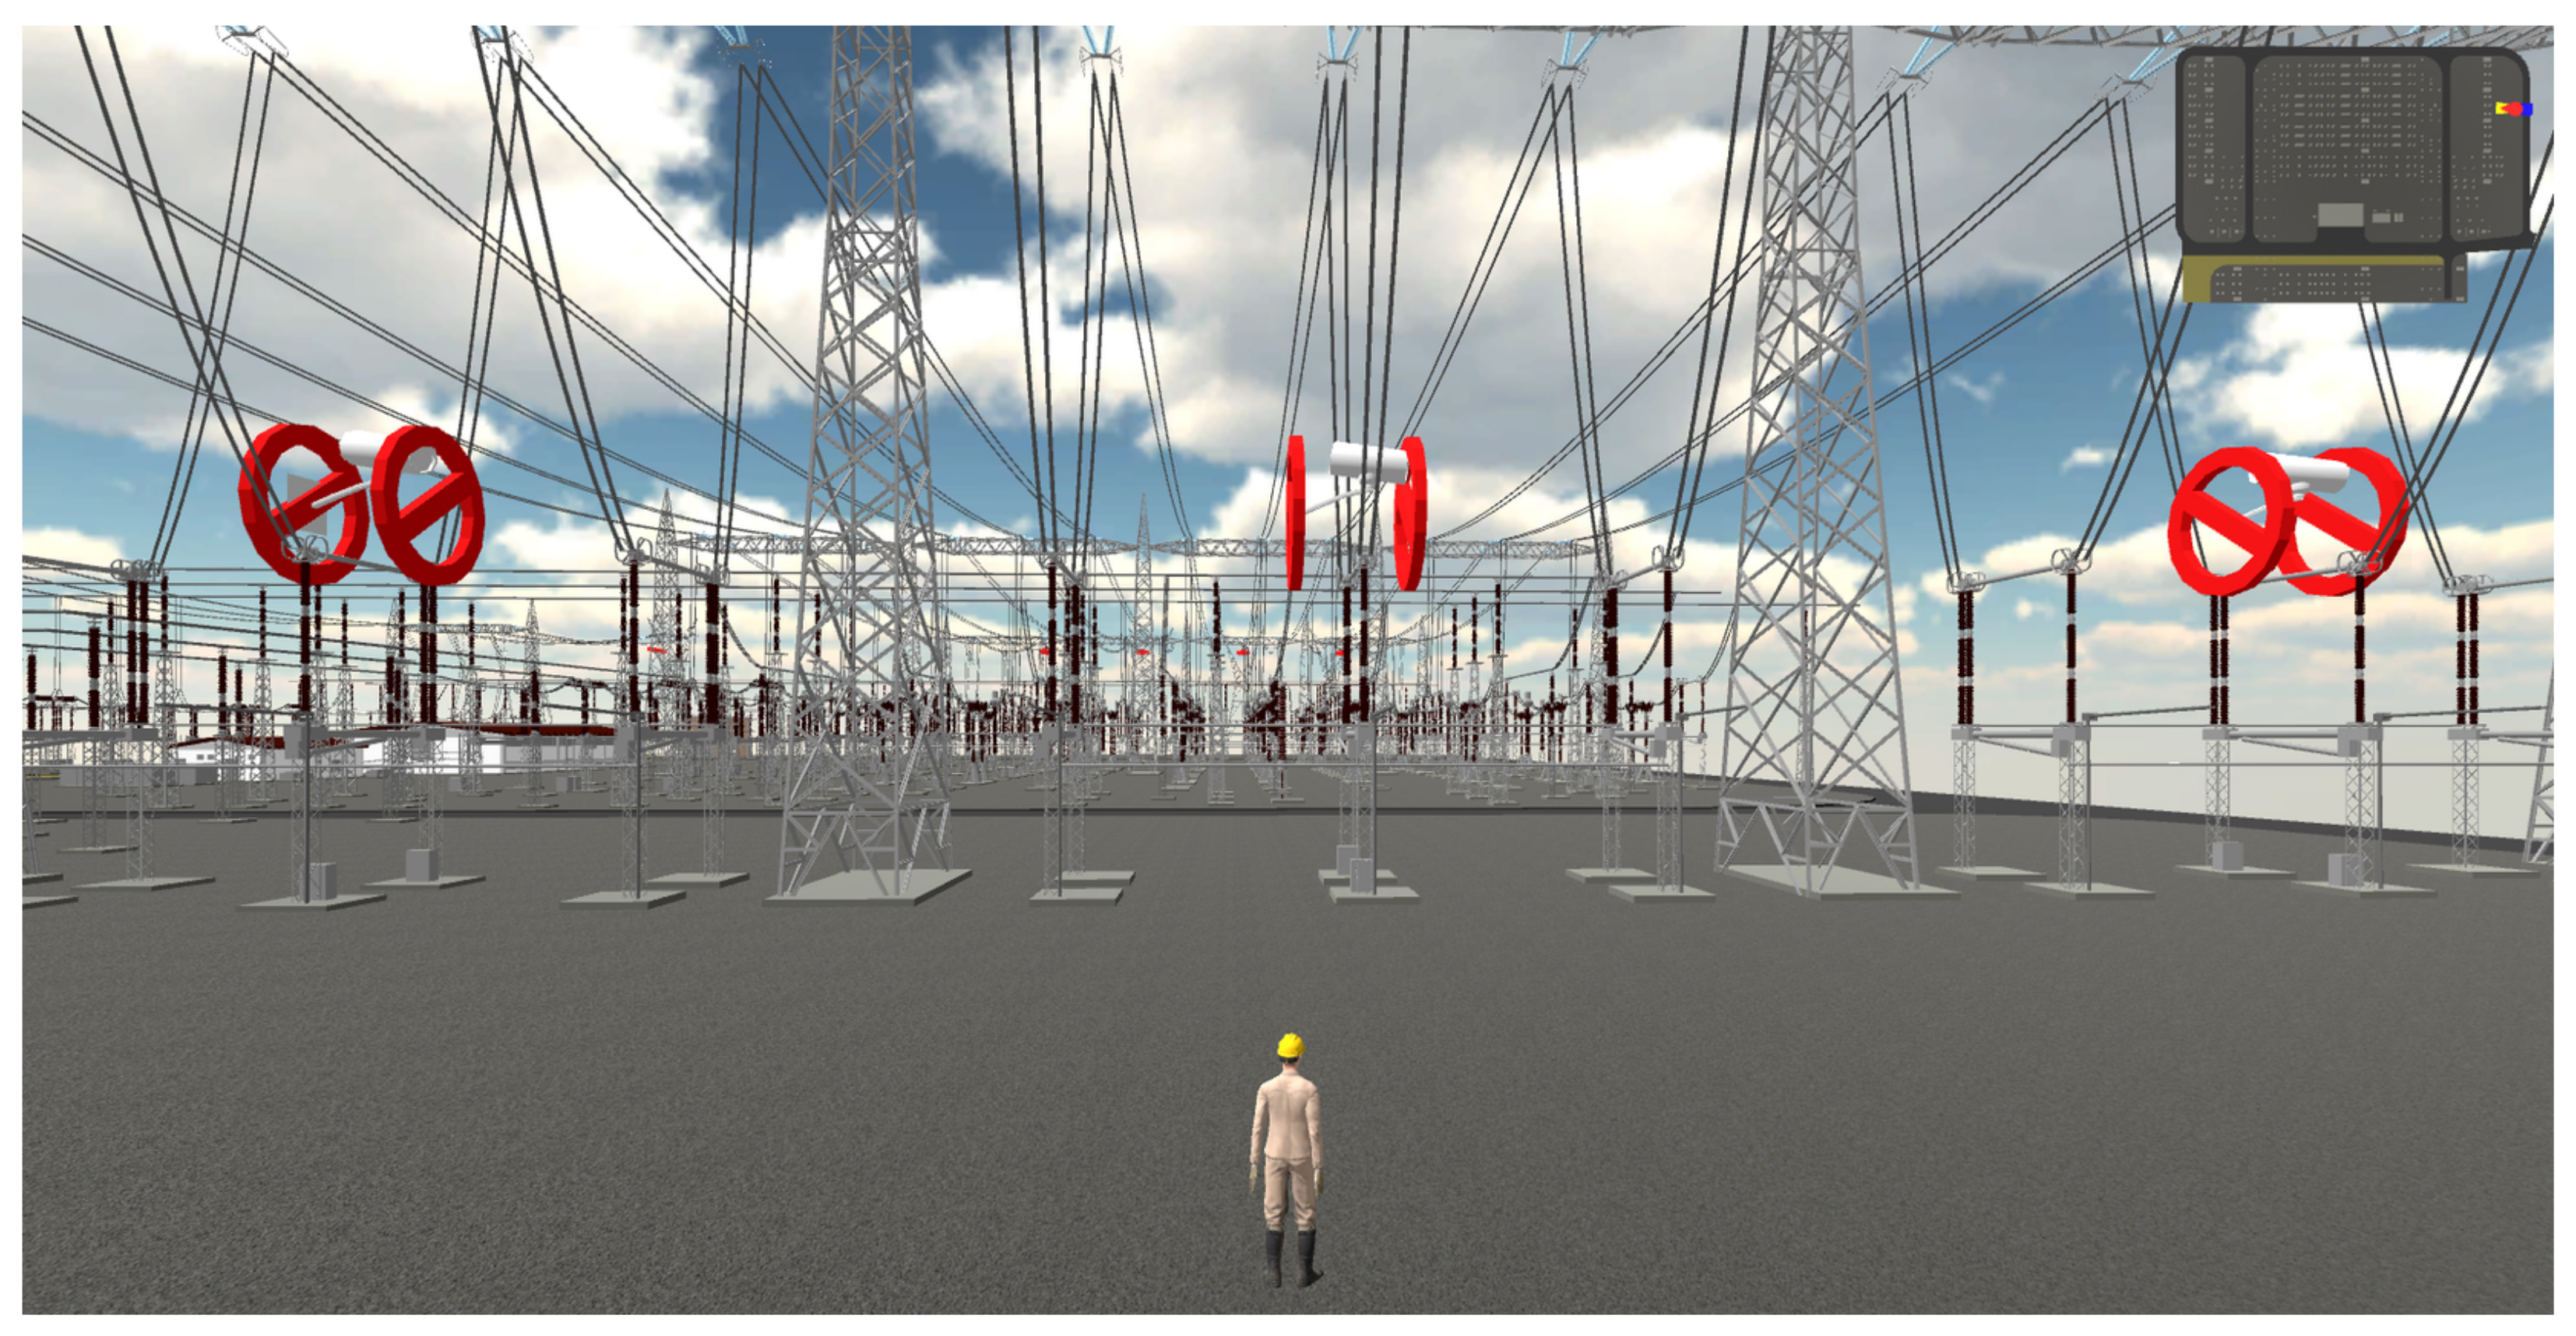
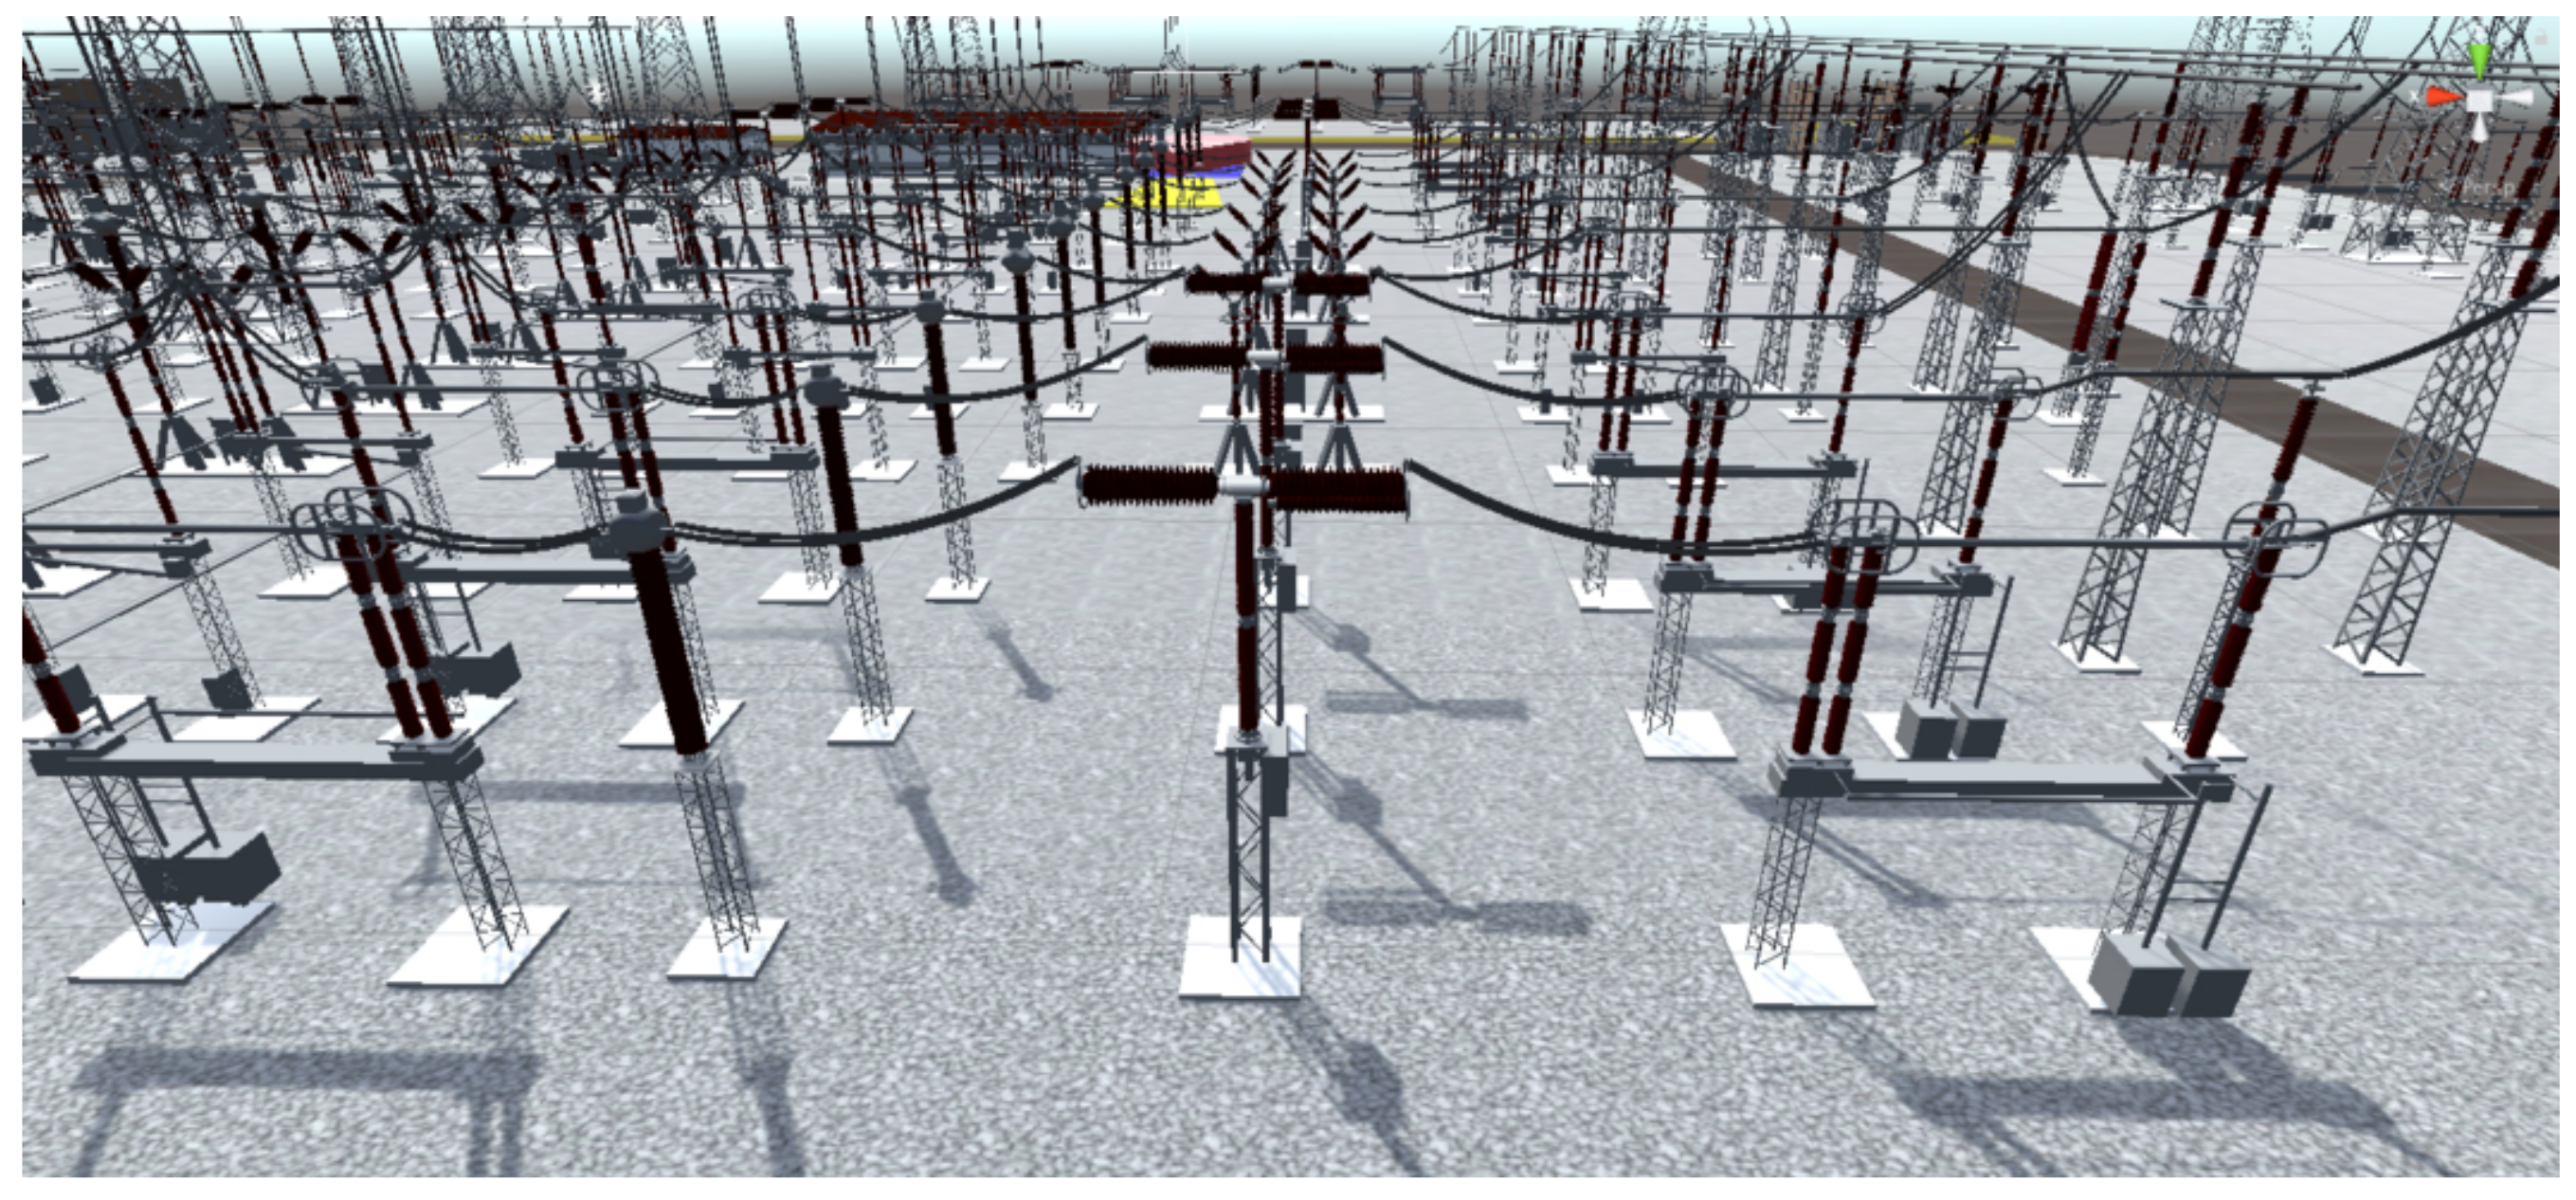
The proposed method was developed and tested considering a virtual environment of a transmission substation (
Figure 10), from a partner power company. This substation has a pair of cameras (RGB and Thermal) with PTZ control. They have five position adjustment presets, which, properly multiplexed in time, can be used to monitor three distinct power switches assets. The thermal camera always captures, in a single pose, the full geometry of the asset of interest. The color cameras, however, are adjusted to zoom levels requiring more than one pose to capture some of the assets.
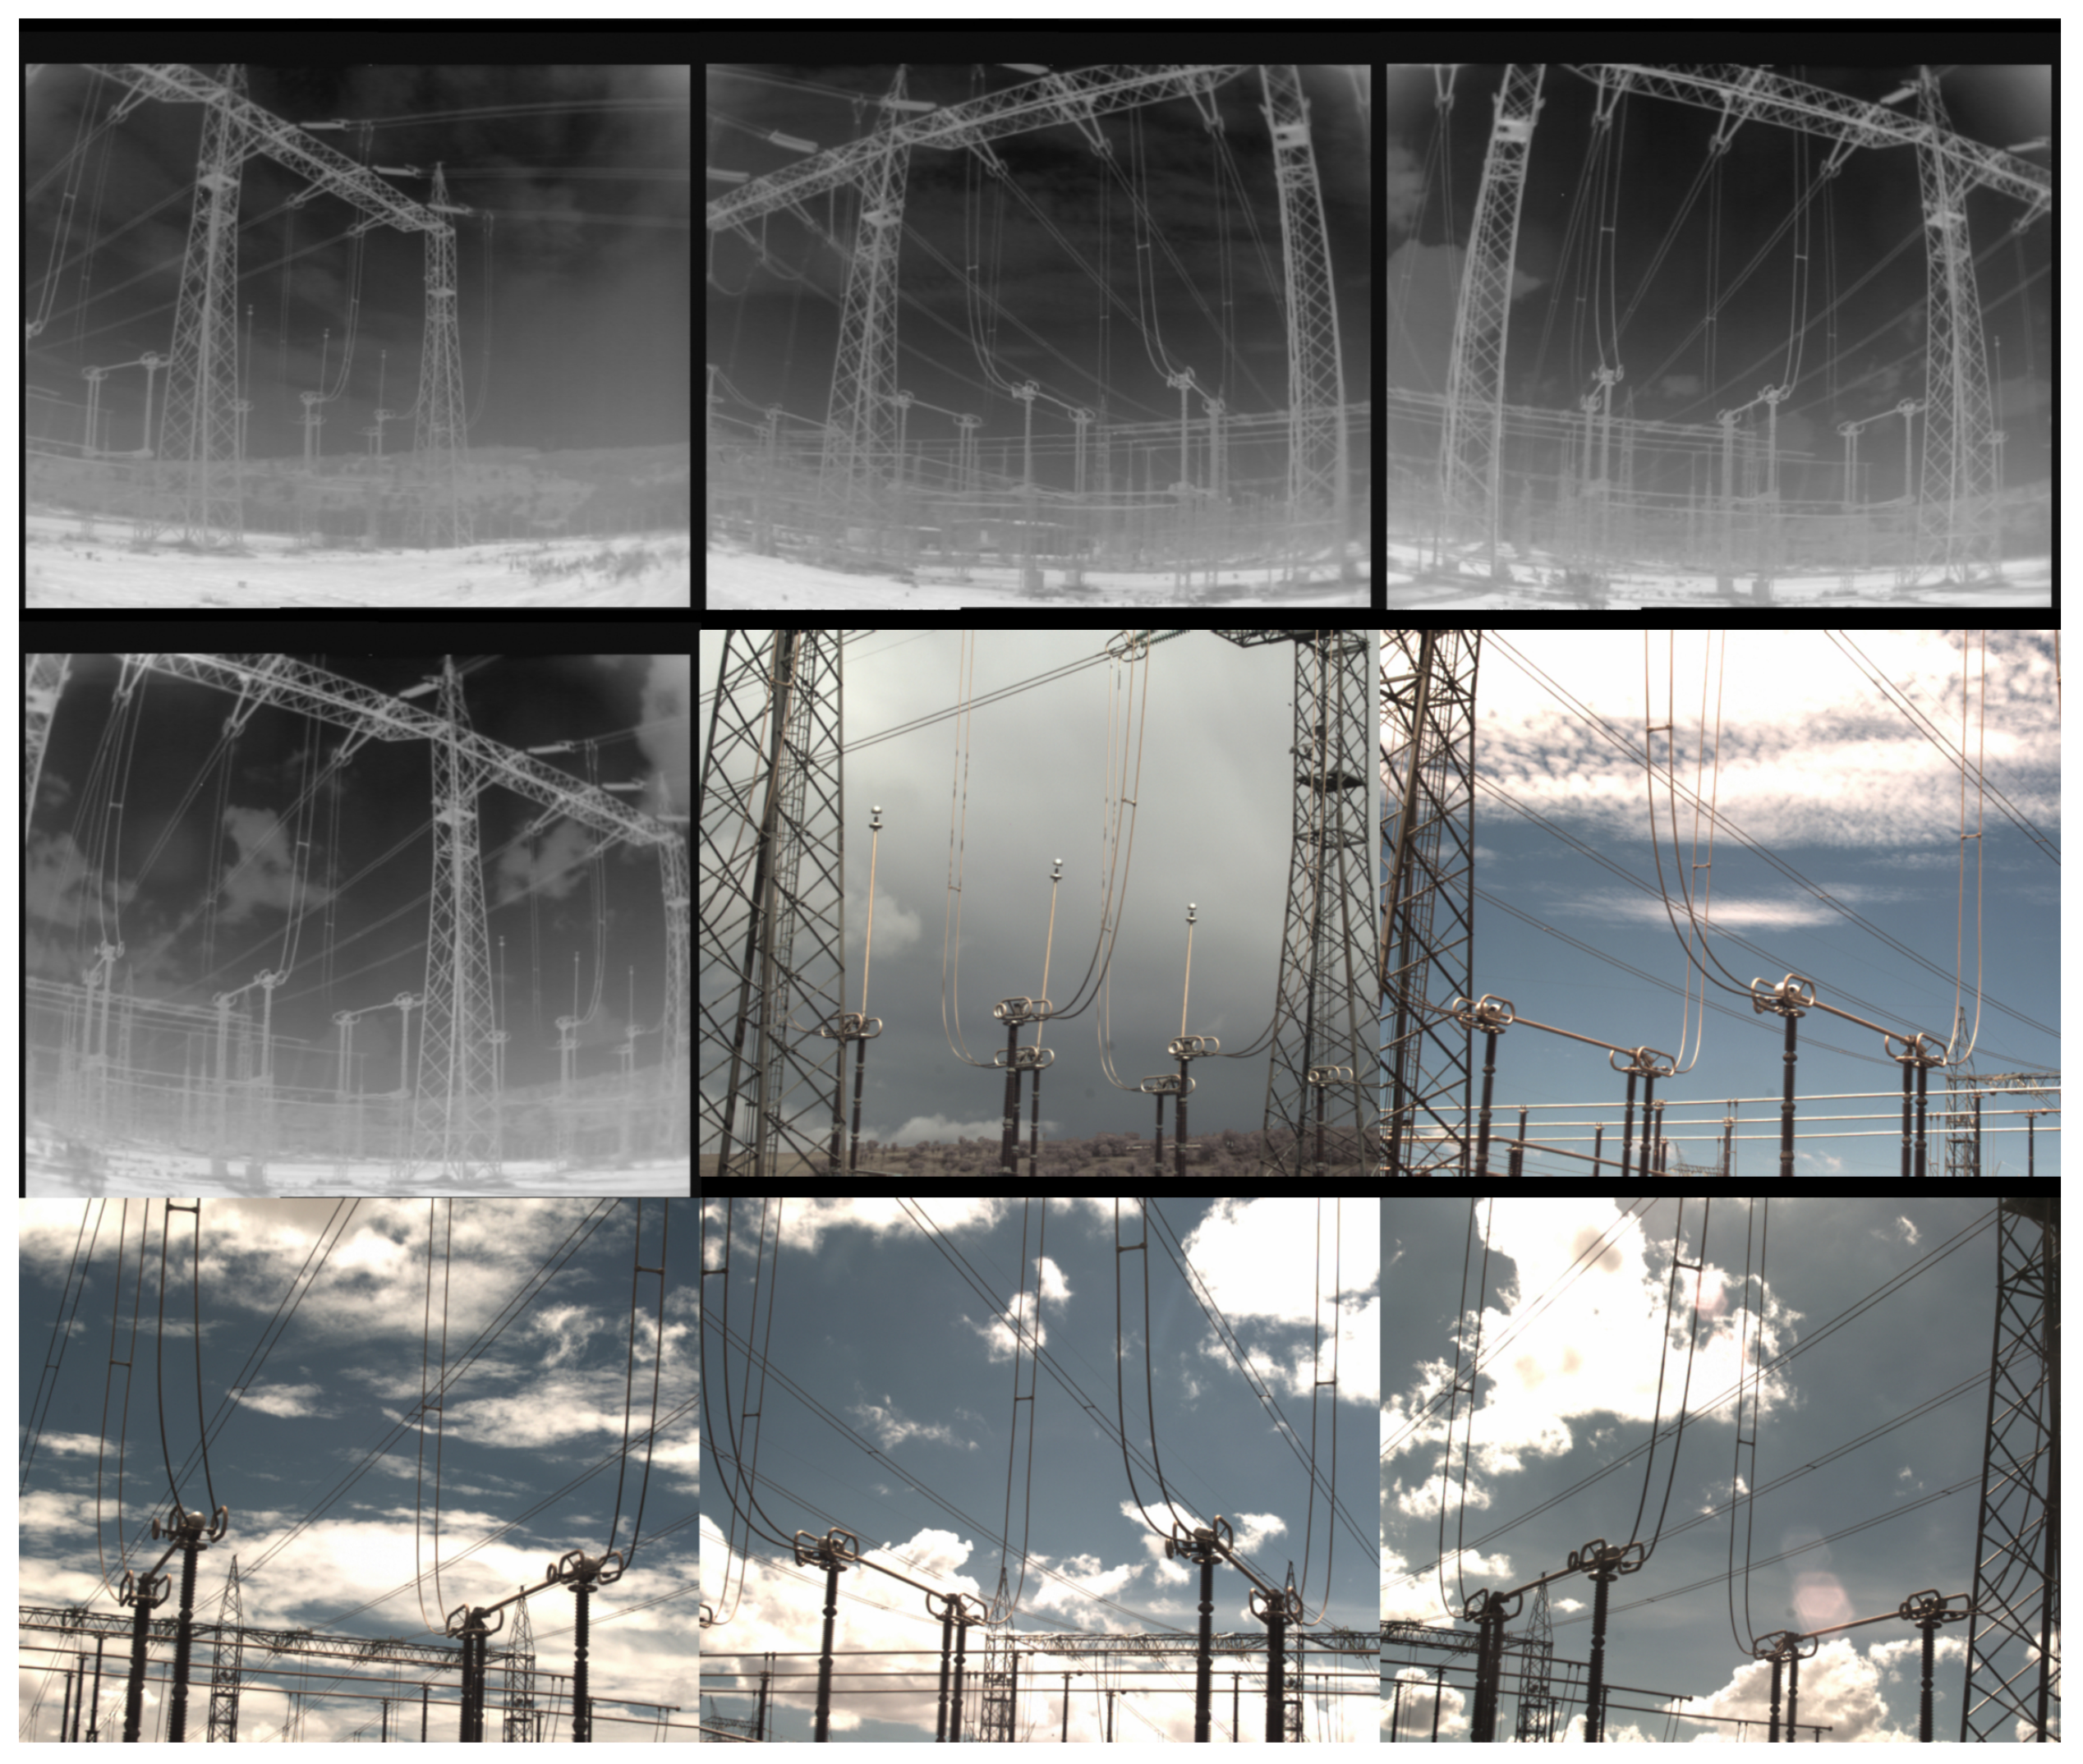
The company kindly provided a dataset with 561 images captured by these cameras. From this set, 123 images were ignored since they correspond to images taken by RGB cameras without any favorable light conditions, at night. A sample of the dataset is presented in
Figure 11.
The images also have metadata for their timestamps, ranging from 31 December 2017 23:03 and 1 January 2018 22:46. This allows emulation of real-time data, by applying some time offset in the system clock. The thermal camera images’ size is 720 × 624 pixels, whereas RGB images’ dimensions are 1280 × 1024.
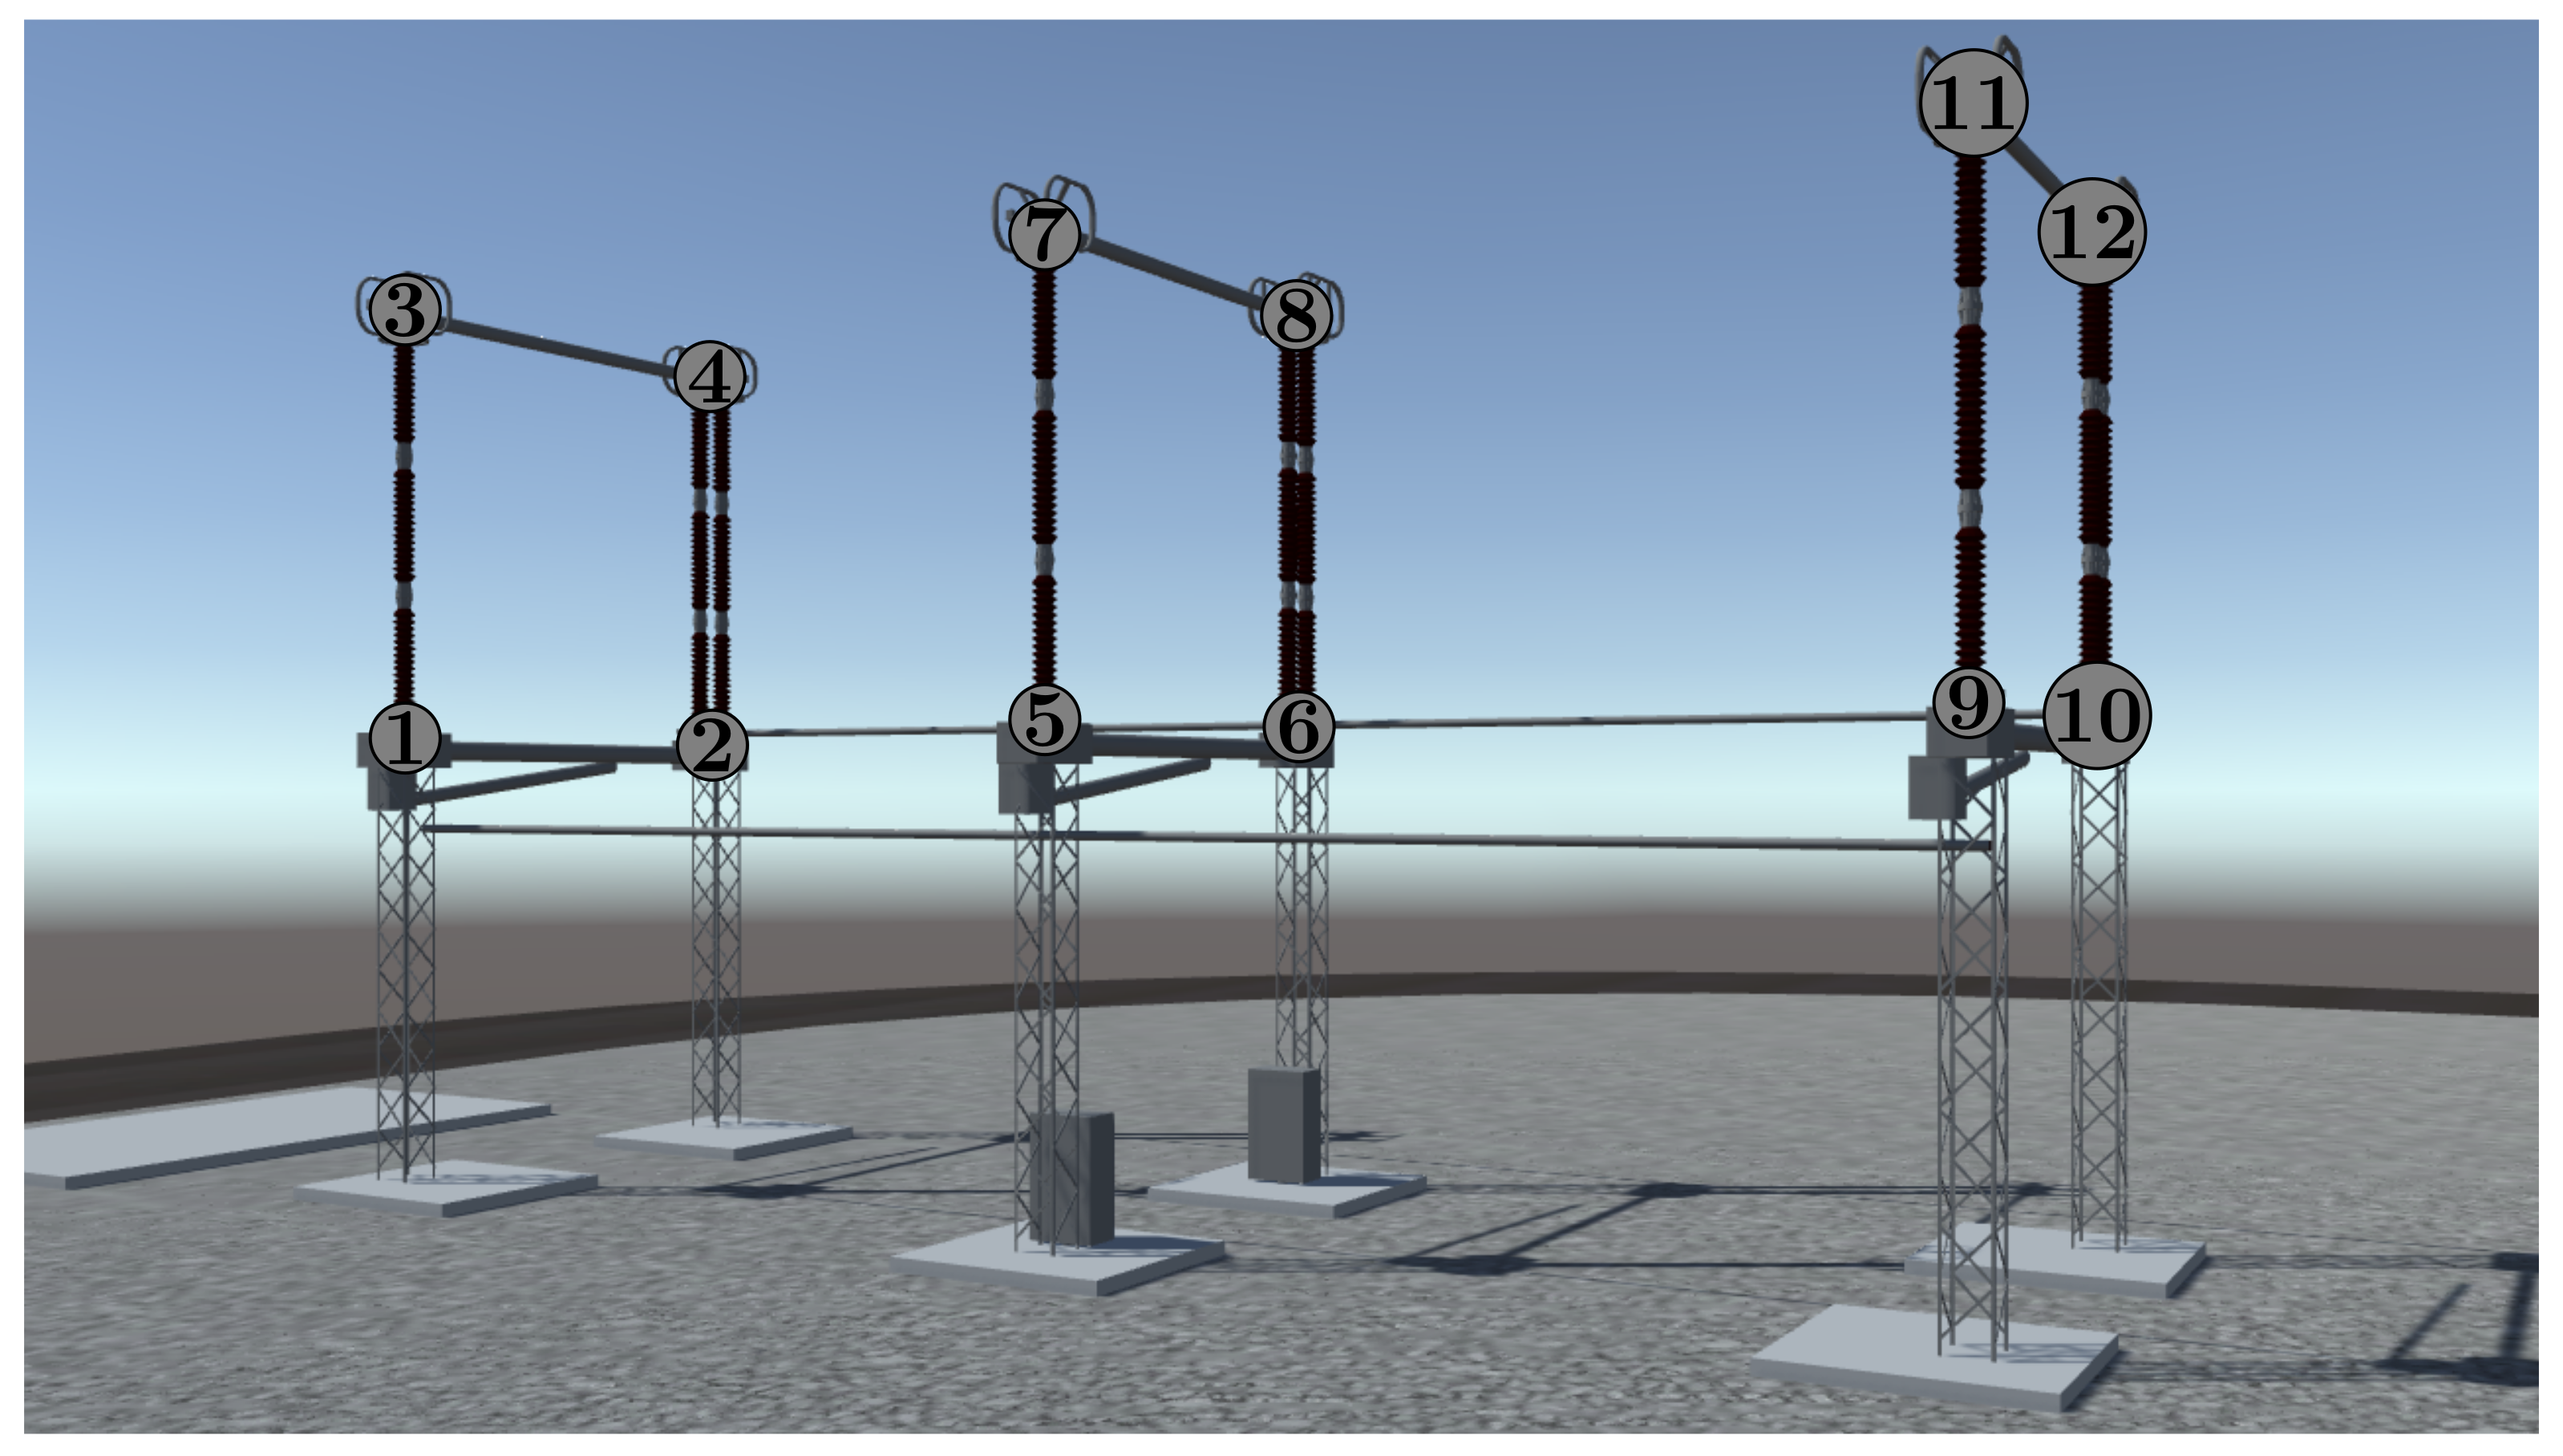
Since the method uses points’ correspondences, the prototype needs a convention for naming the keypoints, used both in the image and in world space. The convention used for this model is illustrated in
Figure 12. Currently, no computer vision method was applied to detect these keypoints in the photos. They were manually specified for each camera’s pose, using a single photo captured at that pose. Hence, mobile cameras or PTZ cameras with significant repositioning errors are not considered in this work.
Finally, the test used a simulated SCADA subsystem to arbitrarily set equipment states and thus allow triggering the alarm dialogs.
6.1. Registration Quality Metrics
The
metric described in
Section 4 measures the mean distance in pixels, which might not be an intuitive unit for representing errors. A more generic alternative, then, is to obtain the relative errors for each axis, resulting in values that are independent of the image dimensions. The mean relative errors are given by:
where
n is the number of keypoints,
is the image width,
is the image height,
is a vector in ICS whose coordinates of the pixel are related to the
ith keypoint and
] is the result of the perspective projection of the WCS point located at
, related to the
ith keypoint, using the estimated camera pose.
Another metric consists of analyzing the keypoints positions once the virtual camera has been “teleported” to the estimated pose and the rectangular region has been textured with the field image. The Unity 3D scripting application programming interface (API) exposes a method to map a point in world space to the corresponding pixel related to the current camera viewport. This can be used to extract the keypoints’ coordinates of the virtual model in the final rendered image.
For the rectangular region with the image overlay, invisible objects can be added as its children and positioned to match the photo keypoints. Once the plane is positioned and oriented, after the 2D–3D registration, the same world-to-screen utility method can be applied in these objects to extract their positions in the rendered image.
Again, the mean Euclidean distance can be used, considering the image rendered by the AV application. After 2D–3D registration succeeds, a screenshot is taken and the following parameter is calculated:
where
n is the number of keypoints,
is the
ith key point pixel coordinates in the rectangular region and
is the
ith key point pixel coordinates in the virtual model.
Relative errors for this metric are given below:
All three metrics , and can be evaluated automatically by the VR application.
6.2. Performance Metrics
For measuring performance impact, one metric is related to the time elapsed between the instant just before a request, from the virtual environment, and the moment after which the server response has been processed.
For that matter, two kinds of requests are considered: (i) the calibration request, aimed at computing the optimal poses for the overlay plane and the virtual camera; and (ii) the image request, responsible for retrieving the last image from the database and updating the virtual environment accordingly. The symbols associated with these measurements are named and , respectively.
6.3. Results
Both calibration and registration were evaluated for nine different combinations of cameras and poses. The experiments were named using a two-character code. The first character is either `T’ or `C’, for thermal and color cameras, respectively. The second character is the index of the preset pose. Due to zoom levels, the RGB camera needs more poses for capturing the full geometry of some assets.
Table 1 summarizes the conditions for each experiment.
All tests described in this section were performed on a Core i5-7400 CPU with 16 GB DDR4 RAM and no dedicated video card, running Windows 10 Home. Both the web server and the clients were deployed on the same physical machine.
The ternary-search algorithm was used to determine the optimal focal length scale factor.
Figure 13 shows this behavior for 10 iterations, for the experiment T1 and the range
.
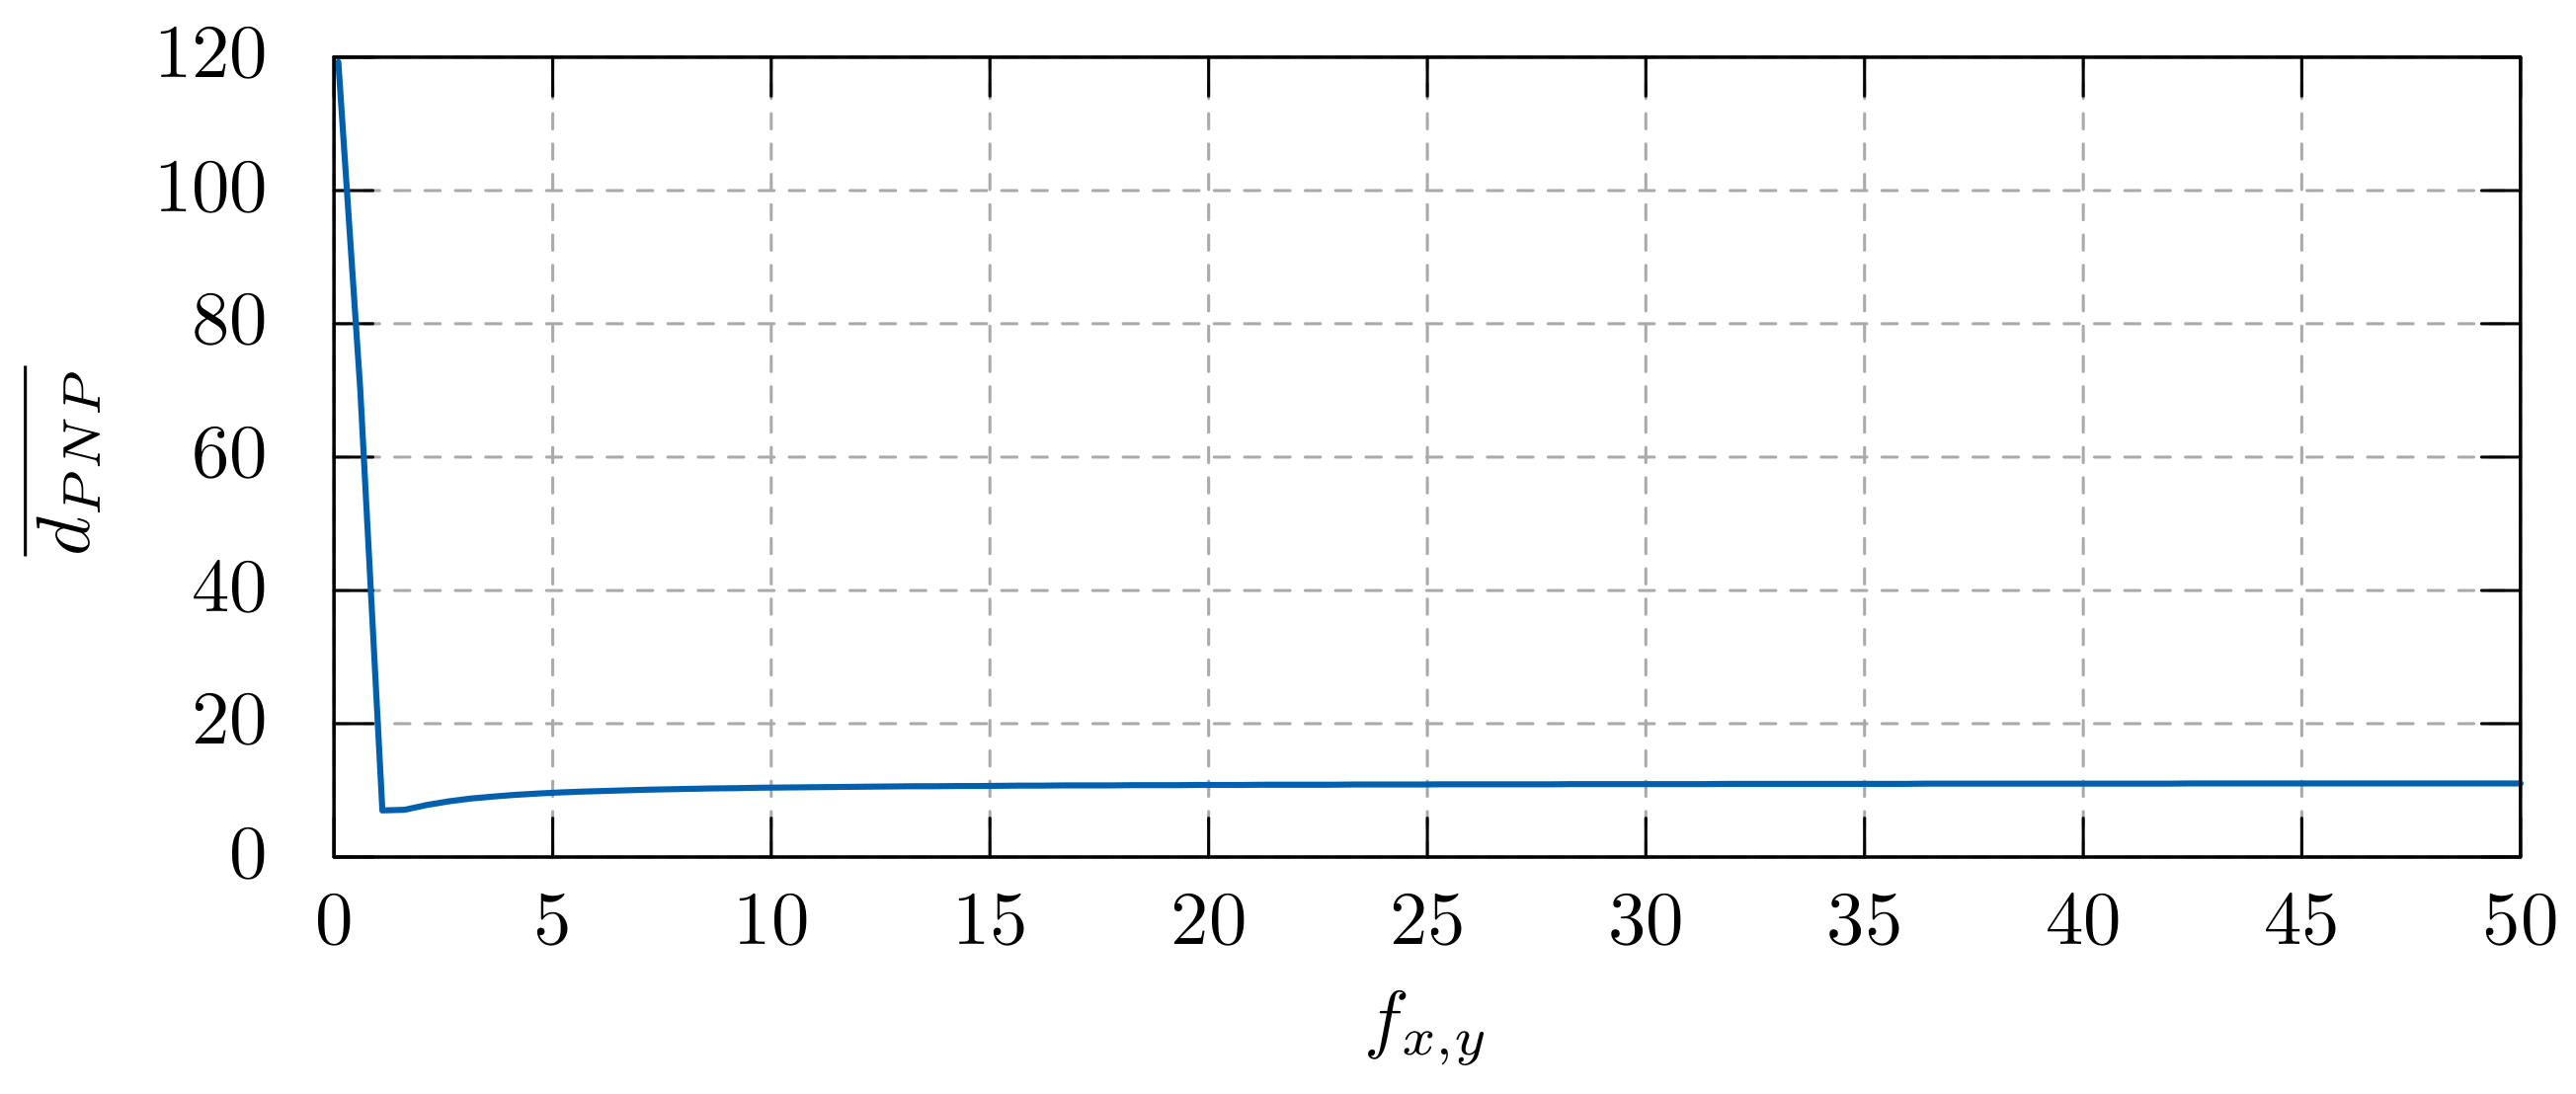
The range for the search algorithm was determined empirically, from the inspection of the
values in a much broader range, as shown in
Figure 14 for experiment T1.
Data for other poses, along with some collected metrics, are summarized in
Table 2. The algorithm was parameterized for running at most 50 iterations, also stopping in the
nth iteration whenever
.
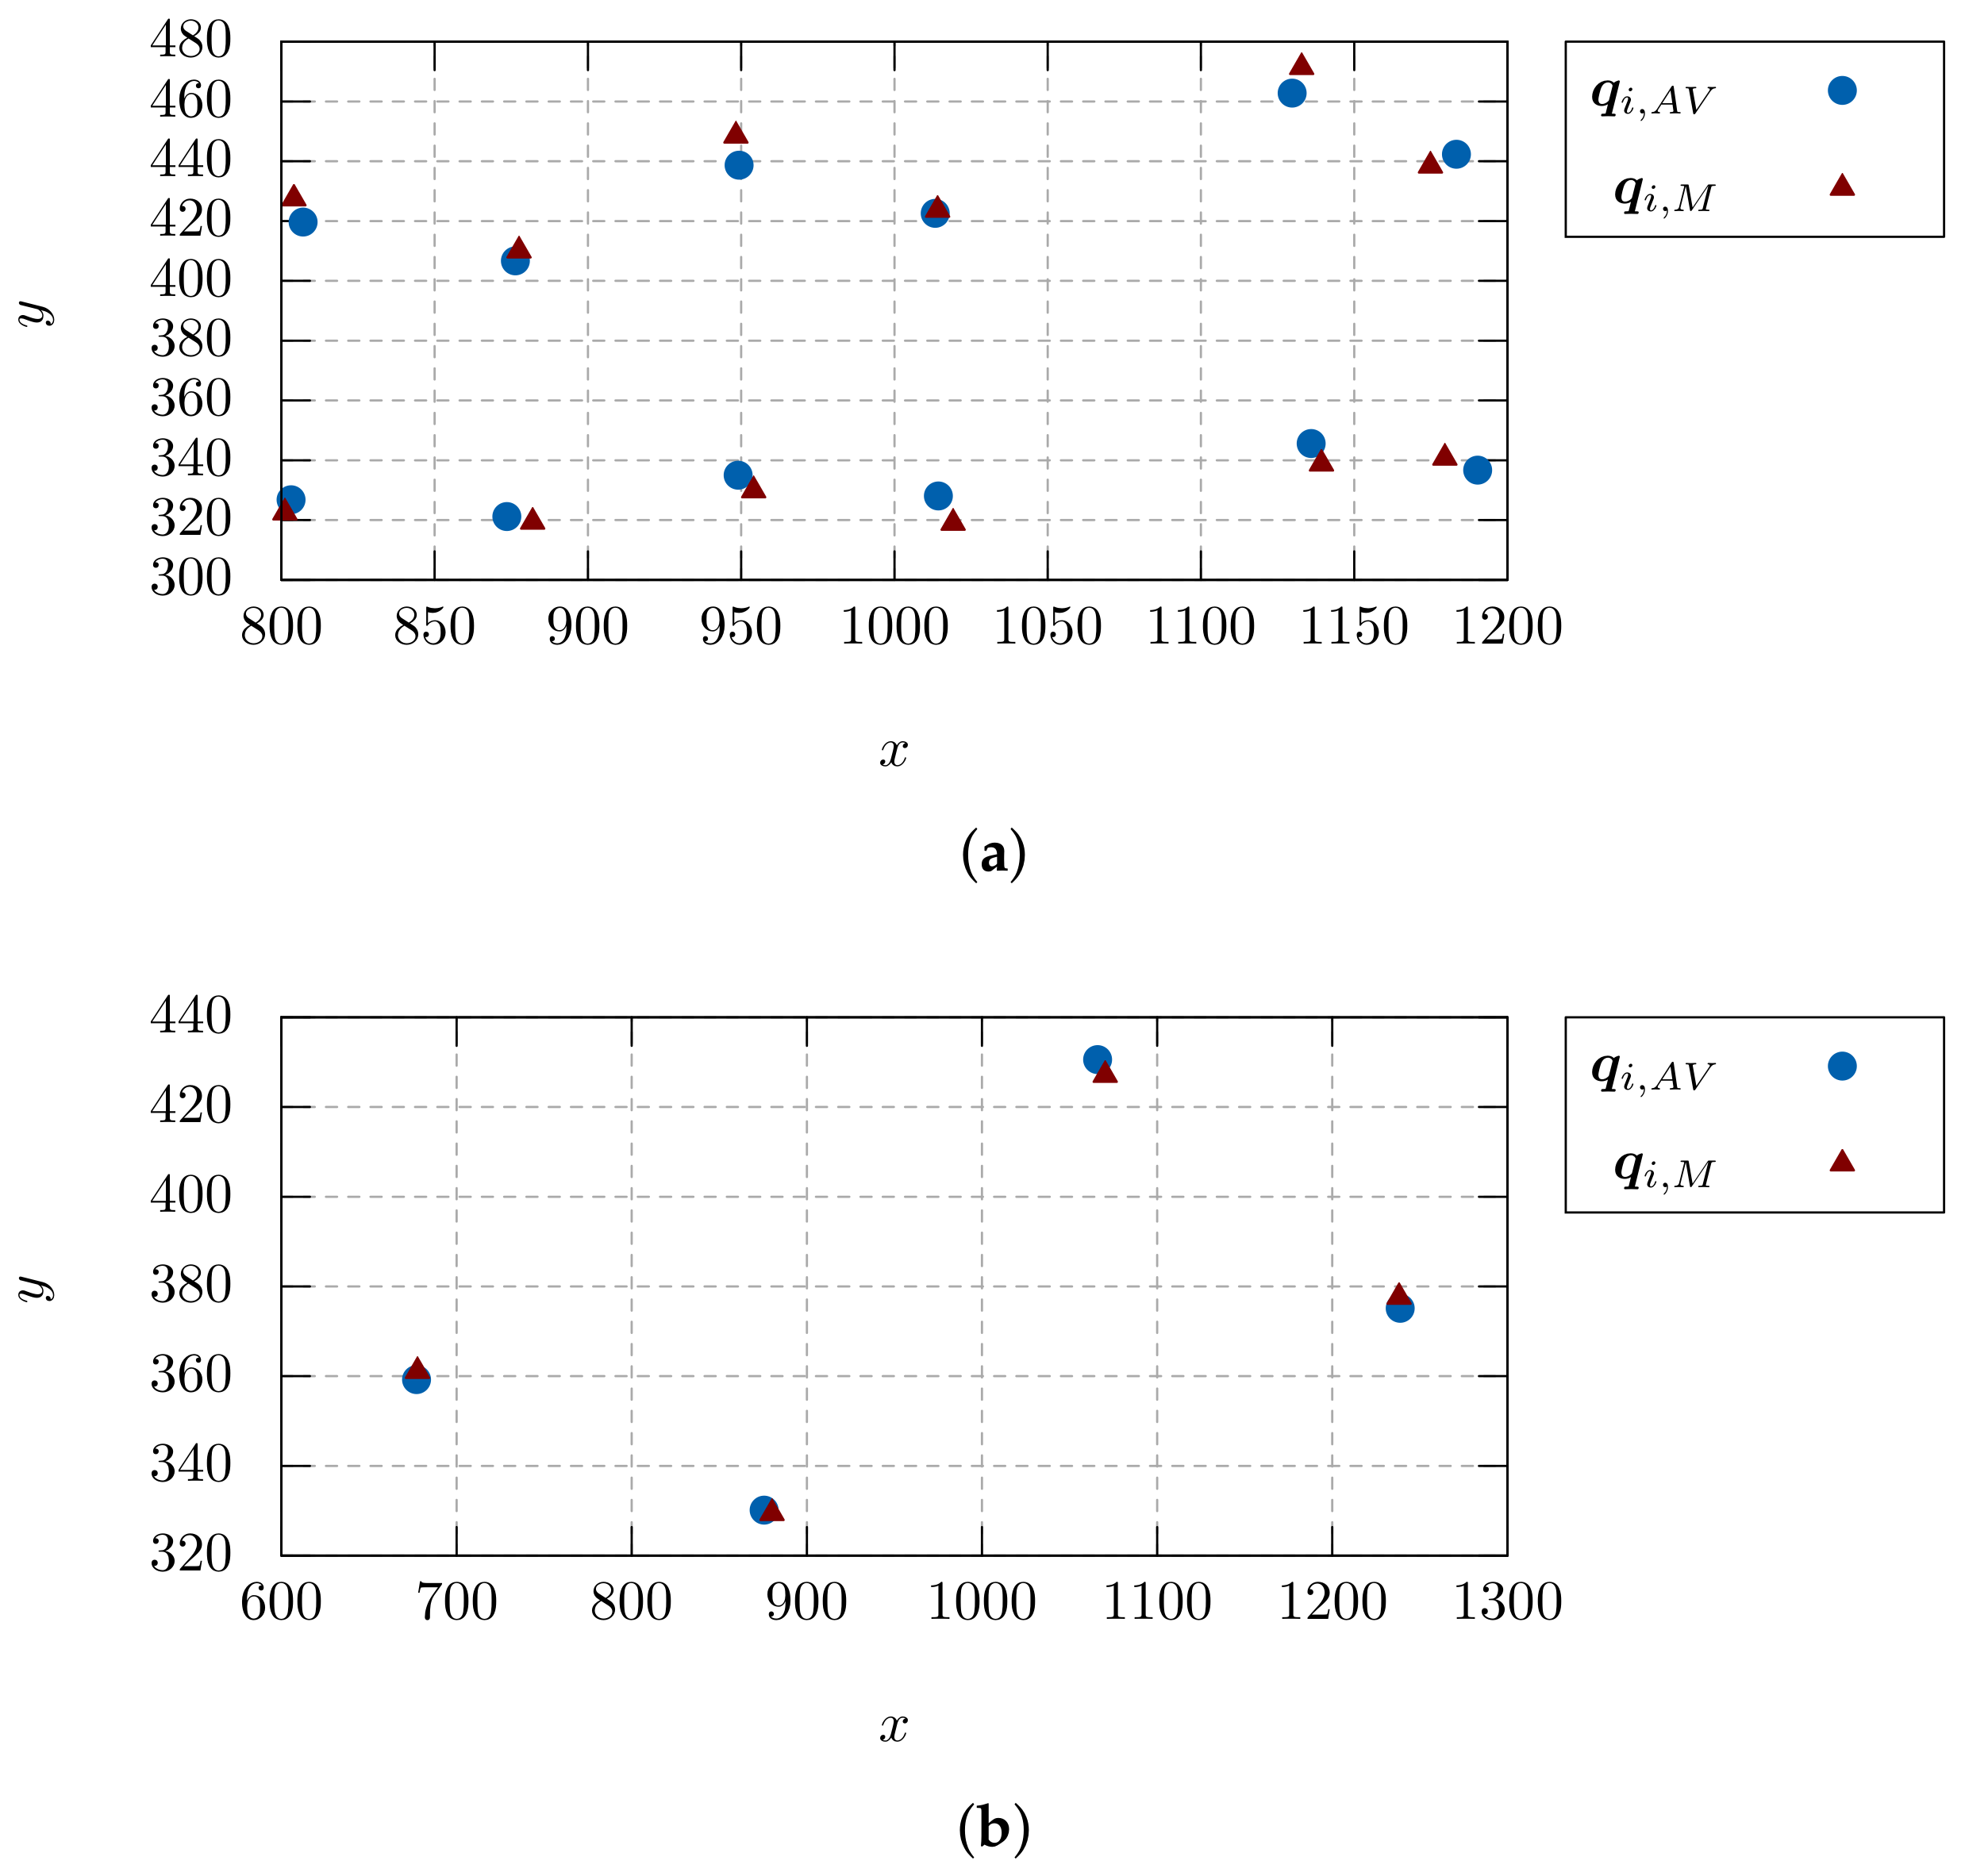
Concerning the resulting rendered image after the registration, the keypoints’ coordinates in pixels were extracted for both the rectangular region (overlay) and the virtual model instances.
Figure 15 shows the resulting coordinates for experiments T1 and C1.
Table 3 gives the collected values for
,
and
, for all experiments, as well as the average value for
, considering 20 requests.
The values obtained for are reasonable for real time remote inspection, especially for far locations with poor network bandwidth. It should be noted that the time needed to correctly interpret the situation, after the 2D–3D registration is performed, might be considerably longer than just a fraction of a second.
In addition, the power disconnector and porticos were modeled with incomplete computer-aided design (CAD) data, as opposed to more precise methods such as 3D scanning. This limitation directly affects the registration quality. Thus, the quantitative metrics are focused in the keypoints and the reprojection errors.
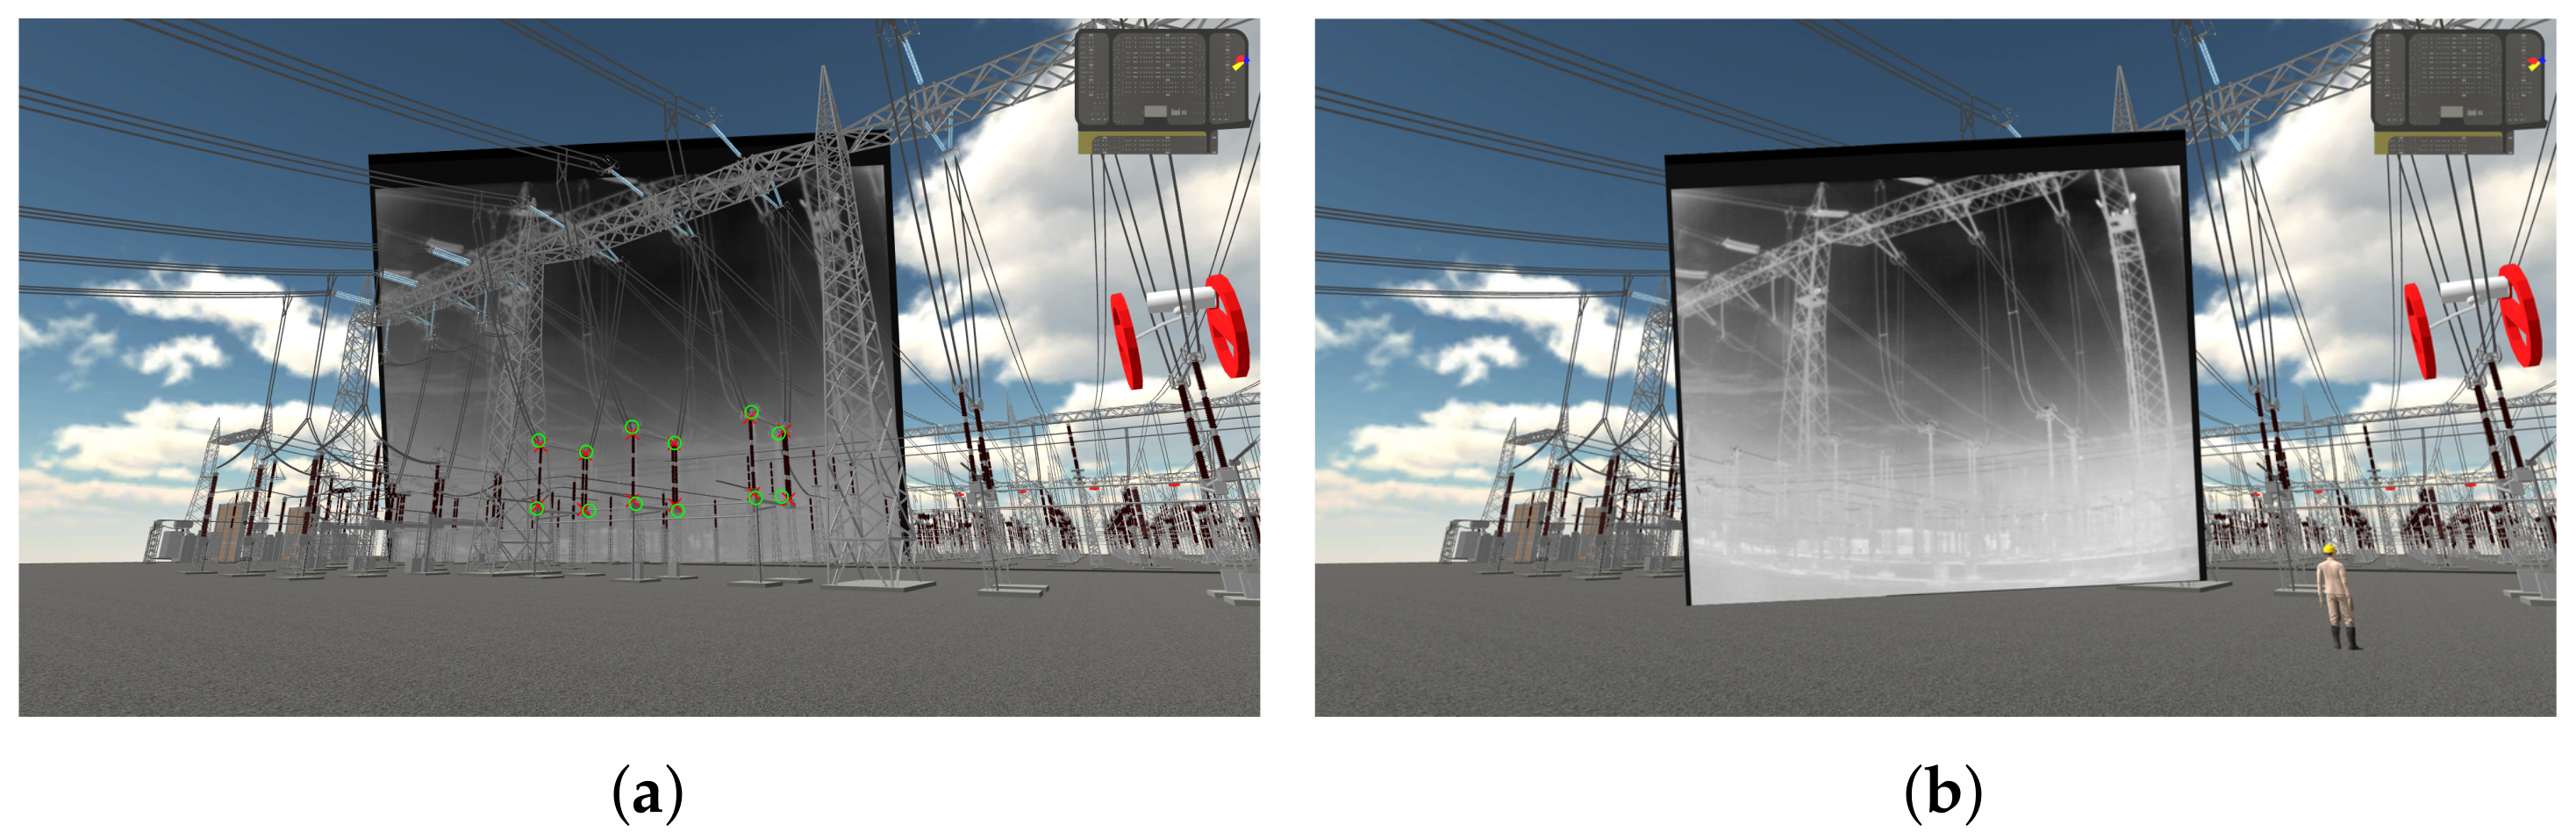
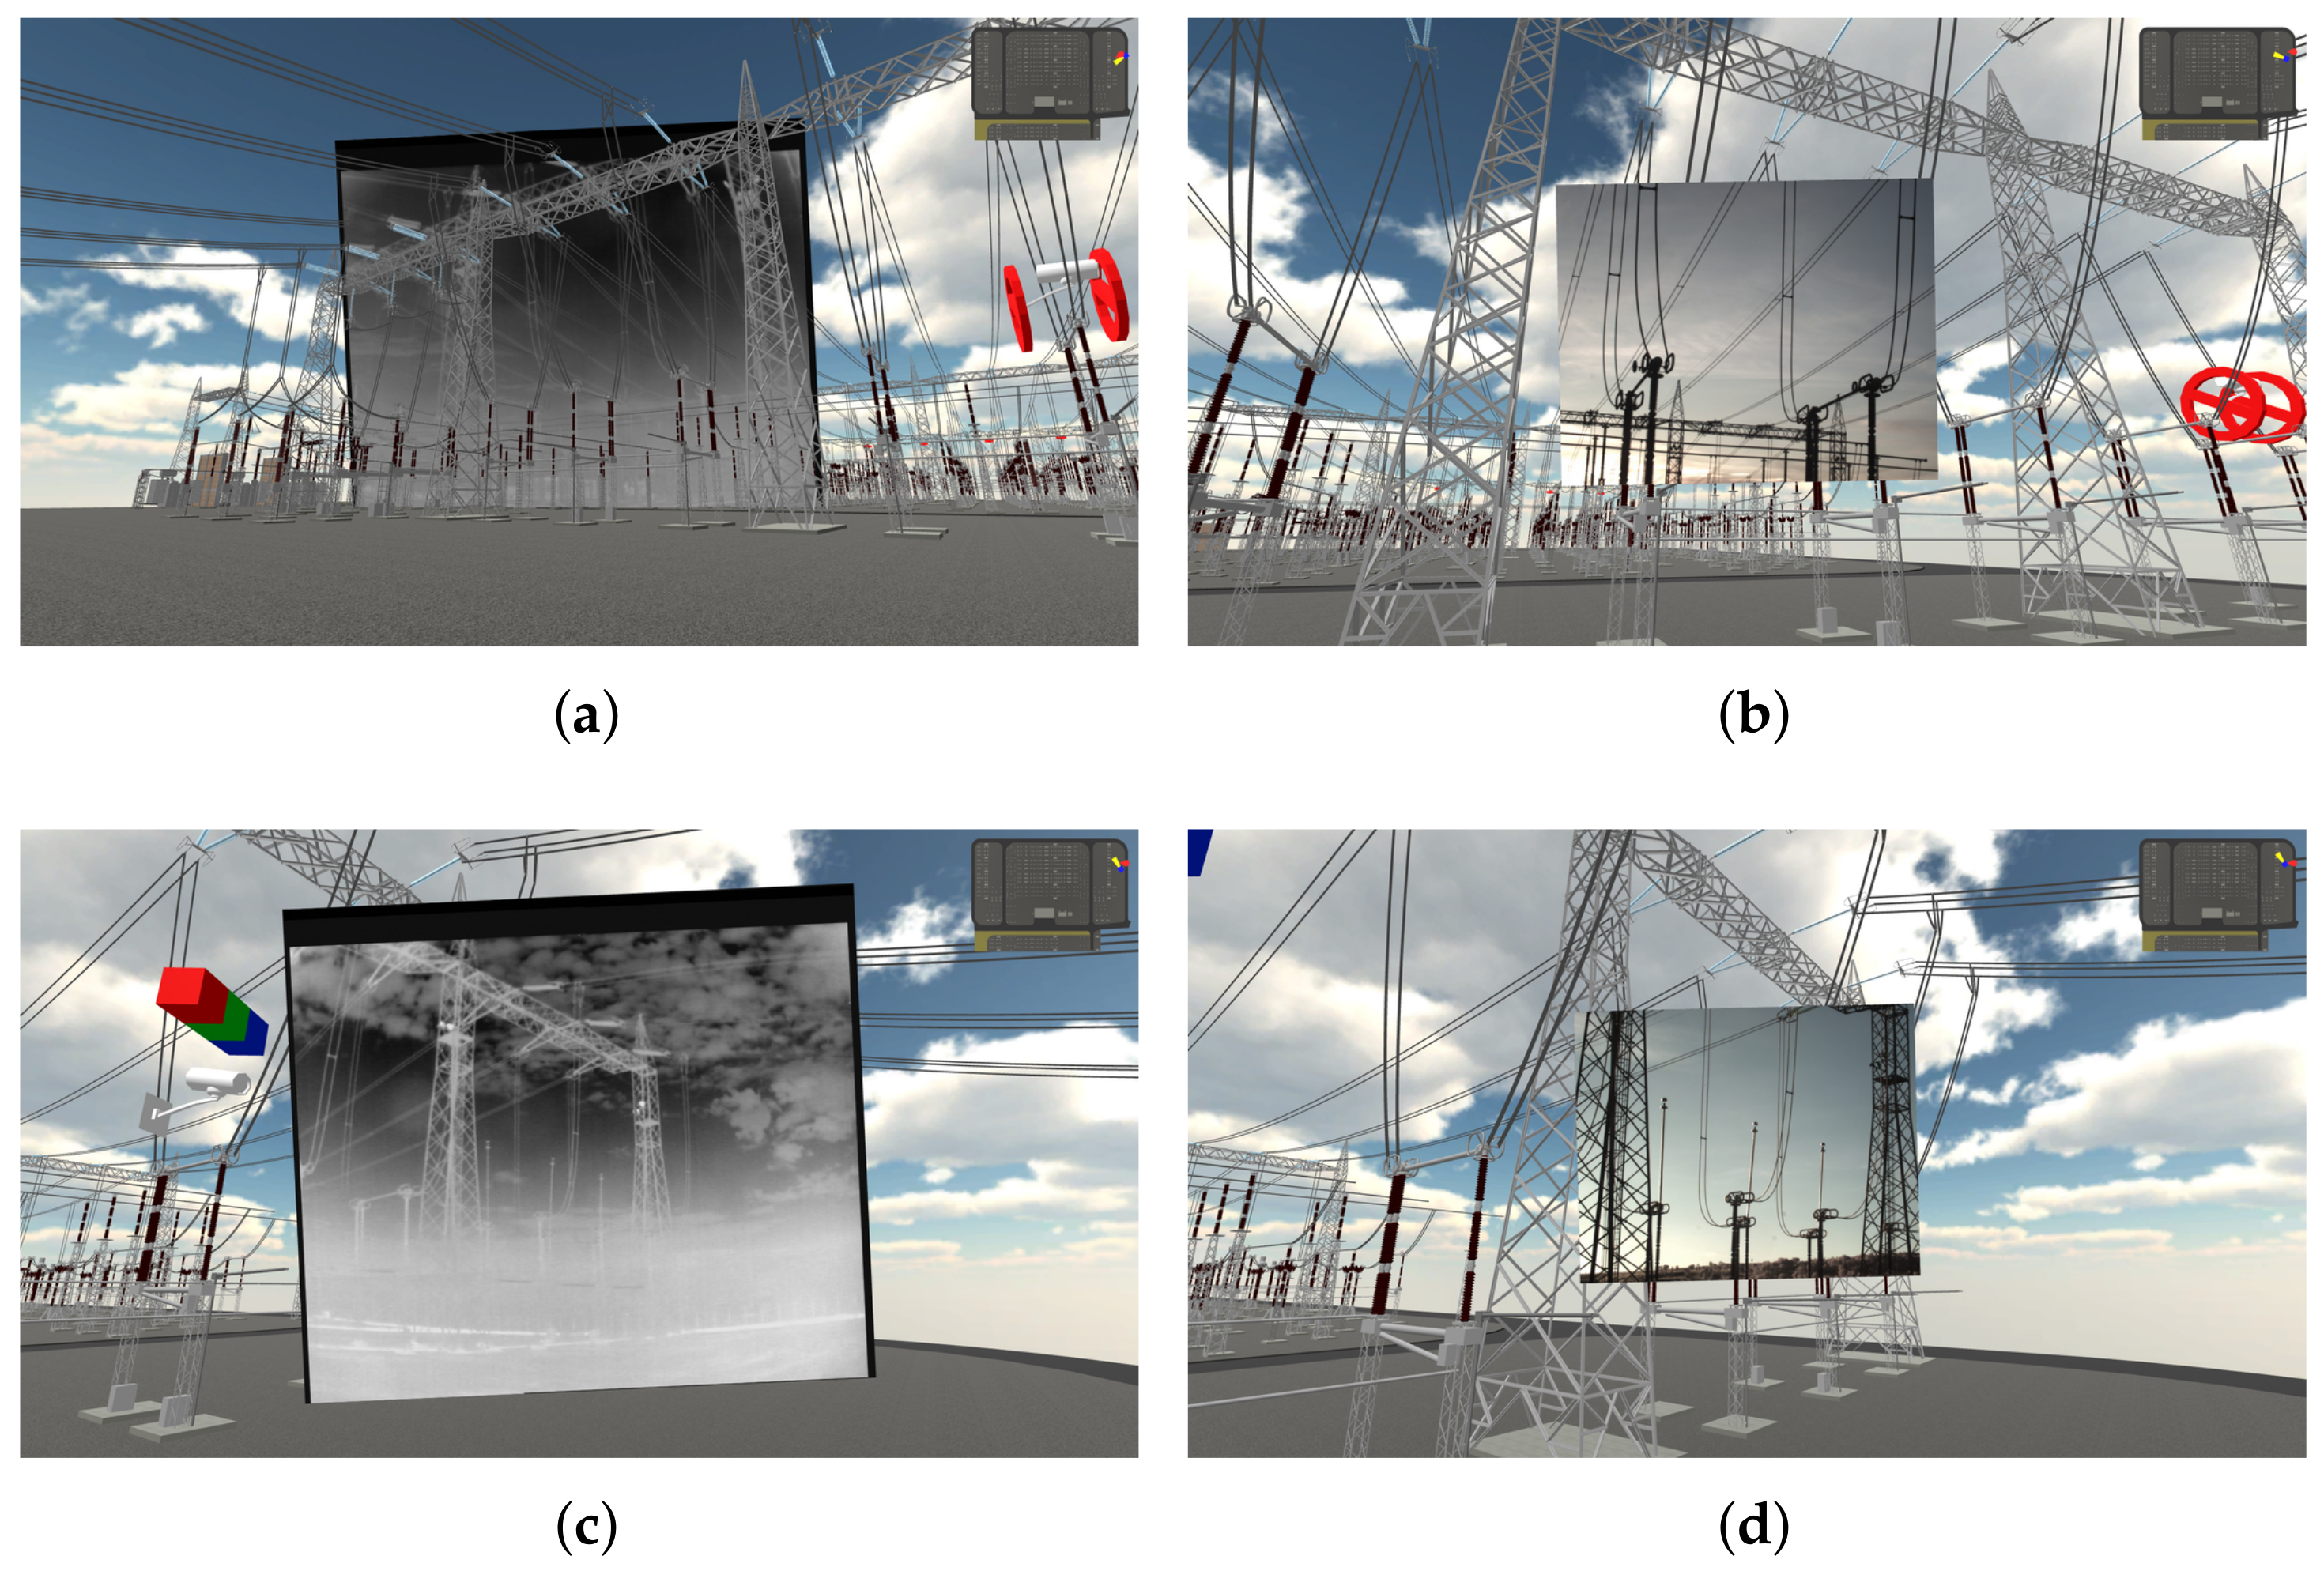
A custom shader was applied to the overlay plane to hide VR objects within its region.
Figure 16 shows the rendered images for both standard and custom shaders. In the former, keypoints are highlighted with red crosses (virtual model) and green circles (overlay rectangular region). Some other registrations are shown in
Figure 17.
7. Discussion
We evaluated the 2D–3D registration quality for the case of cameras without significant distortion and proposed a simple iterative algorithm to determine the focal length scale factor parameter so that keypoints correspondence is optimal. Other camera types, with significant skew factor, non-square pixels and other kinds of distortion, could be handled in future work either by submitting them to calibration methods [
36] (p. 189) or by applying more complex optimization algorithms, with multiple parameters to be estimated.
However, considering a company responsible for dozens of power substations and having multiple inspection cameras with potentially different specifications, in-loco calibration is unpractical. To avoid expensive travels to many far locations, we propose using an approximated camera matrix and refining the focal length until an optimal value is found. In addition, with this approach, the deployment of the augmented virtuality environments can be done without shutting down the image inspection system or affecting the cameras’ poses just for calibration purposes. Environments without any camera installed remain VR-only and represent, in the proposed system’s perspective, future candidates for deploying the RI system.
Once the optimal value for the focal length is determined, the PNP solver used in our system, from the OpenCV library [
42], presented reasonable solutions (
Figure 15 and
Table 2), even with a small number of keypoints (just four in some poses for the RGB camera).
The overall matching depends on other factors, especially the virtual model’s fidelity. In our virtual substation model, the porticos dimensions were not available as input data. However, the power disconnector model was based on some CAD drawings, so that the chosen keypoints act as a reliable ground-truth for evaluating the registration.
In this sense, the 2D–3D registration relative errors are arguably small, as shown in
Figure 16a or summarized in
Table 3, with the metrics
and
. Since they are evaluated only after the rectangular region
is positioned and oriented, following the mathematical model explained in
Section 3, we can infer that the model has revealed itself appropriate for the problem at hand. This has some advantages, considering that “when the system model (or part of it) can be solved with analytical methods, considerable gains in terms of efficiency, accuracy, and understanding are usually obtained” [
45].
A drawback of our approach is that the focal length scale factor range must be provided by the user during calibration. For experiments T3 and C3, which represent the pose capturing the furthest asset, the range had to be narrowed, to avoid solutions having the overlay plane too far away from the VR camera. Nonetheless, the calibration routine does not need to be run on every system startup, but only for configuring new fixed cameras. Considering the time needed to run the optimization, , the process could be done in real-time, depending on the application. This is particularly useful for the scenario of mobile cameras if the keypoints’ coordinates could also be extracted in real-time by computer vision techniques.
The client–server architecture has the benefit of caching the last images from each camera so that, if multiple clients are used in the operations center, fewer network requests are made to the image database. In addition, since the focal length optimization is done occasionally and on the server-side, VR clients can spend their processing resources on more important tasks, notably real-time rendering. However, the system’s architecture performance remains to be tested as future work.
The proposed user interface combines interactive virtual objects placed near the monitored assets, 2D–3D spatial registration whenever the virtual camera’s pose is adequate, and customizable camera settings for each device. Although currently tested only in one substation, it is already prepared for multiple cameras and regions of interest.
Concerning the SCADA integration, faults can be better understood by allowing the user: (i) to be notified whenever there is an inconsistency, as shown in
Figure 9; and (ii) to immediately see the last field image and, if desired, the 2D–3D spatial image registration using that image. This is already implemented, but some user experiments are still required to provide a comprehensive evaluation of the feature.
Registration took approximately 384 ms for the thermal images and 486 ms for RGB images, including the HTTP request and response times and the VR rendering. The slight difference is most likely due to the image sizes: 720 × 624 for the former against 1280 × 1024 for the latter. Taking into account the trends on 5G mobile networks, this can be an issue once real-time video registration is needed. An alternative would be to use the server only for the PNP solving and calibration, and to open a dedicated User Datagram Protocol (UDP) video channel between the client and the substation, querying images and updating the plane texture accordingly. For the RI of power substations, having the field image updated two times per second seems adequate for nearly real-time operation.
Finally, since the registration metric is computed in real-time by the client, it is possible to tolerate small variations on the estimated virtual camera’s pose until the error exceeds a threshold. This feature is already implemented in the system.
Further work consists of deploying the solution into an operations center and evaluating the operators’ performance in the electrical system reestablishment, using power flow simulators. Additionally, the system could be adapted and tested in other environments needing similar RI or teleoperation facilities, such as construction machines [
46], marine systems [
19], or industrial boilers.


