Article

Impact of Global Warming in Subtropical Climate Buildings: Future Trends and Mitigation Strategies

by
Marta Videras Rodríguez
1,
Antonio Sánchez Cordero
1,
Sergio Gómez Melgar
2,* and
José Manuel Andújar Márquez
2
1
Programa de Doctorado de Ciencia y Tecnología Industrial y Ambiental, Escuela Técnica Superior de Ingeniería, Universidad de Huelva, CP 21007 Huelva, Spain
2
TEP192 Control y Robotica, CITES, Escuela Técnica Superior de Ingeniería, Universidad de Huelva, CP 21007 Huelva, Spain
*
Author to whom correspondence should be addressed.
Energies 2020, 13(23), 6188; https://doi.org/10.3390/en13236188
Submission received: 2 September 2020 / Revised: 1 November 2020 / Accepted: 23 November 2020 / Published: 25 November 2020
(This article belongs to the Special Issue Energy Efficiency in Buildings: Both New and Rehabilitated Ⅱ)

Abstract

:
The growing concern about global climate change extends to different professional sectors. In the building industry, the energy consumption of buildings becomes a factor susceptible to change due to the direct relationship between the outside temperature and the energy needed to cool and heat the internal space. This document aims to estimate the energy consumption of a Minimum Energy Building (MEB) in different scenarios—past, present, and future—in the subtropical climate typical of seaside cities in Southern Spain. The building energy consumption has been predicted using dynamic building energy simulation software tools. Projected climate data were obtained in four time periods (Historical, the 2020s, 2050s, and 2080s), based on four emission scenarios defined by the Intergovernmental Panel on Climate Change (IPCC): B1, B2, A2, A1F1. This methodology has been mathematically complemented to obtain data in closer time frames (2025 and 2030). In addition, different mitigation strategies have been proposed to counteract the impact of climate change in the distant future. The different energy simulations carried on show clearly future trends of growth in total building energy consumption and how current building designers could be underestimating the problem of air conditioning needs in the subtropical zone. Electricity demand for heating is expected to decrease almost completely, while electricity demand for cooling increases considerably. The changes predicted are significant in all scenarios and periods, concluding an increase of between 28–51% in total primary energy consumption during the building life cycle. The proposed mitigation strategies show improvements in energy demands in a range of 11–14% and they could be considered in the initial stages of project design or incorporated in the future as the impact of climate change becomes more pronounced.

1. Introduction

Climate change is one of the greatest challenges facing humanity. Greenhouse gas (GHG) emissions are growing at an alarming rate and this rising trend is associated with human activities. The building industry generates up to one third of total greenhouse gas emissions, mainly due to the burning of fossil fuels in its operation, being responsible for at least 40% of the total energy consumption in the European Union (EU) [1]. Faced with this problem, the countries of the European Union are orienting their electricity systems towards sustainable energy models. In the case of Spain, the energy mix of renewable energies shows that there is a strong commitment to renewable while at the same time progress is being made in the process of decarbonization. In fact, by 2019 the increase in renewable installed capacity has meant that for the first time these technologies will reach 50% of the country’s total generating capacity (110 GW in total) (Figure 1) [2]. However, achieving 100% green energy generation to successfully combat climate change is a current challenge and the effects of climate change are already present in the environment.
One of the main consequences of climate change is global warming: the Intergovernmental Panel on Climate Change (IPCC) estimates a temperature increase of 1–7 °C during the period 1960–2100 using various GHG emission scenarios [3]. Due to global warming, buildings are changing their energy demands to satisfy the internal comfort needs of its inhabitants. These changes in terms of energy depend mainly on the geographical region and the type of climate. From a global and long-term perspective, the negative impact of climate change will be more pronounced in warm climates, where increasing cooling energy will be much larger and not balanced with the reduction for heating. In cold or very cold climates, the decrease in energy for heating will largely exceed the increase in energy for cooling [4]. This trend will be similar in temperate climates, where the reduction in the size of the heating demand is estimated to be 20% while the increase in the size of the cooling demand will be 5% in the mid-21st century [5,6].
In the subtropical climate area, the construction GHG emissions rate is constantly growing due to the rising energy consumption of many existing buildings. For this reason, it is urgent to study the real impact of climate change on different climates from a regional perspective in order to create a common and strategic approach that makes existing buildings and new ones more energy efficient. This would enable architects to optimize buildings’ energy demands and reduce the CO2 emissions generated.
Research about the impact of climate change on the energy consumption of buildings has been carried out since 1995 [7]. The common methodology to evaluate it is to input a file of projected future weather and a building model into an energy simulation software. The diversity of future weather data sources, type of buildings, and simulation tools that have been used in different combinations to calculate future energy consumptions in different regions around the world is significant: Lam et al. [8], Wan et al. [9], Chan [10], Li et al. [11], Wan et al. [12] examined how climate change will impact in different cities in China; Wang and Chen [13], Wang et al. [14], and Shen [15] examined how it would impact in the United States; Mavrogianni et al. [16] and Sanders and Phillipson [17] examined how it would impact the United Kingdom; Dodoo et al. [18] and Nik and Sasic Kalagasidis [19] carried out a case study set in North Europe; Camilleri et al. [20] and Wang et al. [21] examined the same issue in different cities in Australia; Rubio-Bellido et al. [22] conducted research in Chile, and Ouedraogo et al. [23] in Burkina Faso.
These studies suggest that the impact of climate change will reduce the imbalance of energy use in residential buildings located in cold and hot climate regions. Currently, buildings located in cold regions use more energy to heat spaces than to cool them. The opposite is the case for buildings located in hot regions. The impact of climate change will increase the temperature in all regions, so buildings located in cold regions will have to adapt their consumption pattern as their cooling requirements increase. In cities located in hot regions, heating requirements (which are already low today) will gradually be reduced completely.
Increases in total consumption of energy about 8.1–14.3% in office buildings and about 24% in residential building are estimated in the subtropical climate of Hong Kong for the 2100 scenario [9,10]. This pattern is repeated in cities located in the US, where office buildings will raise its energy consumption in a range of 11–16.4% while residential buildings in a range of 36.4% for the 2080 scenario [14,15]. These results show that the design and function of the building are keys to study the impact of climate change. Some adaptation measures related to the thermal envelope, the efficiency and control of the heating, ventilation air conditioning (HVAC) systems, and the range of internal comfort temperatures were analysed and validated to counteract the impact of climate change in these buildings. It can be noticed that this topic is now a very important focus of study of the international scientific community.
The latest studies use weather generator tools that are freely accessible on the Internet and provide future climate data with an already intrinsic mathematical methodology to downscale the data, saving the researcher’s time in the process of generating data. Moazami et al. [24] concluded that only weather archives generated on a dynamic downscaling basis and including typical and extreme conditions are best suited to test the energy robustness of buildings in future climate uncertainties. The most known weather data generators software tools are: WeatherShiftTM [25], CCWorldWeatherGenTM [26] and WeatherMorph: Climate Change Weather File GeneratorTM [27]. These websites processes historical weather files (in .EPW, .TMY2 or .TMY3 extensions) that are commonly used to perform energy consumption simulations. These files collect climatological data in hourly values of different meteorological parameters (such as dry bulb temperature, relative humidity, solar radiation, and wind speed) measured over more than 10 years and represented in a representative year [28]. Through a performance of several calculations applying automatically a morphing method [29], these software tools produce future weather files intended to be used in building energy consumption simulation programs. The differences between them were studied by Moazami et al. [30], finding few specifies in the results they provide.
Jiang et al. [31] and Ciancio et al. [32] used these software packages to evaluate the future climate data of a few cities, concluding that winters in 2050 will have milder temperatures. Such conditions will be advantageous in terms of energy for northern regions where there will be considerable savings for heating consumption. However, over the summer, European continental countries will experience an increase in cooling energy demands. Cities located in southern Europe will experience long and frequent periods of intense summer heat where the power of the air conditioning currently installed will be insufficient. Some research in this regard has been carried out in southern Europe and northern Africa: Barbosa et al. [33] and Andric et al. [34] in Lisbon; Kapsomenakis et al. [35] in Greece; Pierangioli et al. [36] in Italy; Peng and Elwan [37] in Egypt; and Imessad et al. [38] in Argel. The investigations located in Greece and Italy suggest that cooling demand will increase in a range of 15–30% in buildings located in the Mediterranean climate for 2050 scenario [36,37].
In Spain, Rey Hernández et al. [39] used these softwares to estimate how climate change will impact in Valladolid. Cellura et al. [40] and Pérez-Andreu et al. [41] examined the same issue in some buildings located in Valencia. They concluded that future scenarios predict an increase in cooling consumption which could be mitigated by measures such as reducing air infiltration, reducing the thermal transmittance of the envelope, decreasing the window to wall ratio, increasing sun shading, and improving the performance of HVAC systems. Suarez et al. [42] carried out a case study set in Cordoba and Escandon et al. [43] in Seville. Both investigations studied energy performance of residential buildings in 2050 and showed an increase in cooling consumption of 50%. Climate change will increase the average percentage of hours of thermal discomfort by [43] in Seville.
This paper presents research focused on assessing the impact of climate change on a single-family house located in a subtropical climate: the city of Málaga in Southern Spain. It should be noted that in Spain, the energy demand for the set of single-family homes is proportionally higher than that of apartment buildings. Single-family houses represent only 33% of the total number of residential buildings, but their energy consumption represents 46% of the total energy of the sector, compared with the 53% of the apartment buildings [44]. The dwelling studied has been designed to be passive and highly energy efficient, meeting the requirements established by the uhuMEB standard [45,46,47] (a methodology that supports the design and construction of minimum energy buildings (MEB) in subtropical climates).
This research aims to study the evolution of energy consumption of buildings in subtropical areas, from designs and constructions with 2020 climate standards, regardless of global warming scenarios. This topic that has not been previously studied in subtropical latitudes. As a case study, the research is focused on Málaga, a typical seaside city in Southern Spain. In it, following the IPCC, an estimate is made of its climatic evolution as well as the energy consumption derived in a MEB in different future scenarios. In addition to studying the impact of climate change on the MEB, this research is completed with the proposal of different strategies to mitigate significant increases in energy consumption and CO2 emissions from the building. These strategies are proposed for the predictable worst-case scenario (2080 scenario), although they can already be applied today, and are based on improving the efficiency of heating and cooling devices, limiting the flow of air renewal through CO2 sensors and the improvement of the thermal and hermetic properties of the external envelope.
The aim of this research is that all its results can be used by the scientific community, building professionals, and policymakers to provide guidelines and incentives for efficient construction to reduce as much as possible the current and future polluting emissions generated by this sector.
This paper lays as follows: Section 2 describes the materials and whole methodology used in this research so that it can be easily reproduced. It includes the energy simulation algorithm and a complete description of the case study in which this research is based. Section 3 shows, applied to the case study, the results in terms of climate conditions, energy consumption, and CO2 emissions for historical and new scenarios and sub-scenarios (from 2020 to 2080). Section 3 also includes the results as a consequence of several proposals of the building adaptation strategies to mitigate the impact of climate change in energy consumption in the distant future. Section 4 discusses the obtained results and Section 5 provides the main conclusions derived from the carried on research. The paper includes an Appendix A that collects all the data used in this research.

2. Materials and Methods

This section contains the materials and methods used in this research. The advanced energy simulation software DesignBuilderTM (Aurea consulting, Madrid, Spain) V4.7.0.27 (DB)—which runs EnergyPlusTM as the data calculation engine—was used to calculate the building energy performance. DesignBuilderTM was chosen because it can simulate the current environmental and energy performance of buildings, including energy consumption, CO2 emissions, and indoor hygrothermal conditions. In addition, this tool allows to estimate the size of heating and cooling systems by the ASHRAE heat balance method and provides specific comfort models. EnergyPlusTM has been tested and validated by ANSI/ASHRAE standards and is commonly used by the scientific community [48].
ElementsTM V1.0.6 tool, developed by Big Ladder Software (Los Angeles, CA, USA) with the collaboration of the Rocky Mountain Institute (Basalt, CO, USA), was used to analyze climate parameters variations from the weather files of the studied location. This tool allows the visualization, creation, and edition of meteorological files with an .EPW extension for buildings energy models.
Given the values gathered in the energy simulations of the case study and the variations of the meteorological parameters of Málaga’s climate, MatlabTM R2020a was used to interpolate new data points of consumption and climate.

2.1. Methodology

2.1.1. Acquisition of Historical Climate Data

Spanish Weather for Energy Calculations’ (SWEC’s) climate files were used for the specific location of this research. SWEC provides 52 weather files, one for each Spanish provincial capital, which were generated using historical meteorological data from the Spanish National Institute of Meteorology. In particular, the Málaga climate file (in .EPW and .TMY2 extensions) collects climate data measured between 1961 and 1990 that is synthesized into a single representative year. This file was used to carry out a first simulation of energy consumption and is called historical scenario in the Section 3. It is used as a reference point to compare future consumption due to the impact of climate change. The climatic parameters provided by this file were evaluated using the ElementsTM tool. The software for generating future climate data also required this historical climate file.
In an international context, it is possible to obtain climate files from different sources depending on the country of origin or the simulation package used. Solar and Wind Energy Resource Assessment (SWERA), funded by the United Nations Environment Program, provides typical weather data for 156 locations in 14 countries. International Weather for Energy Calculations (IWEC), from Numerical Logics and Bodycote Materials Testing Canada, provides typical weather files for 227 locations worldwide. All these historical climate files are available on the EnergyPlusTM website [49] created by the United States Department of Energy (DOE, Washington DC, USA).

2.1.2. Acquisition of Present and Future Climate Data

The process of generating present and future climate files was done using Weather Morph: Climate Change Weather File GeneratorTM, available on the internet, and free of charge [27]. In comparison with the tools cited in the previous section (WeatherShiftTM y CCWorldWeatherGenTM), Weather Morph: Climate Change Weather File GeneratorTM was chosen because it allows the generation of future climate data in more experimental sub-scenarios. On the one hand, WeatherShiftTM provides future weather data in two emission sub-scenarios for the years 2035, 2065 and 2090. On the other hand, CCWorldWeatherGenTM also provides future meteorological data in only two future emission sub-scenarios (in this case for the years 2020, 2050 and 2080) [30]. The chosen tool Weather Morph enables the simulation of climate data in four sub-scenarios of future emissions by extending the range of results. In fact, this software was developed employing the ideas and methodology behind CCWorldWeatherGenTM, improving its efficiency with an overall reduction in the time taken to perform the calculations. Weather Morph uses a global circulation model (GCM) to produce future climate predictions: HadCM3 comes preloaded; it is based on the model from the UK Met Office’s Hadley Centre [50,51].
Weather Morph allows the simulation of a locality climate in three scenarios (2020, 2050, and 2080) and in four GHG emission sub-scenarios experienced and reported by the IPCC (B1, B2, A2 and A1F1). These emission sub-scenarios have been widely used by the scientific community in the previously exposed literature to analyze the future buildings’ energy demands. These sub-scenarios are based on social trends, economic growth, technological development, and demographic factors. Sub-scenario B1 (low impact) is the most favorable; its simulation is based on a more homogeneous society involved in global sustainability. It emphasizes global solutions to economic, social, and environmental problems. Sub-scenario B2 (medium-low impact) focuses on a more fragmented society, which is involved in environmental sustainability and prefers to solve local rather than global problems. Sub-scenario A2 (medium-high impact) simulates a segmented society based on self-sufficiency, where economic growth is regional and technological development is slower than in other families of scenarios. Finally, A1F1 (high impact) is the most pessimistic sub-scenario, which is characterized by rapid global economic growth and continued use of fossil fuels in a homogeneous society [52].
Thus, twelve future climate files were obtained in different scenarios and sub-scenarios depending on the social, economic, technological, and demographic progress of the planet. These files were used to carry out present and future simulations of energy consumption and are referred to as 2020 scenario, 2050 scenario, and 2080 scenario in this research. The climatic parameters provided by these files were also evaluated using the ElementsTM tool and are shown in the first part of the results. In this section the changes in the average temperature and relative humidity of Málaga are analysed.

2.1.3. Production of Climate and Consumption Data in the Near Future

Once the climate data and the data from the energy simulations for the years 2020, 2050 and 2080 were obtained, the variation in the climate and the energy consumption pattern in each year within this time range was calculated. MatLabTM was used to interpolate new data points of consumption and climate in the near future. A polynomial interpolation between the known data was carried out to estimate the values in the next years.
A polynomial interpolation is a method of estimating values between known data points, i.e., given n + 1 distinct points x0, x1,…, xn and corresponding values y0, y1,…, yn, there exists a unique polynomial of degree at most n that interpolates the data {(x0, y0),…,(xn, yn)} [53].
The polynomial trajectory was designed between the 2020, 2050 and 2080 data of each variable (in each sub-scenario): average temperature, relative humidity, heating and cooling consumption, and CO2 emissions. After prefixing the known set of points in the plane, the command polyfit and polyval was used for their graphic representation.
P = polyfit(x,y,n) returns the coefficients for a polynomial p(x) of degree n which is the best solution (in the sense of least squares) for the data of y. The coefficients of p are in descending powers and the length of p is n + 1 [54].
p(x) = p1xn + p2xn−1 + ... + pnx + pn+1
The polynomial path that passed through the set of points was calculated. In this way, an approximation of the evolution of the annual scenario until 2080 was obtained. Assuming the logical uncertainty of very long-term scenarios, the interest was focused on the next decade. From the mathematical functions generated, data for the years 2025 and 2030 were extracted and plotted alongside the data for the baseline years. These are referred to as the 2025 scenario and the 2030 scenario in this research.

2.1.4. Case Study

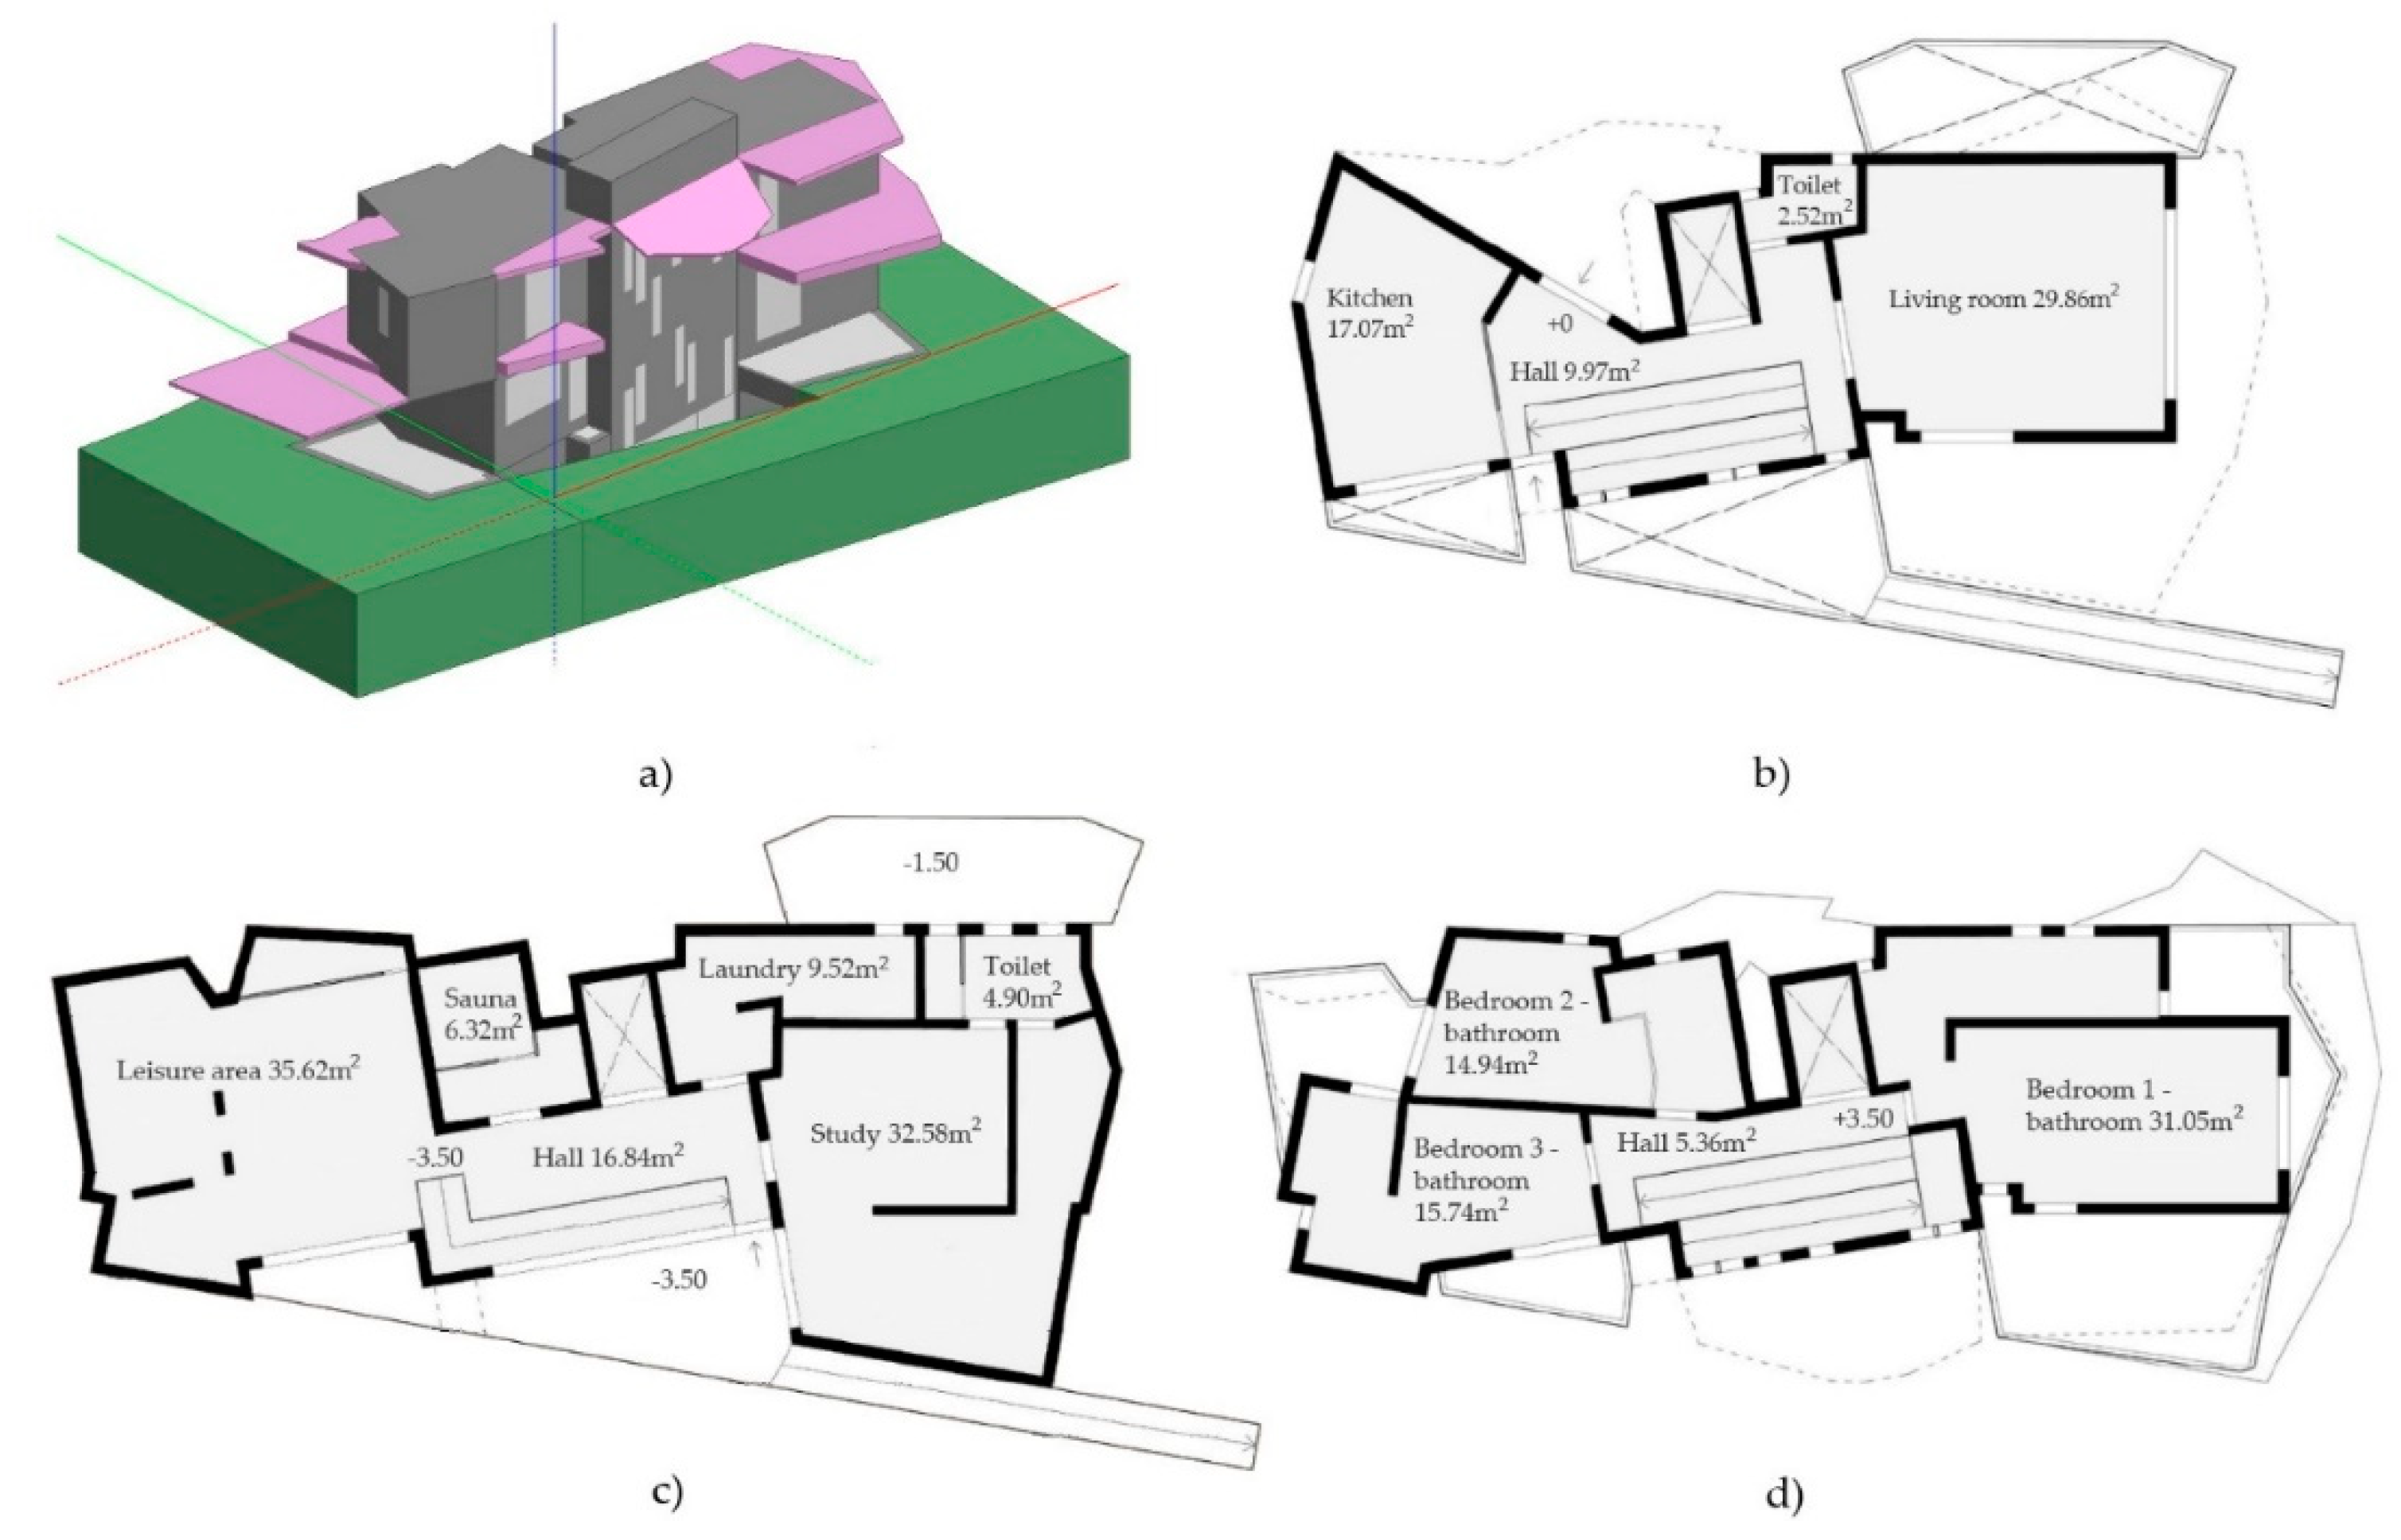
The methodology proposed in this work has been applied in the energy simulation of a single-family house located in a residential neighbourhood in the metropolitan area of the city of Málaga, in southern Spain. It is a 3-storey residential building which was modelled in DesignBuilderTM (Figure 2). It has a total constructed area of 291 m2 distributed in two floors above ground and one buried level. The useful area is of 238 m2 distributed in a leisure area, a laundry room, and a home office with a complete bathroom with sauna in the basement; a kitchen, a living room with a toilet on the ground floor; and three double rooms with integrated bathrooms on the upper floor. The building program was completed with an atrium in the south facade that orders the interior circulations connecting vertically all floors. The main access to the house is made from the ground floor, although a buried courtyard allows access inside through the basement level. The occupation of the building was set at 0.028 person/m2, which is equivalent to the capacity of the house according to the number of bedrooms (3 bedrooms × 2 persons).
Málaga is in the Csa climate zone according to the Köppen-Geiger climate classification [55]. This subtropical climate is characterized by hot, dry summers; mild, wet winters, and variable temperatures and rainfall in spring and autumn. The complexity of optimizing the consumption of a building in a subtropical climate lies in the variability of the outdoor climatic conditions. In a cold climate, the main objective is to accumulate heat inside the building through solar radiation and indoor thermal loads. But in subtropical climates—depending on the season—the building needs to conserve heat or evacuate it exchanging with the outside. Due to the characteristics of this climate, it was necessary to carefully modulate the passive and active strategies of the building to achieve the energy efficiency established in the uhuMEB standard:
  • Sun shading to prevent heat build-up from direct sunlight entering the building.
  • The maximum thermal transmittance of the outer envelope (combining opaque walls and openings), was set at Ue = 0.3 W/m2K.
  • The airtightness was defined through an excellent crack template to limit the uncontrolled infiltration airflow (equivalent to a n50 value < 0.6 h−1 EN 13829).
  • The current range of indoor temperatures (20–24 °C) that are comfortable for users in Malaga, was calculated using the Humphreys and Nicol [56] statistical model of adaptive comfort, with less than a 10% of discomfort hours.
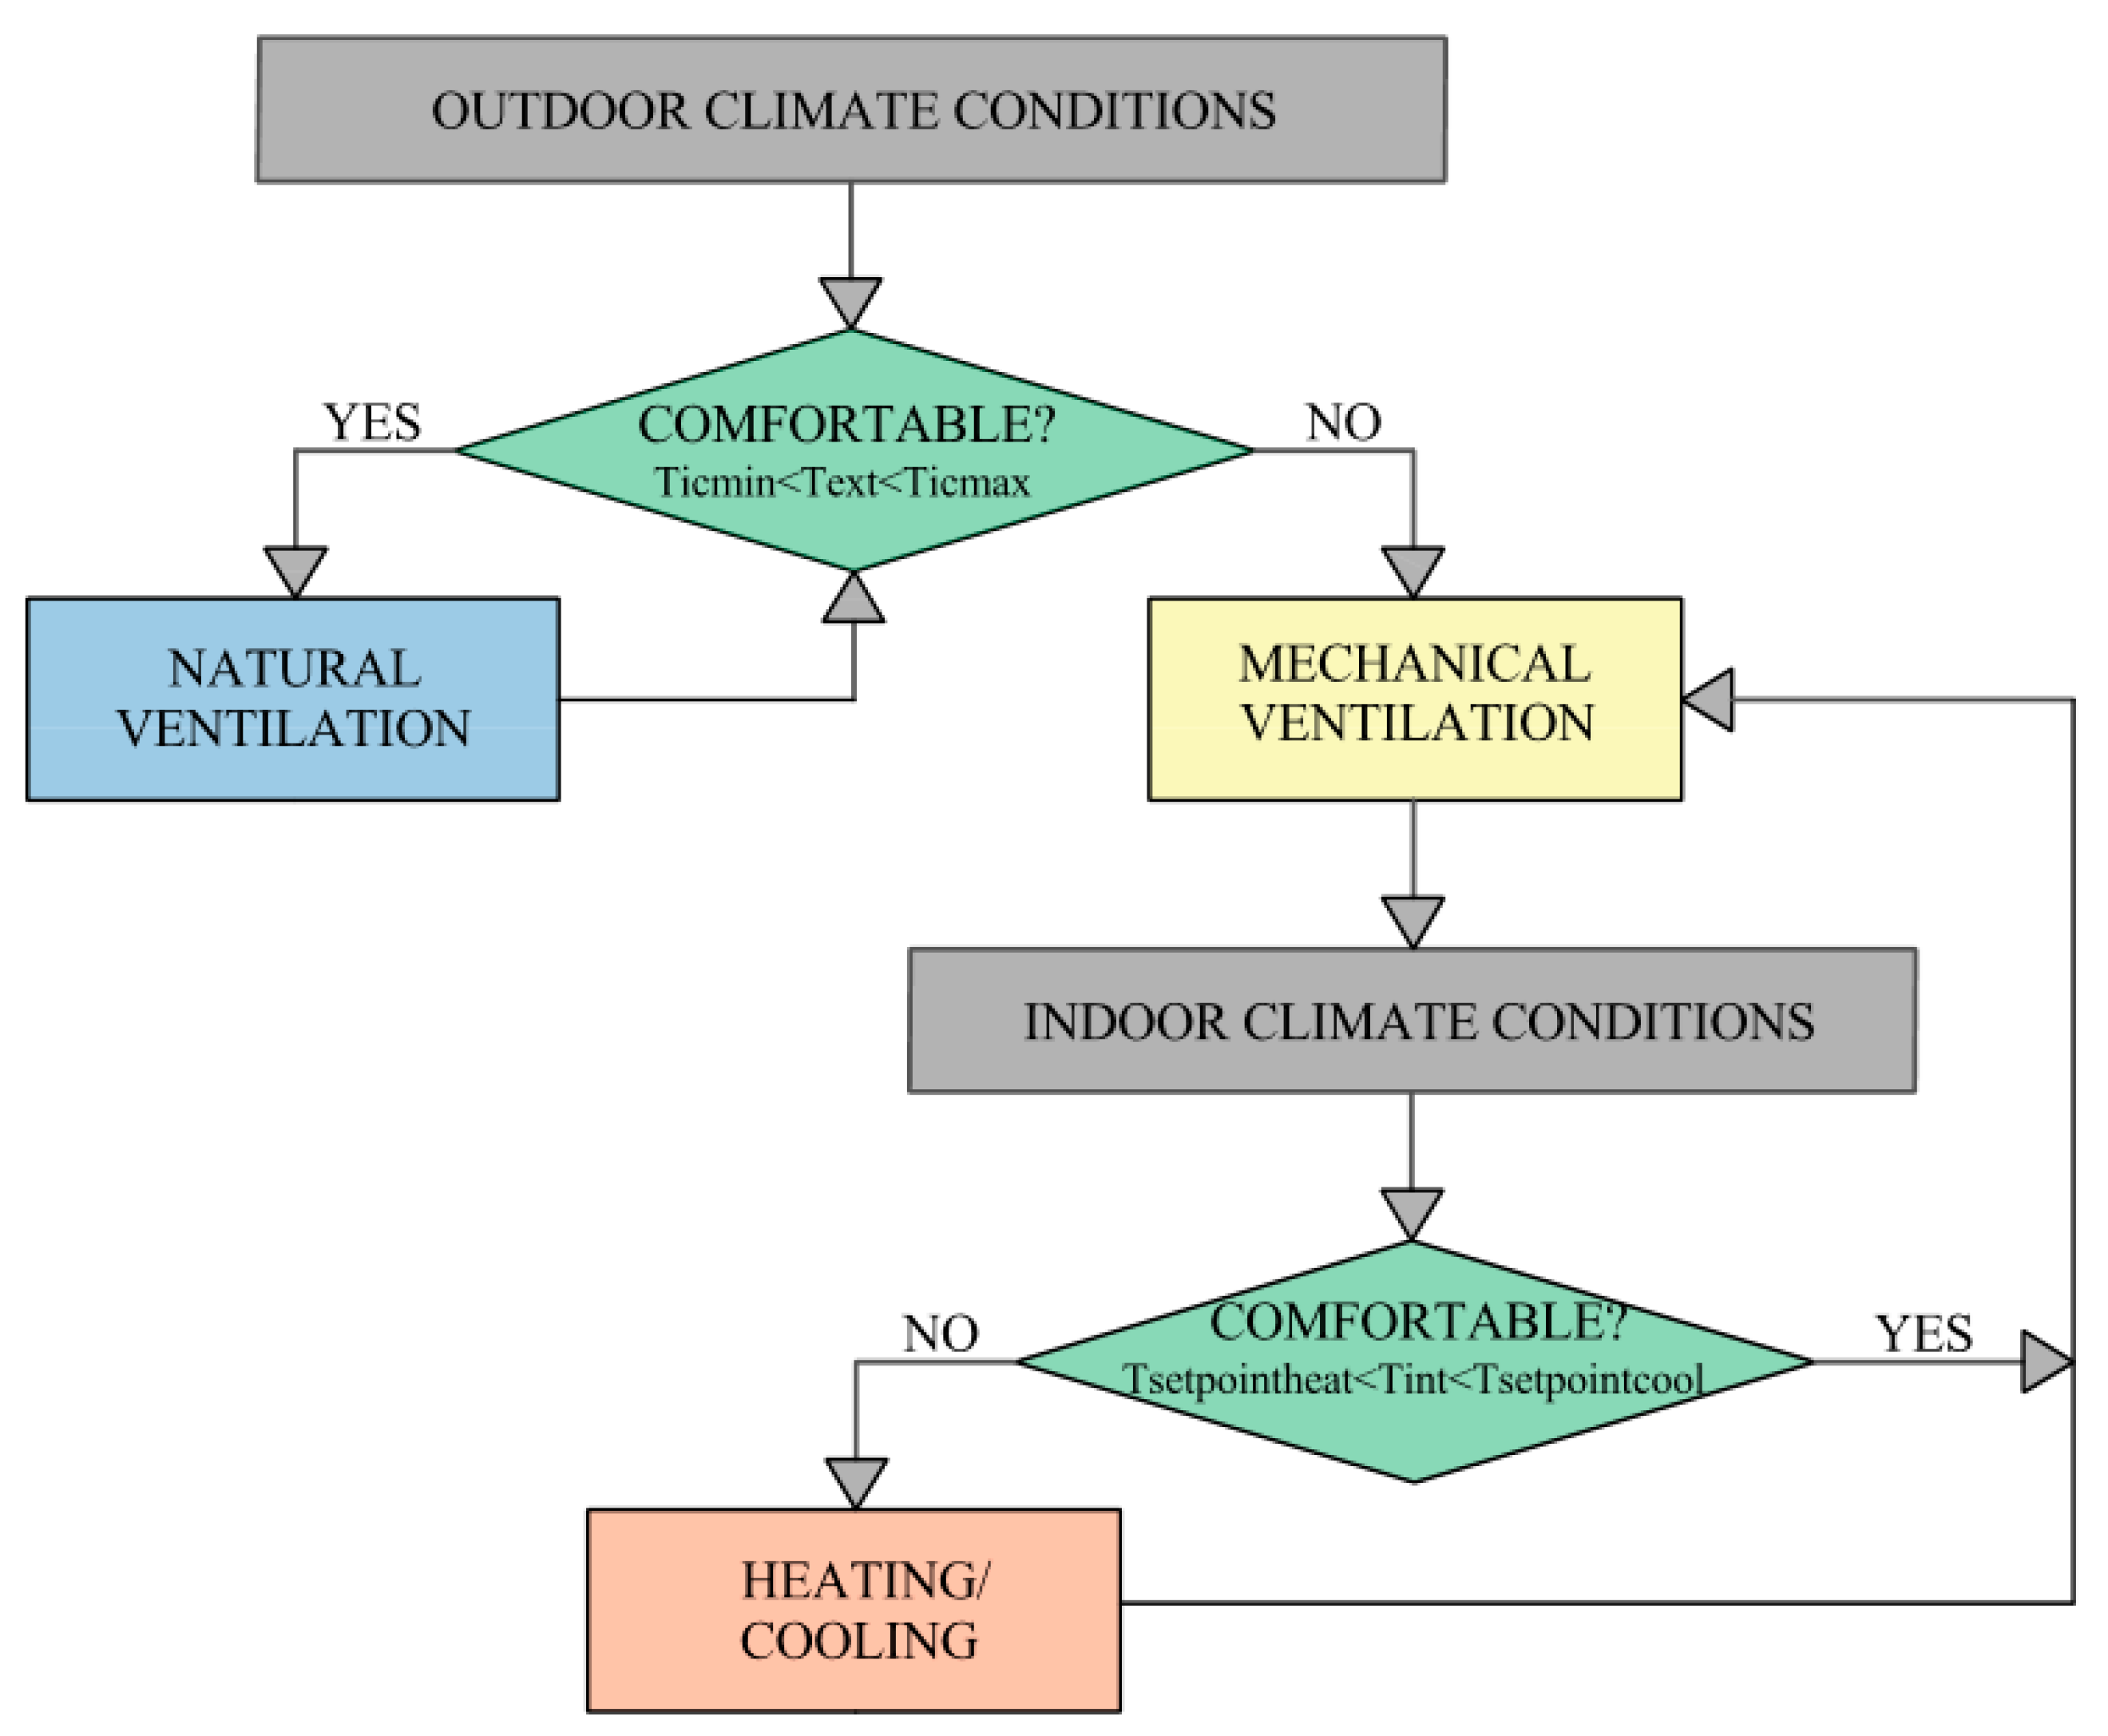
  • The ventilation air conditioning (HVAC) systems were pre-sized choosing a multi-split system (for heating and cooling), with a SCOP (Seasonal coefficient of performance) of 2.8 and a SEER (Seasonal energy efficiency ratio) of 4.1. The house is equipped with a highly efficient heat recovery mechanical ventilation system and a motorized natural ventilation system. The operation of both facilities are modulated through the algorithm shown in Figure 3, which is implemented in DesignBuilderTM and it works as follows:
    (a)
    If the outside temperature is within the previously established comfort range (Ticmin < Text < Ticmax), the natural ventilation system is activated. This allows the building to exchange excess heat, thermoregulating its interior without energy consumption.
    (b)
    If the outside temperature is out of the established comfort range, the mechanical ventilation system is activated. This avoids wasting energy due to the simultaneous operation of both vents. During periods of indoor thermal discomfort (Tint < Tsetpointheating or Tint > Tsetpointcooling), cooling and heating systems activate and work in conjunction with mechanical ventilation.
These passive and active strategies have been integrated into the energy model following the Figure 2 algorithm, to make historical, present, and future simulations. The algorithm for HVAC systems operation was recalculated in each scenario and sub-scenario, increasing the interior comfort temperature ranges and the setpoint temperatures according to the changes in exterior temperature. The uhuMEB standard requires the combination of a highly efficient external envelope with renewable energies integration -such as geothermal, photovoltaic and aerothermal, among others—to become a strict Zero Energy Building (ZEB), or even a building that produces more energy than required (+ZEB) [57,58].
Section 3.2 and Section 3.3 of this paper show the results of the energy simulations of the case study in all the mentioned scenarios and sub-scenarios. The DesignBuilderTM information about heating energy consumption, cooling energy consumption, final energy consumption and CO2 emissions was extracted. Once the final energy consumed was known, the primary energy was obtained using a conversion factor. Primary energy is the energy supplied to the building from renewable and non-renewable sources, which has not undergone any previous conversion or transformation process. It is the energy contained in fuels and other energy sources and includes the energy required to generate the final energy consumed [59]. The conversion factor, specific to each geographical area, reflects the effect of losses in the transformation, distribution and transport of primary energy (in this case study, it was set at 1.95, the peninsular conventional electricity factor for non-renewable primary energy) [60]. The calculated CO2 emissions are those associated with the electricity of air conditioning systems. DesignBuilderTM calculates the CO2 emissions of the building by multiplying the amount of energy consumed (kWh) by the CO2 emission rate (kg CO2/kWh) of the fuel [61]. The values for domestic hot water, lightning and appliances were kept constant in order to exclusively evaluate variations in heating and cooling consumption with respect to final energy consumption in each scenario.

3. Results

3.1. Assessment of the Historical, Present and Future Climate in Málaga

To evaluate the historical, present and future climate in Málaga, the climatic variables of average temperature and relative humidity were extracted from the climate files for the historical 2020, 2050 and 2080 scenarios. These parameters were obtained mathematically for the 2025 and 2030 scenarios. Current and future climate parameters were compared with climate data from the historical scenario (mean values in the range 1961–1990).
The historical scenario referring to one year is shown in Figure 4. Monthly climate variables show that extreme average temperatures are set at 25.3 °C in August and at 12.2 °C in January. The coldest months are December, January, and February, with average temperatures around 12 °C. The hottest months are July and August, with average temperatures around 25 °C. Regarding humidity, the maximum relative humidity occurs in December (71.9%) and the minimum in June (59.2%).
In the historical scenario, the average temperature is set at 18 °C and the annual relative humidity at 66.1% (Table 1).
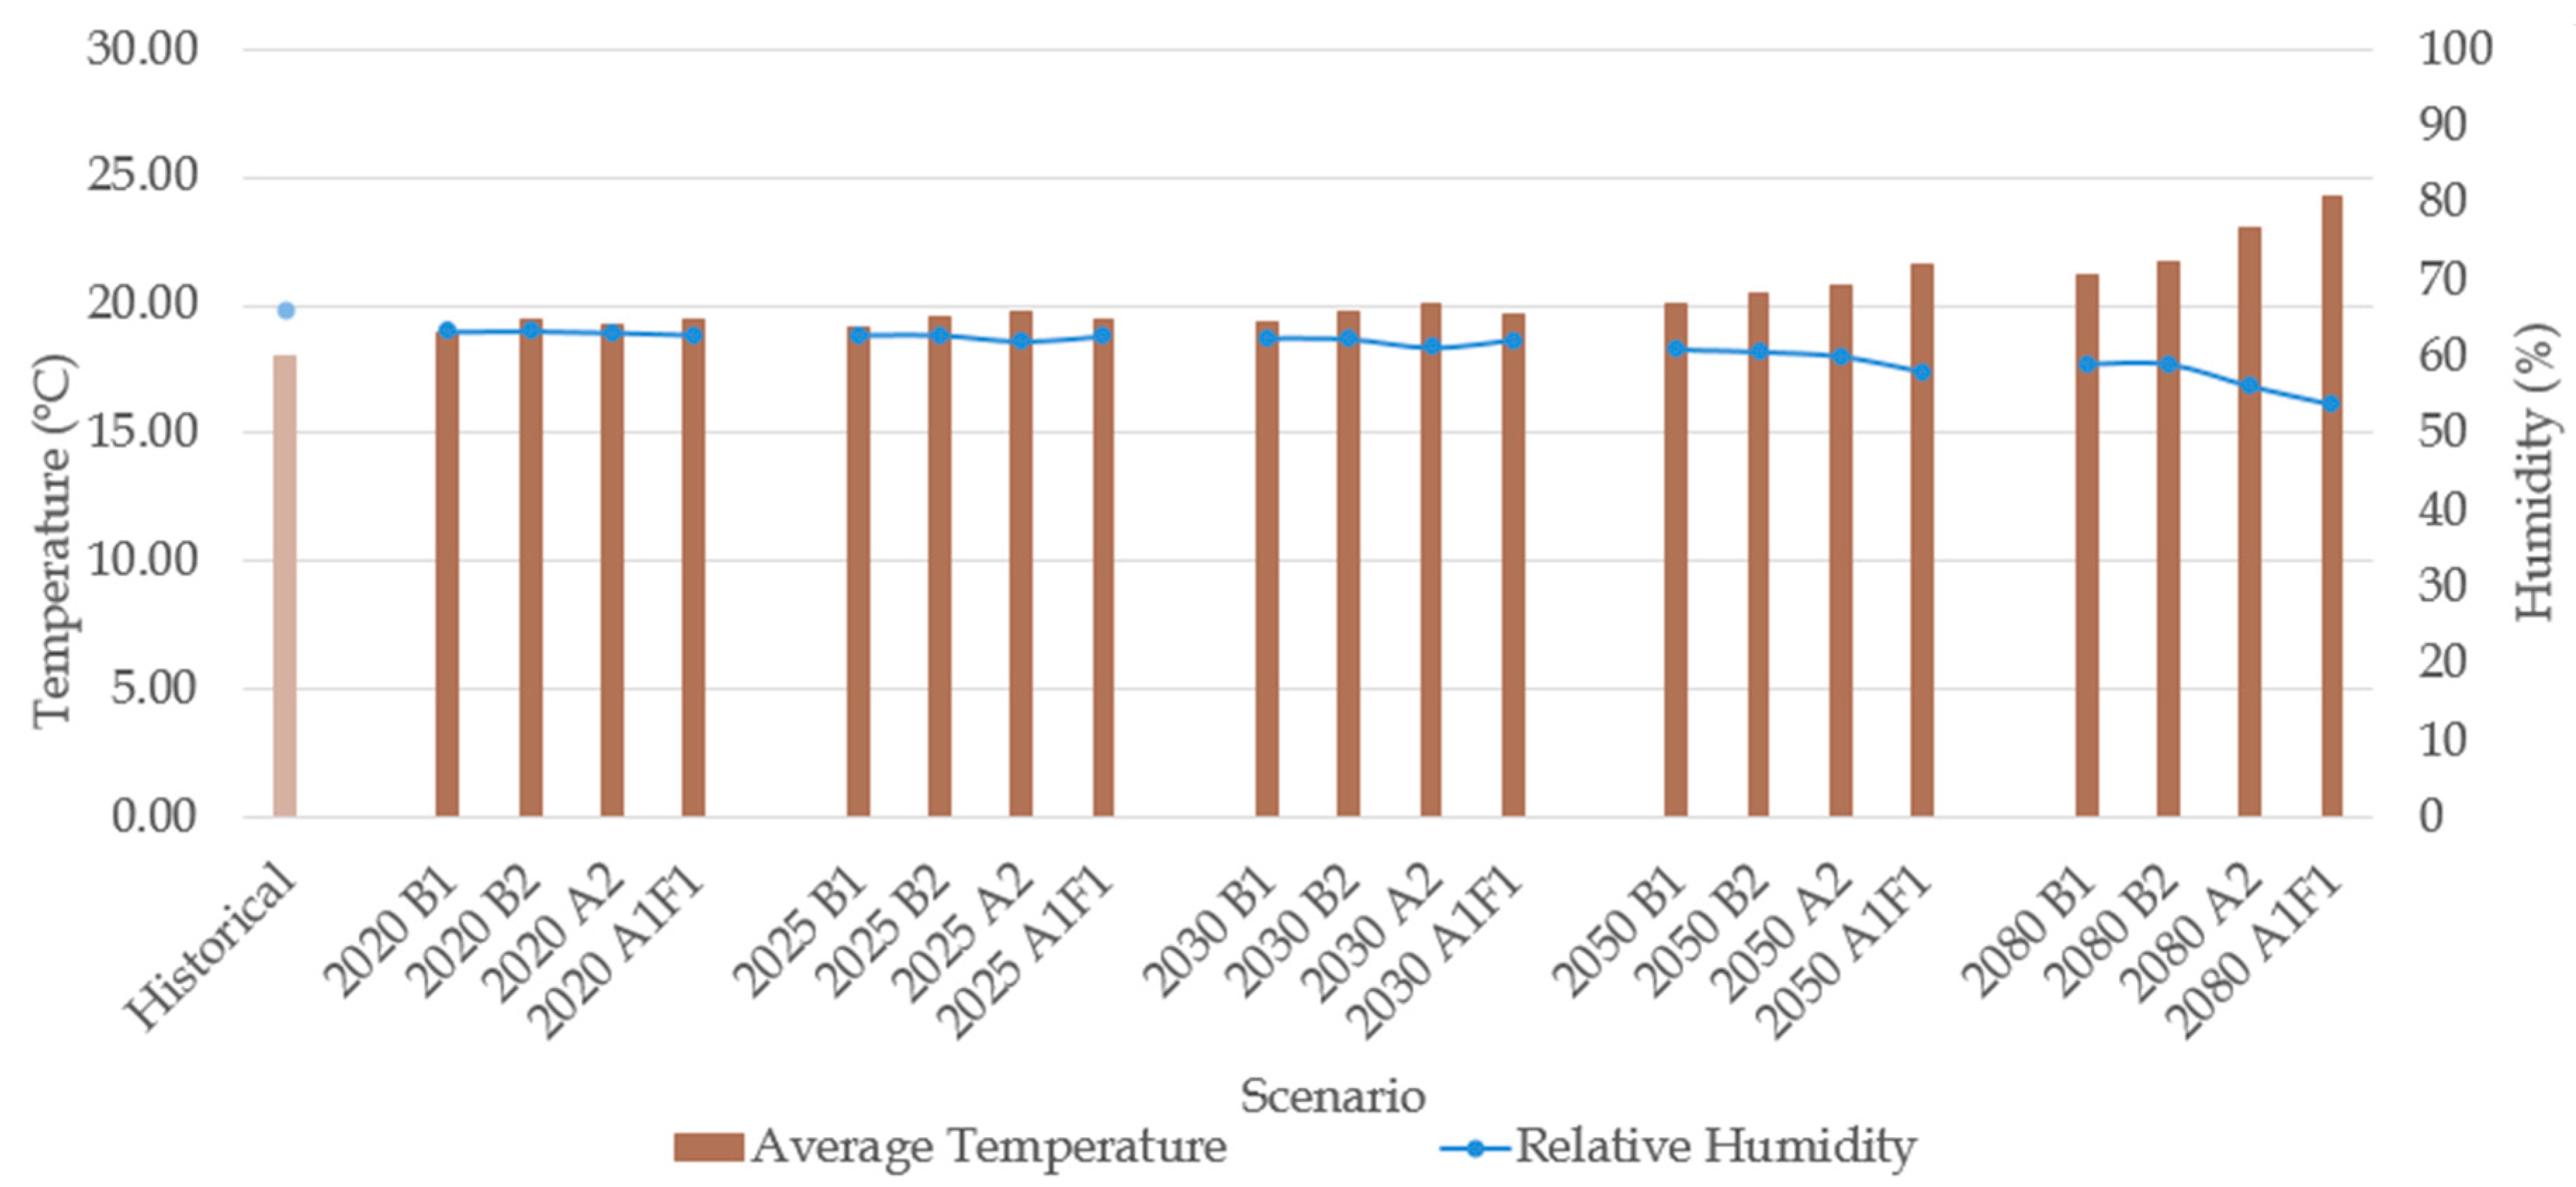
According to Figure 5, in the 2020 scenario, at the present day (June of 2020), the average temperature is expected to vary around 18.9–19.4 °C (which represents a percentage increase of 5–8%) according to the different emissions sub-scenarios. Likewise, a decrease in relative humidity is estimated in the range of 63.4–62.9% (4–5%).
In the 2025 and 2030 scenarios, in the near future, the average temperature is projected to increase in a percentage of 6–12%, reaching an average temperature around 19.1–20.1 °C. A decrease in relative humidity of 5–7% is predicted, which implies a relative humidity in the interval of 62.9–61.3%.
In the 2050 and 2080 scenarios, in the distant future, a significant increase in the average temperature and a substantial decrease in relative humidity are estimated. In the 2050 scenario, the average temperature is expected to be around 20.1–21.6 °C (increase in 12–20%) and that relative humidity is in the range of 61–58.1% (decrease in 8–12%). Finally, in the 2080 scenario, the average temperature is projected to rise by a percentage of 18–35% (21.2–24.3 °C) and that relative humidity will decrease in an interval of 11–19% (59.1–53.8%) (Figure 5, Table A1).

3.2. Evaluation of Historical, Present and Future Energy Consumption in the Building

To assess historical, present and future energy consumption in the case study building, the climate files available for the historical scenario and for the 2020, 2050 and 2080 scenarios were used. These parameters related to future energy consumption were obtained mathematically for the 2025 and 2030 scenarios. In this way, the heating, cooling, total consumption, and CO2 emissions data of the building were obtained for each scenario. Present and future energy consumptions were compared with the energy data of the historical scenario.
For the historical scenario, the data obtained from the building were: heating and cooling consumption of 1 kWh/m2 and 9.1 kWh/m2 respectively; total primary energy demand of 77.79 kWh/m2 and CO2 emissions of 24,140 kgCO2/m2 (Table 2).
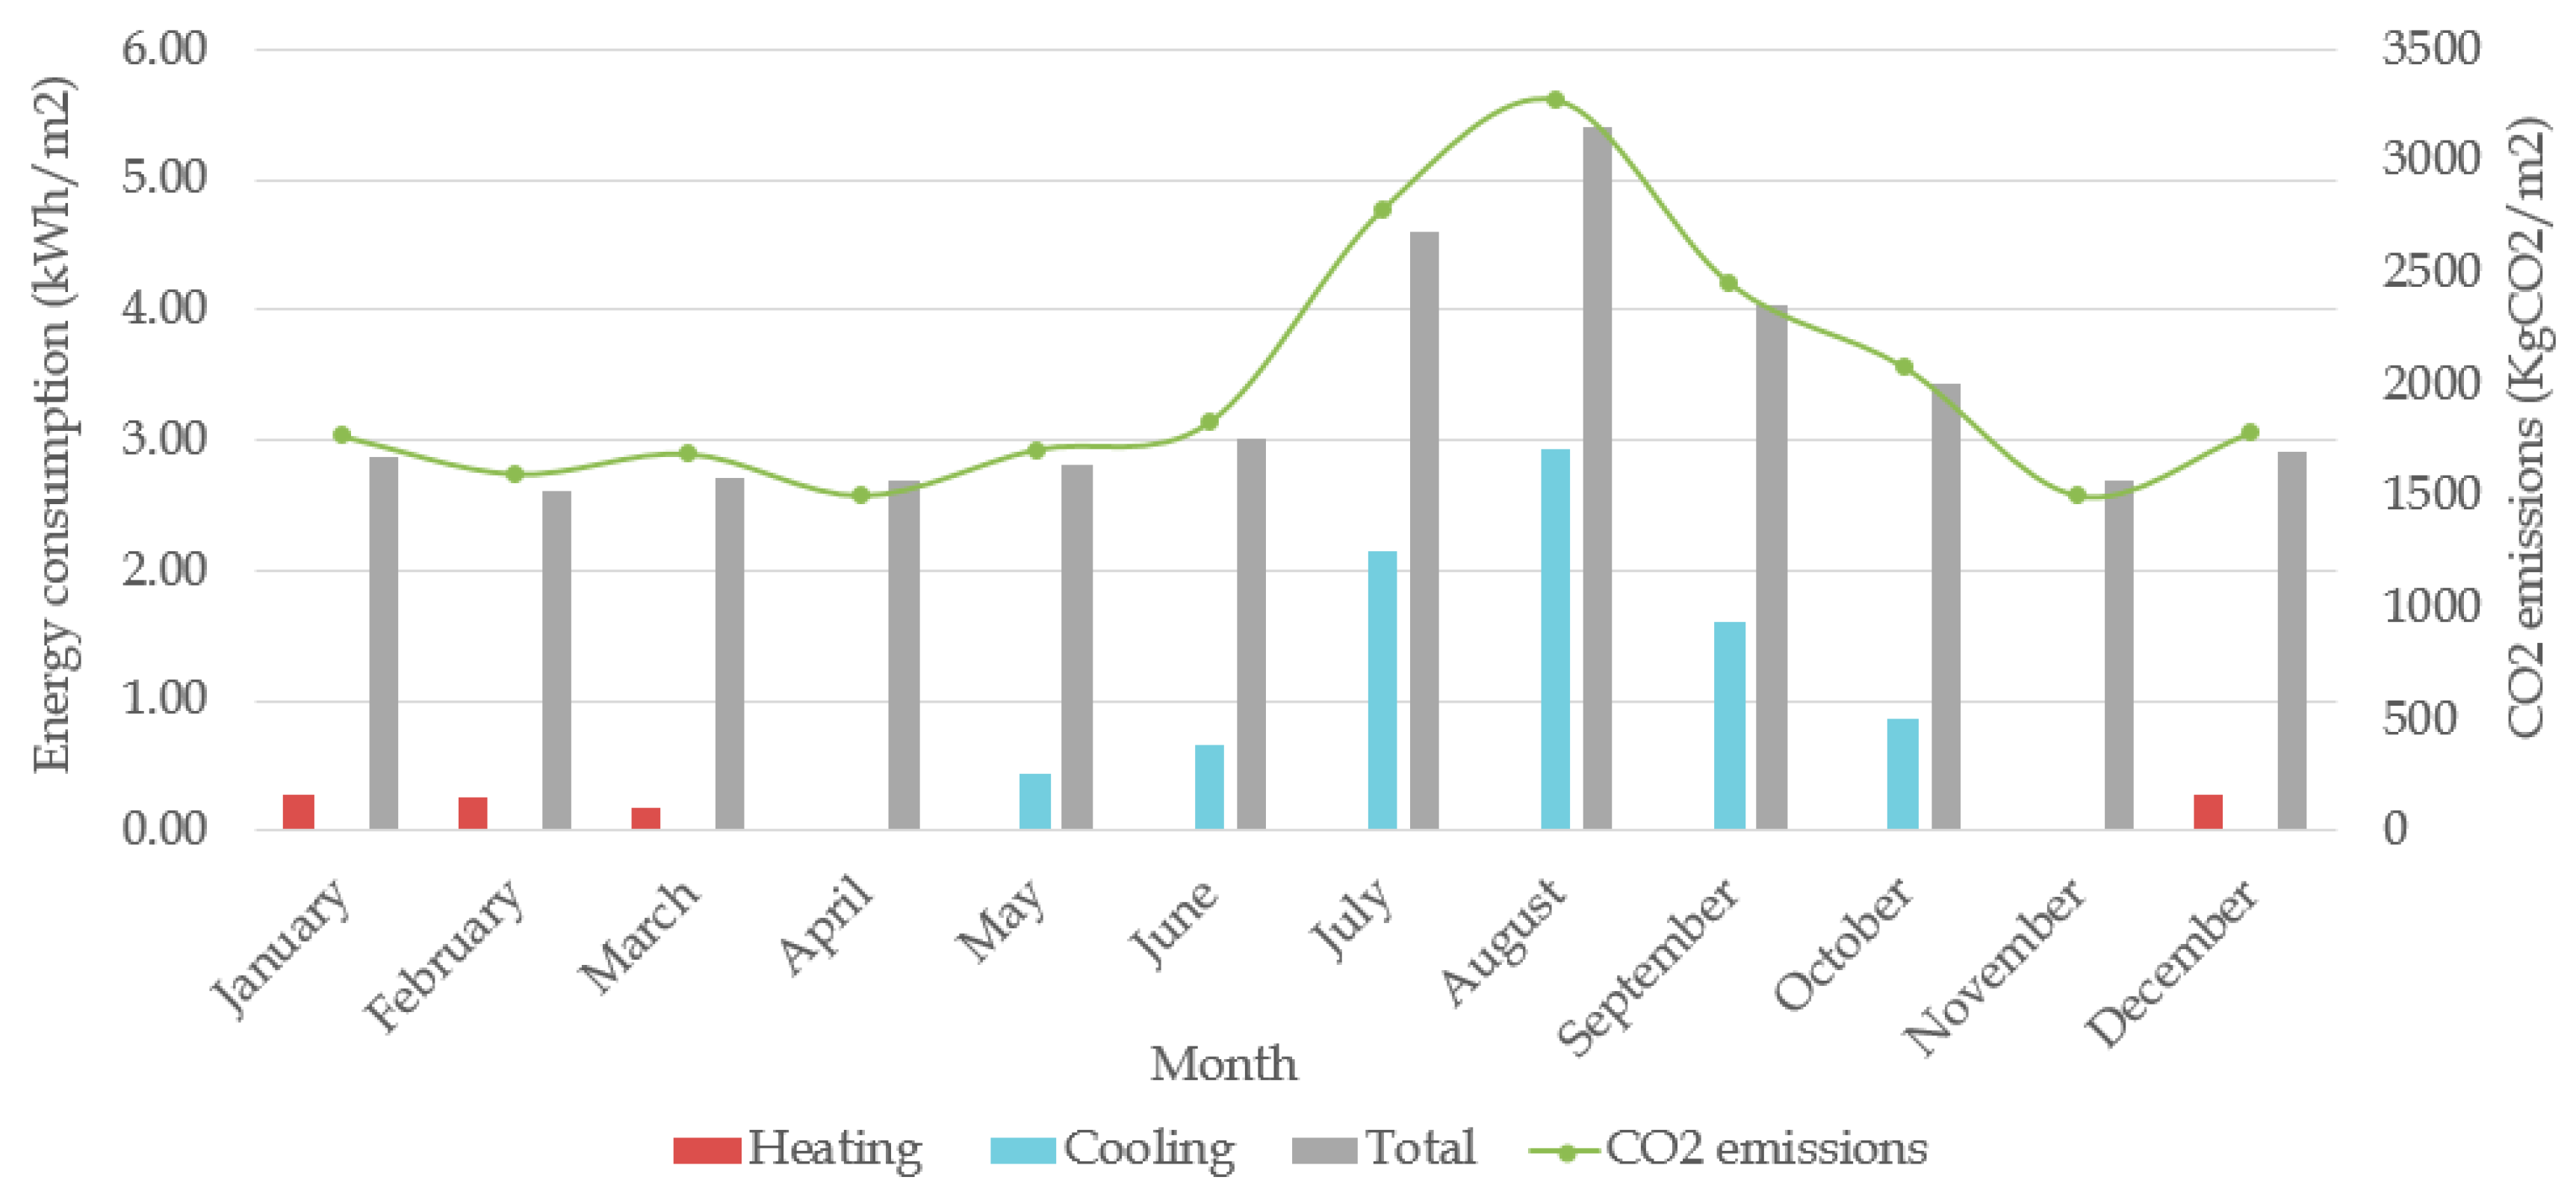
The monthly energy consumption (Figure 6) shows that heating is needed for four months (December, January, February, March), while cooling needs extend to six months (May, June, July, August, September, October). The minimum consumption of energy and, therefore, of CO2 emissions, occurs in the months of April and November when no cooling or heating is needed. On the contrary, due to the high cooling needs, the maximum energy consumption occurs in the summer months of July and August.
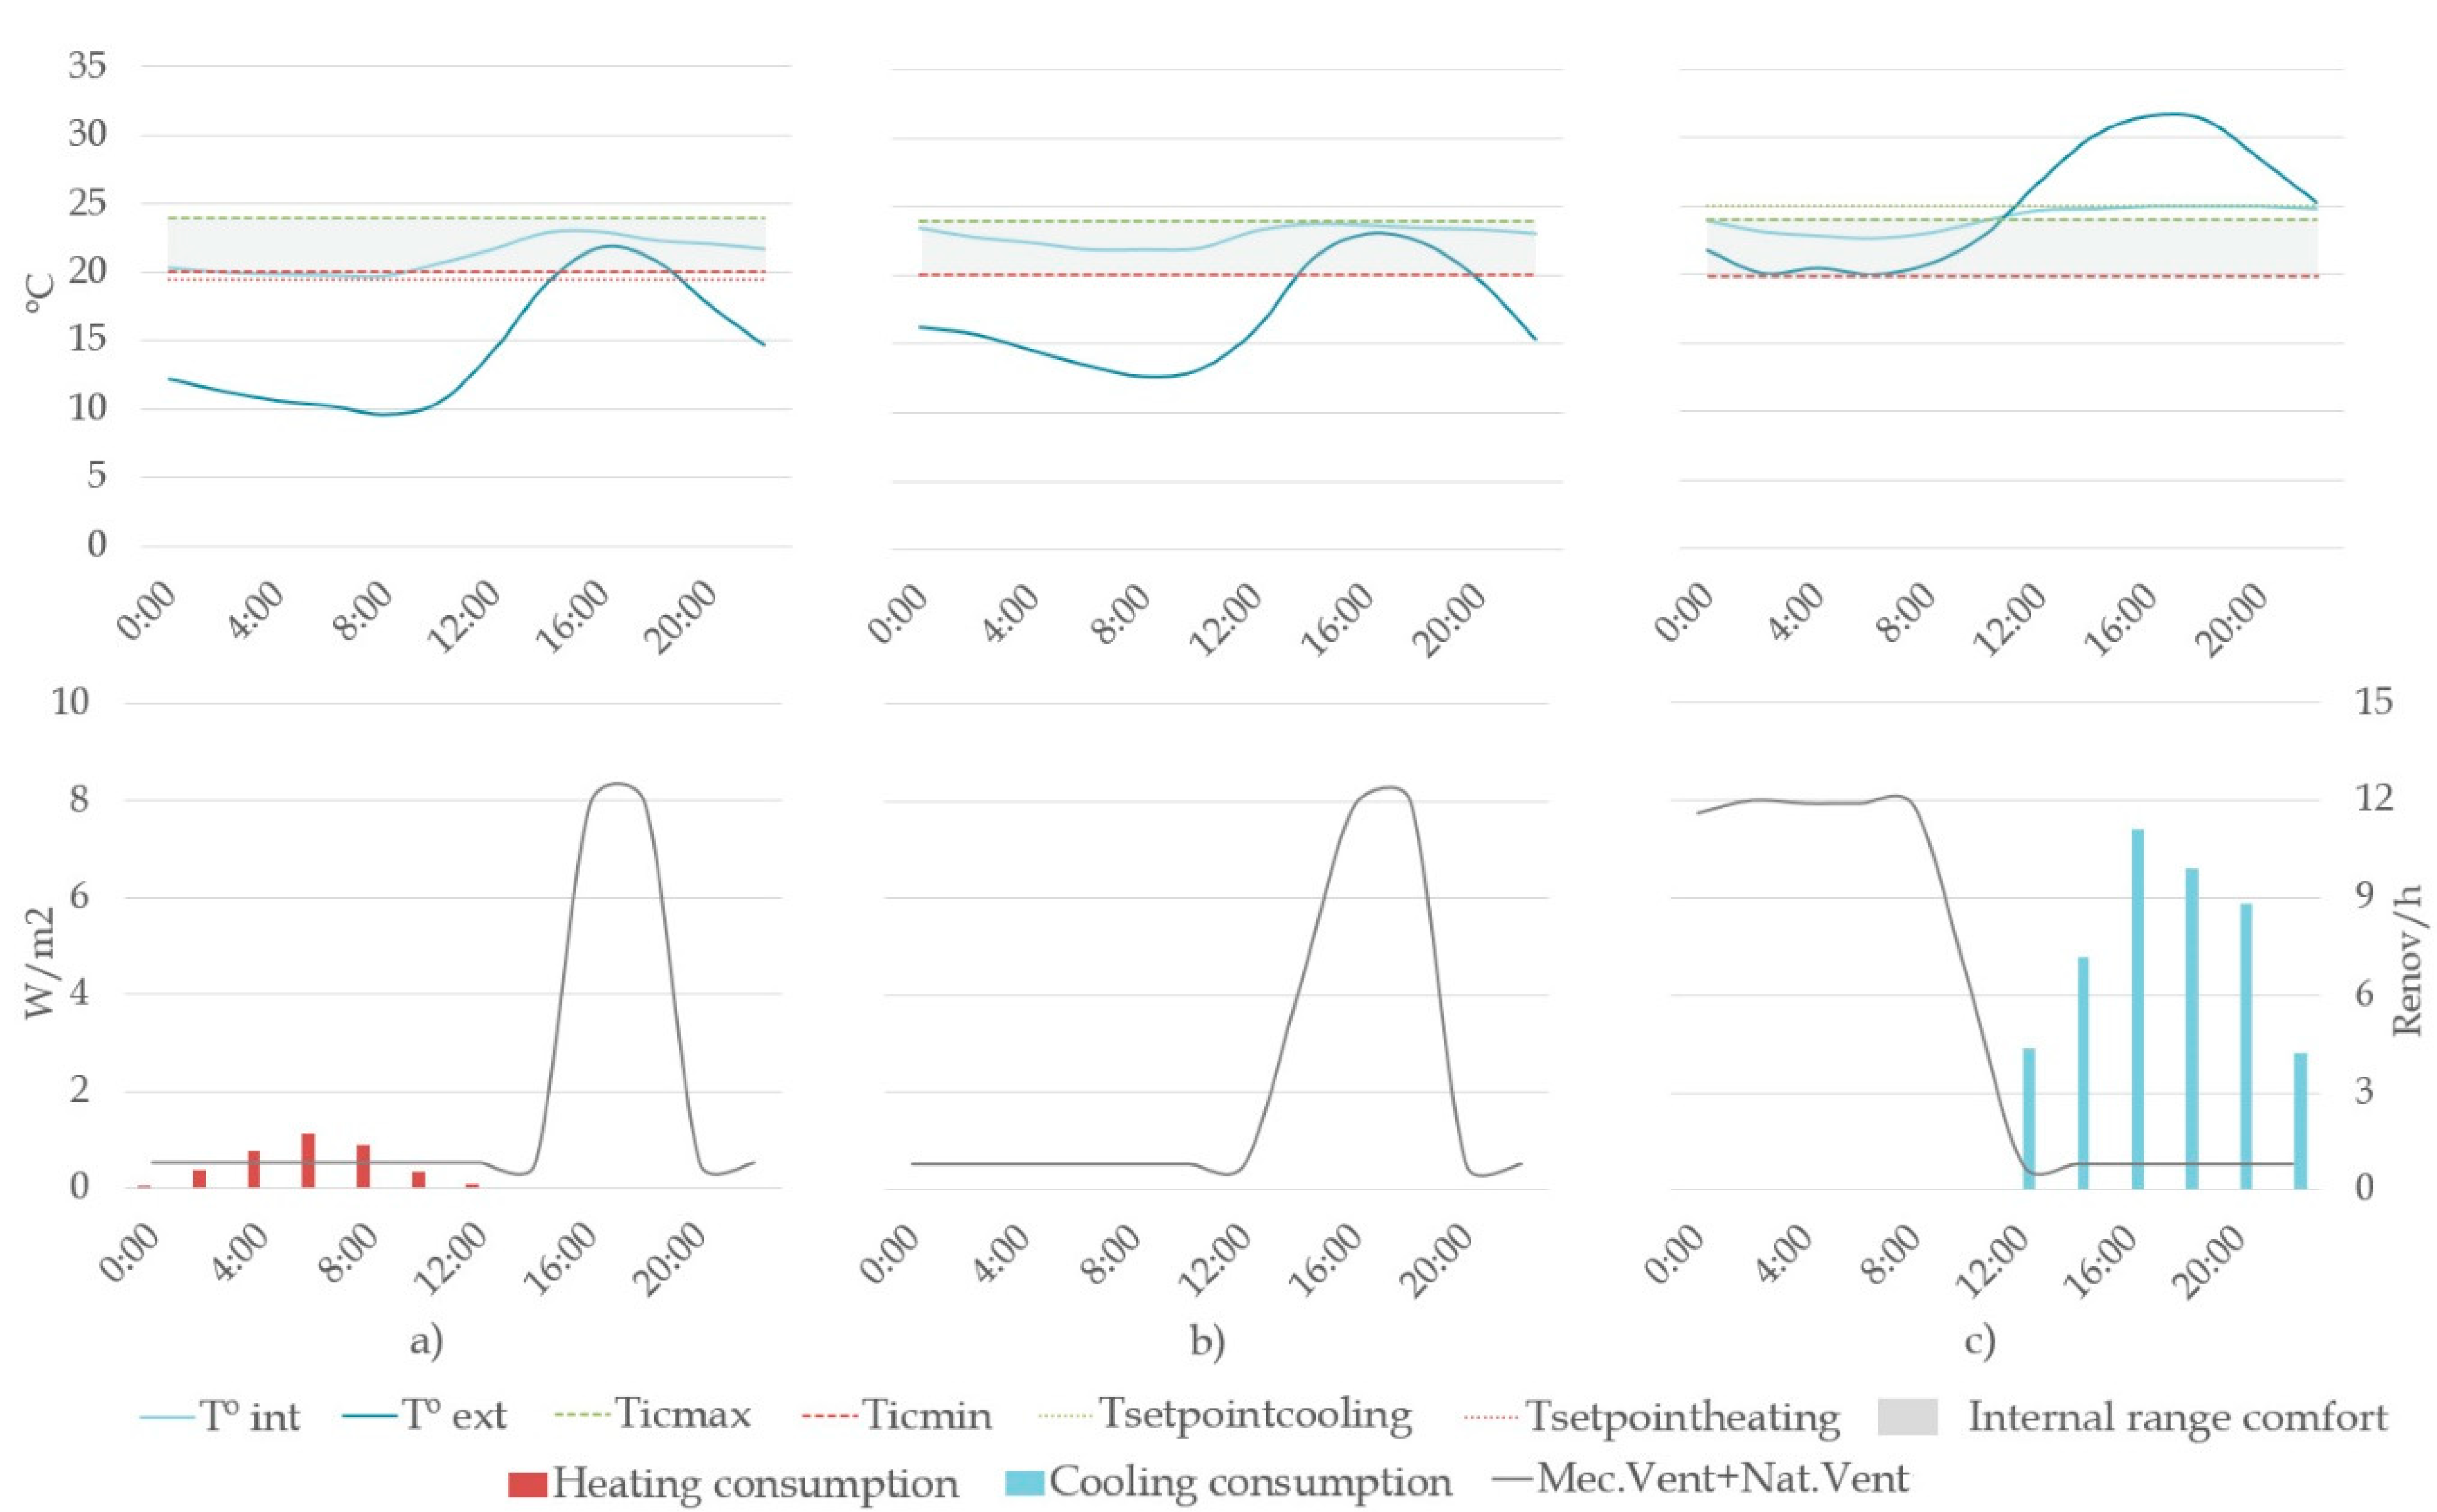
Continuing with the historical scenario, Figure 6 shows the energy consumption for three typical days with different climatic conditions. It demonstrates that the internal comfort in the building is achieved following the procedure of the previous algorithm. In the upper graphs, the internal temperature (light blue) is always in or near the range established as the interior comfort temperature. When it exceeds that range (both lower and higher), the air conditioning system is activated and the heating and cooling consumption becomes visible in the lower graphs. The outside temperature (dark blue), in the upper graphs, determines when natural ventilation or mechanical ventilation are activated (indicated in grey in the lower graphs). When the outside temperature is within the indoor comfort temperature range, the ventilation line reaches the maximum renewals/hour (which means that natural ventilation is switched on). When it exceeds this range (both lower and higher) the ventilation is sealed and marks a constant ventilation with few renewals/hour that indicates the activation of the mechanical ventilation.
In a typical winter day (Figure 7a), heating is activated during the night and natural ventilation in the early afternoon. In the typical spring/autumn day (Figure 7b), mechanical ventilation is switched on during evening, night and morning and natural ventilation in the early afternoon. In the typical summer day (Figure 7c), cooling is activated during the day and natural ventilation at night.
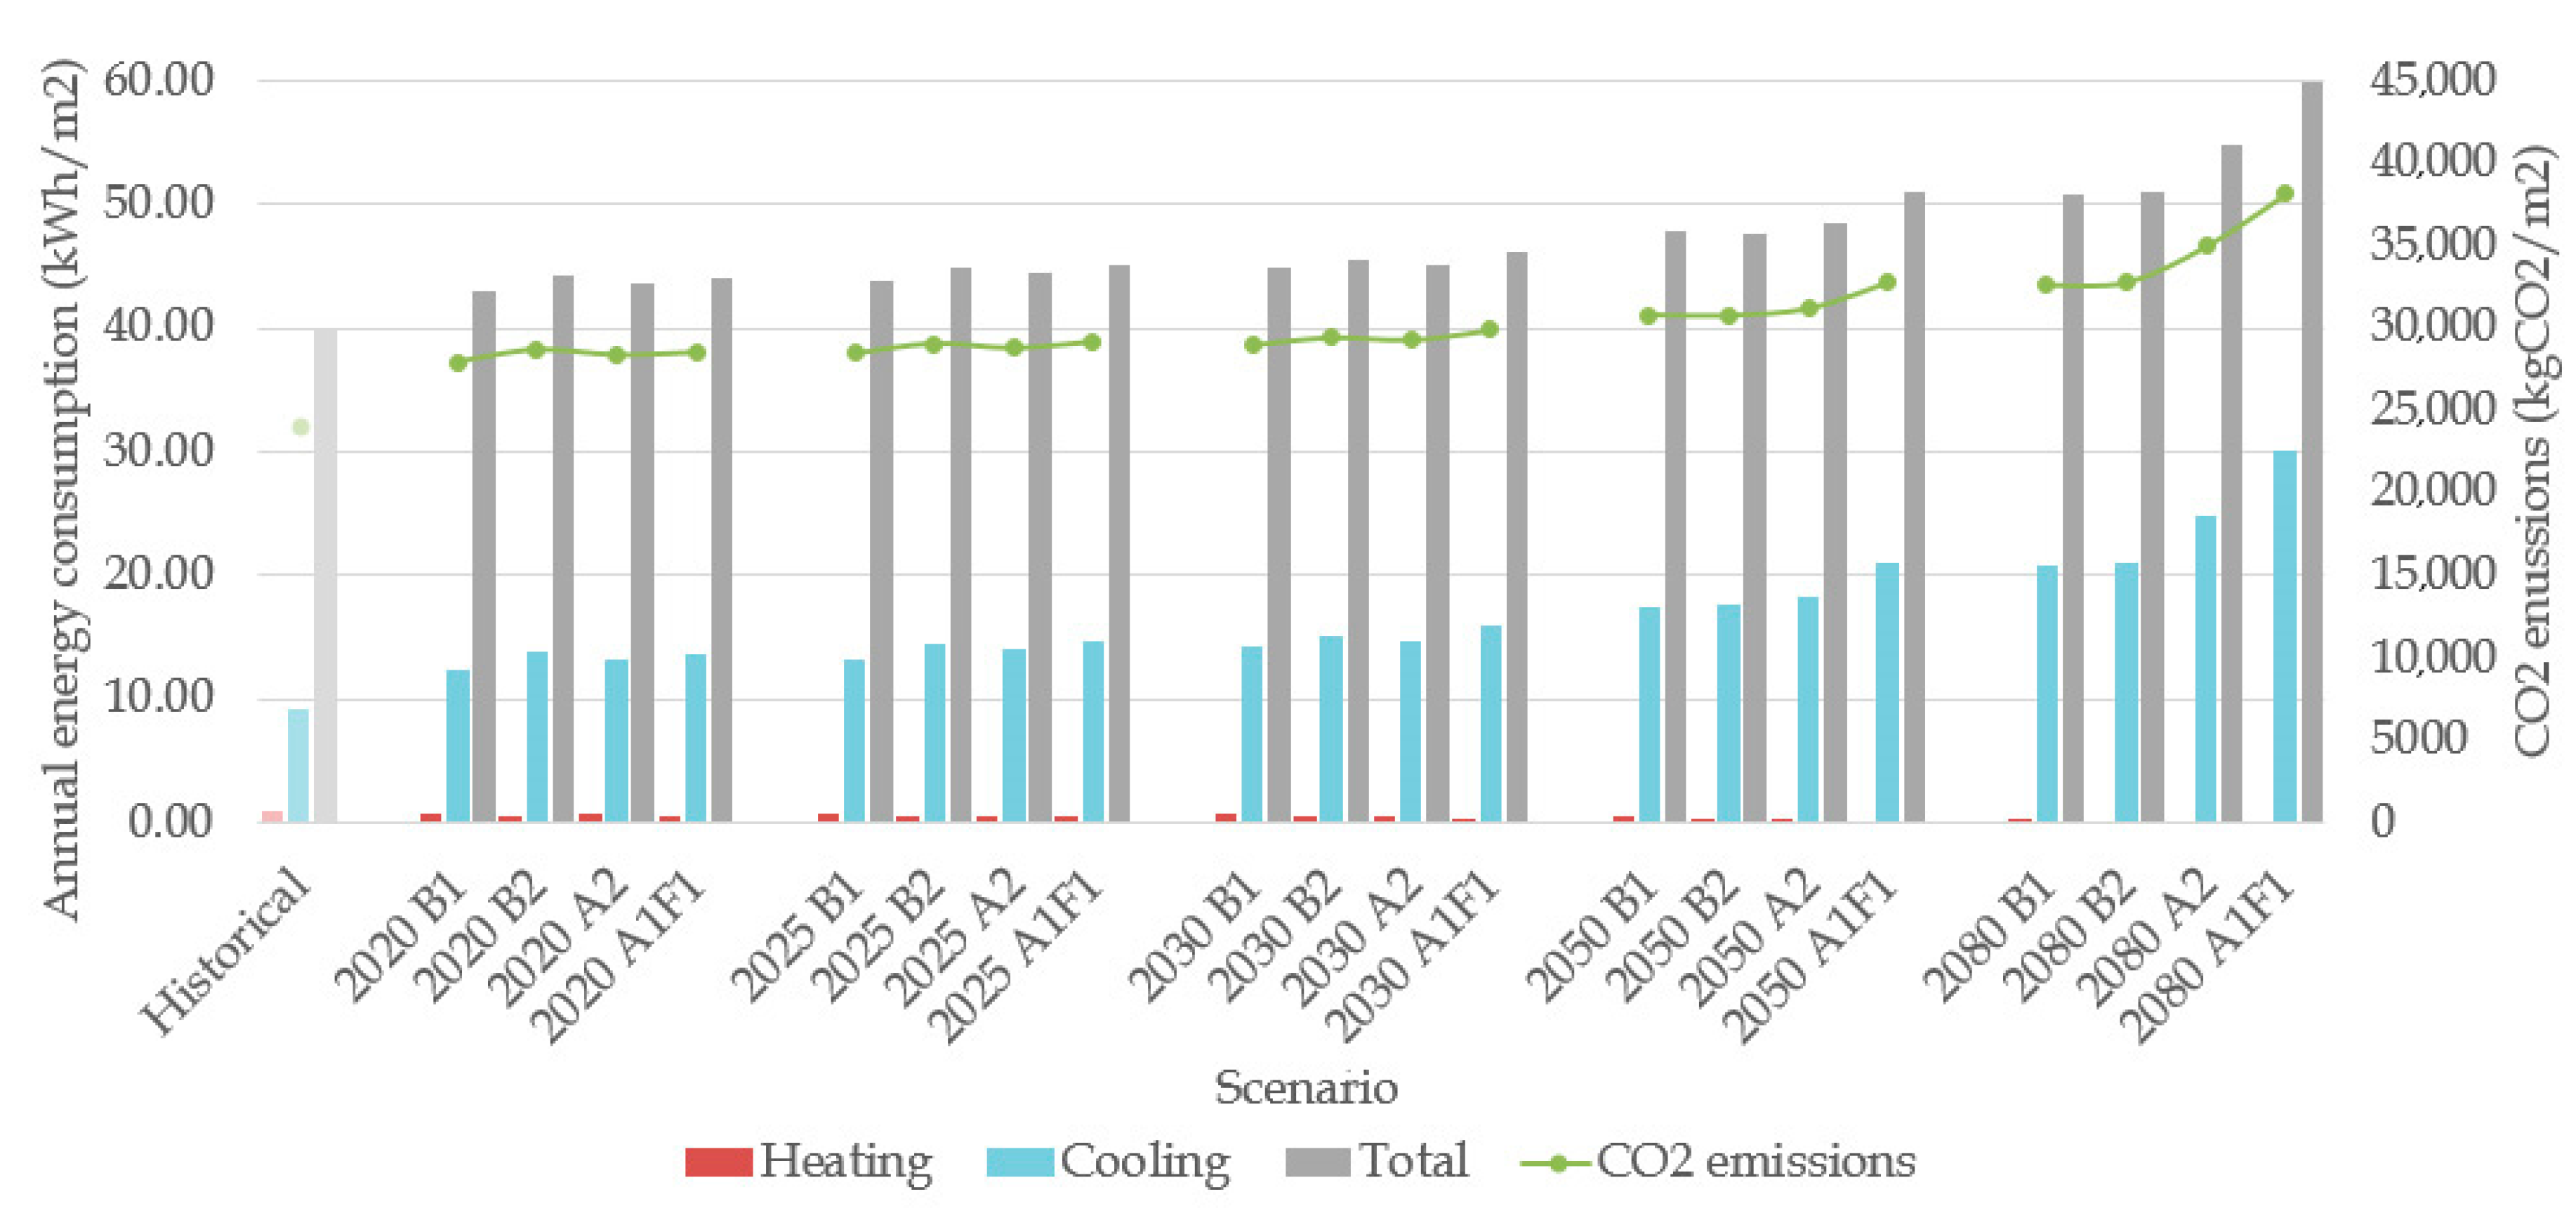
According to Figure 8, in the 2020 scenario, it is currently the month of June, heating consumption is expected to drop around 0.8–0.6 kWh/m2 (representing a percentage reduction of 20–40%). However, cooling consumption grows around 12.4–13.8 kWh/m2 (a percentage increase of 36–52%), according to the different emissions sub-scenarios. An increase in primary energy consumption is estimated in the range of 83.9–86.2 kWh/m2 (8–11%) and in CO2 emissions of 27,932–28,690 kgCO2/m2 (16–19%).
In 2025 and 2030 scenarios—at near future—heating consumption is projected to decrease in a percentage of 20–60%, reaching a heating consumption around 0.8–0.4 kWh/m2. Cooling consumption is projected to increase in a percentage of 46–75% (13.3–15.9 kWh/m2). An increase in primary energy consumption is predicted in the interval of 10–16% (85.6–89.9 kWh/m2) and in CO2 emissions of 18–24% (28,440–29,854 kgCO2/m2).
In 2050 and 2080 scenarios—at distant future—a significant decrease in heating consumption, as well as a substantial increase both in cooling and total energy consumption and in CO2 emissions are estimated. In 2050 scenario, heating consumption is expected to fall around 0.6–0.2 kWh/m2 (40–80%), and cooling consumption to rise around 17.4–21 kWh/m2 (91–131%). An increase in primary energy consumption is estimated in the range of 93–99.5 kWh/m2 (20–28%) and in CO2 emissions of 30,765–32,776 kgCO2/m2 (27–36%). In 2080 scenario, heating consumption is projected to drop in a percentage of 70–100% (0.3–0 kWh/m2), while that cooling consumption will rise the 127–231% (20.7–30.1 kWh/m2). An increase in primary energy consumption is predicted in the interval of 28–51% (99.1–116.8 kWh/m2) and in CO2 emissions of 35–58% (32,620–38,150 kgCO2/m2) (Figure 8, Table A2).

3.3. Adaptation Strategies to Mitigate the Impact of Climate Change in Energy Consumption at Distant Future

Once the impact of climate change on the building was known, several strategies were proposed and studied to mitigate it. It was developed in the distant future, 2080 scenario, which involves the building life cycle. Four mitigation measures were applied in the DesignBuilderTM model generating four new models of the 2080 scenario. Energy consumption and CO2 emissions were extracted from the simulations of these models and the results were compared with the data obtained for the 2080 scenario in the previous section. The adaptation strategies proposed could be considered in the initial stages of project design at present or incorporated in the future as the impact of climate change becomes more pronounced. The different mitigation measures applied were:
(1)
The improvement in the efficiency of heating and cooling appliances by modifying their seasonal efficiency coefficient: SCOP for heating and SEER for cooling. The SCOP was set at 4 and the SEER at 5.6. These are high energy efficiency values that correspond to A+ certification standards. As technology advances, these values will become more optimal in the future. If the response of the energy consumption of the building is effective for this increase of values according to the current ones, it will be possible to estimate how higher values of SCOP and SEER will affect the energy performance. This mitigation measure was applied to the first model called: (a) 2080 scenario.
(2)
The control of the quality of the air that flows into the house through the installation of CO2 sensors. This mitigation measure was applied to the second model called: (b) 2080 scenario.
(3)
The change of the hermetic properties of the dwelling by increasing and reducing the thermal insulation of the envelope. It would be possible to add thermal insulation on the inside of the envelope applying a panelling system, or on the outside using a SATE-type façade; as well as to reduce it, extracting layers of the insulation.
3.1
The increase of the thermal insulation with a thermal transmittance in the opaque envelope of U = 0.2 W/m2K and a thermal transmittance in the transparent envelope of U = 0.5 W/m2K. This mitigation measure was applied to the third model called: (c) 2080 scenario.
3.2
The reduction of the thermal insulation with a thermal transmittance in the opaque envelope of U = 0.4 W/m2K and a thermal transmittance in the transparent envelope of U = 1.5 W/m2K. This mitigation measure was applied to the fourth model called: (d) 2080 scenario.
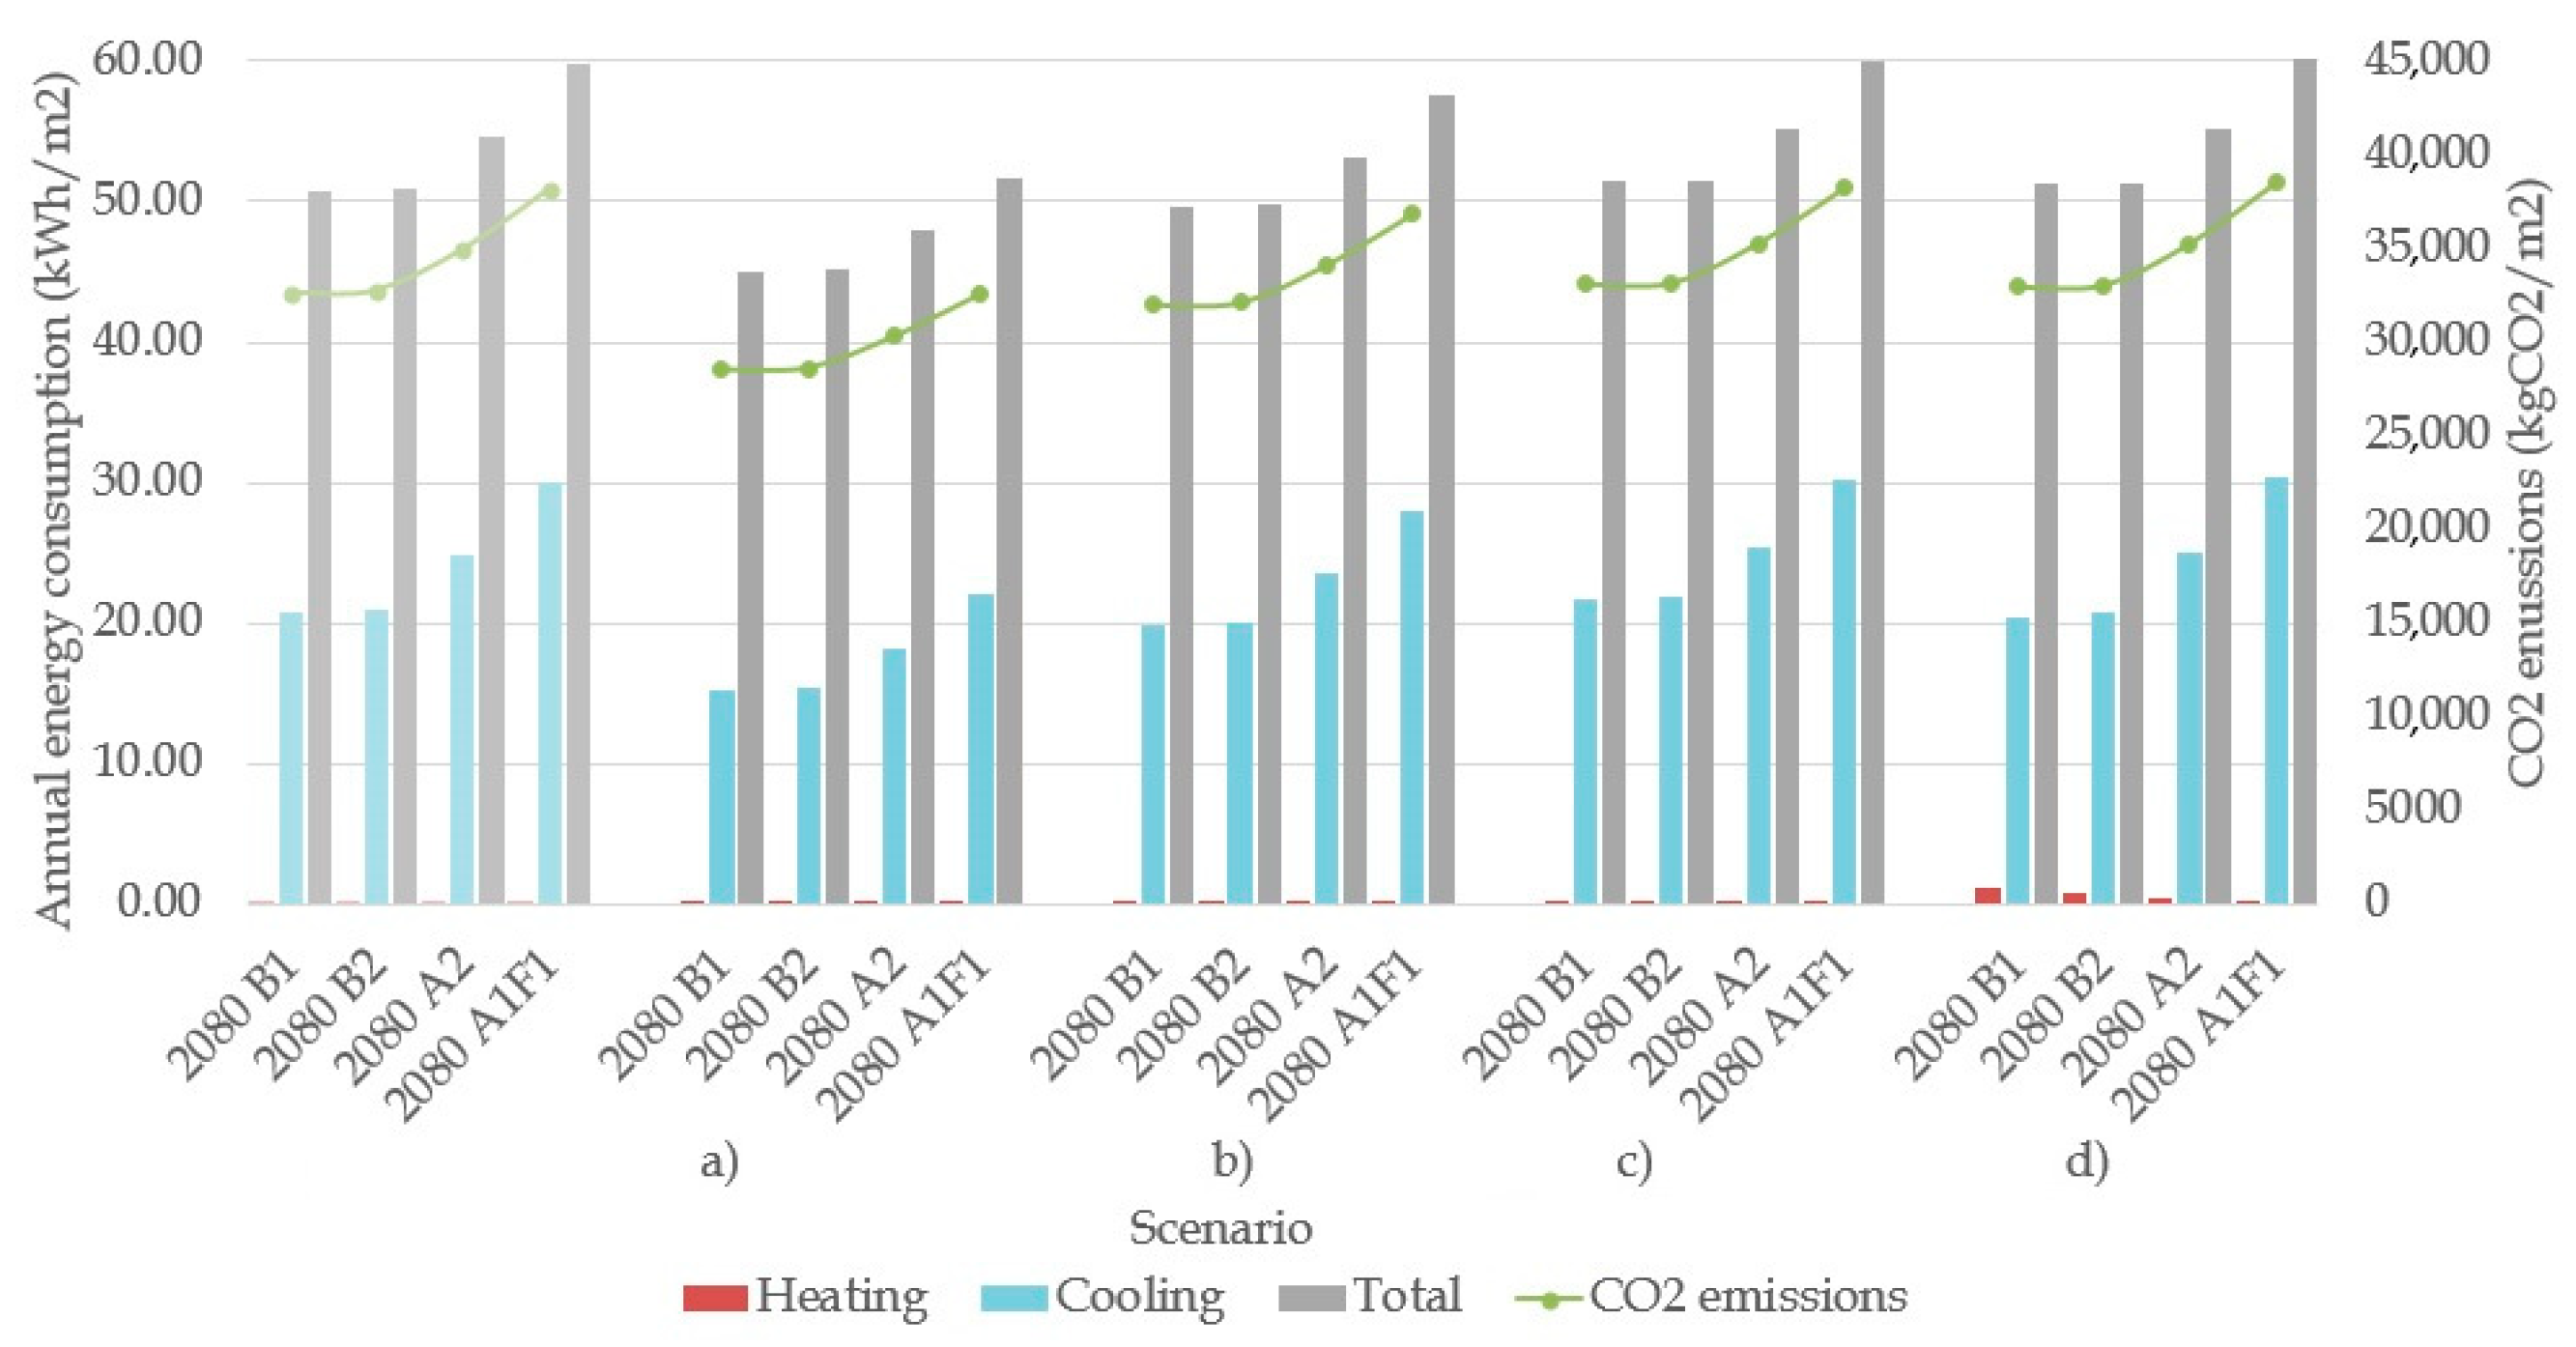
According to Figure 9, in (a) 2080 scenario, heating consumption is expected to decrease around 0.2–0 kWh/m2, and cooling consumption around 15.1–22 kWh/m2, representing a reduction percentage of 33–100% for heating and of 27% for cooling. A reduction in primary energy consumption is estimated in the range of 87.9–101 kWh/m2 (11–14%) and in CO2 emissions of 29,240–33,240 kgCO2/m2 (10–13%).
In (b) 2080 scenario, heating consumption is projected to decrease in a percentage of 50–100%, reaching a heating consumption around 0.1–0 kWh/m2. Cooling consumption is projected to decrease in a percentage of 5–7% (19.7–27.9 kWh/m2). A reduction in primary energy consumption is predicted in the interval of 2–4% (96.7–112.5 kWh/m2) and in CO2 emissions of 2–3% (31,972–36,828 kgCO2/m2).
In (c) 2080 scenario, heating consumption is expected to be 0 kWh/m2 (a percentage reduction of 100%). Also, cooling consumption is expected to grow around 21.8–30.2 kWh/m2 (a percentage increase of 0–5%). So, an insignificant increase in primary energy consumption is estimated in the range of 100.6–117 kWh/m2 (0–2%) and in CO2 emissions of 33,115–38,225 kgCO2/m2 (0–2%).
In (d) 2080 scenario, heating consumption is projected to increase in a percentage of 200–300% (0.2–1.1 kWh/m2). However, cooling consumption is projected to decrease in a percentage of 0–1% (20.4–30.1 kWh/m2). So, again, an insignificant increase in primary energy consumption is predicted in the interval of 0–1% (100–117.2 kWh/m2) and in CO2 emissions of 1% (32,954–38,508 kgCO2/m2) (Figure 9, Table A3).

4. Discussion

In this section, the results in the range of time obtained (2020–2080) are discussed to know the evolution of average temperature, relative humidity, consumed energy, and CO2 emissions during the building life cycle. The results generally show an increase in temperature due to progressive global warming over the years. This is reflected in the energy consumption of the building, mainly due to the increase in cooling consumption as time passes.
The results of the climate variation shows that the subtropical climate of southern Spain is expected to evolve into a warmer and drier climate with an increase in average temperature and a decrease in relative humidity. The results project a maximum average temperature increase in: 0.9–1.4 °C in 2020, 1.1–2.1 °C between 2025 and 2030, 2.1–3.6 °C in 2050, and 3.2–6.3 °C in 2080. The reduction in relative humidity is estimated at: 2.7–3.2% in 2020, 3.2–4.8% between 2025 and 2030, 5.1–8% in 2050, and 7–12.3% in 2080.
This variation in the climate pattern was similar in other investigations located in the Mediterranean area: the average temperatures in Rome, Valencia and Seville are expected to increase by 4.9 °C, 5.17 °C and 4.1 °C, respectively, in the time period of 2050–2100 [32,41,43].
Climate change projections suggest that heat waves will be more frequent and severe during this century in southern Europe as a result of rising night-time temperatures and their direct relationship with relative humidity. In the case of Spain and the Mediterranean region, [62] it shows that the frequency of heat wave days will increase by an average of 13 days per summer by 2021–2050 and 40 days by 2071–2100. Other global simulations show that the increase in temperature and the reduction in relative humidity will cause a 10% increase in drylands by 2100 [63].
The results of the future simulations carried on indicate high percentages of variation in the building’s total energy consumption. Although heating is not expected to be necessary when the building’s life cycle is completed (reducing its consumption in a range of 70–100%), cooling consumption is expected to increase in the range of 11.6–21 kWh/m2 (127–231%). This significant increase in cooling demand overlaps the marginal reduction in heating consumption, boosting the building’s total electricity consumption and CO2 emissions. Thus, a maximum change in primary energy consumption of 21.4–39.1 kWh/m2 (28–51%) and for CO2 emissions of 8480–140,010 kgCO2/m2 is estimated. Despite the high percentage of energy consumption, it is necessary to take into account that countries’ regulations on energy issues are becoming increasingly strict. If the introduction of renewable energies into the global electricity mix continues along the same lines, energy consumption would increase to the estimated minimum (28%—related to sub-scenario B1). Thus, 23% of primary energy would be compensated through the use of renewable energies.
The reduction in heating consumption is estimated at: 0.2–0.4 kWh/m2 in 2020, 0.2–0.6 kWh/m2 between 2025 and 2030, and 0.4–0.8 kWh/m2 in 2050. The results project a cooling consumption increase in: 3.3–4.7 kWh/m2 in 2020, 4.2–6.8 kWh/m2 between 2025 and 2030, and 8.3–11.9 kWh/m2 in 2050. The increment in primary energy consumption is set at: 6.1–8.4 kWh/m2 in 2020, 7.8–12.1 kWh/m2 between 2025 and 2030, and 15.2–21.7 kWh/m2 in 2050. Finally, CO2 emissions are projected to increase in: 3792–4550 kgCO2/m2 in 2020, 4300–4550 kgCO2/m2 between 2025 and 2030, and 6625–8636 kgCO2/m2 in 2050.
In global terms, Wong et al. [64] and Invidiata and Ghisi [65] estimated increases in energy consumption about 54–75% and 185% in residential buildings located in subtropical climates typical from Singapore and Brazil respectively for 2080 scenario. In regional terms, Pérez-Andreu et al. [41], Escandon et al. [43], and Suarez et al. [42] predicted increases in cooling consumption of 30 kWh/m2, 41 kWh/m2 and 20 kWh/m2 in Valencia, Seville, and Cordoba respectively, in the time frame between 2050 and 2100.
An inherent aspect of predicting future building performance is the uncertainty associated with the building itself and the operating conditions of the materials and systems (i.e., they may deteriorate over time and be replaced or upgraded) [66]. The evaluation of historical, present and future energy consumption in the building was carried out maintaining the starting materials and systems. In other words, the obsolescence of these is assumed in future simulations. For this reason, mitigation measures were proposed a posteriori by updating the characteristics of the systems, changing some materials and introducing new technological control devices to analyse how these could improve the consumption trend. As mentioned previously, the building was designed to meet the uhuMEB standard whose methodology proposes a monitoring of the building constructed to maintain its energy classification during its lifetime and may require successive energy renovations. This methodology proposes a corrective maintenance (specific reviews), preventive (periodic reviews) and predictive (constant monitoring) of the built building [45,47].
The future development of systems installed in buildings is expected to follow lines related to digitisation, automation and sensorics [67]. On the other hand, the future development of building materials focuses on the recycling, reuse and recovery of building waste due to its potential to save energy in global terms [68]. Other research points to the use of nanotechnology in the properties of materials to generate green building materials [69].
The results of the adaptation strategies to mitigate the impact of climate change on the building’s energy consumption during its life cycle shows that the first two measures carry on a reduction in total electricity consumption: the increase of the efficiency of HVAC systems indicate a reduction of 11–14% whilst the control of the air renovation flow into the dwelling reduces 2–4%. It has to be highlighted the importance of an efficient mechanical systems operation, and the airtightness in buildings to ensure a more sustainable future.
However, the last two measures related to the increase and reduction of the thermal insulation of the building envelope make insignificant changes in terms of energy consumption: approximately an increase of 1% in both cases. What corresponds to the related scientific literature. Indeed, Barbosa et al. [33] and Escandon et al. [43] concluded that the effect of insulation strategies in the future scenarios appears to be limited. They are not effective in resolving issues in overheating, and even cause a slight increase in the percentage of discomfort hours when the projected building is close to efficiency like in this case study. Fosas et al. [70] demonstrate that the risk of overheating not only depends on the thermal insulation envelope. Other parameters like latitude, climate, thermal mass, sun shading, window to wall ratio, occupancy, infiltration, ventilation, orientation, and thermal comfort are relevant to estimate if insulation led improvements in energy consumption.
Another adaptation strategies related to the lighting load, which is not evaluated in this research and is supposed at a constant value in each scenario and changes in the window to wall ratio which has provided improvements in results in other research could be studied in future investigations [9,64].
There are some constraints in this research related to the methodology applied. It should be noted that neither EPW, TMY nor HadCM3 projection is sufficient to represent extreme weather conditions (such as heatwaves, storms, or seasonal precipitations), since extreme weather occurs more randomly and is hard to predict through GCM models [13]. Another constraint of the historical climate files available on the EnergyPlus website derives from their origin: they are measurements made at airports located in rural areas near large cities. If the building to be simulated is located in a city centre, it may be affected by the local heat island, and the database used as input to the software should take this phenomenon into account. Ciancio et al. [71] made a review of this problematic and created its appropriate input climate file through a WRF (Weather Research and Forecasting) with measurements of the centre city of Rome. They concluded that the climate data of the interior of the city affected by the local heat island differed from the climate data measured at the airport: the last ones underestimated consumption for cooling by 35–50% and overestimated consumption for heating by 3–7%. The change in temperature between the inside and outside of the city affects energy consumption differently. This methodology offers an alternative to solve the problem proposed if the case study is located in the centre of a large city. However, it requires obtaining specific meteorological data that is not always easily accessible. In this particular case, the dwelling is located in the suburban area of Málaga, near the airport. For this reason, data from EnergyPlus website was used.
Through the literature review about the impact of climate change in locations around the world it is concluded that each type of building requires a detailed study. Type of climate is the most important but many factors such as the function of the building and its design parameters are decisive to know the real impact on energy consumption. For example, Wan et al. [9], Chan [10], Wang et al. [14], Shen [15], Kapsomenakis et al. [35] and Pierangioli et al. [36] found that larger buildings such as office centres or malls with small windows and lower window to wall ratio are not as sensitive to climate change as small buildings such as residential, like in this case study, where more energy is lost through the envelope.

5. Conclusions

Global climate change has increased public awareness of energy use and its environmental consequences. It has generated a great interest in the energy consumption of buildings. Building designers, construction companies, developers, and environmental policymakers need to determine new strategies and energy efficiency measures for the building sector, able to mitigate the impact of climate change in future scenarios to reduce the energy consumption in buildings.
In this paper, an investigation of the impact of climate change on energy consumption in the next decades was conducted and the conclusions drawn from the experiment are set out below:
(1)
Current energy consumptions will change noticeably for the worse in a situation of global warming, and building designers are underestimating the consequences of this problem. This research finds out that climate parameters traditionally been used by architects and engineers for new buildings design in subtropical climates are clearly underestimated because of global warming.
(2)
According to the experimentation carried out in the case study (a brand new building), as a consequence of the global warming, the energy demand of the building, in terms of primary energy, grows significantly from a chosen historical scenario (average value from 1961 to 1990): 8–11% kWh/m2y (2020 scenario), 10–16% kWh/m2y (2025 and 2030 scenario), 20–28% kWh/m2y (2050 scenario), and 28–51% kWh/m2y (2080 scenario). In terms of CO2 emissions, this increases continuously over time: 16–19% kgCO2/m2y (2020 scenario), 18–24% kgCO2/m2y (2025 and 2030 scenario), 27–36% kgCO2/m2y (2050 scenario), and 35–58% kgCO2/m2y (2080 scenario).
(3)
Global warming effects results in a slight reduction in energy consumption for heating and an important increment in energy consumption for cooling. That is because of heating loads are no significant compared to cooling loads in the studied subtropical location: Malaga (Spain). The reduction in heating consumption in relation to the historical scenario (average value from 1961 to 1990) is: 20–40% kWh/m2y (2020 scenario), 20–60% kWh/m2y (2025 and 2030 scenario), 40–80% kWh/m2y (2050 scenario), and 70–100% kWh/m2y (2080 scenario). In terms of cooling consumption, the increase is: 36–49% kWh/m2y (2020 scenario), 46–75% kWh/m2y (2025 and 2030 scenario), 91–131% kWh/m2y (2050 scenario), and 127–231% kWh/m2y (2080 scenario).
(4)
This research demonstrates that in subtropical climate little can be made in the outer envelope of the building (combining opaque walls and openings and under the 2020 constructive criteria) to improve its efficiency in the face of future global warming, i.e., little can be improved using passive criteria.
(5)
Therefore, the available routes are:
(a)
To improve the exchange with the outside air (if the quality of this air allows it) at certain times of the day at certain times of the year. This really breaks the current trend that tries to build increasingly isolated buildings.
(b)
To improve the efficiency of HVAC systems, appliances and, in general, all the active systems in the building. This is a way to compensate for the growing cooling needs, so that the total demand for W/m2 is not increased.
(c)
To increase the building’s capacity to produce its own energy in a renewable way. This, on the one hand, practically equates primary energy with the energy consumed, because the losses will be 15% or even less, and on the other, it will avoid CO2 emissions and, consequently, contributions to global warming. Obviously, the possibilities of each building to house renewable energy systems are different, so it will be necessary to plan cities at the block, neighborhood or district level to take advantage of the common spaces or available to install renewable energy systems. Of course, it should be understood that renewable energy systems themselves do not make the building more efficient, but rather avoid CO2 emissions, contribute to improving global warming, and achieve a more environmentally friendly building.
The results shown in this research about the impact of climate change in highly efficient buildings can be carefully extrapolated to other buildings of similar design and identical climates with comparable parameters like latitude, altitude and proximity to the coast. Really, although the type of climate is the most important factor to consider, the building design and its use can be also key factors to take into account in order to analyze its behavior in the face of future global warming.

Author Contributions

S.G.M. conceived the idea and experimentation, checked the manuscript and carried out the revision; M.V.R. wrote the article and made the corrections; A.S.C. carried out the experimentation; J.M.A.M. supervised and reviewed all work and the manuscript. All authors have read and agreed to the published version of the manuscript.

Funding

This work has been funded by the DPI2017-85540-R Project supported by the Spanish Ministry of Economy and Competitiveness and by the European Union Regional Development Fund. Some parts of the study have been funded by the resources of the research team “Control y Robótica (TEP192)” from the University of Huelva (Spain). It was also partially supported by the Project Code G-GI3000/IDI_TEP192, of the Andalusia regional government (Spain).

Conflicts of Interest

The authors declare no conflict of interest.

Appendix A

Table A1. Summary of average temperature and relative humidity in present and future scenarios and sub-scenarios.
ScenarioAverage Temperature (°C)Change Compared to Historical ScenarioRelative Humidity (%)Change Compared to Historical Scenario
2020 B118.95%63.3−4%
2020 B219.48%63.4−4%
2020 A219.27%63.2−4%
2020 A1F119.48%62.9−5%
2025 B119.16%62.9−5%
2025 B219.69%62.9−5%
2025 A219.79%62.1−6%
2025 A1F119.48%62.7−5%
2030 B119.37%62.5−5%
2030 B219.810%62.4−6%
2030 A220.112%61.3−7%
2030 A1F119.79%62.3−6%
2050 B120.112%61−8%
2050 B220.514%60.7−8%
2050 A220.816%60.1−9%
2050 A1F121.620%58.1−12%
2080 B121.218%59.1−11%
2080 B221.721%59.1−11%
2080 A22328%56.2−15%
2080 A1F124.335%53.8−19%
Table A2. Summary of energy consumption and CO2 emissions in present and future scenarios and sub-scenarios.
ScenarioEnergy Consumption TypekWh/m2 per YearChange Compared to Historical ScenarioPrimary Energy Consumption kWh/m2CO2 Emissions kgCO2/m2Change Compared to Historical Scenario
2020 B1Heating0.8−20%
Cooling12.436%
Total43.08%83.927,93216%
2020 B2Heating0.6−40%
Cooling13.852%
Total44.211%86.228,69019%
2020 A2Heating0.7−30%
Cooling13.245%
Total43.710%85.228,36317%
2020 A1F1Heating0.6−40%
Cooling13.649%
Total44.011%85.828,51418%
2025 B1Heating0.8−20%
Cooling13.346%
Total43.910%85.628,44018%
2025 B2Heating0.6−40%
Cooling14.559%
Total44.913%87.629,04520%
2025 A2Heating0.6−40%
Cooling14.054%
Total44.412%86.628,77519%
2025 A1F1Heating0.5−50%
Cooling14.762%
Total45.013%87.829,15921%
2030 B1Heating0.8−20%
Cooling14.256%
Total44.813%87.428,93020%
2030 B2Heating0.5−50%
Cooling15.166%
Total45.414%88.529,40022%
2030 A2Heating0.6−40%
Cooling14.762%
Total45.113%87.929,24021%
2030 A1F1Heating0.4−60%
Cooling15.975%
Total46.116%89.929,85424%
2050 B1Heating0.6−40%
Cooling17.491%
Total47.820%93.230,79528%
2050 B2Heating0.3−70%
Cooling17.693%
Total47.720%93.030,76527%
2050 A2Heating0.3−70%
Cooling18.3101%
Total48.422%94.431,18929%
2050 A1F1Heating0.2−80%
Cooling21.0131%
Total51.028%99.532,77636%
2080 B1Heating0.3−70%
Cooling20.7127%
Total50.828%99.132,62035%
2080 B2Heating0.2−80%
Cooling21.0131%
Total51.028%99.532,77636%
2080 A2Heating0.1−90%
Cooling24.9174%
Total54.838%106.934,98145%
2080 A1F1Heating0.0−100%
Cooling30.1231%
Total59.951%116.838,15058%
Table A3. Summary of energy consumption and CO2 emissions in the adaptation models to mitigate the impact of climate change of 2080 scenario.
ScenarioEnergy Consumption TypekWh/m2 per YearChange Compared to 2080 ScenarioPrimary Energy Consumption kWh/m2CO2 Emissions kgCO2/m2Change Compared to 2080 Scenario
(a) 2080 B1Heating0.2−33%
Cooling15.1−27%
Total45.1−11%87.929,240−10%
(a) 2080 B2Heating0.1−50%
Cooling15.3−27%
Total45.2−11%88.129,293−11%
(a) 2080 A2Heating0.0−100%
Cooling18.2−27%
Total48.0−12%93.630,926−12%
(a) 2080 A1F1Heating0.00%
Cooling22.0−27%
Total51.8−14%101.033,240−13%
(b) 2080 B1Heating0.1−67%
Cooling19.7−5%
Total49.6−2%96.731,972−2%
(b) 2080 B2Heating0.1−50%
Cooling20.0−5%
Total49.9−2%97.332,090−2%
(b) 2080 A2Heating0.0−100%
Cooling23.4−6%
Total53.2−3%103.734,091−3%
(b) 2080 A1F1Heating0.00%
Cooling27.9−7%
Total57.7−4%112.536,828−3%
(c) 2080 B1Heating0.0−100%
Cooling21.85%
Total51.62%100.633,1152%
(c) 2080 B2Heating0.0−100%
Cooling21.84%
Total51.61%100.633,1151%
(c) 2080 A2Heating0.0−100%
Cooling25.42%
Total55.21%107.635,2621%
(c) 2080 A1F1Heating0.00%
Cooling30.20%
Total60.00%117.038,2250%
(d) 2080 B1Heating1.1267%
Cooling20.4−1%
Total51.31%100.032,9541%
(d) 2080 B2Heating0.8300%
Cooling20.8−1%
Total51.41%100.233,0201%
(d) 2080 A2Heating0.4300%
Cooling25.00%
Total55.21%107.635,2621%
(d) 2080 A1F1Heating0.2200%
Cooling30.10%
Total60.10%117.238,5081%

References

  1. Eurostat. Energy, Transport and Environment Indicators, 2014 ed.; Publications Office of the European Union: Luxembourg, 2014. [Google Scholar]
  2. Red Eléctrica de España. Available online: https://www.ree.es/es (accessed on 30 October 2020).
  3. Metz, B.; Meyer, L.; Bosch, P. Climate Change 2007: Mitigation of Climate Change; Cambridge University Press: Cambridge, UK, 2007. [Google Scholar]
  4. Li, D.H.W.; Yang, L.; Lam, J.C. Impact of climate change on energy use in the built environment in different climate zones—A review. Energy 2012, 42, 103–112. [Google Scholar] [CrossRef]
  5. Collins, L.; Natarajan, S.; Levermore, G. Climate change and future energy consumption in UK housing stock. Build. Serv. Eng. Res. Technol. 2010, 31, 75–90. [Google Scholar] [CrossRef]
  6. Kovats, S.; Osborn, D.; Whitman, G. Chapter 5: People and the built environment. In UK Climate Change Risk Assessement Evidence Report; Committee on Climate Change: London, UK, 2016. [Google Scholar]
  7. Scott, M.J.; Wrench, L.E.; Hadley, D.L. Effects of climate change on commercial building energy demand. Energy Sources 1994, 16, 317–332. [Google Scholar] [CrossRef]
  8. Lam, J.C.; Wan, K.K.W.; Lam, T.N.T.; Wong, S.L. An analysis of future building energy use in subtropical Hong Kong. Energy 2010, 35, 1482–1490. [Google Scholar] [CrossRef]
  9. Wan, K.K.W.; Li, D.H.W.; Lam, J.C. Assessment of climate change impact on building energy use and mitigation measures in subtropical climates. Energy 2011, 36, 1404–1414. [Google Scholar] [CrossRef]
  10. Chan, A.L.S. Developing future hourly weather files for studying the impact of climate change on building energy performance in Hong Kong. Energy Build. 2011, 43, 2860–2868. [Google Scholar] [CrossRef]
  11. Li, M.; Guo, J.; Tian, Z.; Shi, J.; Xiong, M.; Xiang, C. Future climate change and building energy demand in Tianjin, China. Build. Serv. Eng. Res. Technol. 2014, 35, 362–375. [Google Scholar] [CrossRef]
  12. Wan, K.K.W.; Li, D.H.W.; Pan, W.; Lam, J.C. Impact of climate change on building energy use in different climate zones and mitigation and adaptation implications. Appl. Energy 2012, 97, 274–282. [Google Scholar] [CrossRef]
  13. Wang, H.; Chen, Q. Impact of climate change heating and cooling energy use in buildings in the United States. Energy Build. 2014, 82, 428–436. [Google Scholar] [CrossRef] [Green Version]
  14. Wang, L.; Liu, X.; Brown, H. Prediction of the impacts of climate change on energy consumption for a medium-size office building with two climate models. Energy Build. 2017, 157, 218–226. [Google Scholar] [CrossRef]
  15. Shen, P. Impacts of climate change on U.S. building energy use by using downscaled hourly future weather data. Energy Build. 2017, 134, 61–70. [Google Scholar] [CrossRef]
  16. Mavrogianni, A.; Wilkinson, P.; Davies, M.; Biddulph, P.; Oikonomou, E. Building characteristics as determinants of propensity to high indoor summer temperatures in London dwellings. Build. Environ. 2012, 55, 117–130. [Google Scholar] [CrossRef] [Green Version]
  17. Sanders, C.H.; Phillipson, M.C. UK adaptation strategy and technical measures: The impacts of climate change on buildings. Build. Res. Inf. 2003, 31, 210–221. [Google Scholar] [CrossRef]
  18. Dodoo, A.; Gustavsson, L.; Bonakdar, F. Effects of future climate change scenarios on overheating risk and primary energy use for Swedish residential buildings. Energy Procedia 2014, 61, 1179–1182. [Google Scholar] [CrossRef]
  19. Nik, V.M.; Kalagasidis, A.S. Impact study of the climate change on the energy performance of the building stock in Stockholm considering four climate uncertainties. Build. Environ. 2013, 60, 291–304. [Google Scholar] [CrossRef]
  20. Camilleri, M.; Jaques, R.; Isaacs, N. Impacts of climate change on building performance in New Zealand. Build. Res. Inf. 2001, 29, 440–450. [Google Scholar] [CrossRef]
  21. Wang, X.; Chen, D.; Ren, Z. Assessment of climate change impact on residential building heating and cooling energy requirement in Australia. Build. Environ. 2010, 45, 1663–1682. [Google Scholar] [CrossRef]
  22. Rubio-Bellido, C.; Pérez-Fargallo, A.; Pulido-Arcas, J.A. Optimization of annual energy demand in office buildings under the influence of climate change in Chile. Energy 2016, 114, 569–585. [Google Scholar] [CrossRef]
  23. Ouedraogo, B.I.; Levermore, G.J.; Parkinson, J.B. Future energy demand for public buildings in the context of climate change for Burkina Faso. Build. Environ. 2012, 49, 270–282. [Google Scholar] [CrossRef]
  24. Moazami, A.; Nik, V.M.; Carlucci, S.; Geving, S. Impacts of future weather data typology on building energy performance—Investigating long-term patterns of climate change and extreme weather conditions. Appl. Energy 2019, 238, 696–720. [Google Scholar] [CrossRef]
  25. WeatherShift Software. Available online: http://www.weather-shift.com/ (accessed on 19 May 2020).
  26. CCWorldWeatherGen Software. Available online: http://www.energy.soton.ac.uk/ccworldweathergen/ (accessed on 19 May 2020).
  27. Weather Morph: Climate Change Weather File Generator Software. Available online: http://139.62.210.131/weatherGen/ (accessed on 6 April 2020).
  28. Marion, W.; Urban, K. User’s Manual for TMY2s Typical Meteorological Years Derived from the 1961–1990 National Solar Radiation Data Base; National Renewable Energy Laboratory: Golden, CO, USA, 1995.
  29. Belcher, S.E.; Hacker, J.N.; Powell, D.S. Constructing design weather data for future climates. Build. Serv. Eng. Res. Technol. 2005, 26, 49–61. [Google Scholar] [CrossRef]
  30. Moazami, A.; Carlucci, S.; Geving, S. Critical analysis of software tools aimed at generating future weather files with a view to their use in building performance simulation. Energy Procedia 2017, 132, 640–645. [Google Scholar] [CrossRef]
  31. Jiang, A.; Liu, X.; Czarnecki, E.; Zhang, C. Hourly weather data projection due to climate change for impact assessment on building and infrastructure. Sustain. Cities Soc. 2019, 50. [Google Scholar] [CrossRef]
  32. Ciancio, V.; Falasca, S.; Golasi, I.; de Wilde, P.; Coppi, M.; de Santoli, L.; Salata, F. Resilience of a building to future climate conditions in three European cities. Energies 2019, 12, 4506. [Google Scholar] [CrossRef] [Green Version]
  33. Barbosa, R.; Vicente, R.; Santos, R. Climate change and thermal comfort in Southern Europe housing: A case study from Lisbon. Build. Environ. 2015, 92, 440–451. [Google Scholar] [CrossRef]
  34. Andrić, I.; Silva, C.; Pina, A.; Ferrão, P.; Fournier, J.; Lacarrière, B.; Le Corre, O. The impact of climate change and building renovation on heating related CO2 emissions on a neighbourhood level. In Proceedings of the International Conference CISBAT 2015 Future Buildings and Districts Sustainability from Nano to Urban Scale, Lausanne, Switzerland, 9–11 September 2015; pp. 621–626. [Google Scholar]
  35. Kapsomenakis, J.; Kolokotsa, D.; Nikolaou, T.; Santamouris, M.; Zerefos, S.C. Forty years increase of the air ambient temperature in Greece: The impact on buildings. Energy Convers. Manag. 2013, 74, 353–365. [Google Scholar] [CrossRef]
  36. Pierangioli, L.; Cellai, G.; Ferrise, R.; Trombi, G.; Bindi, M. Effectiveness of passive measures against climate change: Case studies in Central Italy. Build. Simul. 2017, 10, 459–479. [Google Scholar] [CrossRef]
  37. Peng, C.; Elwan, A. An outdoor-indoor coupled simulation framework for climate change—Conscious urban neighborhood design. Simulation 2014, 90, 874–891. [Google Scholar] [CrossRef]
  38. Imessad, K.; Derradji, L.; Messaoudene, N.A.; Mokhtari, F.; Chenak, A.; Kharchi, R. Impact of passive cooling techniques on energy demand for residential buildings in a Mediterranean climate. Renew. Energy 2014, 71, 589–597. [Google Scholar] [CrossRef]
  39. Rey-Hernández, J.M.; Yousif, C.; Gatt, D.; Velasco-Gómez, E.; José-Alonso, J.S.; Rey-Martínez, F.J. Modelling the long-term effect of climate change on a zero energy and carbon dioxide building through energy efficiency and renewables. Energy Build. 2018, 174, 85–96. [Google Scholar] [CrossRef]
  40. Cellura, M.; Guarino, F.; Longo, S.; Tumminia, G. Climate change and the building sector: Modelling and energy implications to an office building in southern Europe. Energy Sustain. Dev. 2018, 45, 46–65. [Google Scholar] [CrossRef]
  41. Pérez-Andreu, V.; Aparicio-Fernández, C.; Martínez-Ibernón, A.; Vivancos, J.L. Impact of climate change on heating and cooling energy demand in a residential building in a Mediterranean climate. Energy 2018, 165, 63–74. [Google Scholar] [CrossRef]
  42. Suárez, R.; Escandón, R.; López-Pérez, R.; León-Rodríguez, Á.L.; Klein, T.; Silvester, S. Impact of climate change: Environmental assessment of passive solutions in a single-family home in Southern Spain. Sustainability 2018, 10, 2914. [Google Scholar] [CrossRef] [Green Version]
  43. Escandón, R.; Suárez, R.; Sendra, J.J.; Ascione, F.; Bianco, N.; Mauro, G.M. Predicting the impact of climate change on thermal comfort in a building category: The case of linear-type social housing stock in Southern Spain. Energies 2019, 12, 2238. [Google Scholar] [CrossRef] [Green Version]
  44. Institute for Energy Diversification and Saving—IDEA. Project Sech-Spahousec, Analysis of the Energetic Consumption of the Residential Sector in Spain (Proyecto Sech-Spahousec, Análisis del Consumo Energético del Sector Residencial en España); Institute for Energy Diversification and Saving—IDEA: Madrid, Spain, 2011; p. 76. [Google Scholar]
  45. Melgar, S.G.; Bohórquez, M.Á.M.; Márquez, J.M.A. UhuMEB: Design, construction, and management methodology of minimum energy buildings in subtropical climates. Energies 2018, 11, 2745. [Google Scholar] [CrossRef] [Green Version]
  46. Cordero, A.S.; Melgar, S.G.; Márquez, J.M.A. Green building rating systems and the new framework level(s): A critical review of sustainability certification within Europe. Energies 2019, 13, 1–25. [Google Scholar]
  47. Melgar, S.G.; Bohórquez, M.Á.M.; Márquez, J.M.A. uhuMEBr: Energy refurbishment of existing buildings in subtropical climates to become minimum energy buildings. Energies 2020, 13, 1204. [Google Scholar] [CrossRef] [Green Version]
  48. Crawley, D.B.; Lawrie, L.K.; Winkelmann, F.C.; Buhl, W.; Huang, Y.; Pedersen, C.O.; Strand, R.K.; Liesen, R.J.; Fisher, D.E.; Witte, M.J.; et al. EnergyPlus: Creating a new-generation building energy simulation program. Energy Build. 2001, 33, 319–331. [Google Scholar] [CrossRef]
  49. EnergyPlus. Available online: https://energyplus.net/weather (accessed on 6 April 2020).
  50. National Oceanic and Atmospheric Administration (NOAA). FY 2004 Annual Performance Plan. The First Climate Model in National Oceanic and Atmospheric Administration. Available online: https://www.osec.doc.gov/bmi/budget/04APP/04noaa.pdf (accessed on 20 October 2020).
  51. Met Office Hadley Centre for Climate Science and Services. Available online: https://www.metoffice.gov.uk/weather/climate/met-office-hadley-centre/index (accessed on 19 May 2020).
  52. Intergovernmental Panel on Climate Change (IPCC). IPCC Special Report on Emissions Scenarios (SRES): Summary for Policymakers—A Special Report of IPCC Working Group III Intergovernmental Panel on Climate Change; Intergovernmental Panel on Climate Change (IPCC): Geneva, Switzerland, 2000. [Google Scholar]
  53. Salomon, D. Curves and Surfaces for Computer Graphics; Springer: Berlin, Germany, 2006. [Google Scholar]
  54. MathWorks. Available online: https://es.mathworks.com/help/matlab/ref/polyfit.html (accessed on 30 October 2020).
  55. Peel, M.C.; Finlayson, B.L.; McMahon, T.A. Updated world map of the Köppen-Geiger climate classification. Hydrol. Earth Syst. Sci. 2007, 11, 1633–1644. [Google Scholar] [CrossRef] [Green Version]
  56. Nicol, J.F.; Humphreys, M.A. Adaptive thermal comfort and sustainable thermal standards for buildings. Energy Build. 2002, 34, 563–572. [Google Scholar] [CrossRef]
  57. Márquez, J.M.A.; Bohórquez, M.Á.M.; Melgar, S.G. Ground thermal diffusivity calculation by direct soil temperature measurement. application to very low enthalpy geothermal energy systems. Sensors 2016, 16, 306. [Google Scholar] [CrossRef] [Green Version]
  58. Márquez, J.M.A.; Bohórquez, M.Á.M.; Melgar, S.G. A new metre for cheap, quick, reliable and simple thermal transmittance (U-Value) measurements in buildings. Sensors 2017, 17, 2017. [Google Scholar] [CrossRef] [Green Version]
  59. Código Técnico de la Edificación—CTE. Available online: https://www.codigotecnico.org/ (accessed on 30 October 2020).
  60. Instituto Para la Diversificación y Ahorro de la Energía IDAE. Available online: https://www.idae.es/ (accessed on 30 October 2020).
  61. Design Builder Help. Available online: https://designbuilder.co.uk/helpv6.0/ (accessed on 30 October 2020).
  62. Fischer, E.M.; Schär, C. Consistent geographical patterns of changes in high-impact European heatwaves. Nat. Geosci. 2010, 3, 398–403. [Google Scholar] [CrossRef]
  63. Feng, S.; Fu, Q. Expansion of global drylands under a warming climate. Atmos. Chem. Phys. Discuss. 2013, 13, 14637–14665. [Google Scholar] [CrossRef]
  64. Wong, N.H.; Jusuf, S.K.; Syafii, N.I.; Li, W.H.; Tan, A.Y.K. Simulation of the impact of climate change on the current building’s residential envelope thermal transfer value (ETTV) regulation in Singapore. In Proceedings of the ICSDC 2011: Integrating Sustainability Practices in the Construction Industry, 2011 International Conference on Sustainable Design, Kansas City, MO, USA, 23–25 March 2011; pp. 34–42. [Google Scholar]
  65. Invidiata, A.; Ghisi, E. Impact of climate change on heating and cooling energy demand in houses in Brazil. Energy Build. 2016, 130, 20–32. [Google Scholar] [CrossRef]
  66. De Wilde, P.; Rafiq, Y.; Beck, M. Uncertainties in predicting the impact of climate change on thermal performance of domestic buildings in the UK. Build. Serv. Eng. Res. Technol. 2008, 29, 7–26. [Google Scholar] [CrossRef]
  67. Sovacool, B.K.; del Rio, D.D.F. Smart home technologies in Europe: A critical review of concepts, benefits, risks and policies. Renew. Sustain. Energy Rev. 2020, 120, 109663. [Google Scholar] [CrossRef]
  68. Ng, W.Y.; Chau, C.K. New life of the building materials-recycle, reuse and recovery. Energy Procedia 2015, 75, 2884–2891. [Google Scholar] [CrossRef] [Green Version]
  69. Rao, M.N.; Rajasekhar, V.; Vijayalakshmi, K.; Vamshykrishna, M. The future of civil engineering with the influence and impact of nanotechnology on properties of materials. Procedia Mater. Sci. 2015, 10, 111–115. [Google Scholar] [CrossRef] [Green Version]
  70. Fosas, D.; Coley, D.A.; Natarajan, S.; Herrera, M.; de Pando, M.F.; Ramallo-Gonzalez, A. Mitigation versus adaptation: Does insulating dwellings increase overheating risk? Build. Environ. 2018, 143, 740–759. [Google Scholar] [CrossRef]
  71. Ciancio, V.; Falasca, S.; Golasi, I.; Curci, G.; Coppi, M.; Salata, F. Influence of input climatic data on simulations of annual energy needs of a building: Energyplus and WRF modeling for a case study in Rome (Italy). Energies 2018, 11, 2835. [Google Scholar] [CrossRef] [Green Version]
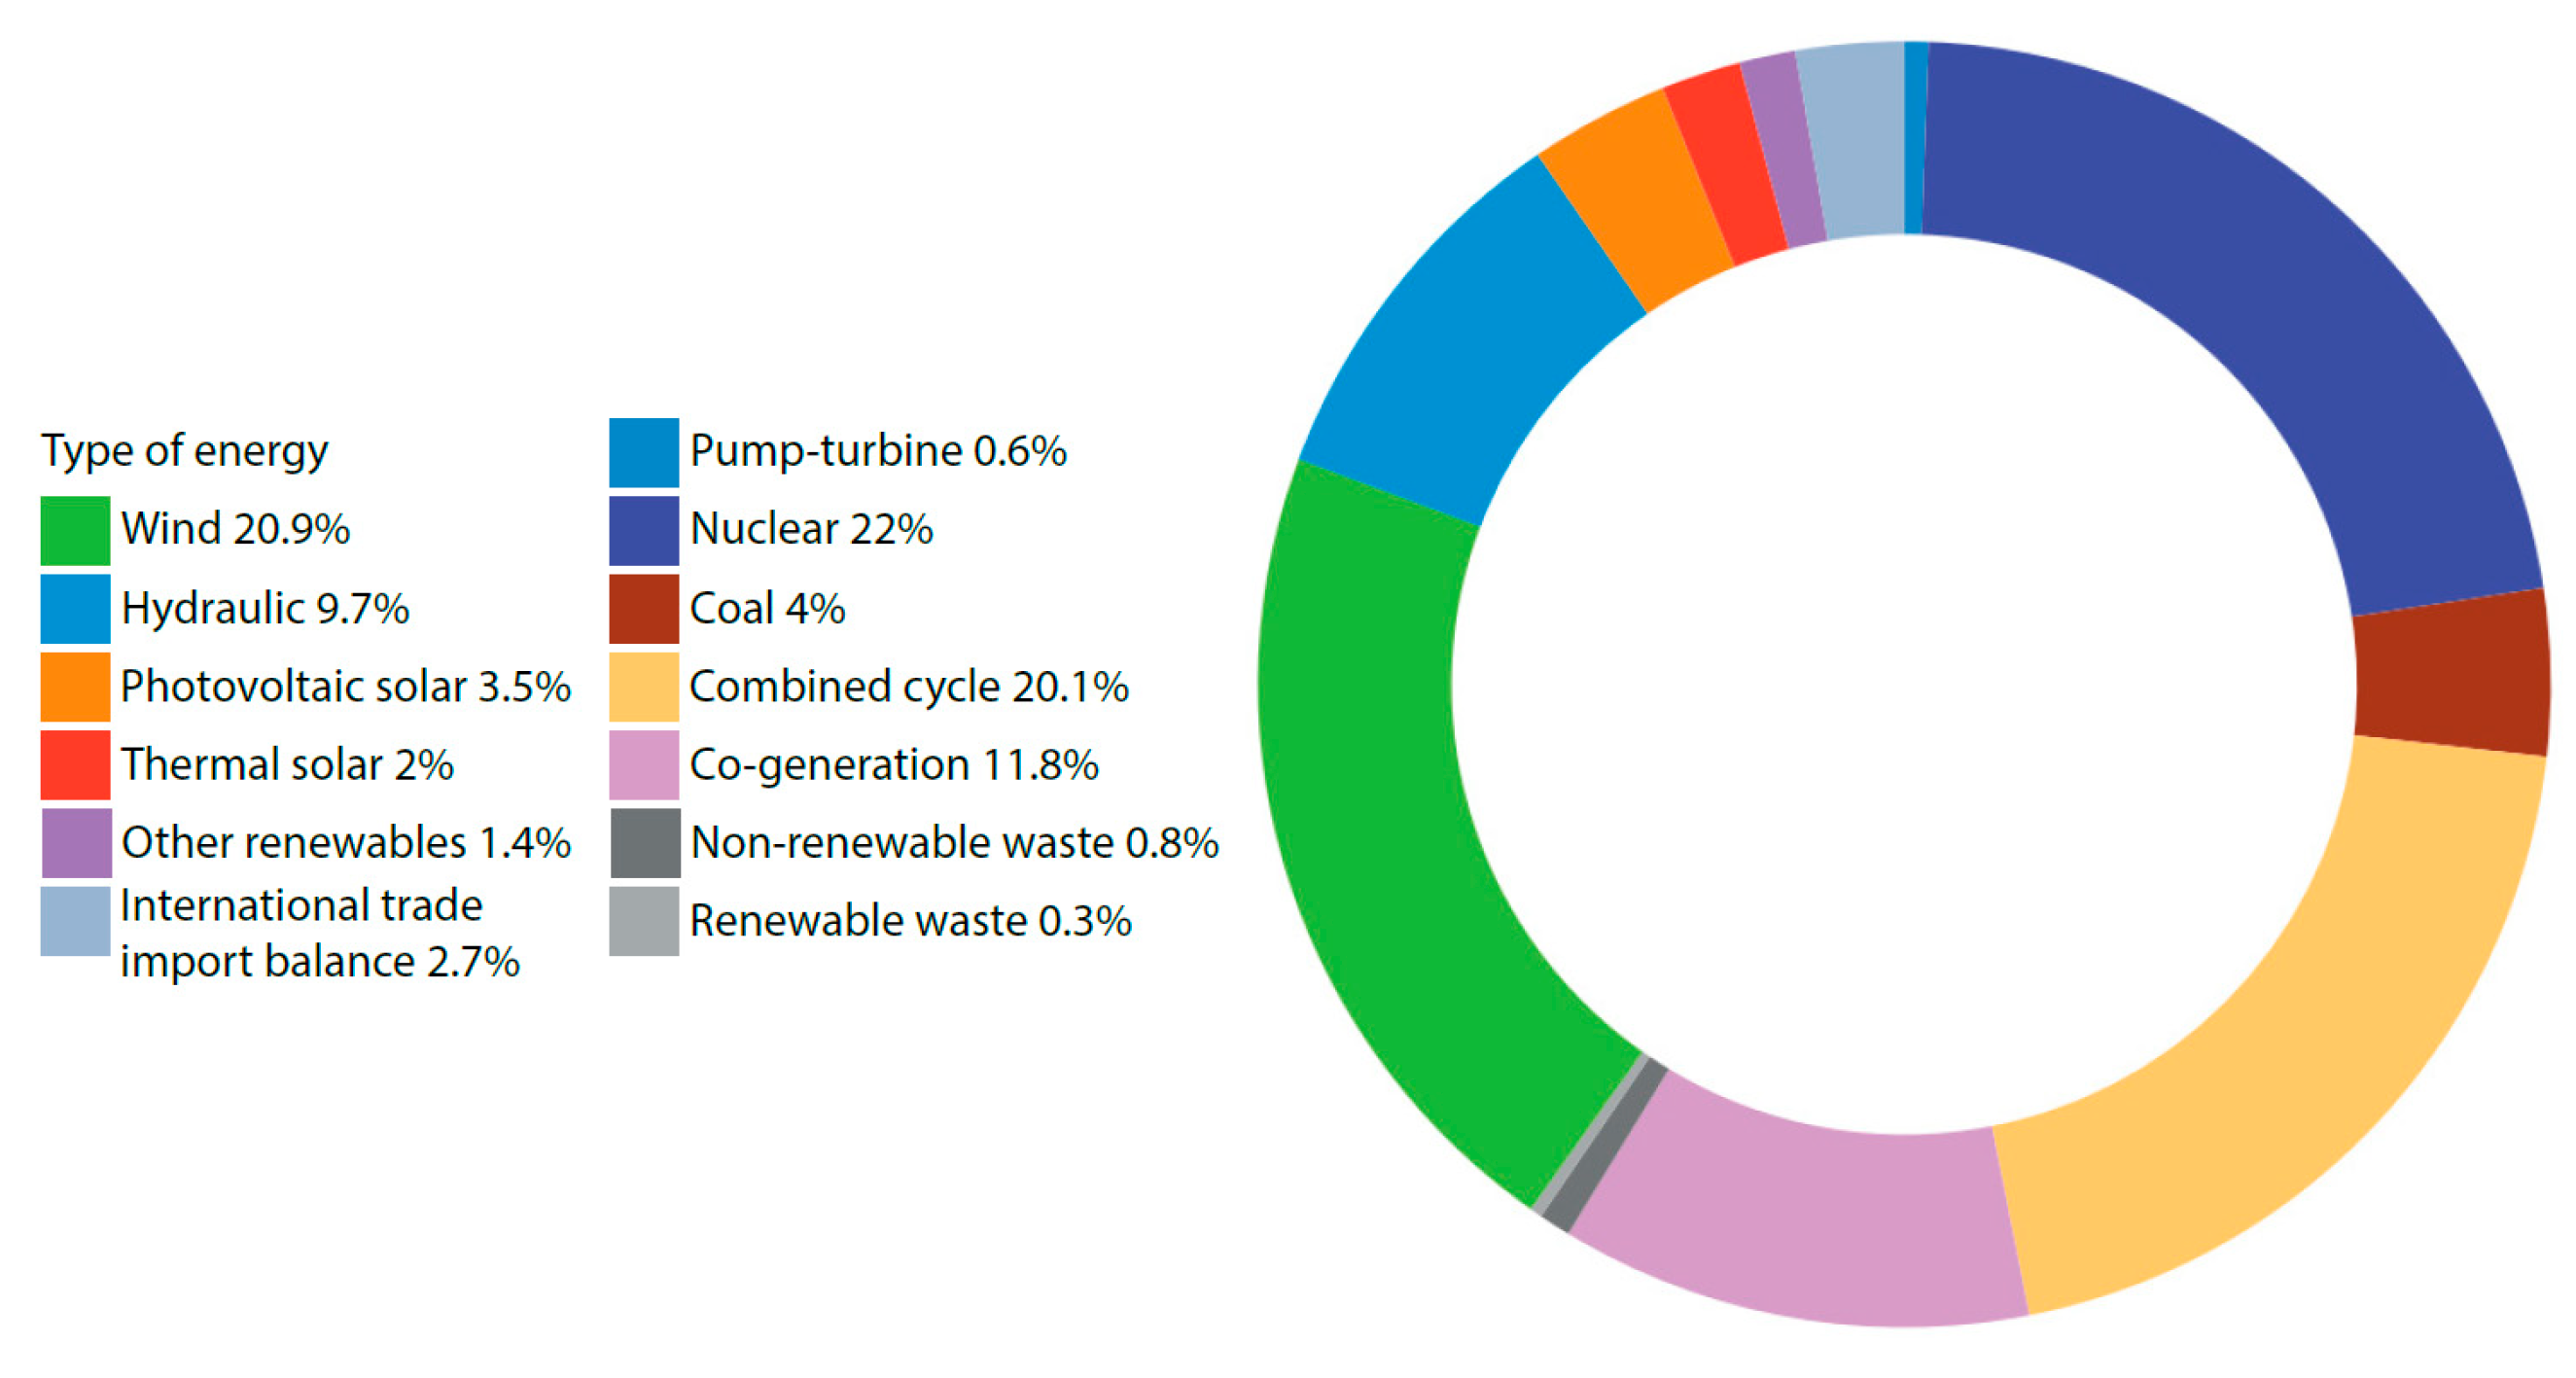
Figure 1. Coverage of the electricity demand in the Iberian Peninsula. Year 2019. Recovered from [2]: https://www.ree.es/es.
Energies 13 06188 g001
Figure 2. Case study. Building modeled in DesignBuilderTM: (a) 3D view, (b) Ground floor plan, (c) Basement level plan, (d) Upper floor plan.
Energies 13 06188 g002
Figure 3. Algorithm for the operation of the HVAC systems.
Energies 13 06188 g003
Figure 4. Monthly average temperature and relative humidity in historical scenario (1961–1990).
Energies 13 06188 g004
Figure 5. Variation of average temperature and relative humidity in historical, present, and future scenarios and sub-scenarios.
Energies 13 06188 g005
Figure 6. Monthly energy consumption in the historical scenario.
Energies 13 06188 g006
Figure 7. Daily energy consumption in the historical scenario: (a) Typical day in January; (b) Typical day in April; (c) Typical day in July.
Energies 13 06188 g007
Figure 8. Variation of energy consumption and CO2 emissions in historical, present, and future scenarios and sub-scenarios.
Energies 13 06188 g008
Figure 9. Variation of energy consumption and CO2 emissions in the adaptation models of 2080 scenario: (a) with the improvement in the efficiency of HVAC; (b) with the control of the quality of the air; (c) with the increase of the thermal insulation; (d) with the reduction of the thermal insulation.
Energies 13 06188 g009
Table 1. Summary of average temperature and relative humidity in the historical scenario (1961–1990).
ScenarioAverage Temperature (°C)Relative Humidity (%)
Historical18.066.1
Table 2. Summary of energy consumption in the historical scenario.
Historical ScenarioEnergy Consumption per Year
kWh/m2
Conversion
Factor *
Primary Energy Demand
kWh/m2
CO2 Emissions
kgCO2/m2
Heating11.951.95
Domestic hot water3.81.957.41
Lighting6.71.9513.06
Cooling9.11.9517.74
Appliances and others19.31.9537.63
Total39.9 77.7924,140
* Indicates that the energy consumed by the user must have been produced before, so that in the entire process, the energy expended (due to the different losses) is practically double.
Publisher’s Note: MDPI stays neutral with regard to jurisdictional claims in published maps and institutional affiliations.