Investigation of the Multi-Point Injection of Green Hydrogen from Curtailed Renewable Power into a Gas Network


Abstract
1. Introduction
2. Methodology and Modelling
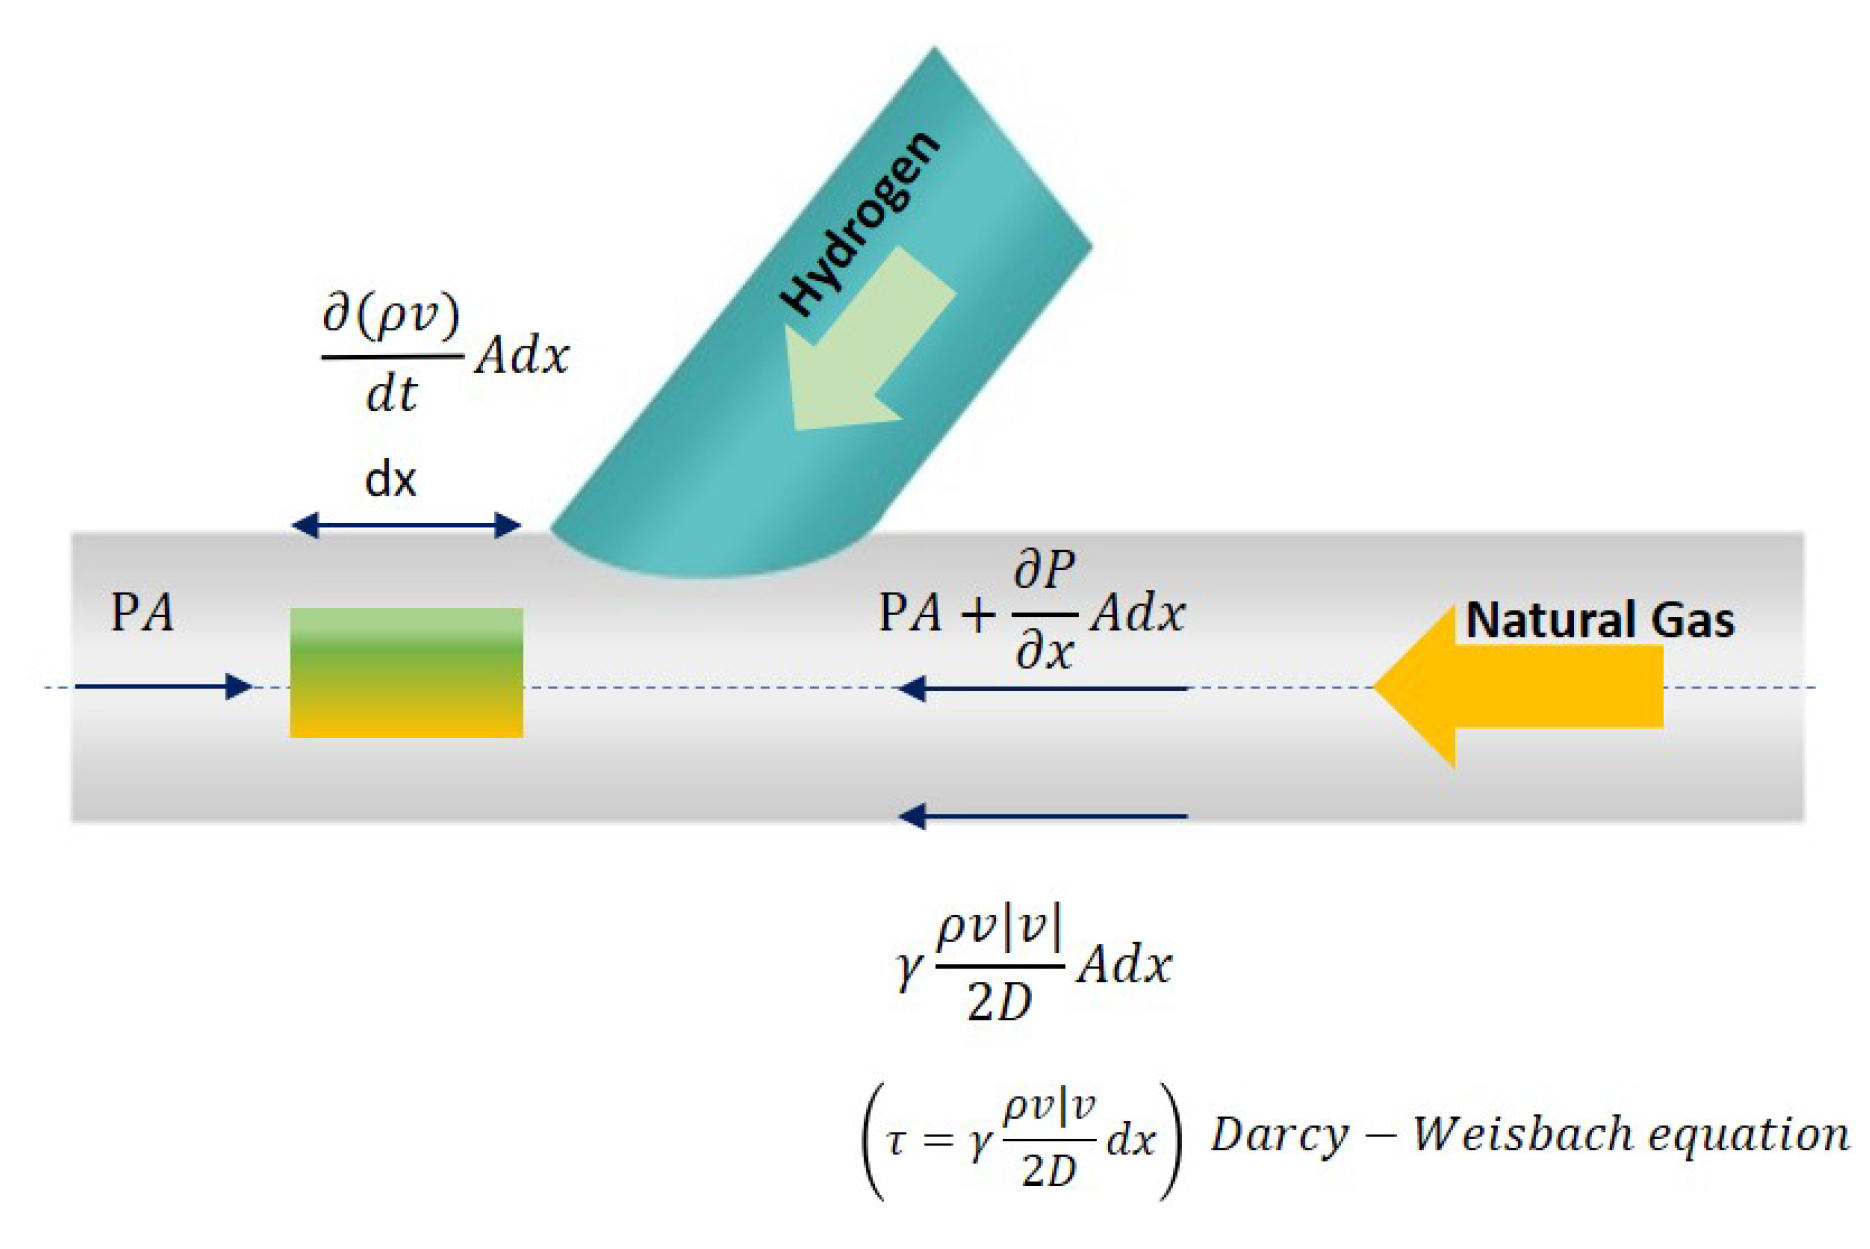
2.1. Gas System Modelling
2.2. Variable Gas Composition
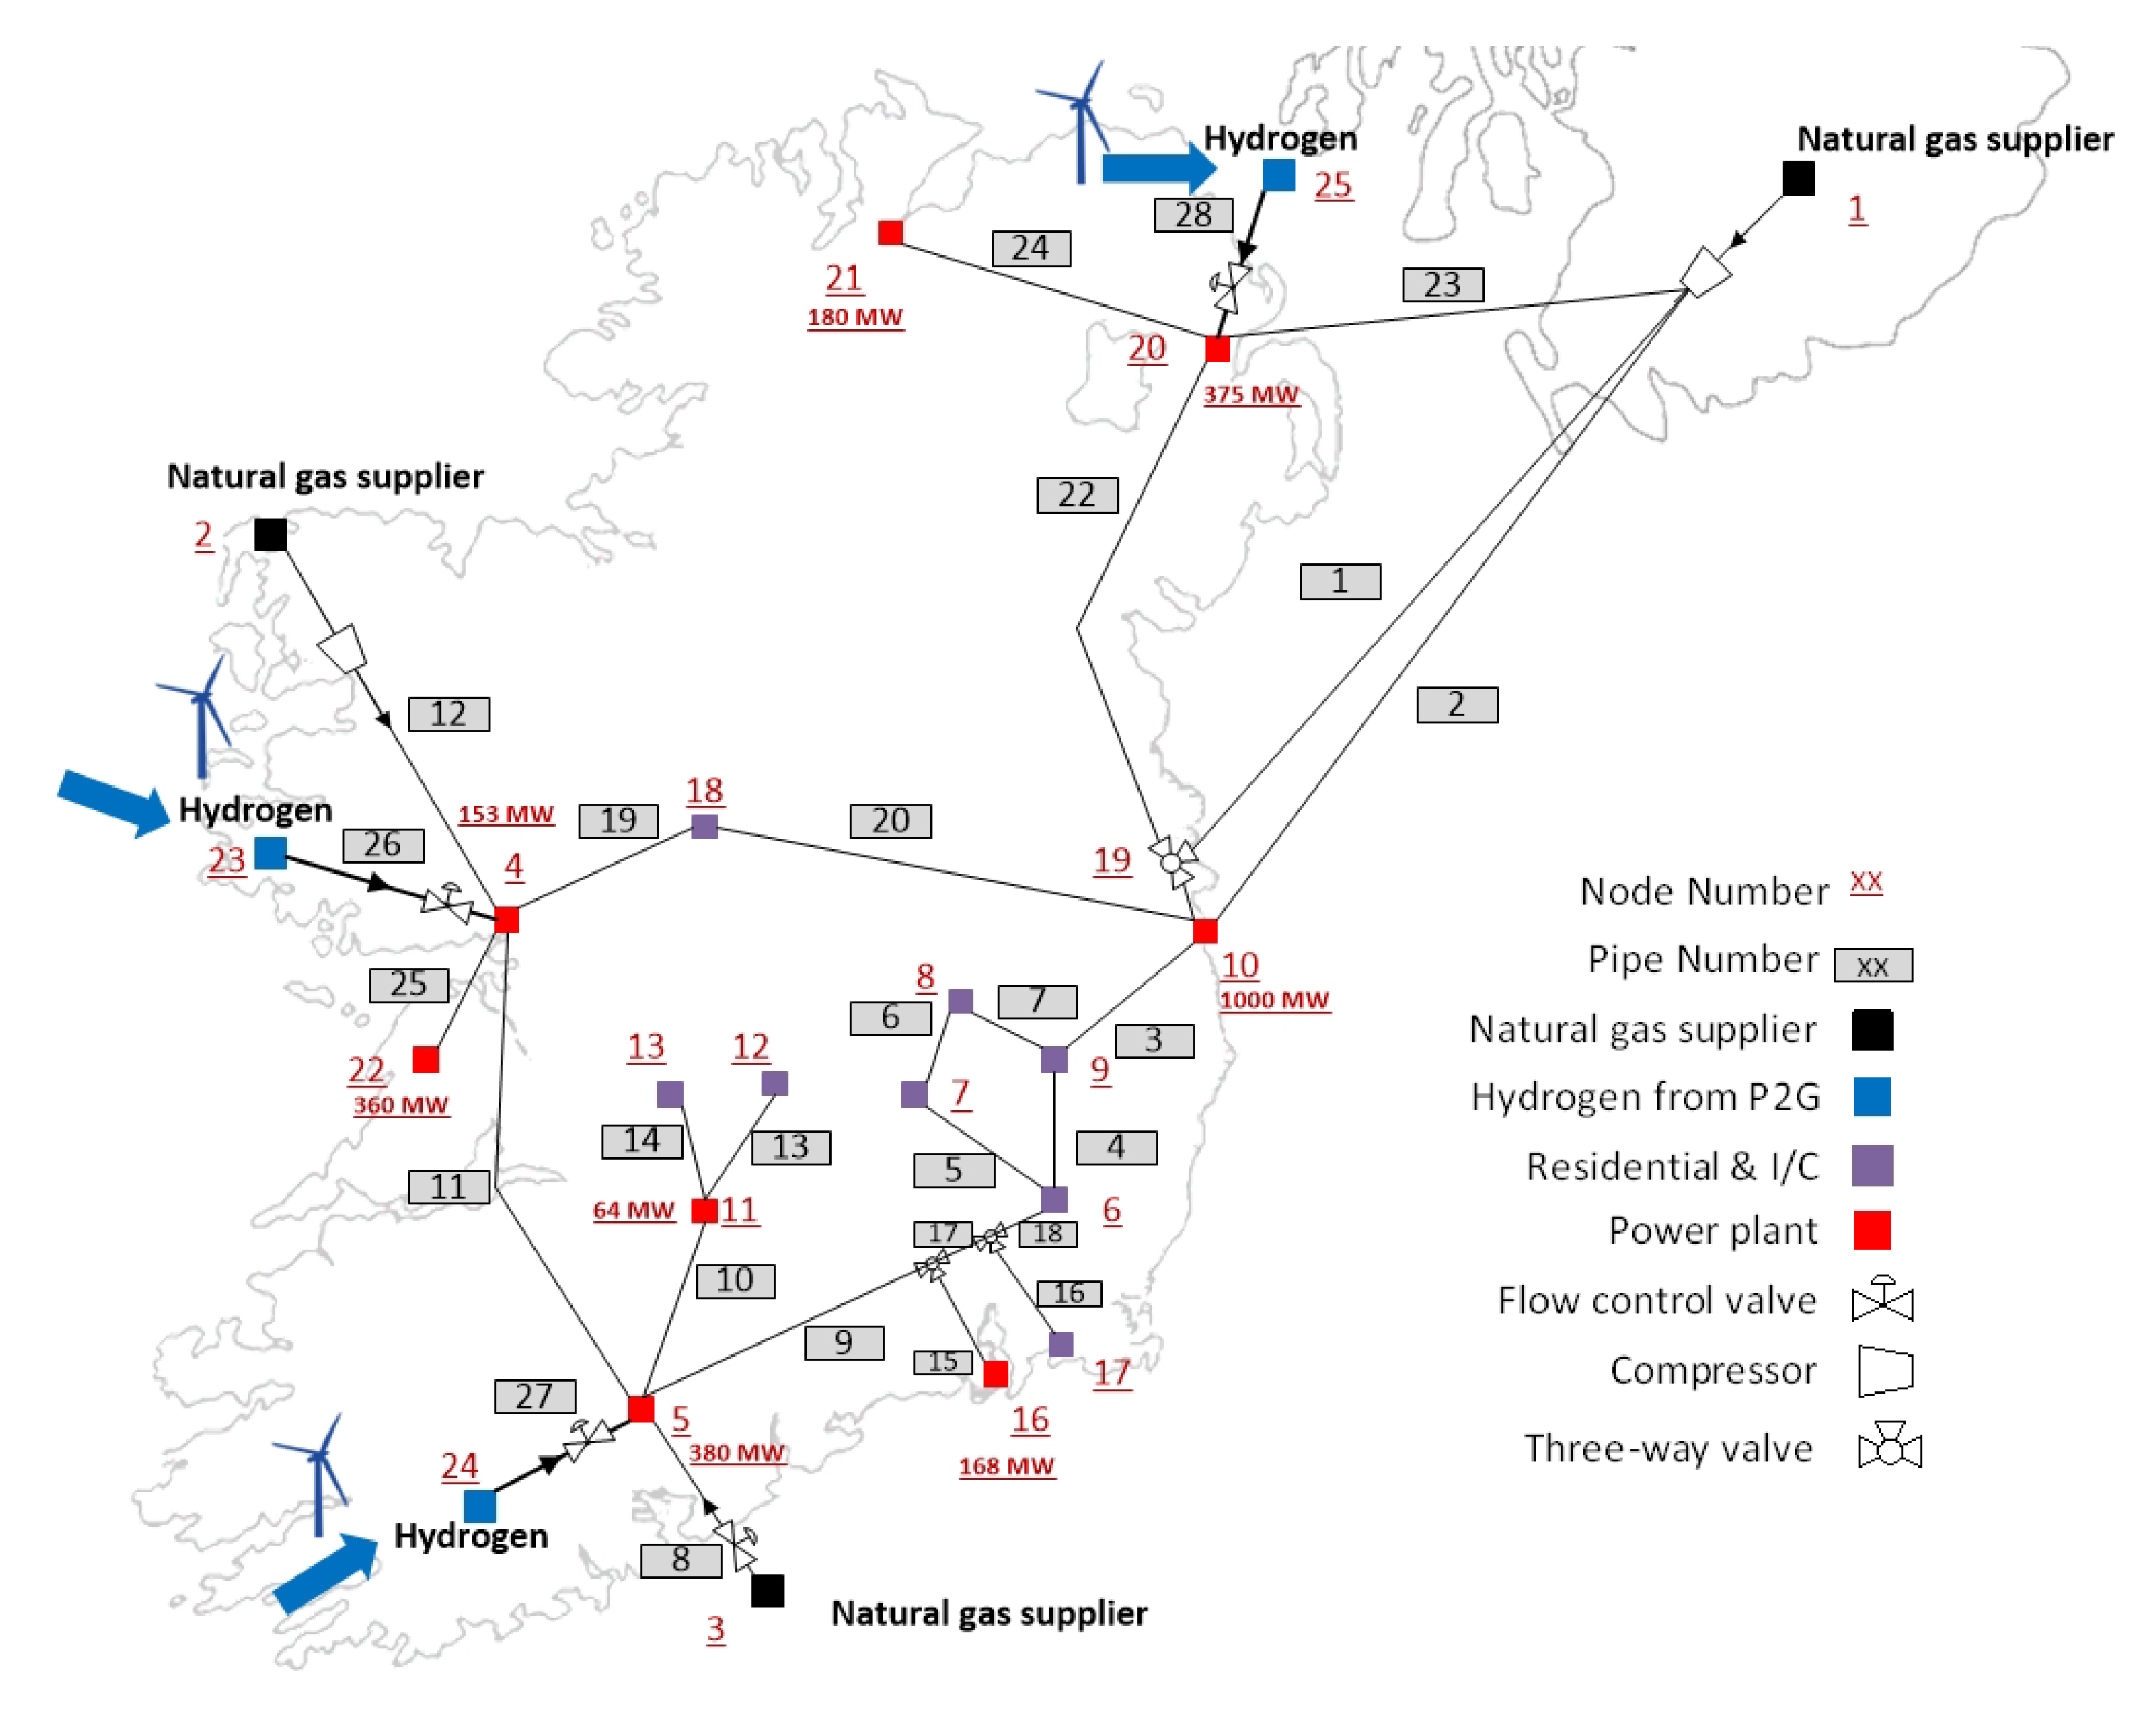
2.3. Scenario
- P2H location should be close to source of renewable electricity so that the impact of local electrical network constraints are minimised;
- P2H location should be close to gas pipelines; and,
- injection of hydrogen into pipelines with a high flow rate of the NG will minimise variations in the hydrogen fraction.
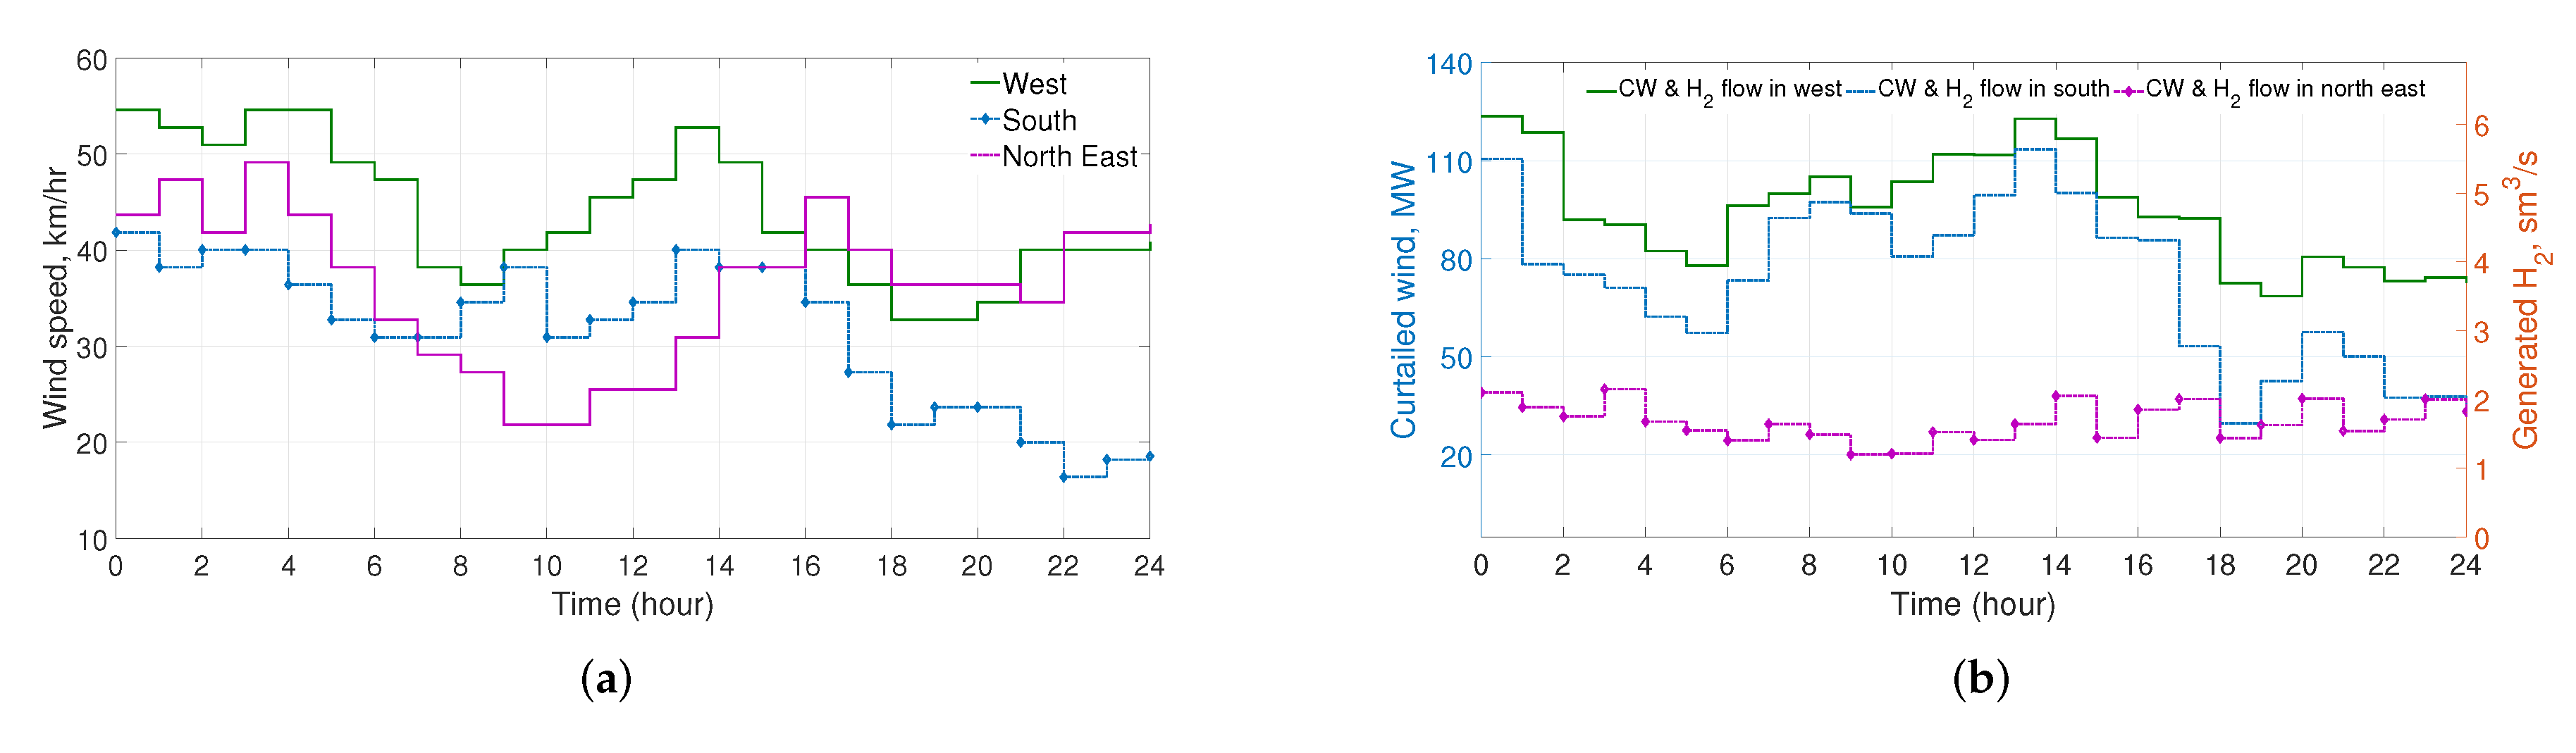
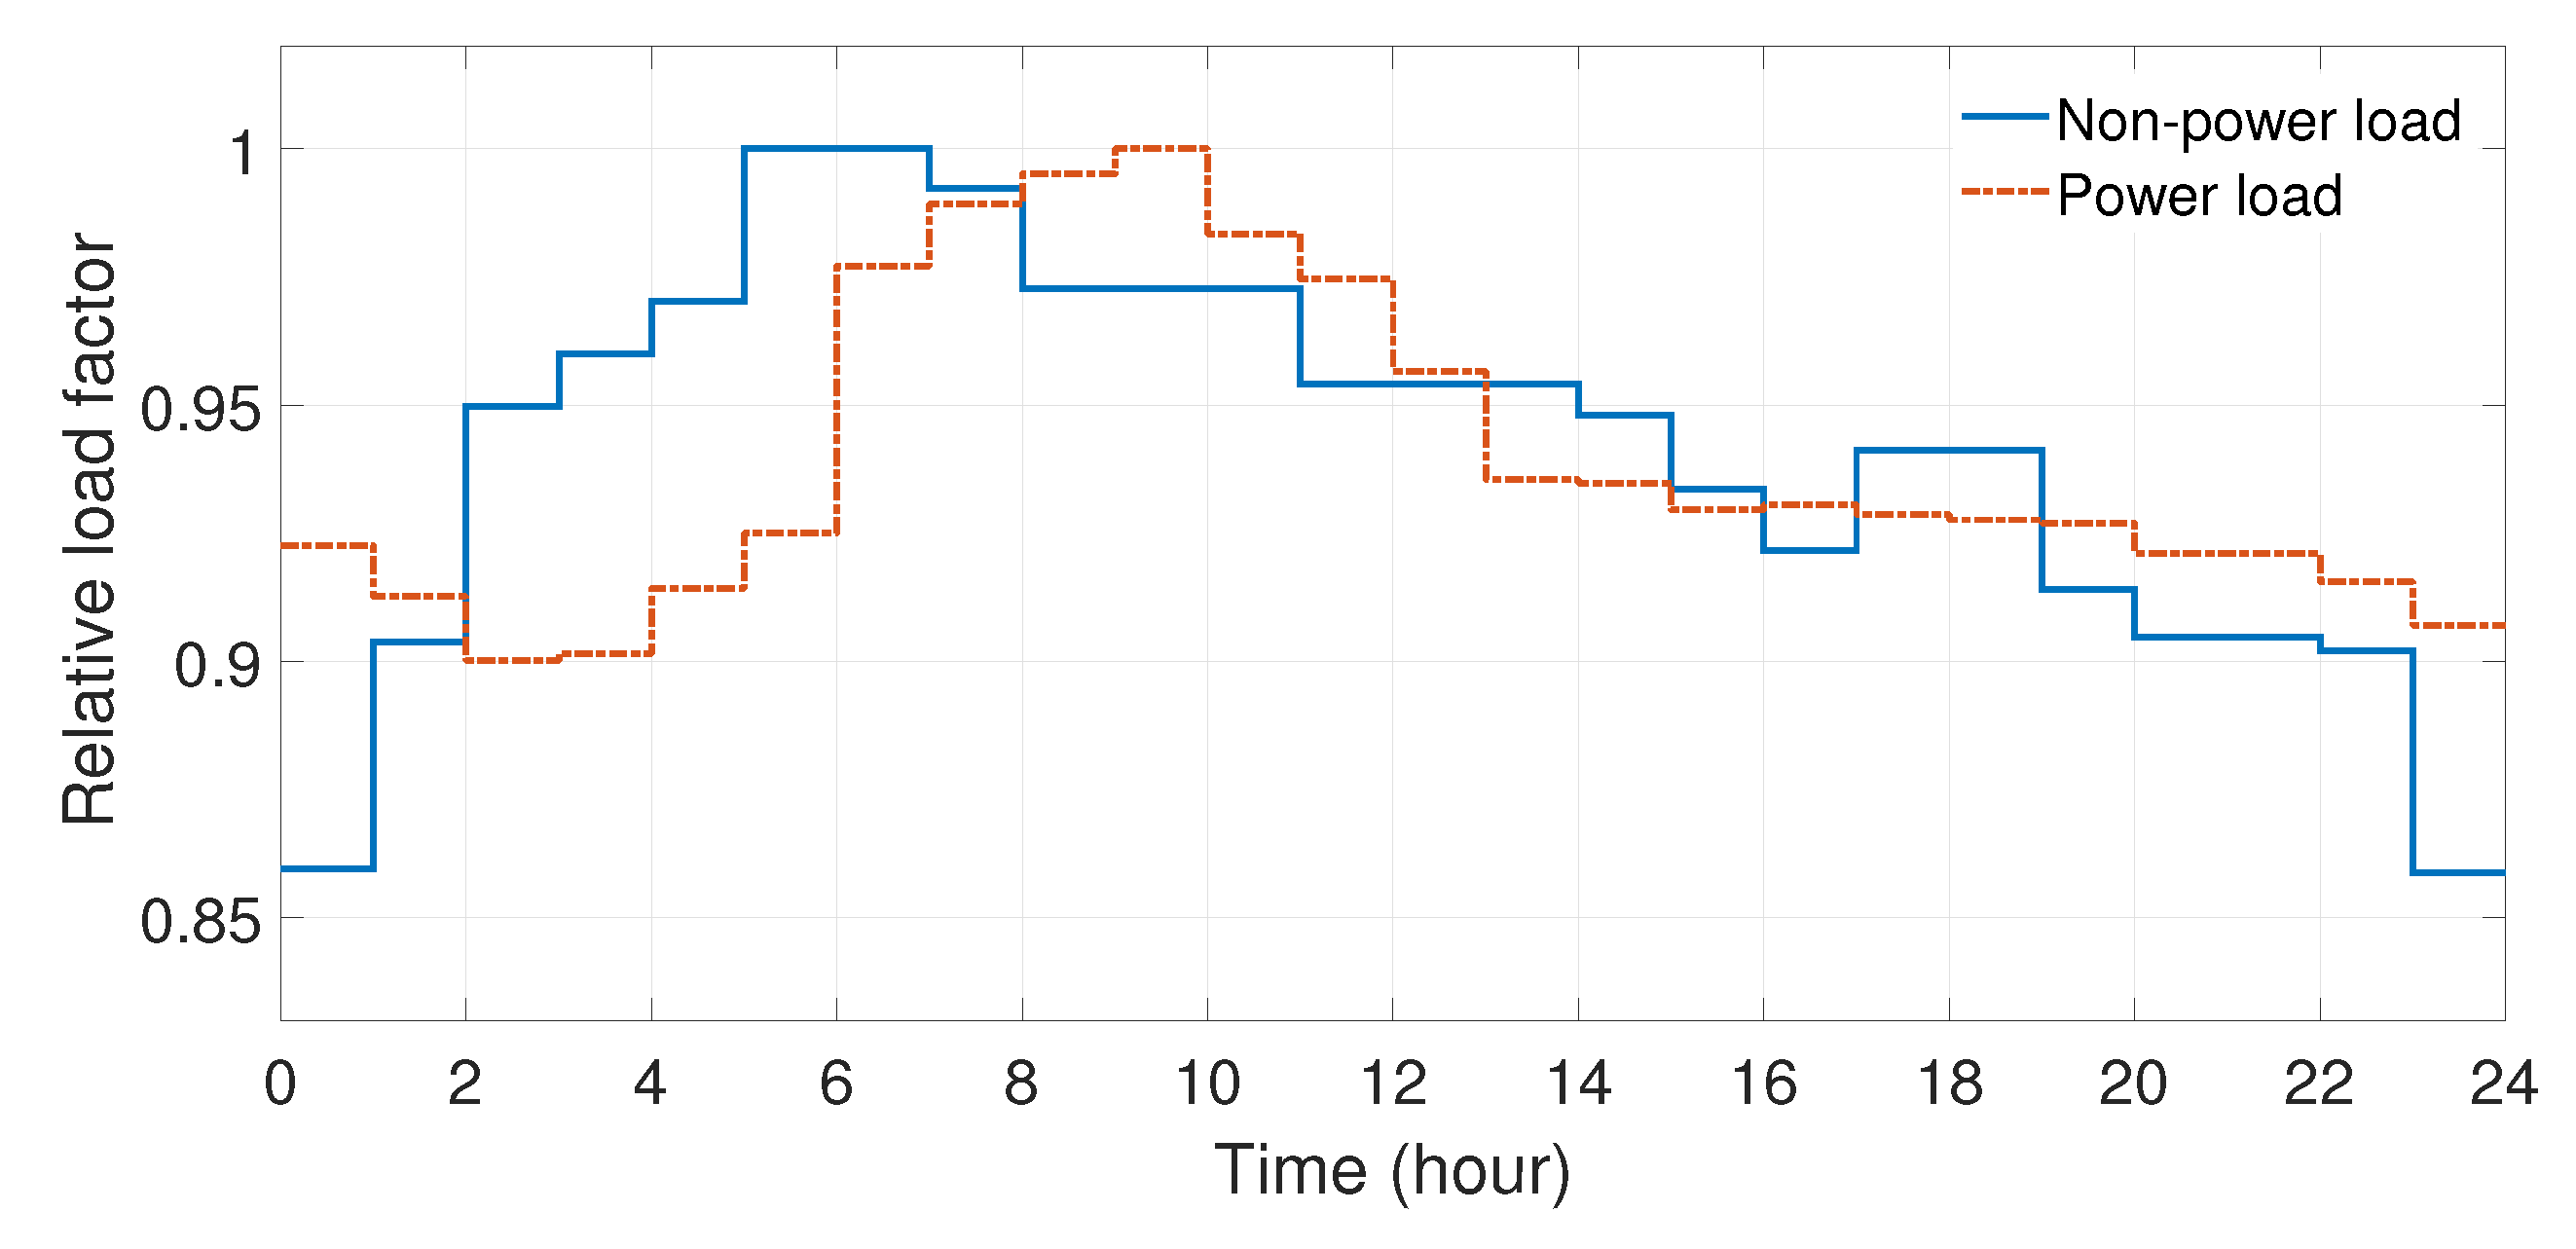
2.4. Curtailed Wind and Gas Demand
3. Results and Discussion
4. Conclusions
Author Contributions
Funding
Conflicts of Interest
Abbreviations
| Nomenclature | |
| A | Cross Sectional area of pipe (m) |
| D | pipe inner diameter (m) |
| E | Energy (J) |
| f | friction factor |
| f | theoretical friction factor |
| g | gravitational acceleration (ms) |
| dh | head losses (m) |
| i | sender node |
| j | receiver node |
| set of nodal load (demand, ms) | |
| set of pipe from the branch list | |
| l | pipe length (m) |
| set of natural gas compositions | |
| p | nodal pressure (Pa) |
| p | basic pressure (Pa) |
| p | critical pressure (Pa) |
| dp | differential pressure |
| p | pressure drop (Pa) |
| Q | flow rate (ms) |
| R | gas constant ((kJ/kgoK)) |
| t | time |
| T | Temperature (K) |
| T | basic temperature (K) |
| T | critical temperature (K) |
| V | volume (m) |
| W | work (J) |
| U | internal energy (J) |
| x | pipeline coordinate |
| X | volumetric fraction of components (%) |
| X | flow rate variable matrix |
| z | elevation (m) |
| Z | compressibility factor |
| inclination (rad) | |
| normal density (kg/m) | |
| density (kg/m) | |
| pipe efficiency | |
| shear stress (Pa) | |
| T | time span |
| velocity (m/s) | |
| heat energy (J) |
| Technical Acronyms | |
| CW | Curtailed Wind |
| NG | Natural Gas |
| ODE | Ordinary Differential Equation |
| P2G | Power-to-Gas |
| P2H | Power-to-Hydrogen |
| PDE | Partial Differential Equation |
| PEM | Polymer electrolyte membrane |
| RES | Renewable Energy Source |
Appendix A
Appendix A.1. Figures


| Pipe No. | Sender Node | Receiver Node | Diameter, m | Length, km |
|---|---|---|---|---|
| Pipe 1 | 1 | 19 | 0.76 | 280 |
| Pipe 2 | 2 | 10 | 0.6 | 300 |
| Pipe 3 | 3 | 9 | 0.6 | 70 |
| Pipe 4 | 9 | 6 | 0.6 | 15 |
| Pipe 5 | 7 | 6 | 0.6 | 15 |
| Pipe 6 | 8 | 7 | 0.6 | 15 |
| Pipe 7 | 9 | 8 | 0.6 | 7 |
| Pipe 8 | 3 | 5 | 0.6 | 15 |
| Pipe 9 | 5 | 14 | 0.6 | 70 |
| Pipe 10 | 5 | 11 | 0.6 | 35 |
| Pipe 11 | 4 | 5 | 0.6 | 130 |
| Pipe 12 | 2 | 4 | 0.6 | 113 |
| Pipe 13 | 11 | 12 | 0.6 | 15 |
| Pipe 14 | 11 | 13 | 0.6 | 13 |
| Pipe 15 | 14 | 16 | 0.6 | 20 |
| Pipe 16 | 15 | 17 | 0.6 | 20 |
| Pipe 17 | 14 | 15 | 0.6 | 30 |
| Pipe 18 | 15 | 6 | 0.6 | 30 |
| Pipe 19 | 4 | 18 | 0.6 | 100 |
| Pipe 20 | 18 | 10 | 0.6 | 65 |
| Pipe 21 | 19 | 10 | 0.6 | 5 |
| Pipe 22 | 20 | 19 | 0.6 | 160 |
| Pipe 23 | 1 | 20 | 0.6 | 180 |
| Pipe 24 | 20 | 21 | 0.6 | 100 |
| Pipe 25 | 4 | 22 | 0.6 | 5 |
| Pipe 26 | 24 | 5 | 0.6 | 20 |
| Pipe 27 | 23 | 4 | 0.6 | 20 |
| Pipe 28 | 25 | 20 | 0.6 | 20 |
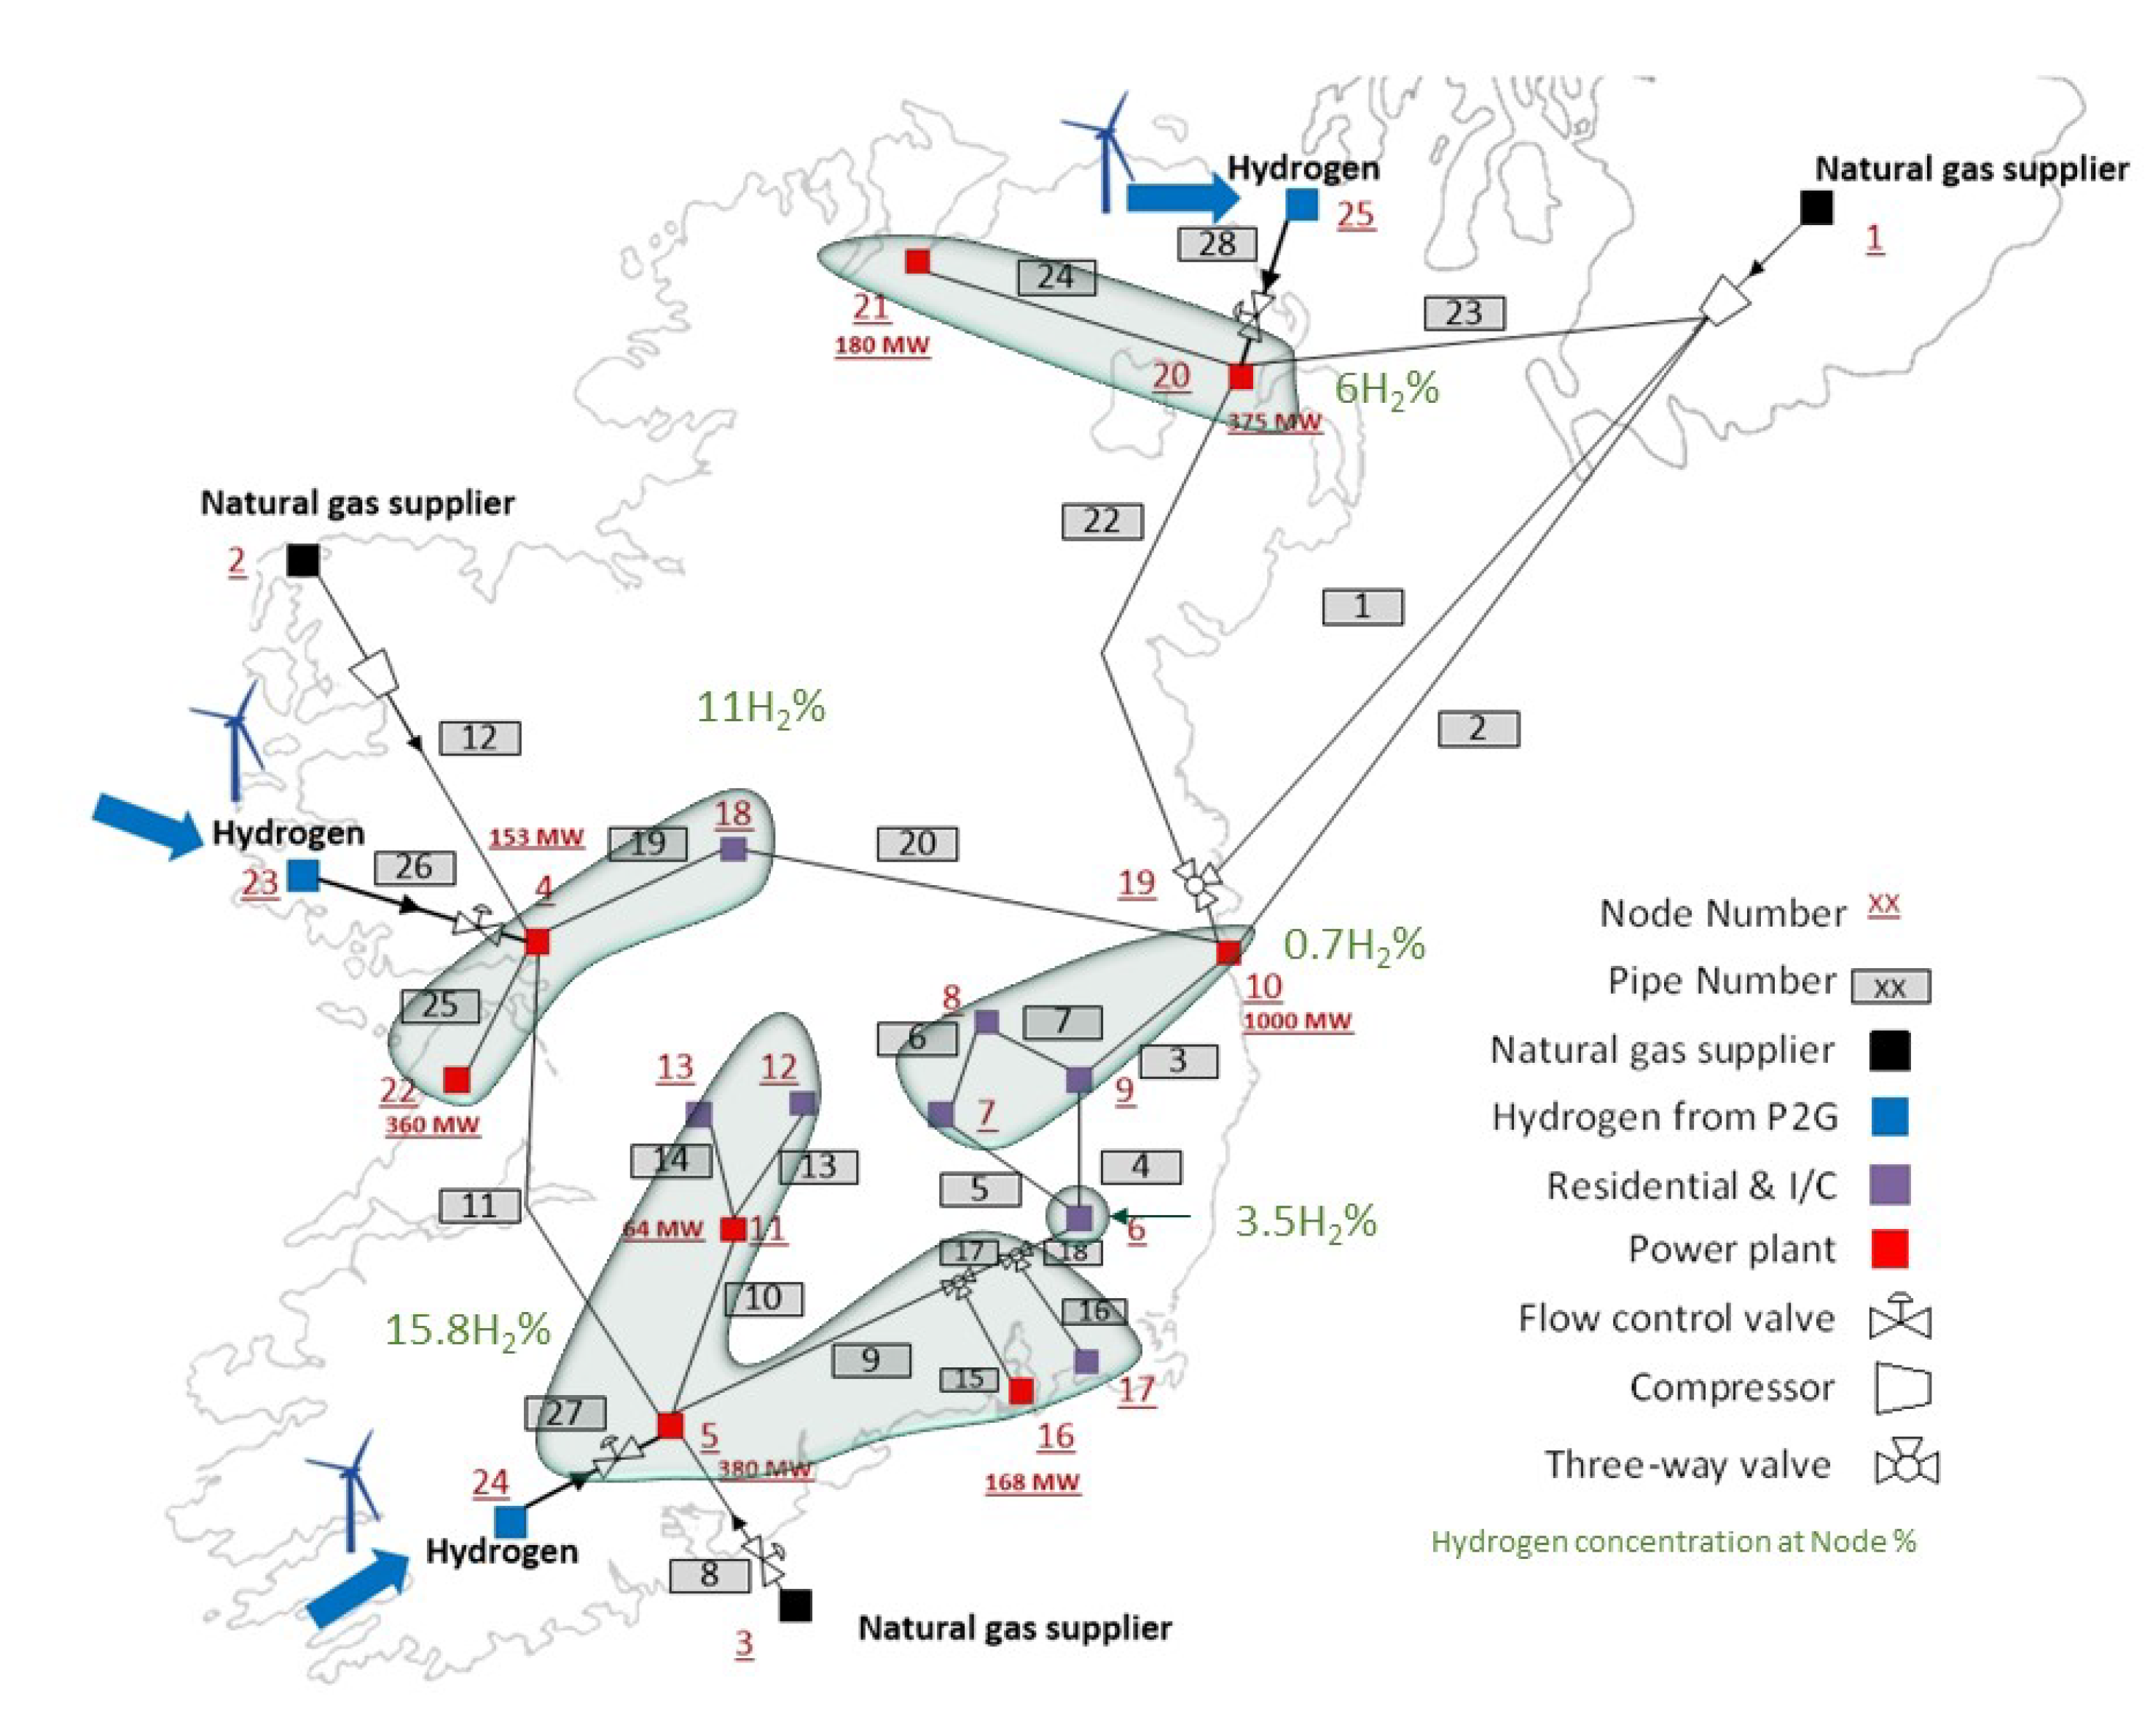
| Node | Type | Demand, MW | H_2% Limit | H_2% at Node | ||
|---|---|---|---|---|---|---|
| Max | Mean | Min | ||||
| 1 | Natural gas source | NaN | - | - | - | - |
| 2 | Natural gas source | NaN | - | - | - | - |
| 3 | Natural gas source | NaN | - | - | - | - |
| 4 | Power generator | 153 | 5 | 11 | 7.8 | 2 |
| 5 | Power generator | 378 | 5 | 15.8 | 10.8 | 3.5 |
| 6 | Other devices (CNG/Boilers/Heater/Residential) | 1049 | 2 < x < 20 | 3.5 | <1 | <1 |
| 7 | Other devices (CNG/Boilers/Heater/Residential) | 298 | 2 < x < 20 | <1 | <1 | <1 |
| 8 | Other devices (CNG/Boilers/Heater/Residential) | 75 | 2 < x < 20 | <1 | <1 | <1 |
| 9 | Other devices (CNG/Boilers/Heater/Residential) | 862 | 2 < x < 20 | <1 | <1 | <1 |
| 10 | Power generator | 2061 | 5 | <1 | <1 | <1 |
| 11 | Power generator | 64 | 5 | 15.8 | 10.8 | 3.5 |
| 12 | Other devices (CNG/Boilers/Heater/Residential) | 488 | 2 < x < 20 | 15.8 | 10.8 | 3.5 |
| 13 | Other devices (CNG/Boilers/Heater/Residential) | 470 | 2 < x < 20 | 15.8 | 10.8 | 3.5 |
| 14 | Connector | 0 | - | - | - | - |
| 15 | Connector | 0 | - | - | - | - |
| 16 | Power generator | 168 | 5 | 15.8 | 10.8 | 3.5 |
| 17 | Other devices (CNG/Boilers/Heater/Residential) | 186 | 2 < x < 20 | 15.8 | 10.8 | 3.5 |
| 18 | Other devices (CNG/Boilers/Heater/Residential) | 112 | 2 < x < 20 | 11 | 7.8 | 2 |
| 19 | Connector | 0 | - | - | - | - |
| 20 | Power generator | 374 | 5 | 6 | 4.3 | 3 |
| 21 | Power generator | 180 | 5 | 6 | 4.3 | 3 |
| 22 | Power generator | 359 | 5 | 11 | 7.8 | 2 |
| 23 | P2H | NaN | - | - | - | - |
| 24 | P2H | NaN | - | - | - | - |
| 25 | P2H | NaN | - | - | - | - |
| Pipe No. | Flow Rate before Injecting H2 in Hourly Steps, Sm/s | ||||||||||||||||||||||||
|---|---|---|---|---|---|---|---|---|---|---|---|---|---|---|---|---|---|---|---|---|---|---|---|---|---|
| t0 | t1 | t2 | t3 | t4 | t5 | t6 | t7 | t8 | t9 | t10 | t11 | t12 | t13 | t14 | t15 | t16 | t17 | t18 | t19 | t20 | t21 | t22 | t23 | t24 | |
| P1 | 38.5 | 39.0 | 39.9 | 40.4 | 40.8 | 42.7 | 43.0 | 43.0 | 42.8 | 42.3 | 42.1 | 41.3 | 40.8 | 40.8 | 40.5 | 40.3 | 40.1 | 40.4 | 40.4 | 39.7 | 39.6 | 39.4 | 39.2 | 38.4 | 38.4 |
| P2 | 22.0 | 22.3 | 22.7 | 23.0 | 23.3 | 24.3 | 24.5 | 24.5 | 24.4 | 24.2 | 24.0 | 23.6 | 23.3 | 23.3 | 23.1 | 23.0 | 22.9 | 23.0 | 23.0 | 22.7 | 22.6 | 22.5 | 22.3 | 21.9 | 21.9 |
| P3 | 59.9 | 59.6 | 60.1 | 60.9 | 61.7 | 64.9 | 65.6 | 65.8 | 65.9 | 65.0 | 64.5 | 63.3 | 62.1 | 62.1 | 61.7 | 61.6 | 61.4 | 61.5 | 61.5 | 60.9 | 60.8 | 60.5 | 60.0 | 59.5 | 59.5 |
| P4 | 19.7 | 19.8 | 20.1 | 20.4 | 20.6 | 21.7 | 21.9 | 21.9 | 21.8 | 21.5 | 21.4 | 21.0 | 20.6 | 20.6 | 20.5 | 20.4 | 20.3 | 20.4 | 20.4 | 20.2 | 20.2 | 20.1 | 20.0 | 19.7 | 19.7 |
| P5 | 6.5 | 6.6 | 6.8 | 7.0 | 7.0 | 7.4 | 7.4 | 7.3 | 7.2 | 7.2 | 7.1 | 7.0 | 6.9 | 6.9 | 6.8 | 6.8 | 6.7 | 6.8 | 6.8 | 6.7 | 6.7 | 6.7 | 6.7 | 6.6 | 6.6 |
| P6 | 14.7 | 14.7 | 14.9 | 15.2 | 15.3 | 16.1 | 16.2 | 16.3 | 16.3 | 16.0 | 15.9 | 15.6 | 15.4 | 15.3 | 15.2 | 15.2 | 15.1 | 15.2 | 15.2 | 15.0 | 15.0 | 14.9 | 14.8 | 14.7 | 14.7 |
| P7 | 16.8 | 16.8 | 17.0 | 17.2 | 17.4 | 18.3 | 18.5 | 18.5 | 18.5 | 18.3 | 18.1 | 17.8 | 17.5 | 17.5 | 17.4 | 17.3 | 17.3 | 17.3 | 17.3 | 17.1 | 17.1 | 17.0 | 16.9 | 16.7 | 16.7 |
| P8 | 4.1 | 4.1 | 4.1 | 4.1 | 4.2 | 4.4 | 4.5 | 4.5 | 4.5 | 4.4 | 4.4 | 4.3 | 4.2 | 4.2 | 4.2 | 4.2 | 4.2 | 4.2 | 4.2 | 4.1 | 4.1 | 4.1 | 4.1 | 4.1 | 4.1 |
| P9 | 10.6 | 10.2 | 10.0 | 10.2 | 10.3 | 11.0 | 11.2 | 11.3 | 11.5 | 11.2 | 11.1 | 10.9 | 10.6 | 10.5 | 10.5 | 10.6 | 10.6 | 10.5 | 10.5 | 10.5 | 10.6 | 10.5 | 10.3 | 10.5 | 10.5 |
| P10 | 27.4 | 27.1 | 27.3 | 27.6 | 28.0 | 29.5 | 29.8 | 30.0 | 30.1 | 29.6 | 29.4 | 28.8 | 28.2 | 28.2 | 28.0 | 28.1 | 28.0 | 28.0 | 28.0 | 27.7 | 27.7 | 27.6 | 27.3 | 27.2 | 27.2 |
| P11 | 44.0 | 43.9 | 44.4 | 45.0 | 45.5 | 47.8 | 48.3 | 48.5 | 48.5 | 47.8 | 47.5 | 46.6 | 45.8 | 45.8 | 45.5 | 45.4 | 45.2 | 45.4 | 45.3 | 44.9 | 44.8 | 44.6 | 44.2 | 43.8 | 43.8 |
| P12 | 63.7 | 64.4 | 65.8 | 66.6 | 67.4 | 70.4 | 71.0 | 71.0 | 70.7 | 70.0 | 69.6 | 68.3 | 67.4 | 67.4 | 67.0 | 66.6 | 66.2 | 66.7 | 66.7 | 65.6 | 65.4 | 65.1 | 64.7 | 63.4 | 63.4 |
| P13 | 13.1 | 12.9 | 12.9 | 13.1 | 13.3 | 14.0 | 14.2 | 14.3 | 14.3 | 14.1 | 14.0 | 13.7 | 13.4 | 13.4 | 13.3 | 13.4 | 13.3 | 13.3 | 13.3 | 13.2 | 13.2 | 13.1 | 13.0 | 13.0 | 13.0 |
| P14 | 12.6 | 12.4 | 12.4 | 12.6 | 12.8 | 13.5 | 13.7 | 13.7 | 13.8 | 13.6 | 13.4 | 13.2 | 12.9 | 12.9 | 12.8 | 12.9 | 12.8 | 12.8 | 12.8 | 12.7 | 12.7 | 12.6 | 12.5 | 12.5 | 12.5 |
| P15 | 4.5 | 4.7 | 5.0 | 5.0 | 5.1 | 5.2 | 5.2 | 5.2 | 5.1 | 5.1 | 5.1 | 5.0 | 5.0 | 5.0 | 5.0 | 4.9 | 4.8 | 4.9 | 4.9 | 4.8 | 4.7 | 4.7 | 4.7 | 4.5 | 4.5 |
| P16 | 5.0 | 4.9 | 4.9 | 5.0 | 5.1 | 5.3 | 5.4 | 5.5 | 5.5 | 5.4 | 5.3 | 5.2 | 5.1 | 5.1 | 5.1 | 5.1 | 5.1 | 5.1 | 5.1 | 5.0 | 5.0 | 5.0 | 5.0 | 5.0 | 5.0 |
| P17 | 6.1 | 5.5 | 5.1 | 5.2 | 5.2 | 5.8 | 6.0 | 6.1 | 6.4 | 6.1 | 6.0 | 5.9 | 5.6 | 5.5 | 5.5 | 5.7 | 5.8 | 5.6 | 5.5 | 5.7 | 5.8 | 5.7 | 5.6 | 6.1 | 6.1 |
| P18 | 1.1 | 0.6 | 0.1 | 0.2 | 0.2 | 0.4 | 0.5 | 0.7 | 0.9 | 0.8 | 0.7 | 0.7 | 0.4 | 0.4 | 0.4 | 0.6 | 0.7 | 0.5 | 0.5 | 0.7 | 0.8 | 0.7 | 0.7 | 1.1 | 1.1 |
| P19 | 5.9 | 6.1 | 6.2 | 6.3 | 6.4 | 6.6 | 6.7 | 6.7 | 6.6 | 6.6 | 6.5 | 6.4 | 6.3 | 6.3 | 6.3 | 6.3 | 6.2 | 6.3 | 6.3 | 6.2 | 6.1 | 6.1 | 6.1 | 5.9 | 5.9 |
| P20 | 2.9 | 3.1 | 3.3 | 3.3 | 3.3 | 3.4 | 3.4 | 3.4 | 3.3 | 3.3 | 3.3 | 3.3 | 3.3 | 3.3 | 3.2 | 3.2 | 3.1 | 3.2 | 3.2 | 3.1 | 3.1 | 3.1 | 3.1 | 2.9 | 2.9 |
| P21 | 58.2 | 58.7 | 59.8 | 60.6 | 61.3 | 64.2 | 64.7 | 64.7 | 64.5 | 63.8 | 63.4 | 62.2 | 61.4 | 61.3 | 61.0 | 60.7 | 60.3 | 60.7 | 60.7 | 59.8 | 59.6 | 59.4 | 59.0 | 57.9 | 57.9 |
| P22 | 19.7 | 19.7 | 20.0 | 20.2 | 20.5 | 21.5 | 21.7 | 21.7 | 21.7 | 21.4 | 21.3 | 20.9 | 20.5 | 20.5 | 20.4 | 20.4 | 20.3 | 20.3 | 20.3 | 20.1 | 20.0 | 20.0 | 19.8 | 19.6 | 19.6 |
| P23 | 34.5 | 35.3 | 36.3 | 36.7 | 37.2 | 38.7 | 38.9 | 38.8 | 38.5 | 38.2 | 38.0 | 37.3 | 37.0 | 37.0 | 36.7 | 36.4 | 36.1 | 36.5 | 36.5 | 35.8 | 35.6 | 35.5 | 35.3 | 34.4 | 34.4 |
| P24 | 4.8 | 5.1 | 5.3 | 5.4 | 5.4 | 5.6 | 5.6 | 5.5 | 5.4 | 5.4 | 5.4 | 5.3 | 5.3 | 5.3 | 5.3 | 5.2 | 5.1 | 5.3 | 5.2 | 5.1 | 5.1 | 5.1 | 5.0 | 4.8 | 4.8 |
| P25 | 9.6 | 10.1 | 10.6 | 10.7 | 10.8 | 11.2 | 11.2 | 11.1 | 10.9 | 10.9 | 10.9 | 10.7 | 10.7 | 10.7 | 10.6 | 10.4 | 10.3 | 10.5 | 10.5 | 10.2 | 10.1 | 10.1 | 10.1 | 9.6 | 9.6 |
| Pipe No. | Flow Rate after Injecting H2 in Hourly Steps, Sm/s | ||||||||||||||||||||||||
|---|---|---|---|---|---|---|---|---|---|---|---|---|---|---|---|---|---|---|---|---|---|---|---|---|---|
| t0 | t1 | t2 | t3 | t4 | t5 | t6 | t7 | t8 | t9 | t10 | t11 | t12 | t13 | t14 | t15 | t16 | t17 | t18 | t19 | t20 | t21 | t22 | t23 | t24 | |
| P1 | 38.5 | 39.0 | 39.8 | 40.3 | 40.8 | 42.7 | 43.0 | 43.0 | 42.8 | 42.3 | 42.1 | 41.3 | 40.8 | 40.8 | 40.5 | 40.3 | 40.0 | 40.4 | 40.3 | 39.7 | 39.5 | 39.4 | 39.1 | 38.4 | 38.4 |
| P2 | 21.9 | 22.2 | 22.7 | 23.0 | 23.2 | 24.3 | 24.5 | 24.5 | 24.4 | 24.1 | 24.0 | 23.5 | 23.2 | 23.2 | 23.1 | 22.9 | 22.8 | 23.0 | 23.0 | 22.6 | 22.5 | 22.4 | 22.3 | 21.9 | 21.9 |
| P3 | 60.3 | 59.9 | 60.4 | 61.2 | 61.9 | 65.1 | 65.8 | 66.1 | 66.3 | 65.3 | 64.9 | 63.7 | 62.5 | 62.4 | 62.1 | 62.0 | 61.8 | 61.9 | 61.8 | 61.2 | 61.1 | 60.8 | 60.2 | 59.8 | 59.8 |
| P4 | 20.0 | 20.1 | 20.4 | 20.6 | 20.9 | 21.9 | 22.1 | 22.1 | 22.1 | 21.8 | 21.7 | 21.3 | 21.0 | 20.9 | 20.8 | 20.7 | 20.6 | 20.7 | 20.7 | 20.5 | 20.4 | 20.3 | 20.2 | 19.9 | 19.9 |
| P5 | 6.9 | 7.0 | 7.2 | 7.3 | 7.3 | 7.7 | 7.7 | 7.7 | 7.6 | 7.6 | 7.5 | 7.4 | 7.3 | 7.3 | 7.3 | 7.2 | 7.2 | 7.2 | 7.2 | 7.1 | 7.1 | 7.0 | 7.0 | 6.8 | 6.8 |
| P6 | 14.9 | 14.9 | 15.1 | 15.3 | 15.5 | 16.2 | 16.4 | 16.4 | 16.4 | 16.2 | 16.1 | 15.8 | 15.5 | 15.5 | 15.4 | 15.4 | 15.3 | 15.4 | 15.4 | 15.2 | 15.1 | 15.1 | 15.0 | 14.8 | 14.8 |
| P7 | 16.9 | 16.9 | 17.1 | 17.3 | 17.5 | 18.4 | 18.5 | 18.6 | 18.6 | 18.3 | 18.2 | 17.9 | 17.6 | 17.6 | 17.5 | 17.4 | 17.3 | 17.4 | 17.4 | 17.2 | 17.2 | 17.1 | 16.9 | 16.8 | 16.8 |
| P8 | 4.1 | 4.0 | 4.1 | 4.1 | 4.2 | 4.4 | 4.5 | 4.5 | 4.5 | 4.4 | 4.4 | 4.3 | 4.2 | 4.2 | 4.2 | 4.2 | 4.2 | 4.2 | 4.2 | 4.2 | 4.2 | 4.1 | 4.1 | 4.1 | 4.1 |
| P9 | 12.5 | 12.0 | 11.6 | 11.6 | 11.7 | 12.4 | 12.7 | 13.1 | 13.4 | 13.2 | 13.2 | 13.0 | 12.6 | 12.7 | 12.6 | 12.7 | 12.7 | 12.5 | 12.4 | 12.3 | 12.3 | 12.1 | 11.7 | 11.8 | 11.7 |
| P10 | 28.3 | 28.0 | 28.0 | 28.3 | 28.6 | 30.1 | 30.5 | 30.8 | 31.0 | 30.5 | 30.3 | 29.8 | 29.2 | 29.2 | 29.0 | 29.0 | 28.9 | 28.9 | 28.8 | 28.6 | 28.6 | 28.3 | 28.0 | 27.9 | 27.8 |
| P11 | 45.2 | 45.1 | 45.3 | 45.8 | 46.4 | 48.7 | 49.3 | 49.6 | 49.7 | 49.1 | 48.8 | 47.9 | 47.1 | 47.1 | 46.8 | 46.7 | 46.5 | 46.6 | 46.5 | 46.0 | 45.9 | 45.5 | 45.0 | 44.6 | 44.5 |
| P12 | 63.6 | 64.4 | 65.8 | 66.6 | 67.3 | 70.4 | 71.0 | 71.0 | 70.6 | 69.9 | 69.5 | 68.2 | 67.3 | 67.3 | 66.9 | 66.5 | 66.1 | 66.6 | 66.6 | 65.6 | 65.3 | 65.1 | 64.6 | 63.4 | 63.4 |
| P13 | 13.5 | 13.3 | 13.3 | 13.4 | 13.6 | 14.3 | 14.5 | 14.7 | 14.8 | 14.5 | 14.4 | 14.2 | 13.9 | 13.9 | 13.8 | 13.8 | 13.8 | 13.8 | 13.7 | 13.6 | 13.6 | 13.5 | 13.3 | 13.3 | 13.3 |
| P14 | 13.0 | 12.8 | 12.8 | 12.9 | 13.1 | 13.8 | 14.0 | 14.1 | 14.2 | 14.0 | 13.9 | 13.7 | 13.4 | 13.3 | 13.3 | 13.3 | 13.3 | 13.2 | 13.2 | 13.1 | 13.1 | 13.0 | 12.8 | 12.8 | 12.8 |
| P15 | 4.6 | 4.9 | 5.1 | 5.1 | 5.2 | 5.3 | 5.4 | 5.3 | 5.2 | 5.2 | 5.3 | 5.2 | 5.2 | 5.2 | 5.1 | 5.1 | 5.0 | 5.1 | 5.1 | 4.9 | 4.9 | 4.9 | 4.8 | 4.6 | 4.6 |
| P16 | 5.2 | 5.1 | 5.1 | 5.1 | 5.2 | 5.5 | 5.5 | 5.6 | 5.6 | 5.6 | 5.5 | 5.4 | 5.3 | 5.3 | 5.3 | 5.3 | 5.3 | 5.2 | 5.2 | 5.2 | 5.2 | 5.2 | 5.1 | 5.1 | 5.1 |
| P17 | 7.9 | 7.2 | 6.5 | 6.5 | 6.5 | 7.1 | 7.4 | 7.8 | 8.2 | 8.0 | 7.9 | 7.8 | 7.5 | 7.5 | 7.5 | 7.6 | 7.7 | 7.4 | 7.3 | 7.4 | 7.5 | 7.2 | 6.9 | 7.2 | 7.1 |
| P18 | 2.7 | 2.1 | 1.4 | 1.3 | 1.3 | 1.6 | 1.8 | 2.2 | 2.6 | 2.4 | 2.4 | 2.4 | 2.2 | 2.2 | 2.2 | 2.3 | 2.4 | 2.2 | 2.1 | 2.2 | 2.3 | 2.0 | 1.8 | 2.2 | 2.1 |
| P19 | 6.3 | 6.4 | 6.5 | 6.6 | 6.6 | 6.9 | 7.0 | 7.0 | 7.0 | 6.9 | 6.9 | 6.8 | 6.7 | 6.7 | 6.7 | 6.6 | 6.6 | 6.6 | 6.6 | 6.5 | 6.4 | 6.4 | 6.3 | 6.1 | 6.1 |
| P20 | 3.2 | 3.3 | 3.5 | 3.5 | 3.5 | 3.6 | 3.6 | 3.6 | 3.6 | 3.6 | 3.6 | 3.5 | 3.5 | 3.5 | 3.5 | 3.5 | 3.4 | 3.5 | 3.5 | 3.4 | 3.3 | 3.3 | 3.3 | 3.1 | 3.1 |
| P21 | 59.1 | 59.5 | 60.5 | 61.2 | 61.9 | 64.8 | 65.3 | 65.5 | 65.4 | 64.7 | 64.3 | 63.2 | 62.3 | 62.3 | 61.9 | 61.6 | 61.2 | 61.6 | 61.5 | 60.6 | 60.4 | 60.1 | 59.5 | 58.5 | 58.5 |
| P22 | 20.5 | 20.5 | 20.6 | 20.8 | 21.1 | 22.1 | 22.4 | 22.5 | 22.6 | 22.3 | 22.2 | 21.8 | 21.5 | 21.5 | 21.4 | 21.3 | 21.2 | 21.3 | 21.2 | 20.9 | 20.9 | 20.7 | 20.4 | 20.2 | 20.1 |
| P23 | 34.2 | 35.0 | 36.1 | 36.5 | 36.9 | 38.5 | 38.7 | 38.5 | 38.2 | 37.9 | 37.7 | 37.0 | 36.7 | 36.6 | 36.4 | 36.1 | 35.8 | 36.2 | 36.2 | 35.6 | 35.3 | 35.3 | 35.1 | 34.1 | 34.2 |
| P24 | 5.0 | 5.2 | 5.4 | 5.5 | 5.5 | 5.7 | 5.7 | 5.7 | 5.6 | 5.6 | 5.6 | 5.5 | 5.5 | 5.5 | 5.5 | 5.4 | 5.3 | 5.4 | 5.4 | 5.3 | 5.2 | 5.2 | 5.2 | 4.9 | 4.9 |
| P25 | 9.9 | 10.4 | 10.9 | 11.0 | 11.1 | 11.4 | 11.4 | 11.4 | 11.2 | 11.2 | 11.2 | 11.0 | 11.0 | 11.0 | 10.9 | 10.8 | 10.7 | 10.9 | 10.8 | 10.5 | 10.4 | 10.4 | 10.3 | 9.8 | 9.8 |
| P26 | 1.9 | 1.8 | 1.6 | 1.5 | 1.4 | 1.4 | 1.6 | 1.8 | 2.0 | 2.0 | 2.1 | 2.1 | 2.1 | 2.1 | 2.1 | 2.1 | 2.1 | 2.1 | 2.0 | 1.9 | 1.8 | 1.6 | 1.4 | 1.3 | 1.2 |
| P27 | 1.9 | 1.8 | 1.6 | 1.5 | 1.4 | 1.4 | 1.6 | 1.8 | 2.0 | 2.0 | 2.1 | 2.1 | 2.1 | 2.1 | 2.1 | 2.1 | 2.1 | 2.1 | 2.0 | 1.9 | 1.8 | 1.6 | 1.4 | 1.3 | 1.2 |
| P28 | 1.6 | 1.6 | 1.4 | 1.2 | 1.2 | 1.2 | 1.3 | 1.6 | 1.7 | 1.7 | 1.8 | 1.8 | 1.8 | 1.8 | 1.8 | 1.8 | 1.8 | 1.8 | 1.7 | 1.6 | 1.5 | 1.4 | 1.2 | 1.1 | 1.0 |
References
- Ritchie, H.; Roser, M. CO2 and Greenhouse Gas Emissions. Our World in Data. Available online: https://ourworldindata.org/co2-and-other-greenhouse-gas-emissions (accessed on 21 February 2020).
- York, R.; Shannon, E. Energy transitions or additions: Why a transition from fossil fuels requires more than the growth of renewable energy? Energy Res. Soc. Sci. 2019, 51, 40–43. [Google Scholar] [CrossRef]
- IEA (International Energy Agency). World Energy Balances: Overview. IEA Report. 2019. Available online: https://www.iea.org/reports/world-energy-balances-overview (accessed on 21 February 2020).
- IEA. The Role of Gas in Today’s Energy Transitions. International Energy Agency, 2019. Available online: https://www.iea.org/reports/the-role-of-gas-in-todays-energy-transitions (accessed on 8 May 2020).
- GNI. Delivering a Reliable and Secure Gas Supply, Ireland’s Gas Network. GNI Report 2016. Available online: https://www.gasnetworks.ie/corporate/company/our-network/18048_GNI_GasNetwork_ReliabilityCapacity_Doc_Update.pdf (accessed on 10 February 2020).
- Yang, Z.; Gao, C.; Zhao, M. Coordination of integrated natural gas and electrical systems in day-ahead scheduling considering a novel flexible energy-use mechanism. Energy Convers. Manag. 2019, 196, 117–126. [Google Scholar] [CrossRef]
- SEAI (Sustainable Energy Authority of Ireland). Energy in Ireland, Report 2018; SEAI Annual Report; SEAI: Dublin, Ireland, 2018. [Google Scholar]
- IWEA. Wind Energy. Ireland’s Wind Asscociation, 2019. Available online: https://www.iwea.com/about-wind/facts-stats (accessed on 22 November 2019).
- EirGrid. Annual Renewable Energy Constraint and Curtailment Report 2019. Eirgrid-SONI Report. 2020. Available online: http://www.eirgridgroup.com/site-files/library/EirGrid/Annual-Renewable-Constraint-and-Curtailment-Report-2018-V1.0.pdf (accessed on 10 September 2020).
- EirGrid. Annual Renewable Energy Constraint and Curtailment Report 2017. Eirgrid-SONI Report. 2018. Available online: http://www.eirgridgroup.com/Annual-Renewable-Constraint-and-Curtailment-Report-2017-V1.pdf (accessed on 20 September 2019).
- EirGrid. Annual Renewable Energy Constraint and Curtailment Report 2018. Eirgrid-SONI Report. 2019. Available online: https://www.eirgridgroup.com/site-files/library/EirGrid/Annual-Renewable-Constraint-and-Curtailment-Report-2018-Non-Technical-Summary-V1.0.pdf (accessed on 20 September 2019).
- EPA. Ireland’s Greenhouse Gas Emissions Projections 2018–2040, Environmental Protection Agency. EPA Report. 2019. Available online: https://www.epa.ie/pubs/reports/air/airemissions/ghgprojections2018-2040/ (accessed on 10 February 2020).
- Thema, M.; Bauer, F.; Sterner, M. Electrolysis and methanation status review. Renew. Sustain. Energy Rev. 2019, 112, 775–787. [Google Scholar] [CrossRef]
- Hang, Y.; Wang, L.; Wang, N.; Duan, L.; Zong, Y.; You, S.; Maréchal, F.; Van herle, J.; Yang, Y. Balancing wind-power fluctuation via onsite storage under uncertainty: Power-to-hydrogen-to-power versus lithium battery. Renew. Sustain. Energy Rev. 2019, 116, 109465. [Google Scholar]
- Bassano, C.; Deiana, P.; Lietti, L.; Visconti, C.G. P2G movable modular plant operation on synthetic methane production from CO2 and hydrogen from renewables sources. Fuel 2019, 253, 1071–1079. [Google Scholar] [CrossRef]
- Ajanovic, A.; Haas, R. On the long-term prospects of power-to-gas technologies. Wiley Interdiscip. Rev. Energy Environ. 2019, 1, e318. [Google Scholar] [CrossRef]
- Gruber, M.; Weinbrecht, P.; Biffar, L.; Harth, S.; Trimis, D.; Brabandt, J.; Posdziech, O.; Blumentritt, R. Power-to-Gas through thermal integration of high-temperature steam electrolysis and carbon dioxide methanation-Experimental results. Wiley Interdiscip. Rev. Energy Environ. 2018, 181, 61–74. [Google Scholar] [CrossRef]
- Ameli, H.; Qadrdan, M.; Strbac, G.; Strbac, G. Techno-economic assessment of battery storage and Power-to-Gas: A whole-system approach. Energy Procedia 2017, 142, 841–848. [Google Scholar] [CrossRef]
- Qadrdan, M.; Abeysekera, M.; Chaudry, M.; Wu, J.; Jenkins, N. Role of power-to-gas in an integrated gas and electricity system in Great Britain. Int. J. Hydrog. Energy 2015, 14, 5763–5775. [Google Scholar] [CrossRef]
- Clegg, S.; Mancarella, P. Storing renewables in the gas network: Modelling of power-to-gas seasonal storage flexibility in low-carbon power systems. IET Gener. Transm. Distrib. 2016, 10, 566–575. [Google Scholar] [CrossRef]
- Gondal, I.A. Hydrogen integration in power-to-gas networks. Int. J. Hydrog. Energy 2019, 44, 1803–1815. [Google Scholar] [CrossRef]
- Devlin, J.; Li, K.; Higgins, P.; Foley, A. A multi vector energy analysis for interconnected power and gas systems. Appl. Energy 2017, 192, 315–328. [Google Scholar] [CrossRef]
- Altfeld, K.; Pinchbeck, D. Admissible hydrogen concentrations in natural gas systems. Gas Energy 2013. Available online: https://www.gerg.eu/wp-content/uploads/2019/10/HIPS_Final-Report.pdf (accessed on 10 February 2020).
- UN/ECE. Agreement Concerning the Adoption of Uniform Technical Prescriptions for Wheeled Vehicles, Equipment and Parts which can be Fitted and/or be Used on Wheeled Vehicles and the Conditions for Reciprocal Recognition of Approvals Granted on the Basis of these Prescriptions. Off. J. Eur. Union 2014. Available online: https://www.unece.org/fileadmin/DAM/trans/main/wp29/wp29regs/2015/R110r3e.pdf (accessed on 20 February 2020).
- Abeysekera, M.; Wu, J.; Jenkins, N.; Rees, M. Steady state analysis of gas networks with distributed injection of alternative gas. Appl. Energy 2016, 164, 991–1002. [Google Scholar] [CrossRef]
- Pambour, K.; Sopgwi, R.; Hodge, B.M.; Brancucci, C. The value of day-ahead coordination of power and natural gas network operations. Energies 2018, 11, 1628. [Google Scholar] [CrossRef]
- Yang, L.; Zhao, X.; Li, X.; Feng, X.; Yan, W. An MILP-Based Optimal Power and Gas Flow in Electricity-gas Coupled Networks. Energy Procedia 2019, 158, 6399–6404. [Google Scholar] [CrossRef]
- Qadrdan, M.; Fazeli, R.; Jenkins, N.; Strbac, G.; Sansom, R. Gas and electricity supply implications of decarbonising heat sector in GB. Energy 2019, 169, 50–60. [Google Scholar] [CrossRef]
- Khalilpour, K.R. Interconnected Electricity and Natural Gas Supply Chains: The Roles of Power to Gas and Gas to Power. In Polygeneration with Polystorage for Chemical and Energy Hubs; Elsevier: Amsterdam, The Netherlands, 2019; pp. 133–155. [Google Scholar]
- Ordoudis, C.; Pinson, P.; Morales, J. An integrated market for electricity and natural gas systems with stochastic power producers. Eur. J. Oper. Res. 2019, 272, 642–654. [Google Scholar] [CrossRef]
- Nasrolahpour, E.; Kazempour, J.; Zareipour, H.; Rosehart, W.D. A Bilevel Model for Participation of a Storage System in Energy and Reserve Markets. IEEE Trans. Sustain. Energy 2018, 9, 582–598. [Google Scholar] [CrossRef]
- Tabkhi, F.; Azzaro-Pantel, C.; Pibouleau, L.; Domenech, S. A mathematical framework for modelling and evaluating natural gas pipeline networks under hydrogen injection. Int. J. Hydrog. Energy 2008, 33, 6222–6231. [Google Scholar] [CrossRef]
- Osiadacz Andrzej, J. Numerical solution of algebralc equallons. In Simulation and Analysis of Gas Networks; E. & F.N. SPON: London, UK, 1987. [Google Scholar]
- Ekhtiari, A.; Dassios, I.; Liu, M.; Syron, E. A novel approach to model a gas network. Appl. Sci. 2019, 9, 1047. [Google Scholar] [CrossRef]
- Moayeri, M.S. Fluid Mechanics. In Fluid Mechanics; Shiraz University: Shiraz, Iran, 1987. [Google Scholar]
- Pambour, K.A.; Erdener, B.C.; Bolado-Lavin, R.; Dijkema, G.P. An integrated simulation tool for analyzing the operation and interdependency of natural gas and electric power systems. In PSIG Annual Meeting; Pipeline Simulation Interest Group: Houston, TX, USA, 2016. [Google Scholar]
- Herrán-González, A.; De La Cruz, J.M.; De Andrés-Toro, B.; Risco-Martín, J.L. Modeling and simulation of a gas distribution pipeline network. Appl. Math. Model. 2009, 33, 1584–1600. [Google Scholar] [CrossRef]
- Heidaryan, E.; Salarabadi, A.; Moghadasi, J. A novel correlation approach for prediction of natural gas compressibility factor. J. Nat. Gas Chem. 2010, 19, 189–192. [Google Scholar] [CrossRef]
- ElectroRoute Articles. 2019. Available online: https://www.electroroute.com/storm-atiyah-8th-december-2019 (accessed on 8 December 2019).
- UK National Grid: How We Regulate Gas Quality in the National Transmission System (NTS) as a Safety Measure, Including Details on Gas Contents and Components. NTS Homepage. Available online: https://www.nationalgridgas.com/data-and-operations/quality (accessed on 1 July 2019).
- Ekhtiari, A.; Syron, E. Ireland’s Future Natural Gas Supply: How Well Connected Is the Island. Irelands Eng. J. 2018. Available online: https://www.engineersireland.ie/Engineers-Journal/More/Energy/irelands-future-natural-gas-supply-how-well-connected\-is-the-island (accessed on 28 March 2018).
- Population of Ireland (2020). Available online: https://www.worldometers.info/demographics/ireland-demographics/ (accessed on 5 May 2020).
- Gunawan, T.A.; Singlitico, A.; Blount, P.; Burchill, J.; Carton, J.G.; Monaghan, R.F. At What Cost Can Renewable Hydrogen Offset Fossil Fuel Use in Ireland’s Gas Network. Energies 2020, 13, 1798. [Google Scholar] [CrossRef]
- Ipsakis, D.; Voutetakis, S.; Seferlis, P.; Stergiopoulos, F.; Elmasides, C. Power management strategies for a stand-alone power system using renewable energy sources and hydrogen storage. Int. J. Hydrog. Energy 2009, 34, 7081–7095. [Google Scholar] [CrossRef]
- Gahleitner, G. Hydrogen from renewable electricity: An international review of power-to-gas pilot plants for stationary applications. Int. J. Hydrog. Energy 2013, 5, 2039–2061. [Google Scholar] [CrossRef]


| Composition | Fraction v/v, % | N-Density, kg/m | HHV, MJ/kg |
|---|---|---|---|
| C | 93.94 | 0.67 | 55.50 |
| C | 4.2 | 1.038 | 51.90 |
| C | 0.3 | 1.522 | 50.40 |
| i-C | 0.03 | 2.50 | 49.10 |
| n-C | 0.03 | 2.50 | 49.10 |
| N | 1 | 0.966 | - |
| CO | 0.5 | 1.977 | - |
| Location on the Map | Max. H2% | Min. H2% | Average H2% | Duration, hr 10% < H2% | Duration, hr 5% < H2% < 10% | Duration, hr H2% < 5% |
|---|---|---|---|---|---|---|
| West | 11 | 2 | 7.8 | 3 | 20 | 1 |
| South | 15.8 | 3.5 | 10.8 | 14 | 9 | 1 |
| North | 6 | 3 | 4.3 | 0 | 8 | 16 |
| East | 3.5 | 0.3 | 1.8 | 0 | 0 | 24 |
| Node | Max Energy Demand | Multiple Injection Points | Single Injection Point | ||
|---|---|---|---|---|---|
| Node 4 and Node 5 and Node 20 | Node 4 or Node 5 or Node 10 | ||||
| MW | Max. H% | Min. H% | Max. H% | B% | |
| 4 | 2959 | 11 | 5.3 | 16.7 | 11.4 |
| 5 | 2018 | 15.8 | 3.5 | 23.6 | 16.4 |
| 10 | 3511 | 0.7 | 0.1 | 14.3 | 9.6 |
Publisher’s Note: MDPI stays neutral with regard to jurisdictional claims in published maps and institutional affiliations. |
© 2020 by the authors. Licensee MDPI, Basel, Switzerland. This article is an open access article distributed under the terms and conditions of the Creative Commons Attribution (CC BY) license (http://creativecommons.org/licenses/by/4.0/).
Share and Cite
Ekhtiari, A.; Flynn, D.; Syron, E. Investigation of the Multi-Point Injection of Green Hydrogen from Curtailed Renewable Power into a Gas Network. Energies 2020, 13, 6047. https://doi.org/10.3390/en13226047
Ekhtiari A, Flynn D, Syron E. Investigation of the Multi-Point Injection of Green Hydrogen from Curtailed Renewable Power into a Gas Network. Energies. 2020; 13(22):6047. https://doi.org/10.3390/en13226047
Chicago/Turabian StyleEkhtiari, Ali, Damian Flynn, and Eoin Syron. 2020. "Investigation of the Multi-Point Injection of Green Hydrogen from Curtailed Renewable Power into a Gas Network" Energies 13, no. 22: 6047. https://doi.org/10.3390/en13226047
APA StyleEkhtiari, A., Flynn, D., & Syron, E. (2020). Investigation of the Multi-Point Injection of Green Hydrogen from Curtailed Renewable Power into a Gas Network. Energies, 13(22), 6047. https://doi.org/10.3390/en13226047