Article

Integrated Leaching and Thermochemical Technologies for Producing High-Value Products from Rice Husk: Leaching of Rice Husk with the Aqueous Phases of Bioliquids

1
Joint International Research Laboratory of Biomass Energy and Materials, College of Materials Science and Engineering, Nanjing Forestry University, Nanjing 210037, China
2
Faculty of Engineering, Universitas Negeri Semarang (UNNES), Jawa Tengah 50229, Indonesia
3
Scion, Te Papa Tipu Innovation Park, 49 Sala Street, Private Bag 3020, Rotorua 3046, New Zealand
*
Authors to whom correspondence should be addressed.
Energies 2020, 13(22), 6033; https://doi.org/10.3390/en13226033
Submission received: 2 November 2020 / Revised: 16 November 2020 / Accepted: 17 November 2020 / Published: 18 November 2020
(This article belongs to the Section A4: Bio-Energy)

Abstract

:
It remains challenging to develop a techno-economically feasible method to remove alkali and alkaline earth metal species (AAEMs) from rice husk (RH), which is a widely available bioresource across the world. In this study, the AAEMs leaching effect of aqueous phases of both bio-crude prepared by hydrothermal liquefaction (AP-HT) and bio-oil prepared by pyrolysis (AP-Pyro) of RH were systematically investigated. The results indicated that although the acidity of AP-HT and AP-Pyro are much lower than that of HCl, they performed a comparable removal efficiency on AAEMs (Na: 56.2%, K: 96.7%, Mg: 91.0%, Ca: 46.1% for AP-HT, while Na: 58.9%, K: 96.9%, Mg: 94.0%, Ca: 86.3% for AP-Pyro) with HCl. The presence of phenolics in bio-oil could facilitate the penetration of water and organic acids into the inner area of RH cells, thus enhancing the AAEMs removal via chelate reactions. The thermal stability of leached RH during thermochemical conversions was studied via TG and Py-GC-MS. The results showed that the heat conduction efficiency in leached RH was enhanced with a high pyrolysis rate, resulting in a narrow carbon chain distribution (C5–C10) of derived chemical compounds.

Graphical Abstract

1. Introduction

The limited reserves of fossil fuel resources and their high environmental impacts leads to a crucial demand for the development of the new energy sources [1,2]. Solar, wind, and biomass are considered as the main renewable energy sources, among which biomass is relatively affordable and abundantly available with simple converting processes [3]. Gasification, pyrolysis and hydrothermal liquefaction are the main thermal processes to obtain renewable biofuels, carbon materials, and biochemicals from various biomass resources [4,5,6,7]. To produce liquid biofuels, either fast pyrolysis or hydrothermal liquefaction is required to liquefy biomass. Briefly, pyrolysis produces bio-oil at 450–550 °C by thermal decomposition of biomass [8], while hydrothermal liquefaction considers converting biomass into bio-crude at 250–374 °C under high pressure (4–22 MPa) [9]. These techniques are capable to achieve liquefaction of feedstocks with a yield of bio-oil/bio-crude at ~60%, whereas the quality of these bioliquids are poor with high acidity, high moisture content and low calorific values. To fully use the raw bioliquid more efficiently, fractionation (e.g., distillation, extraction) has been recommended to separate raw products into different fractions (e.g., aqueous phase, hydrophobic light bio-oil, and heavy bio-oil) before further refining [10,11]. Both the light and heavy fractions can then be upgraded into drop-in fuels via hydrotreatment. In contrast, the aqueous phase (rich in water, organic acids, and various volatile compounds) is unsuitable to be used as a fuel, and its application needs to be further investigated.
Rice husk (RH) is widely distributed and has potential to be used for bio-oil production [12,13,14,15,16]. According to the statistics in the United States Department of Agriculture, the global rice production has increased to 657.9 million tons in 2019, which indicates the production of a large amount of RH as a byproduct [17]. Hence, there is an increasing interest in utilizing RH as a feedstock for the production of renewable biofuels or other value-added products [18]. However, one of the main challenges of using RH is its high ash content (11.4–23.5 wt%) [19], which has inhibited the production of bioliquids from RH. The ash content of RH is composed of various elements such as finely dispersed alkali and alkaline earth metal species (AAEMs), which are bound to hydroxyl and/or phenolic groups in the form of cations or exist as cations of inorganic salts [19]. These ash contents need to be removed prior to the thermochemical liquefaction of biomass to avoid the inactivation of catalysts, the corrosion of reactors, and the interference of bioliquids upgrading. For instance, during the pyrolysis of biomass, the ash content can cause fouling issues (such as corrosion, erosion, and blocking, etc.) both inside the reactor and the downstream pipes [20]. Many ash contents exist in the form of chloride salts, the pyrolysis of which produces chloride acids that is both poisonous and corrosive. The presence of inorganic species can also interfere the further refinery of produced bio-oil/bio-crude [21,22]. Due to the side effects of the high ash content of RH, it is essential to conduct pretreatment to remove these components.
Water leaching is a simple pretreatment that can be easily conducted for the removal of ash content in biomass. The removal efficiency of leaching for AAEMs generally follows an order based on the acidity of water: strong acid/water > weak acid/water > water [23,24,25]. Thus, the use of acids is required to achieve a maximal ash removal. However, the side effects of using acids, especially strong inorganic acids (e.g., HCl), are also obvious when considering the economic feasibility and the environmental impacts, particularly in an industrial scale. The aqueous fraction of bio-oil has been recently recognized as an effective leaching agent for biomass pretreatment that can improve the pyrolysis performance of pretreated biomass for the production of bio-oil [26]. The study conducted leaching of biomass with the aqueous phase of fast pyrolysis bio-oils and investigated the pyrolysis behavior of treated biomass using TGA/DTG analysis and Py-GC-MS. However, details of the leaching performances and mechanisms need to be further investigated. Moreover, considering that hydrothermal liquefaction has also been widely used for biomass liquefaction, the aqueous phase of bio-crude is also potential to be used for biomass leaching, whereas its performance on the ash content removal has not been studied. As conceptualized in Figure 1, successful integration of leaching and thermochemical liquefaction (i.e., pyrolysis or hydrothermal liquefaction) is believed to not only achieve a well removal of ash content in the feedstock, but also produce a bio-oil or bio-crude with higher qualities (i.e., lower moisture content, lower acidity, and higher calorific values) by fractionating aqueous phases. In general, it is worthwhile to investigate the leaching performances of aqueous phases of both bio-crude and bio-oil in detail prior to integrating leaching by aqueous phases and liquefaction techniques for bioliquid production.
Therefore, this study is conducted as a key step to investigate the feasibilities and fundamentals of utilizing the aqueous phases of bio-oil and bio-crude for RH leaching pretreatment. Firstly, the leaching effect of the aqueous phases of bio-oil and bio-crude benchmarking against HCl were investigated. Subsequently, the effects of different leaching solutions on the pyrolytic decomposition of pretreated RH were studied via TG analysis and Py-GC/MS analysis.

2. Materials and Methods

2.1. Materials

RH samples as received were milled and sieved to obtain sample particle sizes of 300–450 μm. Table 1 shows the proximate and ultimate analysis of the RH samples. RH samples were leached by three types of acidity leaching agent to compare their removal efficiency of AAEMs and explore the mechanism of demineralization. The preparation method of different leaching agents and leaching methods are described below.

2.2. Preparation of Leaching Reagents and the Leaching Process

Preparation of aqueous phase of bio-crude by hydrothermal liquefaction: Hydrothermal liquefaction on RH samples was carried out in a 100 mL stirred autoclave as is shown in Figure 2a. In each run, 3 g of RH samples and 50 mL deionized water were firstly loaded into the reactor. The residual air in the reactor was then removed by flowing N2 for 30 min [27]. In the next step, the reactor was pressurized up to 1 MPa with N2, and then heated to 250 °C in 40 min with the stirring speed being 175 rpm. The reactor was then immersed into a water/ice bath for quick cooling. When the reactor was cooled down to room temperature, the gas inside the reactor was released into a fume hood. The remained slurry inside the reactor was separated into the liquid and solid phases by using a filtration system where a filter paper (0.45 μm, PTFE) was placed in the Buchner funnel connected to the conical flask. The filtering speed of slurry was accelerated by a suction device. The solid on the Buchner funnel was rinsed with 200 mL acetone (>99.5 wt%) until the falling filtrate became colorless. The solid residue was then collected and dried in an oven at 105 °C for 12 h to obtain a constant weight to determine the RH conversion rate [28,29]. The filtrated liquid was precipitated at −5 °C to further separate the possible remained solid particles and were filtered again with a micro filter (0.25 μm). Then the finally filtered liquid was weighed, which is the obtained aqueous phase of bio-crude by hydrothermal treatment, hereafter referred to as AP-HT. It was stored in a refrigerator at −5 °C before use.
Preparation of aqueous phase of bio-oil by pyrolysis: It should be noted that the RH samples were dried in an oven at 105 °C for 24 h before pyrolysis, and the water content after drying was 0.64%. The slow pyrolysis of RH samples was carried out in a tubular furnace system as is shown in Figure 2b. During the experiment, N2 with a flow rate of 200 mL/min was supplied through the reactor. In each trial, 30 g RH samples were pre-loaded into the reactor, followed by heating up from 25 to 110 °C with a ramping rate of 10 °C/min (holding for 30 min at 110 °C), then further heating up to 500 °C with a same ramping rate (holding for 60 min). The collected liquid by an ice bath was filtered with a micro filter (0.25 μm), which is the aqueous phase of bio-oil by pyrolysis, hereafter referred to as AP-Pyro. It was also stored in a refrigerator at −5 °C before usage.
Leaching process: It should be noted that except AP-HT and AP-Pyro, a typical strong hydrochloric acid solution (1 mol/L, pH = 0) was also prepared as leaching agent for comparison. RH samples were immersed in the leaching agent, and the mixture was stirred continuously for 4 h at 50 °C in a water bath [30]. After the leaching process, the slurry was separated into the liquid and solid using the same filtration system described above. Then the solid was rinsed with deionized water continuously until the pH of the effluent solution was higher than 6.5. It was then dried at 85 °C for 12 h in the oven. The obtained leached RH samples were referred to as RH-HT, RH-Pyro, and RH-HCl, respectively.

2.3. Analytical Methods

Chemical compounds in AP-HT and AP-Pyro. The AP-HT and AP-Pyro samples were analyzed by gas chromatography/mass spectrometry (GC/MS, Agilent7890A, USA) with a HP-5MS column (30 m × 0.25 mm, 0.25 μm film thickness) after diluted in trichloromethane (> 99.8%) with a dilution ratio of 1:1. The mass spectra operated in electron ionization mode at 70 eV and it was obtained in the range of m/z = 50–300 amu. Helium (99.999%) was used as the carrier gas. The oven temperature was kept at 100 °C for 2 min, then raised to 250 °C with a ramping rate of 15 °C/min. It was finally kept at 250 °C for 15 min. The injector temperature was 250 °C with a split ratio of 30:1. Identification of each compound was performed based on retention time and matched with the mass spectrum in the spectral library (NIST11 library).
pH values. The pH values of all leaching agents were measured with a pH electrode (pHS-25, REX, Shanghai, China). Before each test, the instrument was always calibrated with the standard buffer solution. The pH electrode was also rinsed with distilled water as well as the tested solution before being immersed into the tested solution for measurement. The pH values were recorded when the reading stabilizes under the constant stirring by a glass rod.
Water content. The water content of AP-HT and AP-Pyro samples were investigated with a Karl Fisher titrator (KF-200, Mitsubishi, Japan). Before measurement, a calibration was done by titrating six times of pure water in triplicate. For every single test, about 7 mg of the sample was dropped into the titration vessel. Once the liquid was completely dissolved, the titration was started. The weight of water was recorded when potential balance was reached, and the water content was calculated.
AAEMs contents. An ash-digestion-ICP-AES method was adopted to measure the AAEMs content of raw and leached RH samples. Briefly, a known amount of the sample was subjected to an ashing process following a previous method [31]. The obtained ash was weighed and digested in a mixture solution of HF and HNO3 (1 mol:1 mol, 10 mL:10 mL) and then solidified by evaporation for 24 h in the fume hood. The solid was then digested by HCl (2 wt%, 20 mL) in a water bath at 90 °C before being dissolved in deionized water (40 mL). The liquid was injected into ion chromatography by inductively coupled plasma-atomic emission spectrophotometry (ICP-AES, ZX_2018 Avio200, Perkin Elmer, USA). The removal rate of metallic species is defined by the following equation:
Removal   efficiency   % = 1 M 2 M 1 × 100
where M1 and M2 present the amount of metallic species in RH before and after leaching (mg/kg of corresponding samples), respectively. The standard deviation for the removal rate was below 2% for each metallic species.
Surface functional groups. Functional groups in RH and leached RH were characterized by a Fourier transform infrared analyzer (FTIR, VERTES 80V, Brooke, Germany). The sample was evenly ground into fine particles in an agate mortar and mixed with the KBr powder uniformly, from which a disc sample can be prepared in an infrared tablet presser by holding for 10 s under a pressure of 10 MPa.
Pyrolysis behavior of various samples. Thermogravimetric analysis was carried out by STA409PC, Netzsch, Germany. N2 with high purity (99.99%) with a flow rate of 100 mL/min was applied as the gas environment in the oven. The temperature was scanned from room temperature up to 900 °C with a heating rate of 10 °C/min.
Pyrolytic product distribution. The examination on the liquid products from the thermal conversion of the four samples were conducted in a pyroprobe (Py, CDS Analytical 5200, USA) coupled with GC/MS (Agilent 7890A/5975C, USA) via a transferring line at 285 °C. Briefly, 500 ± 20 μg of sample was loaded into the center of a quartz tube (i.d. = 2 mm, length = 20 mm). The sample was then pyrolyzed in Py at 550 °C for 30 s, and the produced volatiles were rapidly transferred into GC/MS for the analysis. The split ratio of GC/MS was 100:1, and a commercial capillary column (Agilent VF-1701MS, USA, 30 m × 0.25 mm i.d., 0.25 µm film thickness) was employed for the separation of the components. The temperature in the column increased from 40 °C (stabilized for 2 min) to 280 °C (stabilized for 3 min) with a heating rate of 10 °C/min. The MS was operating in an electron impact mode at an ionization energy of 70 eV with a scan range of m/z 25 to 500. The interpretation of the mass spectra was mainly based on library search (NIST11, version 2.0) or other references.

3. Results

3.1. Acidity of AP-HT Benchmarking against that of AP-Pyro and Their Compositions

Acidity of leaching reagents is an important parameter in determining its ability to eliminate AAEMs. The pH values of AP-HT, AP-Pyro, and HCl were measured as 3.2, 2.7, and 0, respectively. The pH value of AP-HT is higher than AP-Pyro due to the lower content of total organic acid compounds (peak areas of 4.22 × 10⁸ vs. 2.54 × 10⁸) and higher water content (Table 2). In addition, the high abundance of organic compounds in the solution, such as phenols, could hinder the ionization of acetic acid and consequently increased the pH value of the solution [32].
GC-MS detectable chemical compounds in AP-HT and AP-Pyro are shown in Table 3. The data shows that the dominant organic acid compounds in AP-HT are n-hexadecanoic acid (2.392%) and octadecanoic acid (2.476%), whereas the amount of acetic acid (20.939%) is the highest in AP-Pyro. Moreover, the relatively high content of ketones is observed in AP-Pyro (24.107% compared to 11.710% in AP-HT). For instance, the relative amount of 2-Propanone, 1-hydroxy- is 10.199%, while its abundance in AP-HT is only 1.825%. In addition, phenolics with different contents are observed in both AP-HT and AP-Pyro. For instance, the phenol contents are 0.420 and 1.189% in AP-HT and AP-Pyro, respectively. Compared with the total amount of phenolics in AP-Pyro, it is higher in AP-HT, (13.106% vs. 10.982%). It should be noted that the content of the sugars inside AP-HT (18.983%) is considerably high compared to that in AP-Pyro (9.632%). This is due to the existence of β-D-Glucopyranose, 1,6-anhydro- in AP-HT (17.818% vs. 6.329% in AP-Pyro). Lastly, a slightly higher amount of furanics is recorded in AP-Pyro (8.700 % compared to 7.034% in AP-HT).

3.2. Leaching Effect of AP-HT and AP-Pyro Benchmarking against that of HCl on AAEMs Removal from RH

The AAEMs content in RH before and after leaching by the different leaching agents as well as the AAEMs removal efficiency are shown in Figure 3. It can be seen that after leaching by the three types of leaching agents, the AAEMs contents are dramatically decreased, especially for K and Mg. This suggests both AP-HT and AP-Pyro are quite efficient to remove the AAEMs from RH. The removal efficiency of AP-HT is slightly lower than that of AP-Pyro, while that of HCl is the best. This is mainly attributed to their acidity difference. However, AP-HT exhibits almost equally high efficiency on removing K and Mg (90–95%), despite its lowest acidity. It should be noted that the high content of K in RH could be related to the excess use of K-containing fertilizer in the agricultural sector. Vacuoles in plant cells are the key hosts to accommodate K species [33]. Additionally, Mg2+ is an important component of polyribosomes that can promote the synthesis of vitamins in the cell structure of lignocellulose [34]. Therefore, the majorities of K and Mg may be leached easily through the breakage of cell wall and then dissolved in the acidic aqueous phase. Besides the ion-exchanges between metal ions and H+, previous studies have shown that the phenolics could penetrate into the organic matrix of the RH material, forming hydrophobic interactions as well as hydrogen bonds with macromolecules. This makes the matrix more accessible to acetic acid and water, promoting the leaching of organically bound AAEMs [32]. Meanwhile, the synergistic effect could take place between the acetic acid and typical organic components like furfural, guaiacol, phenol, hydroxyacetone and ethylene glycol in AP-HT and AP-Pyro, which could also increase the removal rate of metallic species [30].
On the other hand, the removal efficiencies of Na and Ca are relatively lower than those of K and Mg. It is vital to note that the initial content of Na in RH is very low, so the contents of Na in leached RH are much lower than those of other metals, although its removal efficiency is not high. The removal efficiency of Ca by AP-HT is only about 46%, which is the lowest compared to those of AP-Pyro and HCl. This may be due to the presence of some non-acid organic components (e.g., hydroxyacetone, guaiacol, and phenol) inside AP-HT, which hindered the removal of Ca [30]. The majority of Ca2+ in the plants is bound to pectin polysaccharides and normally exists in the form of CaCO3 or Ca silicates, which is insoluble in water or other weak/organic acidic solutions [35]. The strong acidity of HCl could effectively extract the pectin polysaccharides, and thus achieve the high removal efficiency of Ca [32,36]. What’s more, chelation bonding between cation and some organic compounds like sugar acid may also promote the leaching of Ca and Mg [37,38].
To evaluate the possible effects of various leaching agents on the RH matrix and surface property, the ratios of H/C and O/C have been calculated and presented in Table 4. As is shown, the atomic ratios of O/C in the RH decrease after being leached by the agents due to the partial extraction of hemicellulose. This is confirmed by the decrease of -OH functionality after the leaching process. In addition, the acid-promoted dehydration of cellulose also increases the C content. Interestingly, H/C ratio remained almost unchanged, indicating that the aromatic matrix of RH has been least affected.
The changes in O-containing functional groups was recorded by FTIR, as is shown in Figure 4. It can be seen that all the spectra have similar patterns, suggesting the “core” of the sample structure is not apparently altered after the acid leaching. Generally, the main bands show declining trends after the acid leaching process, which is in a good agreement with the decreases of O/C ratios for the processed samples. In Figure 4, the band at 3430 cm−1 is ascribed to OH functionality from alcohols. This shows the disruption of hydrogen bonds in the chemical compositions of the samples [39]. The peak centered at 1730 cm−1 is corresponding to the C=O stretching vibration and is mainly formed from free carbonyl groups, which are abundantly available in hemicellulose and cellulose structure. The next band appeared at 1650–1510 cm−1 and is ascribed to C=C stretching vibrations of aromatic structures, which is produced from lignin [40]. Compared with raw RH, the intensity of the band around 1730 cm−1 and 1650–1510 cm−1 slightly decline after the acid leaching. This indicates the breaking down of hemicellulose acetyl and uronic ester groups [41]. The band located at 1100 cm−1 is related to C-O/Si-O-Si functional groups, which has almost similar intensities for all the analyzed samples.

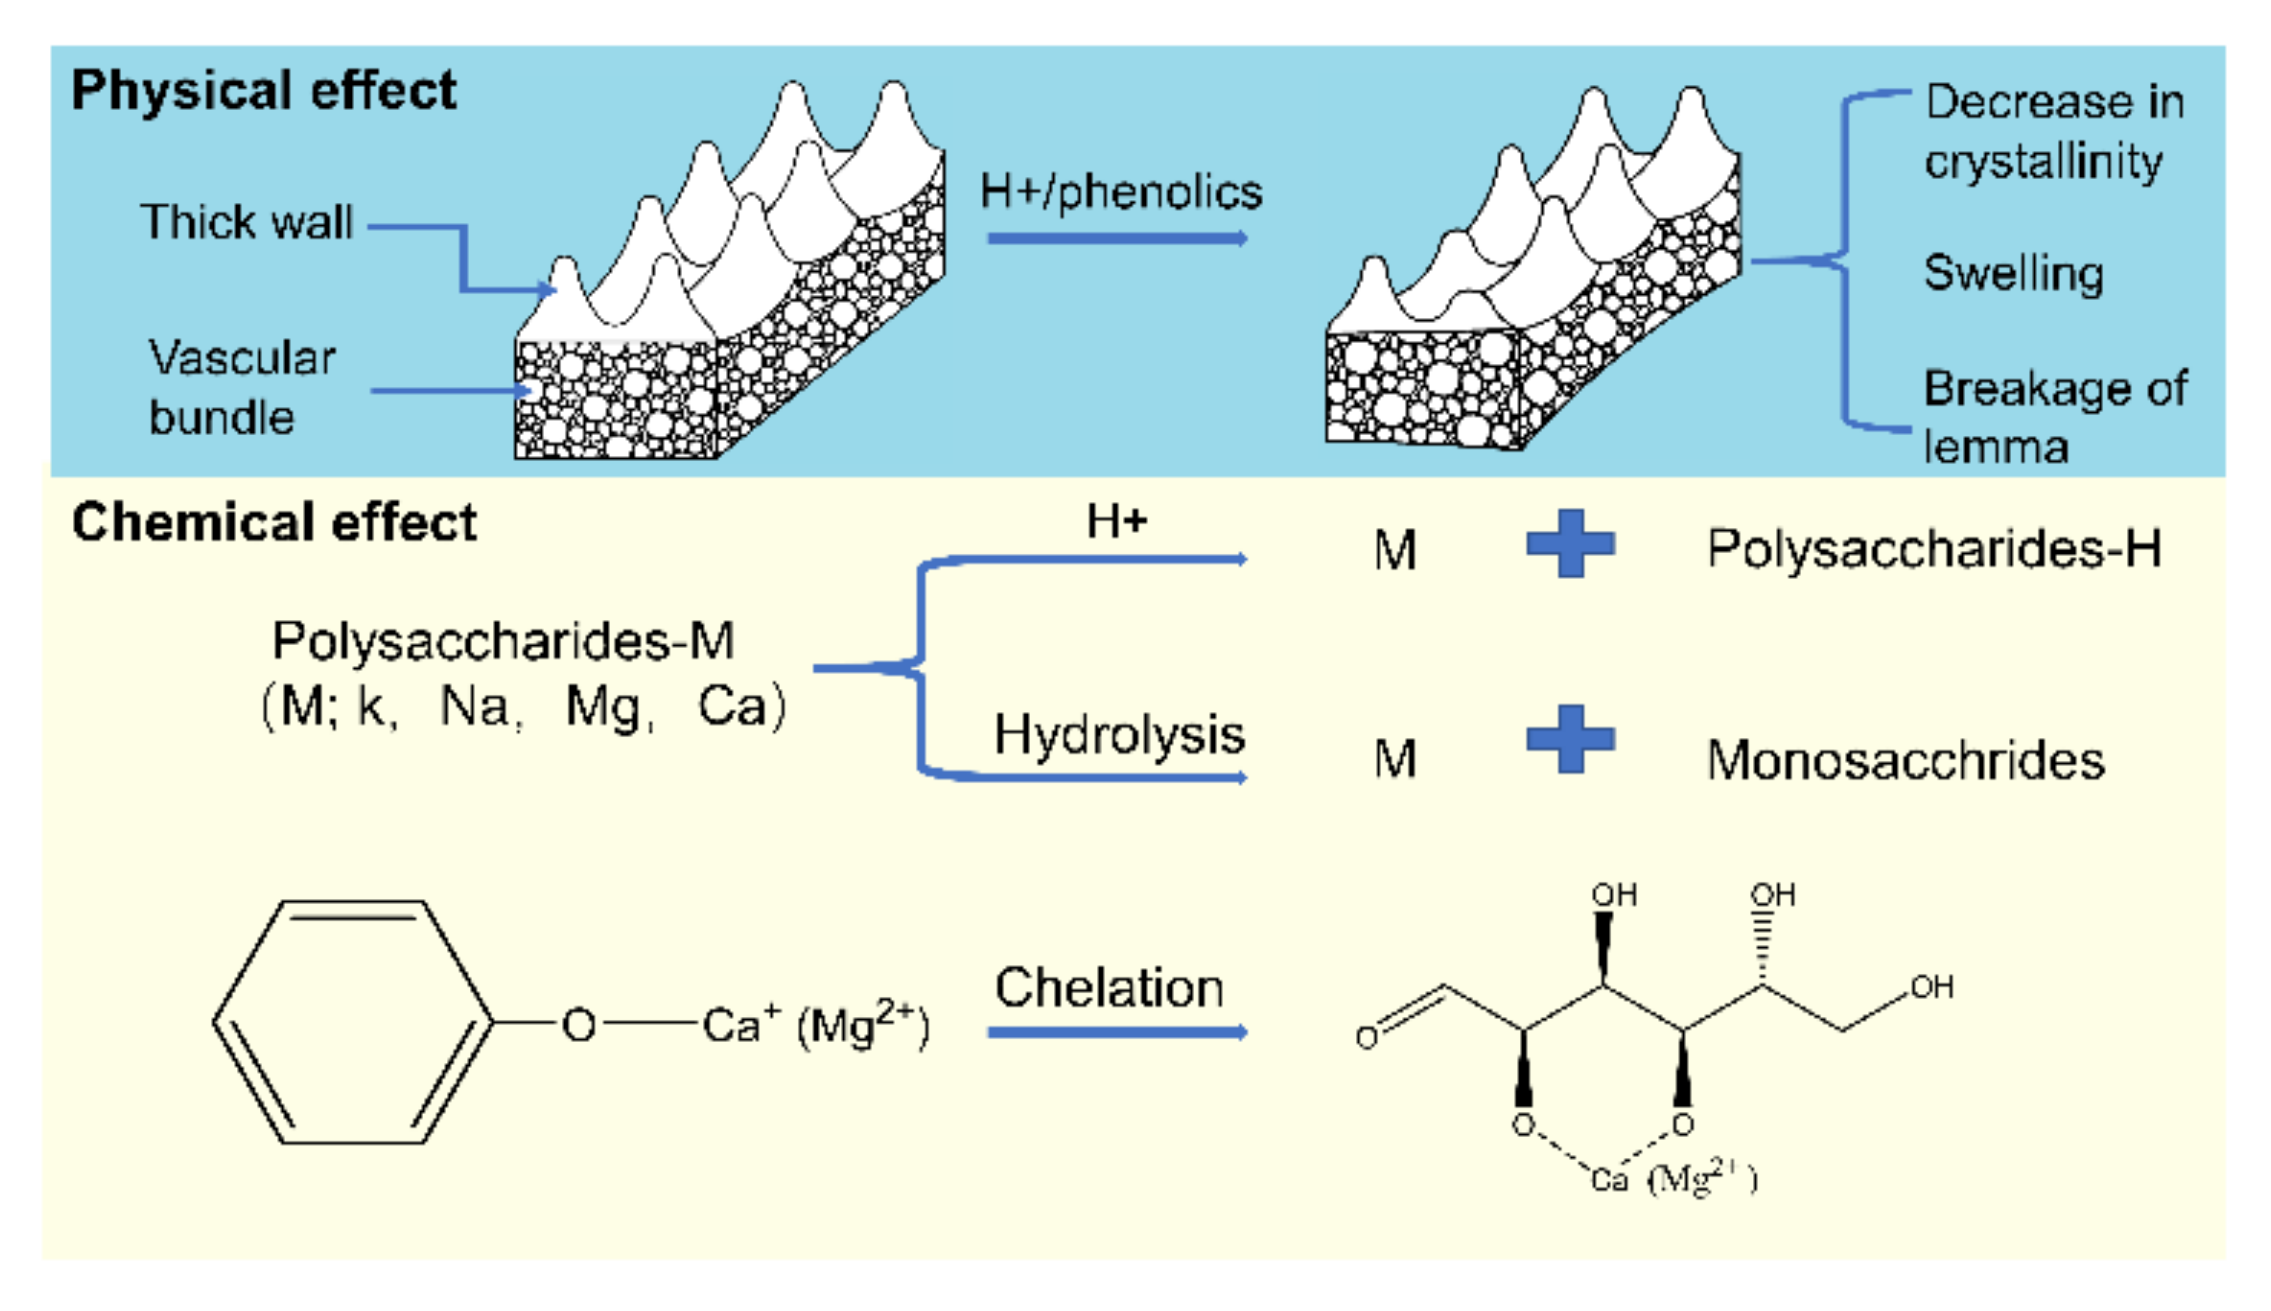
3.3. Reaction Pathway of the AAEMs Removal from RH by the Leaching Agents

The reaction pathways of AAEMs removal by various acidic leaching agents are proposed and shown in Figure 5. The main components of RH are the lemma and palea. Histochemical staining shows that outer epidermis cells walls have high thickness, lignification, and severe silicification, while the walls of lower epidermis cells were not lignified [42]. Therefore, the special cell wall structure of RH is a key factor affecting the removal efficiency of AAEMs. It is well known that RH is a good adsorbent for the removal of heavy metals, phenols, pesticides, and dyes [43]. In the pickling process, RH can also adsorb a certain amount of organic matters from the leaching agent. The adsorbed organic species can disturb the original hydrogen bonds and leads to the swelling phenomena in cells [32,44,45]. Therefore, the process of acid leaching in this study involves both physical and chemical effects on the removal efficiency of AAEMs.
The high acidity of the leaching agent could result in the sever changes in the physical properties of biomass materials [25]. The H+ can promote the leaching of hemicellulose and the hydrolysis of cellulose, which reduces the crystallinity as well as loosens the cell wall structure of RH and breaks down the lemma. Consequently, the AAEMs can be released from the cell structure in RH.
For HCl solution, the removal of AAEMs mainly depends on the action of H+ ions. The high concentration of H+ can destroy the cell wall of RH and replace the cations in the polysaccharides-M (M; K+, Na+, Ca2+ or Mg2+). This also promotes the decomposition of polysaccharides to monosaccharides with disassociated AAEMs. At low pH values, the functional groups on the surface of the adsorbent are prone to protonation, which limits the adsorption of positive ions like AAEMs on the surface of RH [26]. In the case of high pH values, the organic compounds in the solution have important effects on the removal efficiency of AAEMs via the chelation reactions. The weak organic acids with oxygen functionalities present in AP-Pyro can also remove AAEMs from the macro organic complex inside the cells by ion exchanging process [30].

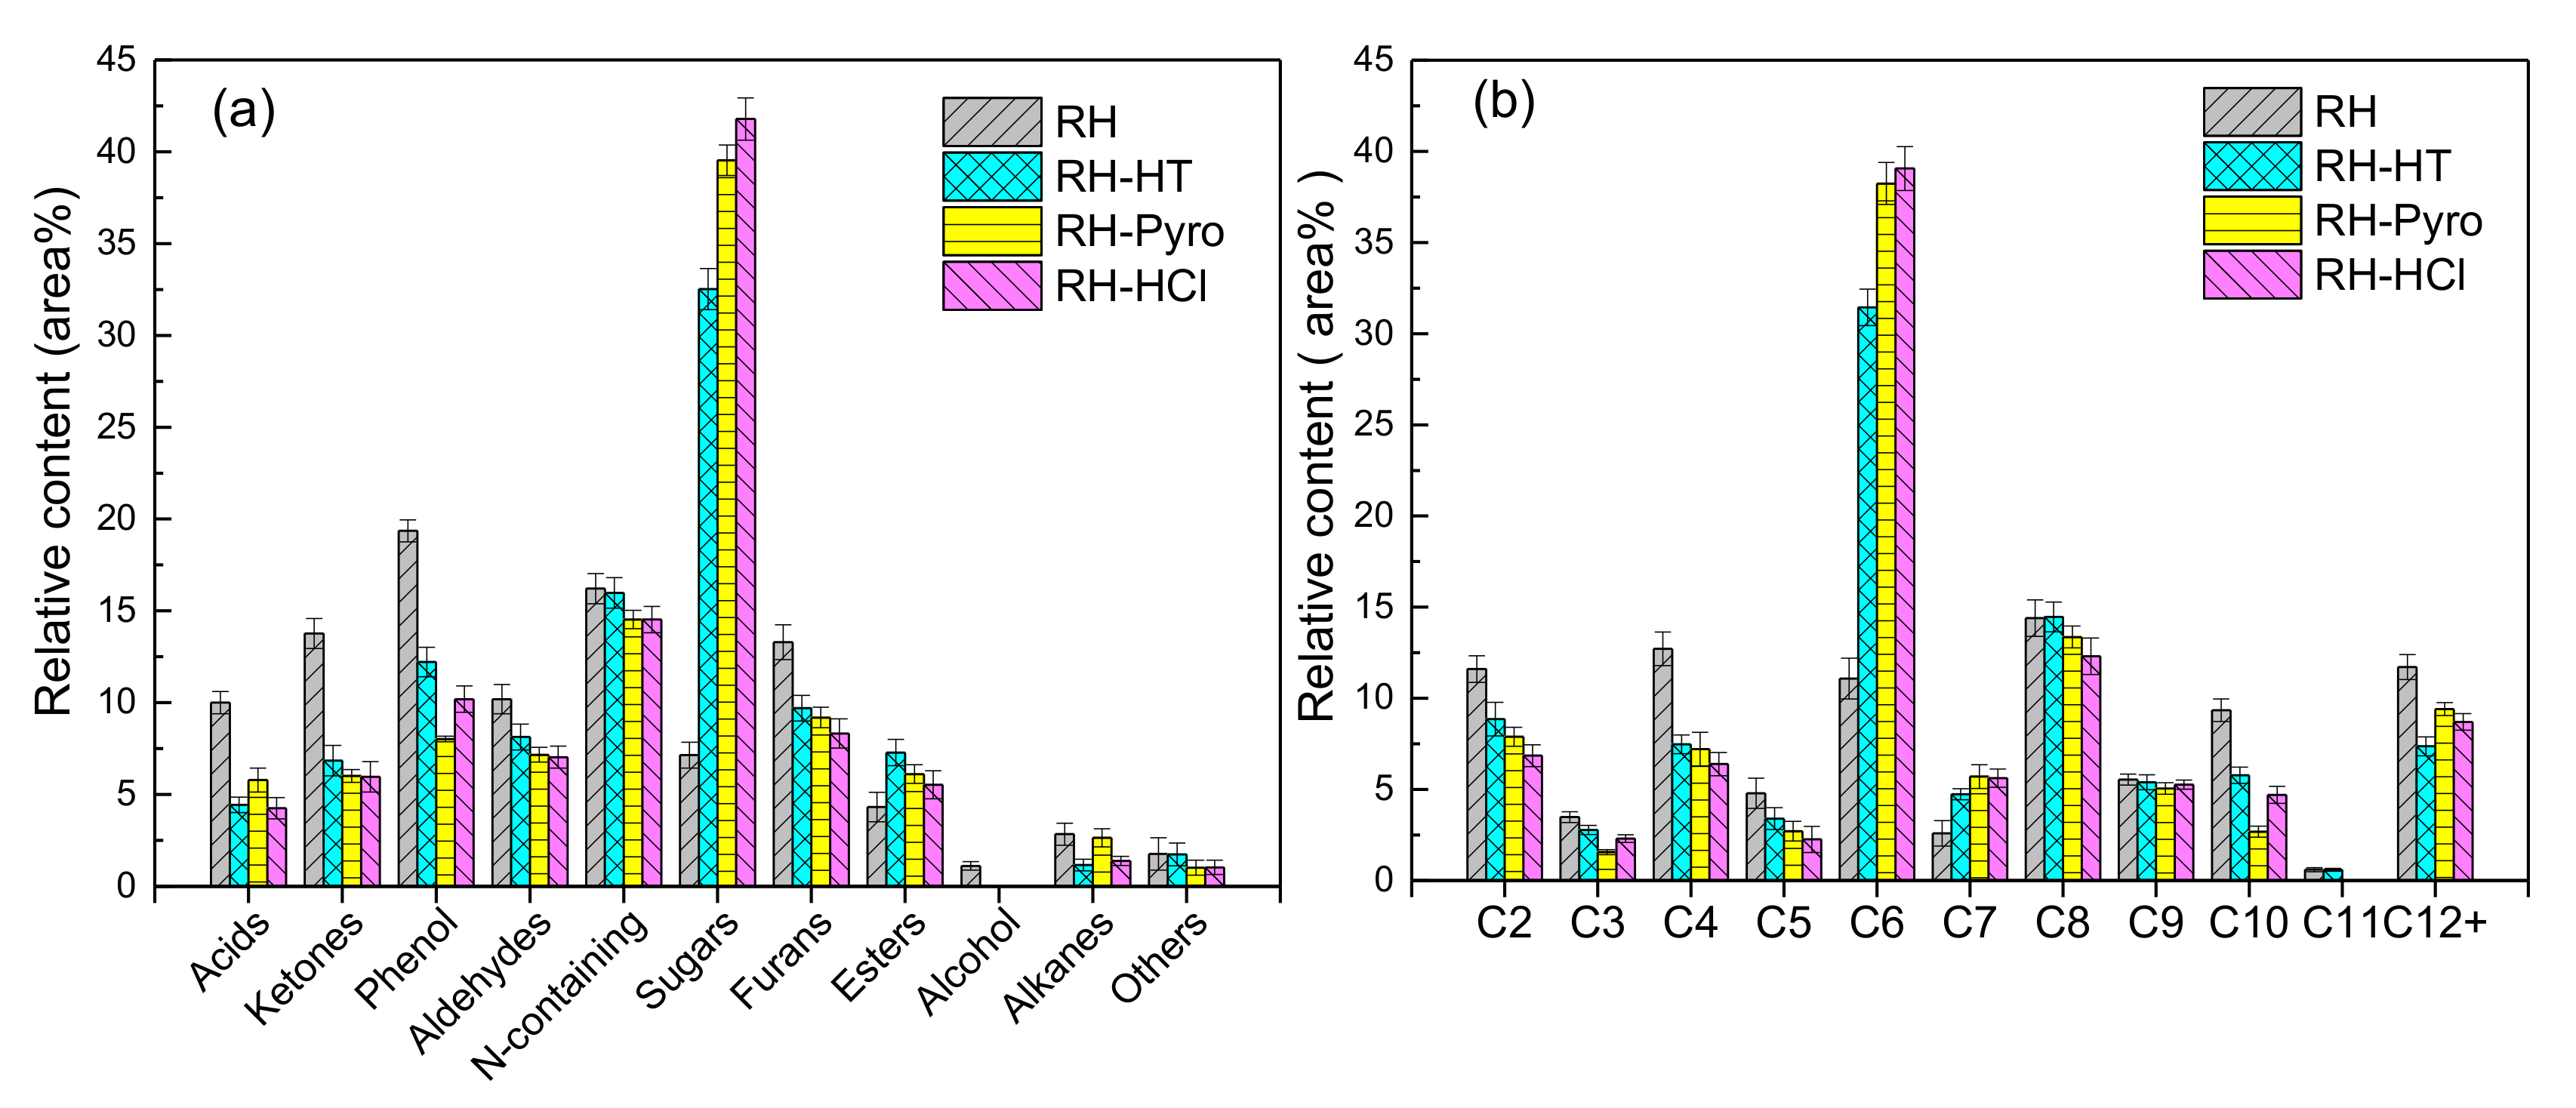
3.4. Effects of AP Leaching on the Pyrolysis Characteristics and the Liquid Products

Thermal Gravimetric (TG) and derivative thermogravimetric (DTG) curves of raw and leached RH samples are presented in Figure 6, while the corresponding characteristic parameters for each curve are calculated and shown in Table 5. The pyrolysis characteristic parameters are defined as follows: the mass loss at the pyrolysis temperature of 900 °C was denoted as ml; the maximum mass loss rate was called DTGmax; the temperature of corresponding maximum loss rate was named Tmax; the initial decomposition temperature was denoted as Ti.
Clearly, the treatments by the leaching agents impact the pyrolysis behavior of the RH sample. The ml of RH, RH-HT, RH-Pyro, and RH-HCl are 61.8%, 67.2%, 64.9%, and 66.1%, respectively. Additionally, the thermal stability of the samples improves after removing the AAEMs species, which is conducive to the rapid pyrolysis of raw materials to produce bio-oil with a high purity and high yield [46,47]. A rapid weight loss is observed for RH between 270–376 °C, whereas it is between 279.6–384 °C for the leached RH samples. The presence of the AAEMs could significantly reduce the initial temperature of rapid weight loss of cellulose [35]. After leaching treatment, the “acromion” peaks of DTG decline due to the reduction in hemicellulose which is partially extracted by the leaching process [48]. The DTGmax of RH-HT, RH-Pyro, and RH-HCl increase to 7.6%, 7.8%, and 9.1% from 6.1% of RH, respectively. AAEMs play important roles in the cross-linked structures among lignin, cellulose/hemicelluloses structures [49] as well as in affecting the primary and secondary reactions of large organic fragments during pyrolysis. The partial removal of hemicellulose, as indicated by the FTIR analysis and the TG curves, means that the cell wall of RH is partially destroyed, and thus the heat conduction efficiency in leached RH is enhanced with a high pyrolysis rate. In addition, the acid leaching also obviously changes the relative intensities of the decomposition ranges, implying the variation in product distributions, which is further discussed below.
The components in the bio-oil are divided into eleven groups including acids, ketones, phenols, aldehydes, furans, esters, N-containing compounds, sugars, alcohol, alkanes, and others. Their relative abundances are shown in Figure 7a. Compared to the relatively low content of sugar in the bio-oil produced from RH (7.14%), it is the dominant compound in all the other bio-oils produced from leached RH samples. For instance, the sugar contents in the bio-oil obtained from RH-HT, RH-Pyro, and RH-HCl are 32.52%, 39.54%, and 41.78%, respectively. In all the bio-oil samples, acids (4.24–10.0%), ketones (5.96–13.77%), phenols (8.02–19.36%), furans (8.32–13.3%), N-containing compounds (14.52–16.30%), esters (4.32–7.28%), and aldehydes (7.03–11.86%), alcohol and alkanes (both less than 4%) are present at various extents. In comparison to the bio-oil produced from RH, the bio-oil obtained from all the leached samples has the lower contents of acids, ketones, phenols, and furans. Moreover, levoglucosan is the predominant anhydrosugar product, which is mainly derived from the cellulose. The relative content of levoglucosan in the bio-oil from RH-HT, RH-Pyro, and RH-HCl are 9, 14, and 15 times higher in comparison with its content in the bio-oil from RH. This is due to the high removal rate of K, which has a distinguishable catalytic effect on the suppression of levoglucosan formation [50].
The distribution of the different groups of chemicals and the number of carbon atoms (C2-C12+) are shown in Figure 7b. It should be noted that C6 compounds are mainly related to levoglucosan and levoglucosenone, while C7–C10 compounds are ascribed to lignin derivatives. The C11+ compounds, which are from the incomplete cracking of lignin, only account for a small proportion in the bio-oils. The results indicate that the compounds in the range of C6 and C9 have the highest concentration in the volatiles (57–60%) obtained from the pyrolysis of the leached RH. This shows that acid leaching improves the quality of bio-oil. Correspondingly, both the relative contents of low molecular weight compounds (C3–C5) and high molecular weight compounds (C10–C12+) in the bio-oil decrease after acid leaching of RH. The removal of inorganic species from the biomass sample has weakened the catalytic secondary polymerization reactions [51].

3.5. Further Discussion

Overall, this research suggests that although AP-HT and AP-Pyro have low acidities, their performances on removing AAEM from RH are comparable to that of a HCl solution (1 mol/L). The high water contents (98.10% for AP-HT and 58.66% for AP-Pyro) show that the fractionations successfully reduced the water contents of nonaqueous phases, promising some bioliquids which are more suitable for the subsequent hydrotreatment [22,52]. In addition, the leached RH samples exhibited better thermal stability and their corresponding pyrolysis reactions are concentrated. As a part of the conceptualized framework (shown in Figure 1), these findings suggest that the integration of biomass liquefaction, fractionation of bioliquids, and the leaching of ash-rich feedstocks with aqueous phases is considerable as a circular biorefinery.
However, as a key step correlated to the whole conceptual biorefinery, more considerations and investigations are required to ensure the proceeding of this research. First, the current leaching results mainly showed the removal of AAEMs, whereas the removal of other acid-insoluble inorganic contents such as silicates are meant to be further understood [53]. Second, practical liquefaction (hydrothermal treatment or pyrolysis) experiments should be conducted to assess the actual effect of leaching on the distribution of products. It should be noted that, for an integration of leaching and pyrolysis, an additional drying process of leached biomass is required to match the requirement on feedstocks for pyrolysis. In contrast, hydrothermal treatment is a more suitable process for the liquefaction of feedstocks with high moisture contents, but requires a higher water supply [54]. Techno-economic assessments and energy balance assessments are required for both scenarios to guide the choice of proper treatment techniques and conditions. Third, although the major composition of the aqueous phase is water, it also includes various volatile compounds and biochemicals that can be further utilized [55,56]. In the proposed biorefinery in this study, this aqueous phase is meant to be rich in both organics (as shown in Table 3) and inorganics such as AAEMs. This complexity in compositions is likely causing more challenges to the valorization of leachates that need to be further addressed.

4. Conclusions

The performances of liquid phases obtained from the fractionation of both bio-oil and bio-crude for the leaching of ash contents in RH have been investigated. Both AP-HT and AP-Pyro showed a similar removal of AAEM species (especially for K and Mg) which is comparable to that of HCl solution, although their acidity is lower than that of HCl solution. Furthermore, the chelation reactions and ion exchanges are primary responsible pathways for AAEMs eliminations by the organics in the AP of bio-oils, which is favored by the physical swelling in cells induced from the phenolic compounds. With the removal of AAEMs, the thermal stability of RH is obviously improved, and the pyrolysis reactions are concentrated, which leads to the narrow distributions (C5–C10) of derived chemical compounds under pyrolytic conditions.

Author Contributions

Conceptualization, K.; formal analysis, W.G. and B.S.; funding acquisition, S.Z.; investigation, W.G. and H.L.; methodology, H.L., K. and S.Z.; project administration, S.Z.; resources, S.Z.; supervision, K. and S.Z.; validation, H.L., B.S. and S.Z.; writing—original draft, W.G.; writing—review and editing, B.S. and S.Z. All authors have read and agreed to the published version of the manuscript.

Funding

This work was financially supported by the National Natural Science Foundation of China (Grants 51876093); An internationally collaborative project (BRICS2019-040) under BRICS STI Framework Programme with government funding organizations of Brazil CNPq (402849/2019-1), Russia RFBR (19-58-80016), India DST (CRG/2018/004610, DST/TDT/TDP-011/2017), China MOST (2018YFE0183600), and South Africa NRF (BRIC190321424123).

Conflicts of Interest

The authors declare no conflict of interest.

References

  1. Dincer, I. Renewable energy and sustainable development: A crucial review. Renew. Sustain. Energy Rev. 2000, 4, 157–175. [Google Scholar] [CrossRef]
  2. Panwar, N.; Kaushik, S.; Kothari, S. Role of renewable energy sources in environmental protection: A review. Renew. Sustain. Energy Rev. 2011, 15, 1513–1524. [Google Scholar] [CrossRef]
  3. Song, B.; Lin, R.; Lam, C.H.; Wu, H.; Tsui, T.-H.; Yu, Y. Recent advances and challenges of inter-disciplinary biomass valorization by integrating hydrothermal and biological techniques. Renew. Sustain. Energy Rev. 2021, 135, 110370. [Google Scholar] [CrossRef]
  4. Hu, X.; Gholizadeh, M. Biomass pyrolysis: A review of the process development and challenges from initial researches up to the commercialisation stage. J. Energy Chem. 2019, 39, 109–143. [Google Scholar] [CrossRef] [Green Version]
  5. Xu, D.; Yang, L.; Ding, K.; Zhang, Y.; Gao, W.; Huang, Y.; Sun, H.; Hu, X.; Syed-Hassan, S.S.A.; Zhang, S.; et al. Mini-Review on Char Catalysts for Tar Reforming during Biomass Gasification: The Importance of Char Structure. Energy Fuels 2019, 34, 1219–1229. [Google Scholar] [CrossRef]
  6. Beims, R.F.; Hu, Y.; Shui, H.; Xu, C.C. Hydrothermal liquefaction of biomass to fuels and value-added chemicals: Products applications and challenges to develop large-scale operations. Biomass-Bioenergy 2020, 135, 105510. [Google Scholar] [CrossRef]
  7. Huang, Y.; Gao, Y.; Zhou, H.; Sun, H.; Zhou, J.; Zhang, S. Pyrolysis of palm kernel shell with internal recycling of heavy oil. Bioresour. Technol. 2019, 272, 77–82. [Google Scholar] [CrossRef]
  8. Zhang, Q.; Chang, J.; Wang, T.; Xu, Y. Review of biomass pyrolysis oil properties and upgrading research. Energy Convers. Manag. 2007, 48, 87–92. [Google Scholar] [CrossRef]
  9. Tekin, K.; Karagöz, S.; Bektaş, S. A review of hydrothermal biomass processing. Renew. Sustain. Energy Rev. 2014, 40, 673–687. [Google Scholar] [CrossRef]
  10. Seljak, T.; Buffi, M.; Valera-Medina, A.; Chong, C.; Chiaramonti, D.; Katrašnik, T. Bioliquids and their use in power generation—A technology review. Renew. Sustain. Energy Rev. 2020, 129, 20. [Google Scholar] [CrossRef]
  11. Nava, R.; Pawelec, B.; Castaño, P.; Álvarez-Galván, M.; Loricera, C.; Fierro, J.L.G. Upgrading of bio-liquids on different mesoporous silica-supported CoMo catalysts. Appl. Catal. B Environ. 2009, 92, 154–167. [Google Scholar] [CrossRef]
  12. Jia, C.; Chen, J.; Liang, J.; Song, S.; Liu, K.; Jiang, A.; Wang, Q. Pyrolysis characteristics and kinetic analysis of rice husk. J. Therm. Anal. Calorim. 2020, 139, 577–587. [Google Scholar] [CrossRef]
  13. Hu, Y.; Wang, S.; Li, J.; Wang, Q.; He, Z.; Feng, Y.; Abomohra, A.E.-F.; Afonaa-Mensah, S.; Hui, C. Co-pyrolysis and co-hydrothermal liquefaction of seaweeds and rice husk: Comparative study towards enhanced biofuel production. J. Anal. Appl. Pyrolysis 2018, 129, 162–170. [Google Scholar] [CrossRef]
  14. Khan, N.; Chowdhary, P.; Ahmad, A.; Giri, B.S.; Chaturvedi, P. Hydrothermal liquefaction of rice husk and cow dung in Mixed-Bed-Rotating Pyrolyzer and application of biochar for dye removal. Bioresour. Technol. 2020, 309, 123294. [Google Scholar] [CrossRef] [PubMed]
  15. Weldekidan, H.; Strezov, V.; Town, G.E.; Kan, T. Production and analysis of fuels and chemicals obtained from rice husk pyrolysis with concentrated solar radiation. Fuel 2018, 233, 396–403. [Google Scholar] [CrossRef]
  16. Deng, W.; Xu, K.; Xiong, Z.; Chaiwat, W.; Wang, X.; Su, S.; Hu, S.; Qiu, J.; Wangab, Y.; Xiang, J. Evolution of Aromatic Structures during the Low-Temperature Electrochemical Upgrading of Bio-oil. Energy Fuels 2019, 33, 11292–11301. [Google Scholar] [CrossRef]
  17. The Interagency Commodity Estimates Committees. World Agricultural Supply and Demand Estimates; United States Department of Agriculture: Washington, DC, USA, 2019.
  18. Lim, J.S.; Manan, Z.A.; Alwi, S.R.W.; Hashim, H. A review on utilisation of biomass from rice industry as a source of renewable energy. Renew. Sustain. Energy Rev. 2012, 16, 3084–3094. [Google Scholar] [CrossRef]
  19. Nik-Azar, M.; Hajaligol, M.; Sohrabi, M.; Dabir, B. Mineral matter effects in rapid pyrolysis of beech wood. Fuel Process. Technol. 1997, 51, 7–17. [Google Scholar] [CrossRef]
  20. Li, W.; Wang, L.; Qiao, Y.; Lin, J.-Y.; Wang, M.; Chang, L. Effect of atmosphere on the release behavior of alkali and alkaline earth metals during coal oxy-fuel combustion. Fuel 2015, 139, 164–170. [Google Scholar] [CrossRef]
  21. Lam, C.H.; Deng, W.; Lang, L.; Jin, X.; Hu, X.; Wang, Y. Minireview on Bio-Oil Upgrading via Electrocatalytic Hydrogenation: Connecting Biofuel Production with Renewable Power. Energy Fuels 2020, 34, 7915–7928. [Google Scholar] [CrossRef]
  22. Han, Y.; Gholizadeh, M.; Tran, C.-C.; Kaliaguine, S.; Li, C.-Z.; Olarte, M.; Garcia-Perez, M. Hydrotreatment of pyrolysis bio-oil: A review. Fuel Process. Technol. 2019, 195, 106140. [Google Scholar] [CrossRef]
  23. Liaw, S.B.; Wu, H. Leaching Characteristics of Organic and Inorganic Matter from Biomass by Water: Differences between Batch and Semi-continuous Operations. Ind. Eng. Chem. Res. 2013, 52, 4280–4289. [Google Scholar] [CrossRef]
  24. Asadieraghi, M.; Daud, W.M.A.W. Characterization of lignocellulosic biomass thermal degradation and physiochemical structure: Effects of demineralization by diverse acid solutions. Energy Convers. Manag. 2014, 82, 71–82. [Google Scholar] [CrossRef]
  25. Jiang, L.; Hu, S.; Sun, L.-S.; Su, S.; Xu, K.; He, L.-M.; Xiang, J. Influence of different demineralization treatments on physicochemical structure and thermal degradation of biomass. Bioresour. Technol. 2013, 146, 254–260. [Google Scholar] [CrossRef]
  26. Chen, D.; Wang, Y.; Liu, Y.; Cen, K.; Cao, X.; Ma, Z.; Li, Y. Comparative study on the pyrolysis behaviors of rice straw under different washing pretreatments of water, acid solution, and aqueous phase bio-oil by using TG-FTIR and Py-GC/MS. Fuel 2019, 252, 1–9. [Google Scholar] [CrossRef]
  27. De Caprariis, B.; De Filippis, P.; Petrullo, A.; Scarsella, M. Hydrothermal liquefaction of biomass: Influence of temperature and biomass composition on the bio-oil production. Fuel 2017, 208, 618–625. [Google Scholar] [CrossRef]
  28. Sipponen, M.H.; Özdenkçi, K.; Muddassar, H.R.; Melin, K.; Golam, S.; Oinas, P. Hydrothermal Liquefaction of Softwood: Selective Chemical Production Under Oxidative Conditions. ACS Sustain. Chem. Eng. 2016, 4, 3978–3984. [Google Scholar] [CrossRef] [Green Version]
  29. Yan, M.; Hantoko, D.; Susanto, H.; Ardy, A.; Waluyo, J.; Weng, Z.; Lin, J. Hydrothermal treatment of empty fruit bunch and its pyrolysis characteristics. Biomass-Convers. Biorefinery 2019, 9, 709–717. [Google Scholar] [CrossRef]
  30. Chen, D.; Cen, K.; Chen, F.; Ma, Z.; Zhou, J.; Li, M. Are the typical organic components in biomass pyrolyzed bio-oil available for leaching of alkali and alkaline earth metallic species (AAEMs) from biomass? Fuel 2020, 260, 116347. [Google Scholar] [CrossRef]
  31. Hames, B.; Ruiz, R.; Scarlata, C.; Sluiter, A.; Templeton, D. Determination of Ash in Biomass, Laboratory Analytical Procedure.; Technical Report; National Renewable Energy Laboratory: Golden, CO, USA, 2008.
  32. Karnowo; Zahara, Z.F.; Kudo, S.; Norinaga, K.; Hayashi, J.-I. Leaching of Alkali and Alkaline Earth Metallic Species from Rice Husk with Bio-oil from Its Pyrolysis. Energy Fuels 2014, 28, 6459–6466. [Google Scholar] [CrossRef]
  33. Salo, K.; Mojtahedi, W. Fate of alkali and trace metals in biomass gasification. Biomass Bioenergy 1998, 15, 263–267. [Google Scholar] [CrossRef]
  34. Hermans, C.; Bourgis, F.; Faucher, M.; Strasser, R.J.; Delrot, S.; Verbruggen, N. Magnesium deficiency in sugar beets alters sugar partitioning and phloem loading in young mature leaves. Planta 2005, 220, 541–549. [Google Scholar] [CrossRef] [PubMed]
  35. Ge, J.; Wu, Y.; Han, Y.; Qin, C.; Nie, S.; Liu, S.; Wang, S.; Yao, S. Effect of hydrothermal pretreatment on the demineralization and thermal degradation behavior of eucalyptus. Bioresour. Technol. 2020, 307, 123246. [Google Scholar] [CrossRef] [PubMed]
  36. Taboada, E.; Fisher, P.; Jara, R.; Zuniga, E.; Gidekel, M.; Cabrera, J.C.; Pereira, E.; Gutierrez-Moraga, A.; Villalonga, R.; Cabrera, G. Isolation and characterisation of pectic substances from murta (Ugni molinae Turcz) fruits. Food Chem. 2010, 123, 669–678. [Google Scholar] [CrossRef]
  37. Oh, B.-C.; Kim, M.H.; Yun, B.-S.; Choi, W.-C.; Park, S.-C.; Bae, S.-C.; Oh, T.-K. Ca2+-inositol phosphate chelation mediates the substrate specificity of beta-propeller phytase. Biochemistry 2006, 45, 9531–9539. [Google Scholar] [CrossRef] [PubMed]
  38. Connatser, R.M.; Frith, M.G.; Jun, J.; Lewis, S.A.; Brady, M.P.; Keiser, J.R. Approaches to investigate the role of chelation in the corrosivity of biomass-derived oils. Biomass Bioenergy 2020, 133, 105446. [Google Scholar] [CrossRef]
  39. Yang, H.; Yan, R.; Chen, H.; Lee, D.H.; Liang, D.T.; Zheng, C. Mechanism of palm oil waste pyrolysis in a packed bed. Energy Fuels 2006, 20, 1321–1328. [Google Scholar] [CrossRef]
  40. Pandey, K.K. A study of chemical structure of soft and hardwood and wood polymers by FTIR spectroscopy. J. Appl. Polym. Sci. 1999, 71, 1969–1975. [Google Scholar] [CrossRef]
  41. Wen, J.-L.; Sun, S.-L.; Xue, B.-L.; Sun, R.-C. Quantitative Structures and Thermal Properties of Birch Lignins after Ionic Liquid Pretreatment. J. Agric. Food Chem. 2013, 61, 635–645. [Google Scholar] [CrossRef]
  42. Park, B.-D.; Wi, S.G.; Lee, K.H.; Singh, A.P.; Yoon, T.-H.; Kim, Y.S. Characterization of anatomical features and silica distribution in rice husk using microscopic and micro-analytical techniques. Biomass Bioenergy 2003, 25, 319–327. [Google Scholar] [CrossRef]
  43. Ahmaruzzaman, M.; Gupta, V.K. Rice Husk and Its Ash as Low-Cost Adsorbents in Water and Wastewater Treatment. Ind. Eng. Chem. Res. 2011, 50, 13589–13613. [Google Scholar] [CrossRef]
  44. Liu, Z.; Zhang, F.-S. Effects of various solvents on the liquefaction of biomass to produce fuels and chemical feedstocks. Energy Convers. Manag. 2008, 49, 3498–3504. [Google Scholar] [CrossRef]
  45. Xu, D.; Zhang, Y.; Zhou, H.; Meng, Y.; Wang, S. Characterization of adhesive penetration in wood bond by means of scanning thermal microscopy (SThM). Holzforschung 2016, 70, 323–330. [Google Scholar] [CrossRef]
  46. Zhang, L.; Li, T.; Wang, S.; Dong, L.; Li, C.-Z. Effects of Alkali and Alkaline Earth Metallic Species and Chemical Structure on Nascent Char-O-2 Reactivity. Energy Fuels 2017, 31, 13578–13584. [Google Scholar] [CrossRef]
  47. Mahadevan, R.; Adhikari, S.; Shakya, R.; Wang, K.; Dayton, D.; Lehrich, M.; Taylor, S.E. Effect of Alkali and Alkaline Earth Metals on in-Situ Catalytic Fast Pyrolysis of Lignocellulosic Biomass: A Microreactor Study. Energy Fuels 2016, 30, 3045–3056. [Google Scholar] [CrossRef]
  48. Guo, F.H.; Zhong, Z.P. Optimization of the co-combustion of coal and composite biomass pellets. J. Clean. Prod. 2018, 185, 399–407. [Google Scholar] [CrossRef]
  49. Mourant, D.; Wang, Z.; He, M.; Wang, X.S.; Garcia-Perez, M.; Ling, K.; Li, C.-Z. Mallee wood fast pyrolysis: Effects of alkali and alkaline earth metallic species on the yield and composition of bio-oil. Fuel 2011, 90, 2915–2922. [Google Scholar] [CrossRef]
  50. Eom, I.-Y.; Kim, J.-Y.; Kim, T.-S.; Lee, S.-M.; Choi, D.; Choi, I.-G.; Choi, J.-W. Effect of essential inorganic metals on primary thermal degradation of lignocellulosic biomass. Bioresour. Technol. 2012, 104, 687–694. [Google Scholar] [CrossRef]
  51. Zhang, S.; Xiong, Y. Washing pretreatment with light bio-oil and its effect on pyrolysis products of bio-oil and biochar. RSC Adv. 2016, 6, 5270–5277. [Google Scholar] [CrossRef]
  52. Stankovikj, F.; McDonald, A.G.; Helms, G.L.; Olarte, M.V.; Garcia-Perez, M. Characterization of the Water-Soluble Fraction of Woody Biomass Pyrolysis Oils. Energy Fuels 2017, 31, 1650–1664. [Google Scholar] [CrossRef]
  53. Raveendran, K.; Ganesh, A.; Khilar, K.C. Influence of mineral matter on biomass pyrolysis characteristics. Fuel 1995, 74, 1812–1822. [Google Scholar] [CrossRef]
  54. Zhao, P.; Shen, Y.; Ge, S.; Chen, Z.; Yoshikawa, K. Clean solid biofuel production from high moisture content waste biomass employing hydrothermal treatment. Appl. Energy 2014, 131, 345–367. [Google Scholar] [CrossRef] [Green Version]
  55. Medrano, J.; Oliva, M.; Ruiz, J.; García, L.; Arauzo, J. Hydrogen from aqueous fraction of biomass pyrolysis liquids by catalytic steam reforming in fluidized bed. Energy 2011, 36, 2215–2224. [Google Scholar] [CrossRef]
  56. Li, H.; Xu, Q.; Xue, H.; Yan, Y. Catalytic reforming of the aqueous phase derived from fast-pyrolysis of biomass. Renew. Energy 2009, 34, 2872–2877. [Google Scholar] [CrossRef]
Figure 1. Schematic diagram of the integrated leaching and thermochemical technologies for producing high-value products from rice husk.
Energies 13 06033 g001
Figure 2. Schematic diagram of (a) the hydrothermal reactor system and (b) the vertical drop-tube reactor system.
Energies 13 06033 g002
Figure 3. (a) Alkaline earth metal species (AAEMs) concentrations of RH, RH-HT, RH-Pyro, and RH-HCl samples and (b) the removal efficiency on AAEMs of AP-HT, AP-Pyro, and HCl. RH-HT, RH-Pyro, and RH-HCl stand for RH leached by AP-HT, AP-Pyro and HCl; AP-HT and AP-Pyro stands for the aqueous phases of bio-oil prepared by hydrothermal and pyrolysis.
Energies 13 06033 g003
Figure 4. Fourier transform infrared (FTIR) spectra of RH, RH-HT, RH-Pyro and RH-HCl samples. RH-HT, RH-Pyro and RH-HCl stand for RH leached by AP-HT, AP-Pyro and HCl; AP-HT and AP-Pyro stands for the aqueous phases of bio-oil prepared by hydrothermal and pyrolysis.
Energies 13 06033 g004
Figure 5. Mechanistic diagram of AAEMs removal by acids.
Energies 13 06033 g005
Figure 6. TGA (a) and DTG (b) of RH, RH-HT, RH-Pyro and RH-HCl samples. RH-HT, RH-Pyro and RH-HCl stand for RH leached by AP-HT, AP-Pyro and HCl; AP-HT and AP-Pyro stands for the aqueous phases of bio-oil prepared by hydrothermal and pyrolysis.
Energies 13 06033 g006
Figure 7. Distribution of (a) chemical compounds with different functional groups and (b) different carbon atom numbers in bio-oil. RH-HT, RH-Pyro and RH-HCl stand for RH leached by AP-HT, AP-Pyro and HCl; AP-HT and AP-Pyro stands for the aqueous phases of bio-oil prepared by hydrothermal and pyrolysis.
Energies 13 06033 g007
Table 1. The proximate and ultimate analysis of rice husk (RH) samples.
SampleProximate Analysis
(wt%, ar)
Ultimate Analysis
(wt%, daf)
Water ContentVolatile matterFixed Carbon aAshCHO aNS
Rice husk9.4571.944.1614.4541.285.1253.110.420.07
ar: as received basis; daf: dry and ash free basis; a: by difference (Fixed carbon=100-Water content-Volatile matter-Ash, O%=100%-C%-H%-N%-S%).
Table 2. The water content and pH of aqueous phases of both bio-crude prepared by hydrothermal liquefaction (AP-HT) and bio-oil prepared by pyrolysis (AP-Pyro).
SamplesWater Content (wt%)pH
AP-HT98.103.24
AP-Pyro58.662.70
Table 3. The identified chemical compounds in AP-HT and AP-Pyro by GC-MS.
CompoundsMolecular FormulaRelative Content (%) in
AP-HTAP-Pyro
Acids
Formic acidCH2O20.1362.557
Acetic acidC2H4O20.39920.939
Propanoic acidC3H6O20.0001.850
n-Hexadecanoic acidC16H32O22.3920.000
Octadecanoic acidC18H36O22.4760.000
Total 5.40225.346
Furans
FurfuralC5H4O21.2172.835
Benzofuran, 2,3-dihydro-C8H8O0.0001.461
2(5H)-FuranoneC4H4O21.2851.143
5-HydroxymethylfurfuralC6H6O33.3480.000
2-Furancarboxaldehyde, 5-methyl-C6H6O20.1690.000
2,4(3H,5H)-Furandione, 3-methyl-C5H6O30.3610.000
2-FuranmethanolC5H6O20.2823.261
4-Methyl-5H-furan-2-oneC5H6O20.3710.000
Total 7.0348.700
Ketones
2,3-ButanedioneC4H6O20.0001.162
1-Hydroxy-2-butanoneC4H8O20.0002.309
2-Propanone, 1-hydroxy-C3H6O21.82510.119
2-ButanoneC4H8O2.7200.959
2-Propanone,1-(acetyloxy)-C5H8O30.0001.544
2-Cyclopenten-1-oneC5H6O0.0001.048
1,2-CyclopentanedioneC8H12O21.3750.000
DihydroxyacetoneC3H6O30.6020.000
3-PentanoneC5H10O0.4370.532
ApocyninC9H10O30.5790.000
2-Cyclopenten-1-one, 2-hydroxy-C5H6O20.0003.066
2-Cyclopenten-1-one, 2-hydroxy-3-methyl-C6H8O20.5672.364
2-Cyclopenten-1-one, 2-hydroxy-3-methyl-C6H8O20.7420.000
2-Propanone, 1-(4-hydroxy-3-methoxyphenyl)-C10H12O30.0001.004
1-Hydroxy-2-pentanoneC5H10O20.4060.000
3-Pyrazolidinone, 1,4-dimethylC5H10N2O1.0710.000
3,6-NonadecadioneC19H36O21.1010.000
3′,5′-DimethoxyacetophenoneC10H12O30.2830.000
Total 11.71024.107
Phenol
Phenol, 2-methoxy-C7H8O22.2762.967
p-CresolC7H8O0.4620.000
CreosolC8H10O22.8601.919
PhenolC6H6O0.4201.189
Phenol, 4-ethyl-2-methoxy-C9H12O20.5560.671
2-Methoxy-4-vinylphenolC9H10O23.0381.044
trans-IsoeugenolC10H12O20.6440.000
Phenol, 2,6-dimethoxy-C8H10O31.3853.191
Phenol, 4-methoxy-3-(methoxymethyl)-C9H12O30.5890.000
Phenol, 2,6-dimethoxy-4-(2-propenyl)-C11H14O30.2580.000
Ethanone, 1-(4-hydroxy-3,5-dimethoxyphenyl)-C10H12O40.5280.000
Total 13.01610.982
Sugars
d-MannoseC6H12O60.7710.000
2,3-Anhydro-d-mannosanC6H8O40.0000.807
1,43,6-Dianhydro-α-d-glucopyranoseC6H8O40.3941.551
d-Glycero-d-galacto-heptoseC7H14O70.0000.945
β-D-Glucopyranose, 1,6-anhydro-C6H10O517.8186.329
Total 18.9839.632
Table 4. The O/C and H/C ratios of rice husk samples.
ItemRHRH-HTRH-PyroRH-HCl
O/C1.571.331.301.17
H/C0.110.120.120.11
Table 5. Pyrolysis characteristic parameters of raw and pretreated rice husk samples.
Samplesm1 (wt.%)DTGmax (wt.%/min)Tmax (°C)Ti (°C)
RH61.86.1339.5270.2
RH-HT67.27.6355.8294.9
RH-Pyro64.97.8358.5279.6
RH-HCl66.19.1347.3301.8
Publisher’s Note: MDPI stays neutral with regard to jurisdictional claims in published maps and institutional affiliations.

