Abstract
The issues that are presented in the article concern the broadly understood parameters of the operation of lighting fixtures in mixed systems and the improvement of the quality of electricity, considered in two aspects: as receivers of the energy consumed, determining and generating reactive power, influencing the asymmetry of currents and the production of higher harmonics, determined by the parameters of current and supply voltage (independent of the consumers connected at the connection point), which are influenced by the consumers that are connected at the connection point. After the tests, in order to improve the quality of energy, a proprietary program for the design of passive resonance filters was developed. A wide range of measurements of various types of lighting devices was carried out in single, complex, and mixed systems. Luminaires with discharge and LED sources were selected for the analysis of energy parameters. The tests were carried out in accordance with the IEEE 1459-2010 standard for single-phase circuits with distorted waveforms.
1. Introduction
Along with the growing use of new technologies in power supply systems in power grids, the problem of maintaining the parameters that are required by the standards, determining the quality of electricity [1,2]. Many works present both the definition of the basic parameters of the quality of electricity [3,4] and the methods of shaping the current and voltage waveforms and limiting harmonics [5,6,7]. The direct cause of the generation of current in the higher harmonics are non-linear loads. This type of load causes the current waveforms to be distorted relative to the optimal sinusoidal wave. There are increasing receivers with non-linear characteristics, such as rectifiers, switching power supplies, or converter drive systems.
In the works [8,9,10], the authors pay attention to voltage converters, which can generate noise in the form of higher harmonics to the grid. These devices are necessary, especially for work with photovoltaic installations. In this case, the generation of higher harmonics to the grid changes the parameters of this grid, which, in turn, may cause incorrect operation or even damage to PV systems connected to this grid [11,12,13]. This fact presents scientists with new challenges on how to best protect the network from such situations. A classic safeguard is to use LCL filters instead of LC. According to [14,15,16] it is a more advantageous solution due to the suppression of higher harmonics, while maintaining the same inductance.
The constantly growing number of non-linear receivers, also in lighting installations, causes increasing problems with current wave distortion. The current distortions are not only greater than those permitted by the currently applicable standards, but, in extreme cases, they are so large that they cause various types of failure [4]. Because the harmonics affects the operation of devices, it is essential to minimize or completely eliminate it [17]. The current harmonics related to the distortion can be eliminated by using a parallel resonance filter [18,19,20]. Resonance filters are widely used in order to improve the quality of electricity. They can work independently as passive filters [19,20] or cooperate with active filters, creating a composite filter [21,22,23].
In lighting installations, switching power supplies are used in devices with fluorescent and metal halide sources and, above all, in the increasingly popular devices with light-emitting diodes (LED). The US Department of Energy (DOE) predicts that replacing traditional energy sources with LEDs in the near future may result in energy savings of 40 percent [24]. This means an energy saving of 261 terawatt-hours (TWh) per year.
Figure 1 shows tthe modified diagram of such an installation.
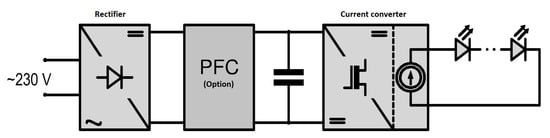
Figure 1.
A simplified diagram of a lighting device with LEDs.
In the case of industrial installations, the elimination of higher harmonics seems to be a simple problem. Already at the stage of designing the installation, the designer can predict the various operating conditions of such an installation and select an appropriate active or passive filter for it, which, under normal operating conditions of this installation, should ensure the appropriate quality of energy in the network (no higher harmonic emissions). The problem becomes more complicated with lighting installations. At the design stage, it is impossible to predict what light sources will work in such an installation until the end of its life. The permanent modernization of lighting installation is another problem. An example can be street lighting in Poland. According to various estimates, it consumes between 1500 and 2500 gigawatt-hours (GWh) of electricity. Additionally, on the basis of estimates, it is estimated that about 3.3 million road and street luminaires [25,26] are in use. The declaration “Solidarity for the climate” was signed during the international climate conference COP 24 in Katowice. One of the goals in this declaration is LED lighting of cities that belong to the Network of Polish Progressive Cities until 2030 [27]. This example shows how important it is to create an appropriate IT tool that, in the dynamically changing working conditions of a lighting installation, would be able to select an appropriate filter for it in a very short time to eliminate higher harmonics that are emitted to the network by non-linear sources.
The article describes examples of research on the operation of lighting installations in mixed systems with LED sources. The tests and measurements were carried out in accordance with the IEEE 1459-2010 standard [28] for single-phase circuits with distorted waveforms. A passive resonant filter for the elimination of current harmonics was also proposed, the parameters of which are dynamically selected by the proprietary program calculating the actual impedance of the supply network at a given load connection point, the spectrum of harmonics that are generated by a given load, and appropriate standard recommendations for the analyzed case.
2. The Power Theory According to the IEEE Standard 1459
In the calculations quoted below k = 1 was always assumed, so the obtained harmonics spectra do not contain the interharmonics or subharmonics described in [28]. The IEEE 1459 standard used for single-phase distorted waveforms introduces many different types of power. Note that only one definition of reactive power is given here, that is fundamental harmonic reactive power. This is due to the fact that, at the current level of theoretical electrical engineering development, there is no complete universally accepted power theory for distorted circuits.
According to the IEEE 1459 standard, three types of power have been distinguished, occurring in single-phase circuits with distorted waveforms. These are: active powers whose unit is W, nonactive power whose unit is var, and apparent power whose unit is VA. The active power P interpreted as all power transferred from the source to the receiver is defined in three equivalent ways:
Active power has two components: fundamental active power and harmonic active power :
The apparent power S that is defined in chapter 4.7 of the IEEE 1459 standard is interpreted as the amount of active power that can be delivered to the load under ideal conditions, i.e., with undistorted waveforms and a power factor of 1. The definition is based on the RMS voltage and current. It is a geometric sum of four different components that are defined in detail in Sections 4.9 to 4.12 of the IEEE 1459 standard. It is a geometric sum of four different components defined in detail in Sections 4.9 to 4.12 of the IEEE 1459 standard.
The active power P is the sum of the active power of the fundamental harmonic and active power of the harmonics . There is no similar relationship in the case of apparent powers. Hence, the norm [23] introduces the concept of non-fundamental apparent power in Section 4.9 (nonfundamental apparent power), which is the geometric difference between the apparent power S and the apparent power of the fundamental harmonic .
The IEEE 1459 standard does not introduce the concept of reactive power for harmonics; instead, it introduces two additional powers that complement the relationship between total active and apparent powers, and active and apparent harmonic powers. These are the harmonic distortion power and the nonactive power N.
The only type of reactive power that is introduced by the standard [23] for distorted circuits is the reactive power of the fundamental harmonic :
The reactive power oscillates between the source and the receiver, so that its average value for the period T is always zero. This power does not participate in the transmission of energy from the source to the receiver, generating only power losses. Chapter 4.6 of the [28] code also gives an equivalent definition of the integral power . This definition is based, inter alia, on the indefinite integral, as opposed to all the others, based only on definite integrals. Because of the fact that, for discrete waveforms described by vectors u, i, and t, the concept of indefinite integral does not exist (the indefinite integral exists only for continuous functions of time t) the practical usefulness of this definition is small.
It should be noted that from among many types of power introduced by the standard, only all active powers and powers , and have a clear physical interpretation. The remaining powers were introduced only to complement the mathematical relationships, so it is impossible to link them with real energy phenomena occurring in the circuit.
In chapter 4.16, the [29] standard states that, in most practical cases, the following relation is satisfied: . The power factor (PF) and total harmonic distortion (THD) factors, introduced in [29] chapters 4.1, 4.15, and 4.16, have a direct relationship to energy phenomena in the circuit. Power factors express the ratio of active power to apparent power, for all harmonics and for the fundamental harmonic, respectively:
The THD factors for voltage and current have the following definitions:
where: U, I - RMS voltage, and current.
In chapter 4.16, the [28] standard also gives the relationship between the , and factors and the total power factor :
However, this is an approximate connection and the standard recommendations are to use only when and .
3. Results
According to the EMC Directive 2014/30/EC, electrical devices should be so constructed that they do not interfere with the operation of other devices and that they are resistant to destruction to the extent that allows for their operation, as intended. The assessment of the harmonic current content should be performed in accordance with the provisions of the standards [1,28,29].
The measurements were performed in the modified system that is shown in Figure 2. All of the measurements were made by registering N = 256 samples for the period of the fundamental harmonic Hz. The values of time samples obtained as a result of the measurement, contained in the textbf t vector, were normalized, so that: s (values of the first element of the time vector and the initial integration time have been set to zero). The technical parameters of the used recorder resulted in the following values: H = 128, T = 0.02 s and ms.
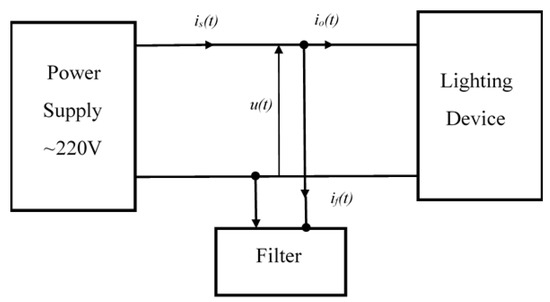
Figure 2.
Scheme of the measuring system.
When calculating all of the values based on integral definitions, the trapezoidal approximation of the integral was used. All values of the integrals and harmonics were calculated for one period of the fundamental harmonic Hz, thus assuming k = 1.
The standard [1] specifies the permissible levels of harmonic current emissions for the phase current supplying the load not greater than 16 A. This standard applies to single-phase receivers for home or office use and divides the devices into four classes: A, B, C, and D, for which limits the content of individual harmonics are defined.
Lighting receivers were assigned to class C (lighting equipment). Depending on the input active power, they are divided into two groups—greater than 25 W and less than or equal to 25 W. In the case of lighting equipment with an active input power greater than 25 W, the current harmonics should not exceed the relative levels that are given in Table 1. which, when converting harmonic current to power, gives the levels shown in column 2 of Table 2. For lighting equipment with active input power not greater than 25 W current harmonics should not exceed the permissible levels, depending on the rated power and specified in column 2 of Table 3.

Table 1.
Permissible levels of harmonic content P > 25 W (class C).
Table 2.
Permissible levels of harmonic content P ≤ 25 W (class C).
Table 3.
Power factor values for lighting lamps (fittings).
The value of the power factor PF depends on the voltage and current harmonics. Until recently, only the power factor values for the discharge lamps were specified for luminaires [30]. Since January 2013, its value has also been determined for LED luminaires [31]. Table 3 presents the permissible values.
During the performance of acceptance measurements and expert opinions in 2013–2019, seven luminaires, luminaire sets, and lighting installations with discharge sources and LEDs were selected and presented in Table 4 in order to illustrate the phenomena described in the previous chapters of the article.
Table 4.
Summary of measurement results and calculations of electrical parameters of the tested installations.
In the system supply network-lighting receiver, the network voltage and currents were registered. The obtained waveforms are shown in Appendix A.
Subsequently, the recorded waveforms were subjected to FFT (Fast Fourier Transform) analysis, using the form of transformation and inverse transformation described by equations in accordance with the IEEE 1459 standard [28].
In the next step, the effective values of voltage and current of the tested installations were determined, as well as other types of power and PF defined in the standard [28]. Table 5 presents the calculation results.
Table 5.
Summary of measurement results and calculations of electrical parameters of the tested installations.
Based on the collected results, it can be concluded that the obtained THD values are small. However, the obtained THD values for some of the analyzed cases (apart from the correctly operating one) are characterized by THD values between 10% and 50%, which indicates high waveform distortion. This is information regarding the invalid and non-standard operation of devices. For tested luminaires Inst.1. and Inst.2., the obtained THD values exceed the value of 50%, which means a very large current waveform distortion. Equipment malfunctions are highly likely. A detailed analysis of the system operation as well as the selection and installation of devices limiting the current harmonics is essential. The results confirm the incompatibility of the obtained values of the THD current harmonic content factor, known from the literature and own measurements.
4. The Use of Passive Filter Systems to Improve Power Quality
The subject of considerations in the article is a passive resonant filter that is used to suppress the higher harmonics of the current, with the structure described in [6]. The filter consists of any number of LC branches. The resonant frequency of each branch is equal to the selected frequency, the hth harmonic of the waveform with the fundamental frequency f. The selection of the L and C values of the branches is simple; it is enough to use the formula that results from the series resonance condition. However, the number and complexity of the calculations increases as the goal is to design a real filter composed of real elements with non-zero internal resistances and strictly defined allowable values for effective and peak currents and voltages.
4.1. Software and Its Functional Features
A program was created in the Scilab environment to automate filter design calculations. It is a free program for numerical calculations. This program provides a computing environment for engineering and scientific applications. Its functionality is sufficient to solve the problems described in the article. Before starting to design the filter, analyze the harmonic content in the load current (Figure 3a) and compare the obtained results with the provisions of the relevant legal acts. In the case of the considered lighting installations, it is the standard option [28]. Next, the structure of the filter should be determined by specifying the number and types of its branches and their resonance frequencies (Figure 3c). The filter branches consist of L and C elements connected in series and in parallel, thanks to which, from the series of types available on the market, total values of capacitance and inductance, determined by the given resonant frequency of a given branch, can be obtained. The next step is to solve the equivalent circuit (Figure 3b,c) in the frequency domain (for each h-th harmonic) and perform the inverse Fourier transform in order to determine the peak and effective values of currents and voltages of individual elements. RMS, peak, and active powers are calculated in order to check that the rated values of the L, C, and R elements used in the filter construction are not exceeded.
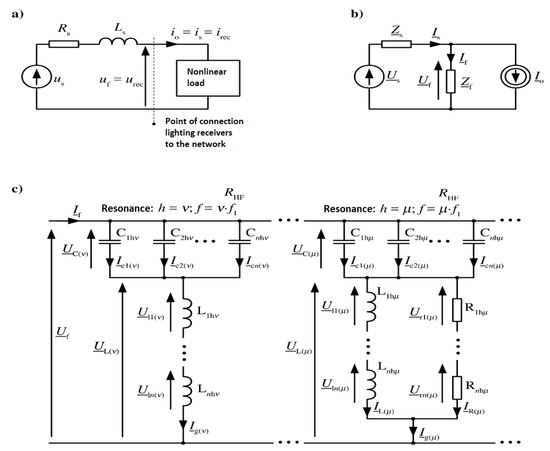
Figure 3.
Equivalent circuit diagrams: (a) before applying the filter, (b) circuit with filter, and (c) diagram for harmonics (internal filter structure).Equivalent circuit diagrams.
The block diagram shows the functional relationships of the individual program elements Figure 4.
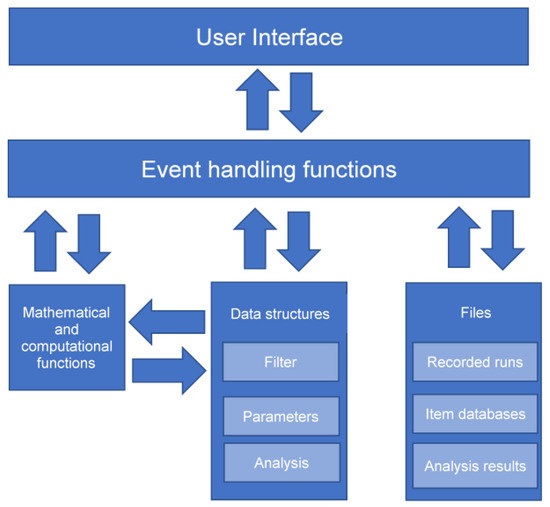
Figure 4.
Simplified block diagram of the program.
Working with the program begins with creating its internal database necessary to design and analyze the filter. In the first stage, the network current and voltage waveforms recorded at the filter connection point should be loaded in the form of oscillograms, saved in the (*.csv) file. One should also load previously prepared (*.xls) files, which contain libraries of R, L, and C elements prepared on the basis of manufacturer’s catalog cards, and (*.xls) file containing harmonic emission limits in accordance with the requirements of the standard [28]. After loading the input data, the program analyzes the harmonic spectrum of the loaded current waveform and indicates the harmonics exceeding the limits that are specified in the standard [28].
The next step is to build the filter structure, using an editor that allows for adding and removing subsequent filter resonance branches, and individual L and C elements of each branch. This stage of work is supported by the “Branch Element Calculator” and the constantly updated impedance chart of the branch being built. The branch may also contain high frequency R resistors [7].
In the first step, we calculate the impedances of the individual elements L, C and R of each branch, respectively, marked and (i—element number in the group). The numbers of the vector elements correspond to the consecutive harmonics up to h = 128 inclusive. The calculations are carried out for 128 harmonics, which results from the fact that the and waveforms are recorded with a recorder with a resolution of 256 samples per period of the fundamental harmonic. The program uses the forms of the FFT transformation and the inverse transformation. The calculations are made on the complex peak values of the harmonic currents and voltages, not the RMS values. The constant component is ignored in the calculations, because the filter of the analyzed structure has a constant component. There is no zero sequence current in the filter.
M denotes the number of elements in the group, i.e., the number of branch capacitors that are connected in parallel or coils or resistors connected in series. Calculations for resistors are performed only when the branch contains HF resistors, that is when the logical variable at the address Filtr.Galezie (x).Rhf in the program is “true”. In the next step, the impedances of the following branches are calculated:
and
where the p denotes the number of parallel branches Filter.Branches(x).Paralel. In order to lower the impedance for a given harmonic, the filter may contain more than one branch with the same structure. The results are stored in successive cells of the Analysis.Bales(x).Z vector.
At the end of this step, the impedance of the entire filter is calculated:
where M denotes the number of filter branches. The results are saved in the vector at Analysis.Z.
In the next step, the voltages and currents of the circuit are determined:
The filter internal voltages and currents are calculated from the dependence:
and
and
The determined values of the total load and filter current harmonics are compared with the values that are allowed by the standard and displayed in the main program window.
After determining the flow of currents and voltage distribution, the active powers of the resistors, the RMS values of currents and voltages, as well as the values of THD, PF, and tan factors are determined according to [28]. All of the circuit voltages and currents, represented by the vectors, of the complex maximum values for successive harmonics, are subjected to the inverse Fourier transform.
The last step is to display the filter impedance graph and the harmonic spectrum of the mains current calculated after applying the filter in the program window. These data make it possible to determine whether the designed filter meets all of the adopted assumptions and, if necessary, to introduce modifications. The remaining data are exported to the output files.
4.2. Luminaires and Lighting Installations with Passive Filter Systems
At the current level of theoretical electrical engineering development, there is no complete, universally accepted power theory for distorted circuits. Before selecting the IEEE 1459-2010 standard for further analyzes that are described in the article, measurements and calculations were made according to several internationally recognized power theories for distorted waveforms. The calculations were made for the selected Inst.2. characterized by significant current distortion in the circuit.
The calculated values of reactive power well illustrate the current, still unresolved problems with the analysis and evaluation of the phenomena related to the oscillations of the energy flow in distorted circuits. The reactive power that is calculated on the basis of the Budeanu theory has a negative value, while the values that are calculated according to Shepherd–Zakikhani–Sharon and Czarnecki are positive. This reflects the fact that in the case of distorted waveforms, it is basically impossible to divide into inductive and capacitive reactive power. Another interpretation of the problem is the multitude of power components, especially in the theories of Shepherd–Zakikhani–Sharon and Czarnecki. The introduced power components are necessary for the closure of the power polyhedron, but their physical interpretation is not clear. Therefore, these components are of little use from an engineering point of view.
It should be noted that the only type of reactive power introduced by the IEEE 1459-2010 [28] standard is the reactive power of the fundamental harmonic Q. Admittedly, the Budeanu theory [26] of power was included in the earlier edition of this IEEE 1459-1994 standard, but it was later removed due to its inadequacy for solving practical problems. Consequently, the Budeanu theory is still very popular, despite its obvious shortcomings.
Summing up the results of the comparisons, it should be stated that from the engineering point of view, the most reliable is the value of the THD current coefficient, which describes the harmonic content. The relationship between the active power P and apparent power S is described by the power factor PF. Therefore, in the further part of the article, the analyzed solutions were assessed in accordance with the [28] recommendations, focusing mainly on the current harmonic content and the power factor PF. The power components and power factors for the tested installations, determined in accordance with the [28] standard, are summarized in the Table 6.
Table 6.
Summary of measurement results and calculations of electrical parameters of the tested installations.
The resulting reduction of the THD value after applying the filter is graphically shown in Figure 5. The blue bars in the graph show the THD harmonic content of the installation under test before the filter is installed.
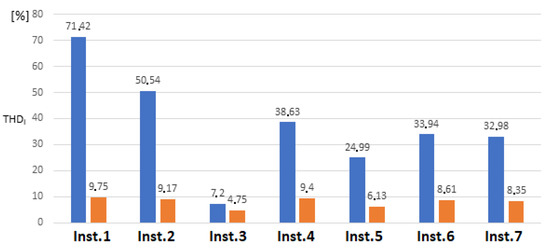
Figure 5.
The obtained values of the reduction of current harmonic distortion factors.
On the basis of the conducted tests and calculations, it was found that the use of passive filters clearly improves the quality of energy by eliminating higher harmonic current components in the tested lighting installations. However, it causes the generation of higher losses that result from the flow of reactive power. This is graphically illustrated in Figure 6. Only in one case, the Inst.7 installation, which was a mixed installation with different light sources, achieved an improvement in both the power factor and a reduction in the reactive power flow in the network.The blue bars in the diagram show the reactive power in the tested installation before the filter was installed.
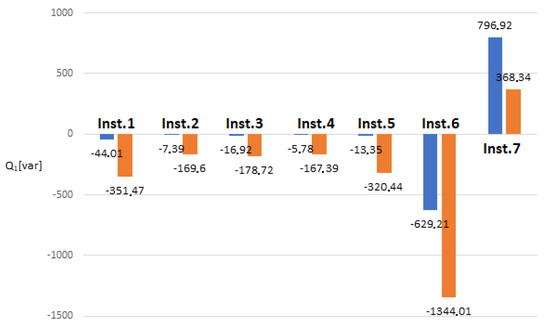
Figure 6.
The obtained values of changes in reactive power Q after applying passive filters.
5. Conclusions
Based on the research and analysis of electrical parameters of luminaires and mixed installations with discharge and LED sources, the following conclusions can be presented:
- Research, selection of parameters, and the use of a hybrid filtering-separation device allows for effective operation of sources, modules, and lighting fittings.
- It can be concluded that the use of a passive filter in the tested cases is the optimal solution due to the simplicity of both the system configuration used and the possibility of selecting elements.
- The developed computer program effectively and efficiently enables the analysis and carries out the selection of parameters of passive filters that are dedicated to the tested installation, which results in a quick and effective reduction of harmonic content in lighting installations.
- In accordance with the regulations, LED lighting fixtures may have a PF power factor not lower than 0.9, which is equivalent to a tan value not greater than 0.48. Unfortunately, the current normative regulations do not take into account the fact that semiconductor power supply systems used in LED luminaires mean flows of capacitive reactive energy, i.e., the value of tg may be negative (e.g., for PF = 0.9 then tg = −0.48). Electronic control and regulation systems do not have a specific allowable power factor, which may cause a further increase in the value of capacitive reactive energy. Based on the measurement results, it can be concluded that replacing the previously used luminaires with luminaires with only LED sources will mean additional costs that result from the flows in the capacitive reactive energy network.
Author Contributions
Conceptualisation, T.P.; methodology, T.P. and M.K.; validation, J.M.; formalanalysis, T.P.; investigation, M.K., J.M. and T.P.; data curation, J.M., M.K.; writing—original draft preparation, J.M., T.P.; writing—review and editing, T.P., M.K.; theoretical modeling, T.P.; software, J.M.; visualization, T.P., J.M.; supervision, T.P.; project administration, T.P. and M.K.; funding acquisition, T.P. and M.K. All authors have read and agreed to the published version of the manuscript.
Funding
This research received no external funding.
Conflicts of Interest
Authors declare no conflict of interest.
Appendix A
Figure A1 shows the recorded current (blue curve) and voltage (green curve) waveforms in the tested lighting installations. Harmonics spectra of the recorded voltage waveform for the tested installations are shown in Figure A2 and the Figure A3 shows the measured current harmonics.

Figure A1.
Recorded current and voltage waveforms in the tested lighting installations.
Figure A1.
Recorded current and voltage waveforms in the tested lighting installations.


Figure A2.
Measured voltage harmonics of the tested installations.
Figure A2.
Measured voltage harmonics of the tested installations.


Figure A3.
Measured current harmonics of the tested installations.+ Permissible value (according to EN 61000-3-2, class C, P > 25W).
Figure A3.
Measured current harmonics of the tested installations.+ Permissible value (according to EN 61000-3-2, class C, P > 25W).

In the picture Figure A3 the symbol (+) denotes the permissible values according to the EN 61000-3-2 standard, and the red bars in the current harmonic diagrams indicate the exceeded values of the respective harmonics.
References
- EN 61000-3-2 Electromagnetic compatibility (EMC)—Part 3-2: Permissible Levels—Permissible Levels of Harmonic Current Emissions (Phase Current Supply of the Receiver <or = 16 A. Available online: https://webstore.iec.ch/publication/67329 (accessed on 13 November 2012).
- EN 61000-3-12 Electromagnetic Compatibility (EMC)—Part 3-12: Permissible Levels—Permissible Levels of Harmonic Currents Caused by the Operation of Receivers to be Connected to the Public Low-Voltage Power Supply Network with a Phase Current Supplying the Load Greater than 16 A and Less than or Equal to 75 A. Available online: https://webstore.iec.ch/publication/4144 (accessed on 13 November 2012).
- Kurkowski, M.; Mirowski, J.; Popławski, T.; Pasko, M.; Białoń, T. Measurements of reactive energy in low voltage installations. Prz. Elektrotechniczn. 2016, R.92, 144–147. [Google Scholar]
- Lange, A.; Pasko, M. Reactive power compensation and filtration of higher harmonics using LC passive filters. Prz. Elektrotechniczn. 2010, R.86, 126–129. [Google Scholar]
- Lange, A.; Pasko, M. Selected issues concerning the quality of electricity in mines and steel mills. Prz. Elektrotechniczn. 2012, R.88, 150–153. [Google Scholar]
- Mirowski, J. Analysis of Operating Parameters of Lighting Luminaires in Mixed Systems. Ph.D. Dissertation, Energo-Bud Sp. Z o.o., Czestochowa, Poland, 2020. Not published. [Google Scholar]
- Maciążek, M.; Pasko, M. Selected Applications of Numerical Algorithms in Optimization of Operating Conditions of Voltage Sources; Publishing House of the Silesian University of Technology: Gliwice, Poland, 2007. [Google Scholar]
- Rockhill, A.A.; Liserre, M.; Teodorescu, R.; Rodriguez, P. Grid-filter design for a multimegawatt medium-voltage voltage-source inverter. IEEE Trans. Ind. Electron. 2011, 58, 1205–1217. [Google Scholar] [CrossRef]
- Gabe, I.J.; Montagner, V.F.; Pinheiro, H. Design and implementation of a robust current controller for VSI connected to the grid through an LCL filter. IEEE Trans. Power Electron. 2009, 24, 1444–1452. [Google Scholar] [CrossRef]
- Turkay, B.E.; Telli, A.Y. Economic analysis of standalone and grid connected hybrid energy systems. Renew. Energy 2011, 36, 1931–1943. [Google Scholar] [CrossRef]
- Jufri, F.H.; Oh, S.; Jung, J. Development of Photovoltaic abnormal condition detection system using combined regression and Support Vector Machine. Energy 2019, 176, 457–467. [Google Scholar] [CrossRef]
- Dhimish, M.; Holmes, V.; Mehrdadi, B.; Dales, M.; Mather, P. Photovoltaic fault detection algorithm based on theoretical curves modelling and fuzzy classification system. Energy 2017. [Google Scholar] [CrossRef]
- Silvestre, S.; da Silva, M.A.; Chouder, A.; Guasch, D.; Karatepe, E. New procedure for fault detection in grid connected PV systems based on the evaluation of current and voltage indicators. Energy Convers. Manag. 2014, 241–249. [Google Scholar] [CrossRef]
- Yu, Y.; Li, H.; Li, Z.; Zhao, Z. Modeling and analysis of resonance in LCL-type grid-connected inverters under different control schemes. Energies 2017, 10, 104. [Google Scholar] [CrossRef]
- Liserre, M.; Blaabjerg, F.; Hansen, S. Design and control of an LCL-filter-based three-phase active rectifier. IEEE Trans. Ind. Appl. 2005, 41, 1281–1291. [Google Scholar] [CrossRef]
- Cha, H.; Vu, T.K. Comparative analysis of low-pass output filter for single-phase grid-connected photovoltaic inverter. In Proceedings of the Twenty-Fifth Annual IEEE Applied Power Electronics Conference and Exposition (APEC), Palm Springs, CA, USA, 21–25 February 2010; pp. 1659–1665. [Google Scholar]
- Iman, L.; Hossein, A.; Mehdi, S.; Alireza, B.; Josep, M. Capacitor Current Feedback-Based Active Resonance Damping Strategies for Digitally-Controlled Inductive-Capacitive-Inductive-Filtered Grid-Connected Inverters. Energies 2016, 9, 642. [Google Scholar] [CrossRef]
- Sharon, D. Reactive power definitions and power factor improvement in nonlinear systems. Proc. Inst. Electr. Eng. 1973, 120, 704–706. [Google Scholar] [CrossRef]
- Dzhankhotov, V.; Pyrhonen, J.; Passive, L.C. Filter Design Considerations for Motor Applications. IEEE Trans. Ind. Electron. 2013, 10, 4253–4259. [Google Scholar] [CrossRef]
- Meenakshi, J.; Sreedevi, V.T. Power Quality Improvement in a Cascaded Multilevel Inverter Interfaced Grid Connected System Using a Modified Inductive–Capacitive–Inductive Filter with Reduced Power Loss and Improved Harmonic Attenuation. Energies 2017, 10, 1834. [Google Scholar] [CrossRef]
- Bhonsle, D.C.; Kelkar, R.B. Design and Analysis of Composite Filter for Power Quality improvement of Electric Arc Furnace. In Proceedings of the 3rd International Conference on Electric Power and Energy Conversion Systems, Istanbul, Turkey, 2–4 October 2013. [Google Scholar]
- Li, L.; Guo, Y.; Zhang, X. Analysis and Application of Passive Damping LLCL Filter in Active Power Filter. In Proceedings of the IEEE International Conference on Cybertechnology in Automation, Control and Intelligent Systems, Shenyang, China, 8–12 June 2015; pp. 751–755. [Google Scholar] [CrossRef]
- Buła, D.; Pasko, M. Stbility analysis of hybrid active power filter. Bull. Half. Acad. Sci. Tech. Sci. 2014, 62, 286–297. [Google Scholar]
- Penning, J.; Stober, K.; Taylor, V.; Yamada, M. Energy Savings Forecast of Solid-State Lighting in General Illumination Applications; Navigant Consulting, Inc.: Washington, DC, USA, 2016. [Google Scholar]
- Pracki, P.; Jägerbr, A. Application of road lighting energy efficiency evaluation system in practice. In Proceedings of the CIE Centenary Conference: Towards a New Century of Light, Paris, Italy, 15–16 April 2013. [Google Scholar]
- Zajkowski, M. The SOWA program for the modernization of road lighting in the commune. Prz. Elektrotechniczn. 2015, R.91, 85–88. [Google Scholar]
- Weżgowiec, M.; Popławski, T.; Kurkowski, M. Forecasting energy consumption for lighting purposes in the years 2018–2030 in the aspect of the resolution of Polish Networks Progressive Cities. Rynek Energii 2019, nr.1, 20–24. [Google Scholar]
- IEEE Std 1459-2010 Standard Definitions for the Measurement of Electric Power Quantities Under Sinusoidal, Nonsinusoidal, Balanced, or Unbalanced Conditions; IEEE: New York, NY, USA, 2010.
- EN 50160 Voltage Characteristics of Electricity Supplied by Public Distribution Systems. Available online: https://www.se.com/ww/library/SCHNEIDER_ELECTRIC/SE_LOCAL/APS/204836_1312/DraftStandard0026rev2-DraftEN501602005-05.pdf (accessed on 13 November 2012).
- Commission Regulation (EC) No 244/2009 of 18 March 2009 Implementing Directive 2005/32/EC of the European Parliament and of the Council with Regard to Ecodesign Requirements for Non-Directional Household Lamps. Available online: https://eur-lex.europa.eu/legal-content/EN/TXT/PDF/?uri=CELEX:32009R0244&from=EN (accessed on 13 November 2012).
- Commission Regulation (EU) No 1194/2012 of 12 December 2012 Implementing Directive 2009/125/EC of the European Parliament and of the Council with Regard to Ecodesign Requirements for Directional Lamps, Light Emitting Diode Lamps and Related Equipment. Available online: https://eur-lex.europa.eu/legal-content/EN/TXT/PDF/?uri=CELEX:32012R1194&from=EN (accessed on 13 November 2012).


Publisher’s Note: MDPI stays neutral with regard to jurisdictional claims in published maps and institutional affiliations. |
© 2020 by the authors. Licensee MDPI, Basel, Switzerland. This article is an open access article distributed under the terms and conditions of the Creative Commons Attribution (CC BY) license (http://creativecommons.org/licenses/by/4.0/).