Article

The Allocation of Carbon Intensity Reduction Target by 2030 among Cities in China

1
Key Laboratory of Urban Environment and Health, Institute of Urban Environment, Chinese Academy of Sciences, Xiamen 361021, China
2
University of Chinese Academy of Sciences, Beijing 100049, China
*
Author to whom correspondence should be addressed.
Energies 2020, 13(22), 6006; https://doi.org/10.3390/en13226006
Submission received: 14 October 2020 / Revised: 8 November 2020 / Accepted: 10 November 2020 / Published: 17 November 2020
(This article belongs to the Special Issue Advanced Low-Carbon Technologies for Clean Energy Systems)

Abstract

:
The regional allocation of carbon emission quotas is of great significance to realize the carbon emission target. Basing on the combination of the multi-index method and the improved equal-proportion distribution method, and fully considering the differences in economic factors, population factors, energy factors, technological factors among cities, China’s 2030 carbon intensity reduction target was allocated. The results indicate that: (1) Under the target constraint of 60% reduction in CO2 emissions per unit of Gross Domestic Product (GDP) (carbon intensity) in 2030 compared to 2005, the carbon intensity target reduction rate (CITRR) of 285 Chinese cities is between 17.65% and 141.14%, with an average reduction rate of 51.52%; (2) the CITRR of cities presents significant spatial positive correlation, and the Global Moran I correlation index is 0.38; and (3) the distribution trend of CITRR is the same as the general trend of economic development of China, showing a basic trend of gradual decline from south to north and from coastal to inland. The allocation method takes into account fairness and efficiency, and reflects the differences between cities, so that the allocation results are likely to be accepted by all parties. Meanwhile, this method breaks the limitation of the lack of city’s data and is likely to implement in actual operation. Cities should choose distinguished low-carbon economic development paths, in combination with their characteristics of economic and social development, and carry out inter-city cooperation to promote carbon emission reduction steadily.

1. Introduction

The inertia of continuous emissions creates potential global warming in the 21st century that is comparable to, but several orders of magnitude faster than, the largest global change in the past 65 million years [1]. The Paris Agreement provides a good opportunity for all countries in the world jointly cope with the climate crisis [2]. China is the largest carbon dioxide emissions country in the world. According to data released by the Global Carbon Atlas, China’s total carbon emission in 2018 was 10,065 Mt CO2, accounting for 27.5% of the world’s carbon emission [3]. China submitted an “Intended Nationally Determined Contribution (INDC)” in the Paris Agreement to actively address climate change, which intends to achieve peak CO2 emissions around 2030 and lower the carbon intensity of GDP by 60–65% below 2005. Studies have opposite opinions on whether China’s current policies are sufficient for China to achieve its INDC [4,5]. Thus, national carbon emission reduction policies cannot guarantee the achievement of the ambitious goal. China needs further strengthen the implementation of the INDC at the local level.
How to reasonably allocate the national commitment at the local level is the key to realize the INDC [6]. Today, the regional allocation of carbon emission reduction targets mainly focuses on the provincial level [7,8]. Few studies have assessed allocation of carbon emission reduction targets at the level of cities for the reason of limit on of data. As the most concentrated region of human social and economic activities, cities have huge carbon emissions [9]. China is a vast country where cities vary greatly in economic growth, technological progress, population density, and resources. A city’s allocation of carbon emission control targets not only directly affects the realization of the overall emission reduction targets but also relates to the sustainable development of economy and society. In essence, the carbon intensity reduction target is a “soft constraint” of the total carbon dioxide emission control. The carbon intensity reduction target allows the total carbon emission to rise with economic growth, but it needs gradually moderate the rate of the total carbon emission rise through technological progress and improvement of energy efficiency [10]. For developing countries, compared with total carbon emissions or per-capita carbon emissions, it is more realistic to quantify emission reduction targets with carbon intensity [11]. China and India have adopted carbon intensity reduction as a carbon emission control target in their INDC. Therefore, how to allocate national carbon intensity reduction targets to cities in an equitable and reasonable way is of great significance for China to achieve the 2030 carbon intensity reduction target.

2. Literature Review

2.1. Research Progress on Carbon Emissions at the City Level

Previous studies about carbon emissions at the cities level in China mainly focuses on carbon emission accounting and analysis of differences in city’s carbon emission. Zheng et al. presented a detailed new inventory of emissions for 337 Chinese cities in 2013, evaluating the differences of carbon intensity between cities and the causes of those differences [12]. The China City Greenhouse Gas Working Group has completed the “China city CO2 emissions Dataset (2005, 2010, 2015)”, which calculates the total city’s carbon emission, per-capita carbon emission and carbon intensity data in 2005, 2010 and 2015. Shan et al. provided CO2 emission inventories of 182 Chinese cities in 2010 through 17 fossil fuels and 46 socio-economic sectors, and they found that wealthier cities systematically reduced their emissions per unit of GDP, thanks to imports from nearby fewer affluent industrial cities [13]. Wang et al. adopted the spatiotemporal model and used Defense Meteorological Satellite Program’s Operational Linescan System (DMSP/OLS) nighttime light images to assess the CO2 emission level of Chinese’s cities [14]. Wang Shaojian et al. adopted kernel density estimation, spatial autocorrelation, spatial Markov chain, and panel quantile regression methods to analyze spatial spillover effects and driving factors of carbon emission intensity in 283 Chinese cities from 1992 to 2013 [15]. There has been no research on the allocation of China’s carbon intensity reduction targets on the city level.

2.2. Carbon Reduction Target Allocation Method

From Table 1, it is clear that the methods used in different studies have their own characteristics and emphasis, including index method, game theory method, data envelopment analysis (DEA) method, improved equal-proportion distribution method, and the integrated method. The index method is divided into single index method and multi-index method. Single index method selects one index to allocate carbon emission rights. Therefore, it only reflects a certain dimension of the distribution process, or represents the interests of some group, and the distribution result is one-sided. Multi-index method adopts two or more indexes for allocation, which is widely used. It represents a wider range of interest demands, effectively improve the scientific and rational allocation results [16]. Chang et al. proposed the allocation of CO2 emission increment quota based on information entropy, and allocated provincial carbon intensity reduction considering the carbon emission reduction capacity, responsibility, potential, and energy efficiency under the inter-provincial emission trading system [17]. Qin et al. used three indexes, namely capacity, responsibility, and potential, to evaluate the fairness of carbon emission rights distribution in China’s eastern coastal areas [18]. Feng et al. proposed a novel bi-level allocation scheme based on clustering analysis and a weighted voting model, which endowed different weights to four impact factors of emission reduction pressure, capacity, responsibility, and potential [19]. The game theory method fully takes into account the needs and contributions of each stakeholder. The Shapley value method is the most representative one in game theory method, which fairly distributes the cooperation benefits by considering the contributions made by each agent. Zhang et al. used the Shapley value method to calculate the carbon emission rights of various regions in China under the regional cooperation scenario [20]. The actual application principle of game theory method is complicated, and its transparency and fairness are open to question. The DEA method sets multiple input/output parameters and diverse constraint conditions, and reflects various principles and standards of emission allocation through the construction of different constraint conditions. Zhang et al. employed the input-oriented Zero-Sum Gains Data Envelopment Analysis (ZSG-DEA) model to examine the efficiency of allocation solutions in 2020 [21]. The DEA method is essentially a linear programming method, and the overall efficiency of the system that focuses on the distribution process is optimal, so the principle of fairness is less considered. The improved equal-proportion distribution method bases on the fair perspective to reduce the total amount of pollutants, which according to the differences between regions, while ensuring the realization of the overall carbon emission reduction target, appropriate adjustments should be made based on the entire average reduction range, so that the emission reduction task undertaken by each region can be matched with its own conditions [22]. Wang Qi et al. used improved equal-proportion distribution method to allocate China’s 2020 carbon emission control targets from differences in carbon emission driving factors [23]. The integrated method refers to the comprehensive use of multiple methods for allocation. Zhao et al. proposed an integrated allocation method based on input-output and entropy method to allocate carbon emission rights to 41 industries or sectors in China [24]. The integrated method overcomes the limitations of a single method through the application of multiple methods or models. However, the distribution process is complicated, and there are certain uncertainties in each link.
These allocation methods are reasonable for the allocation of carbon emission reduction targets mainly from the perspectives of fairness, efficiency, or the integration of fairness and efficiency. Meanwhile, there are also some deficiencies. Based on the advantages and disadvantages of various research methods and the accessibility of city’s data, we selected the integrated method (i.e., the integrated of Multi-index method and improved equal-proportion method) as the allocation method of city carbon intensity reduction targets in this study. On the one hand, this method takes into account the multiple influencing factors and regional differences, conforms to the fairness criterion, and is likely to be accepted by all parties. On the other hand, this method breaks through the limitation of data and is easily to be implemented.

2.3. Contribution of this Article

Allocation method based on the principle of single is not sufficient for fully reflect the characteristics of the differences among Chinese regions. Although some studies consider various regional differences, most of them adopt the comprehensive index method, which is subjective in the setting of index weight and lacks consideration of the correlation between index data, so it is difficult accurately reflect the difference in the importance of indicators in the distribution process. This study established the city’s carbon intensity reduction target allocation index system from the perspective of equity, takes into full account the differences in the social and economic development, energy use, technology, and other aspects of the city. The entropy method and the improved equal-proportion distribution method are used to allocate the reduction target of carbon intensity reduction of 2030, which reflects objective weighting and the improvement of fairness and difference. With a view to providing technical support for China’s scientific, fair, and reasonable city-level carbon intensity reduction target allocation plan.

3. Materials and Methods

3.1. Technical Route of the Research

We constructed a flowchart to reveal the technical route of the research intuitively and clearly (Figure 1).
We constructed the carbon intensity reduction target allocation index system based on four aspects: economic factors, population factors, energy factors, and technological factors. Then, to determine the index weights, we used the entropy method, and we use the improved equal-proportion distribution method to determine the CITRR of each city by combine the city’s base year carbon intensity data and the target year economic aggregate data.

3.2. Construction of a Carbon Intensity Reduction Target Allocation Index System

The driving factors of carbon intensity selected scientifically are the key to distinguish the difference of carbon intensity in cities. Most existing studies have reached a consensus that the driving factors that affect carbon intensity mainly include economic factors, population factors, energy factors, and technological factors (Table 2).

3.2.1. Economic Factors

Economic factors include economic development level and industrial structure. The influence of economic development level on carbon emission was the first focus of scholars. Since Gorsman (1991) proposed the inverted “U-shaped” relationship between environmental quality and per-capita income [25], the Environmental Kuznets Curve (EKC) hypothesis has become one of the important theoretical foundations to study the relationship between economic development and carbon emissions [26]. Ang et al. believe that the growth of per-capita GDP is the main reason for the increase of carbon intensity, and there is an inverted “U-shaped” relationship between per-capita GDP and carbon intensity [27]. Per-capita GDP is a comparable index that reflects the regional economic development level. Regional economies with large economic aggregates are not necessarily very developed. Therefore, per-capita GDP is selected in this study to reflect the level of economic development. Per-capita GDP is a positive index, as the relationship between China’s economic development and carbon emissions is still on the left side of the inverted “U-shaped” curve [28]. The industrial structure makes changes in energy efficiency, which leads to positive or negative changes in carbon dioxide emissions [29]. China’s secondary industries include most of the energy-intensive industries, such as iron/non-metal smelting and rolling, and chemical fiber industries. These sectors use a lot of energy per unit of GDP and emit more carbon. Therefore, the increase of the proportion of the secondary industry will significantly stimulate the growth of carbon intensity [30]. Like the studies of Wang et al. [31] and Li et al. [32], this study uses the proportion of the secondary industry in GDP to represent the impact of industrial structure change on carbon intensity.

3.2.2. Population Factors

Population factors include population size and population structure. Studies have shown a variable relationship between population size and carbon intensity. Zhao et al. believe that as China’s population increasingly migrates to urban areas, which have greater access to modern energy technologies, so there is a positive relationship between population density and carbon intensity [33]. Hao et al. suggested that a higher population density may lead to higher carbon intensity due to increased industrialization [34]. Demand is the source power of supply, which is the perspective of economic principles, so population size may affect carbon dioxide emissions by influencing demand scale and then production scale. Therefore, population size is taken as a positive indicator in this study, which is expressed by total population. There is a variable relationship between urbanization and carbon intensity. Dong et al. employed static spatial econometrics and panel co-integration models to investigate the relationship between regional carbon intensity and the level of urbanization in China, and the results showed that urbanization and carbon intensity have a positive relationship [35]. Wang et al. empirically studied key factors influencing carbon intensity at both national and eight economic regional levels, and the results showed that there was a positive effect of urbanization on carbon intensity, non-significant relationships existed between level of urbanization and carbon intensity in regional models (except in the Northwest) [31]. Huang et al. used the dynamic spatial model to analyze the driving forces of China’s provincial carbon intensity over the period 2000–2014, and the results showed that China’s current urbanization exert a negative effect on the decline in carbon intensity. Although there are different research conclusions on the impact of urbanization on carbon intensity, in general, urbanization allows for economies of scale in production, population, and capital factors assemble and facilitate innovation and diffusion of energy technology. This situation results in economies of scale and opportunities for improving energy efficiency and reducing CO2 emissions [30]. Therefore, this paper takes urbanization as a negative indicator and selects the proportion of non-agricultural population in the total population as an alternative variable of urbanization.

3.2.3. Energy Factors

Energy factor is a crucial driving force influencing carbon intensity change [36]. As a carrier of energy, electricity plays a fundamental role in modern society and is the backbone of global manufacturing. Since the early 1970s, primary energy consumption has doubled while electricity consumption has increased nearly fourfold [37]. China’s power generation is principally characterized by thermal power, which is highly dependent on coal and fossil fuel [38]. China has implemented a top-down energy statistics system. The government only publishes annually national and provincial energy statistics. Only some cities released their statistics, which resulted in missing data city-level energy statistics. Responding to the above deficiency, this study uses the power consumption of ten thousand yuan of GDP to reflect the influence of energy factors on carbon intensity, and it is a positive index.

3.2.4. Technological Factors

The hypothesis that R&D investment will influence technological change is supported by the literature on “new growth theory” or “induced technological change” [39,40,41]. Economic growth brought about by technological change may lead to an increase in total energy consumption, resulting in an increase in carbon intensity [42]. China’s current industrialization and special energy structure have a negative impact on the decline in carbon intensity [30]. Therefore, the impact of technological change on China’s current carbon intensity is a positive index. This study selects the proportion of scientific financial expenditure in the local financial general budget expenditure to reflect the technological factors.

3.3. Construction of Total Allocation Method

3.3.1. Entropy Method

We need to determine the weight of each index in the allocation to conduct multi-index accounting. There are many methods to determine the index weight, such as Delphi method, analytic hierarchy process, entropy method, etc. The basic idea of the entropy method shows that the importance of an index depends on the dispersion of the value on the same index. Entropy method determines the weight of indexes according to the information entropy, which can reflect the utility value of the entropy value of indexes, and the weight value of indexes obtained is more reliable and reasonable. In a comprehensive way, entropy method is adopted in this study to calculate the indicator weight. The specific calculation method is as follows:
Standardize the original data due to the different dimensions and units of the various indexes; positive and negative indicators should apply to the corresponding calculation methods as Equations (1) and (2).
X ¯ i j = X i j m i n X i j m a x X i j m i n X i j ,
X ¯ i j = m a x X i j X i j m a x X i j m i n X i j .
In Equations (1) and (2), X ¯ i j is the result of dimensionless treatment; X i j is the jth index of city i; m a x X i j is the maximum original value of jth index; m i n X i j is the minimum original value of jth index.
After data standardization, X ¯ i j   (i = 1, 2, 3…, n. j = 1, 2, 3…, m).
The indicator probability P i j is calculated as Equation (3):
P i j = X i j i = 1 n X i j .
The greater the difference of the index value, the more useful information that the decision maker can obtain from it, and the smaller the entropy value, which is the information entropy value of the jth index. The calculation formula is as Equation (4):
e j = i   =   1 n P i j ln P i j ln n .
Calculate the difference coefficient of the jth index, as Equation (5).
Calculate the entropy weight of jth index, as Equation (6).
d j = 1 e j ,
W j = d i j   =   1 m d j .

3.3.2. Improved Equal-Proportion Distribution Method

It is assumed that the number of cities participating in the carbon intensity reduction target allocation is n, and the overall CITRR compared to the base period emissions is C. To ensure the realization of the overall CITRR, it is necessary to determine the CITRR of each city.
The concept of “average reduction” and “relative reduction” is considered in the improved equal-Proportion method, and two variables, average reduction rate and relative reduction factor, are introduced. The average reduction rate reflects the criteria of equal proportion distribution, while the relative reduction factor is an appropriate adjustment based on the fairness criterion system. The CITRR of each city is the product of average reduction rate and relative reduction factor. The relationship among the three is calculated as Equation (7):
x i = x ¯ × α i ,
where x i is the CITRR assigned to the i city; x   ¯ is the average carbon intensity reduction rate for n participating cities; i is the relative reduction factor of the carbon intensity reduction target for the i city.
The relative reduction factor i should be determined according to the carbon intensity reduction target allocation index system, which reflects the difference of emission reduction responsibilities among cities on the basis of equal proportion. The relative reduction factors of each region are determined according to the value size and weight of each index of the carbon intensity reduction target allocation index system established in Section 3.2, which is calculated as Equation (8):
α i = j   =   1 m Z i j × W j 1 n i   =   1 n j   =   1 m Z i j × W j ,
where j represents the jth index (assuming that there is a total of m indexes in the carbon intensity reduction target allocation index system); Z i j represents the normalized value of the jth index in the i city; W i is the weight of the jth index.
The average reduction rate of each city reflects the idea of equal allocation, which is calculated as Equation (9), from the target reduction rate C required by the whole country and the relative reduction factor of each city:
x ¯ = C i   =   1 n G i I i i   =   1 n G i I i α i ,
where I i is the carbon intensity of i city in the base year, and G i is the gross product of i city in the target year.
Then the CITRR of i city is shown in Equation (10):
x i = C i   =   1 n G i I i i = 1 n ( j   =   1 m Z i j × W j 1 n i   =   1 n j   =   1 m Z i j × W j × G i I i ) × j   =   1 m Z i j × W j 1 n i   =   1 n j   =   1 m Z i j × W j

3.4. Data Source and Processing

According to the index system constructed in Section 3.2, Combined with China’s carbon intensity reduction target set out in the Paris Agreement, i.e., carbon intensity in 2030 will be reduced by 60–65% compared with 2005 (this study selected 60% decline). Using 2005 as the base year, the 2030 carbon intensity reduction targets for 285 Chinese cities were allocated (The “China city CO2 emissions Dataset (2005) [43]” records 287 cities. The data of administrative divisions in 2019 is adopted in this study. Due to the issue of administrative consolidation, there are 285 cities in 2019 that are consistent with the “China city CO2 emissions Dataset (2005)”; in other words, this study takes 285 cities as the research object. Although the sample size of this study is not all cities in China, the economic aggregate of these 285 cities in 2005 accounted for 91.39% of the total economy of China, which can be representative of the national sample size.).
The carbon intensity of 285 cities in this study in 2005 is derived from the “China city CO2 emissions Dataset (2005)” [43], and other socio-economic data are from statistical yearbooks of all provinces and regions (2006) and statistical Yearbooks of all cities (2006).
During the “13th Five-Year Plan” period, the average annual economic growth remained above 6.5% [44]. Under the transition mode of economic development to the “new normal”, from 2021 to 2025, the economic growth rate is expected to slow to 5.9%, and gradually decline to the level of about 5% in 2026–2030 [45,46]. The regional GDP of each city in 2030 is predicted with this economic growth rate.

4. Results

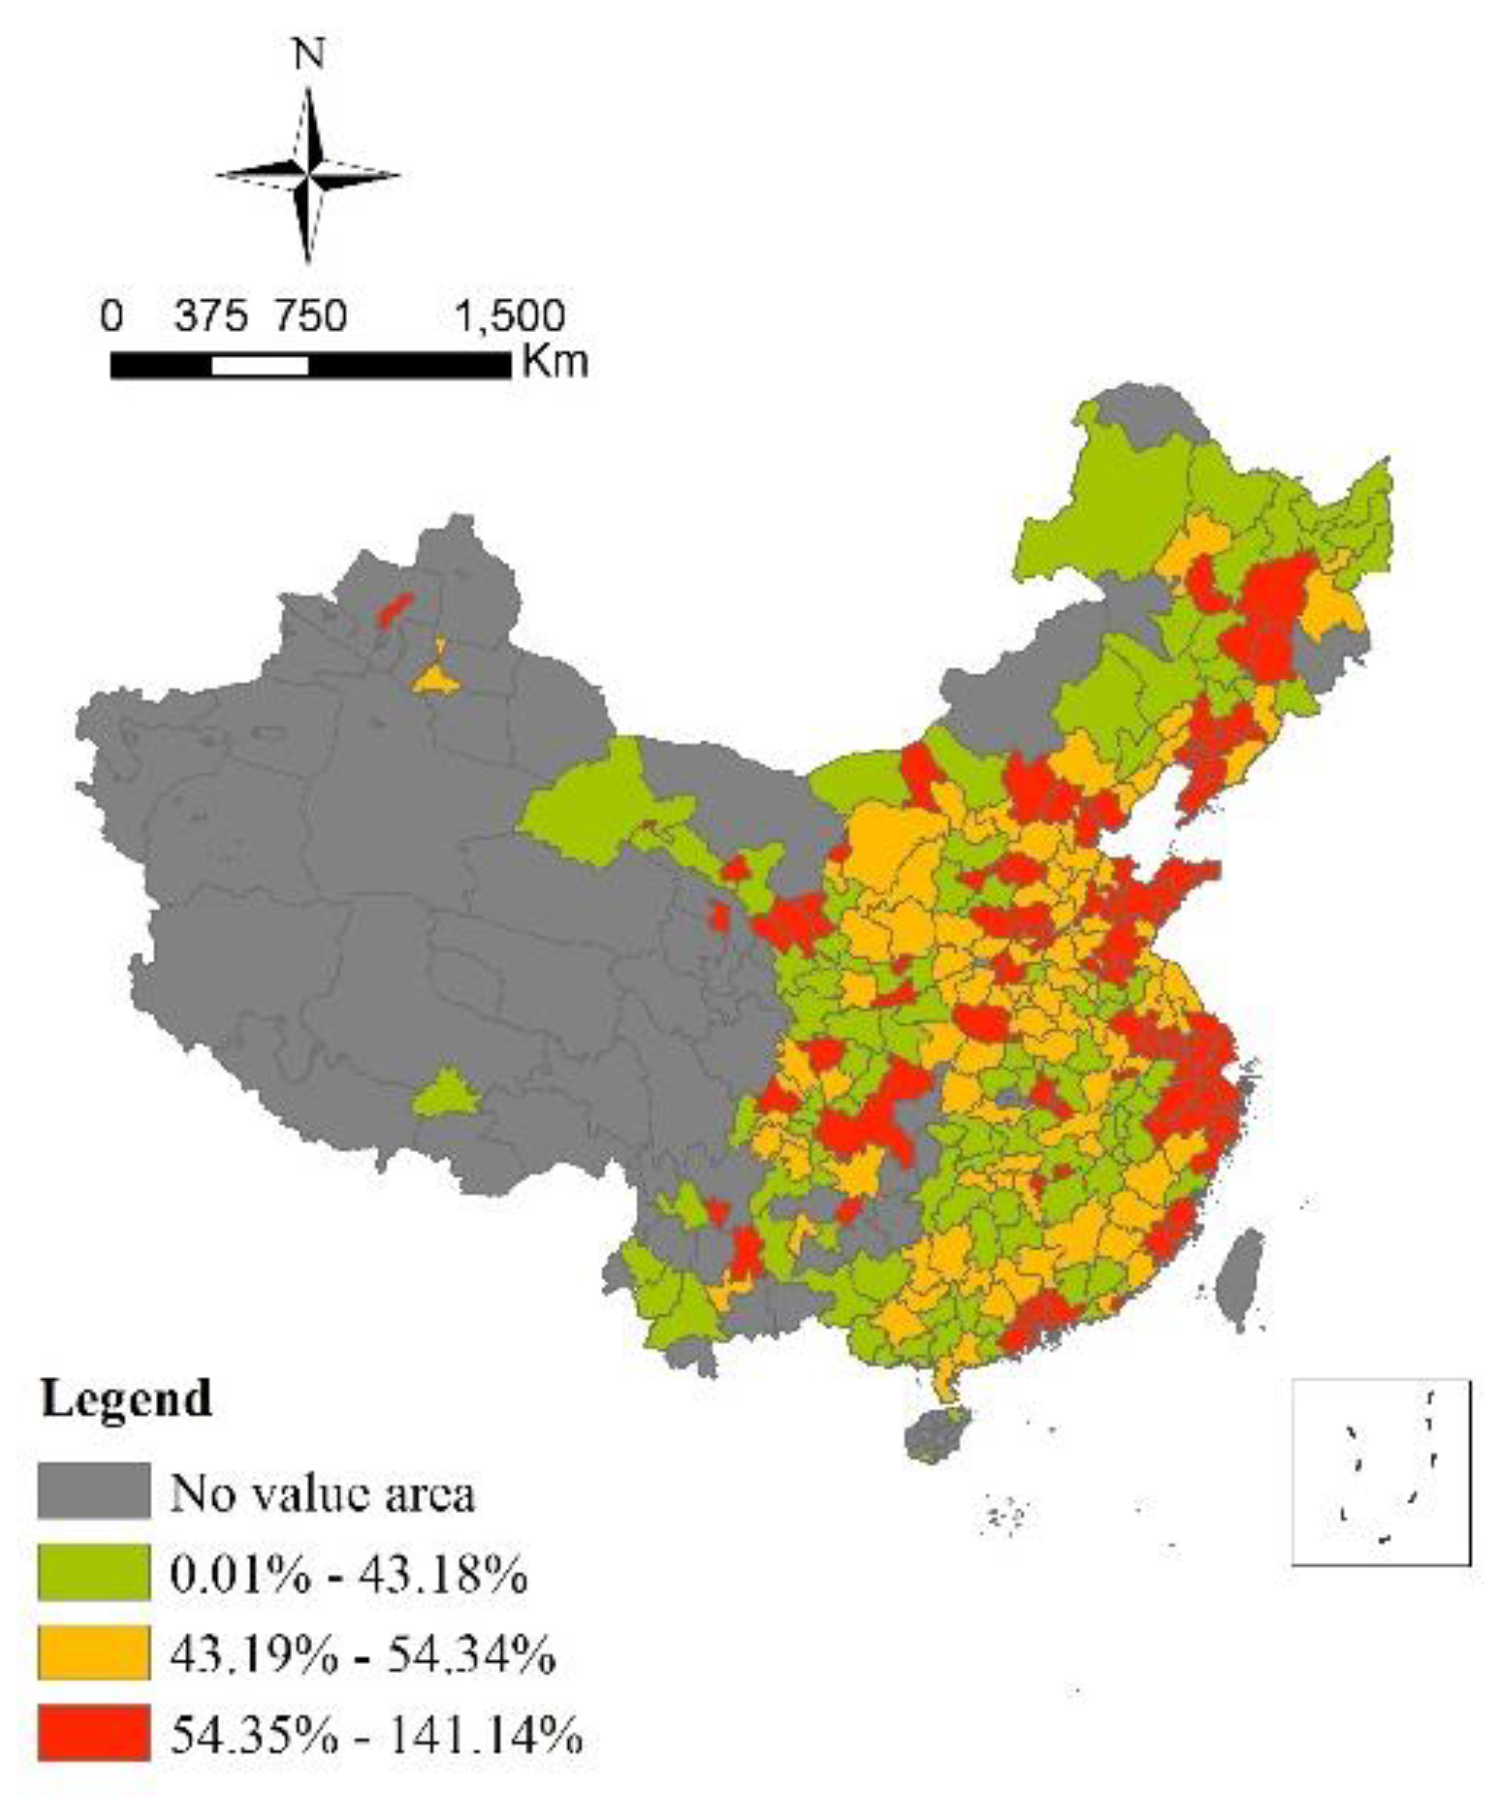
4.1. CITRR in Each City

Based on the entropy method, the weight of each index was obtained (Table 3). With a target of lower the carbon intensity of GDP by 60–65% below 2005, the national average reduction rate is 51.52%. After adjusting the relative reduction factor of the influence factors of carbon dioxide emissions, the CITRR assigned to each city has obvious differences, and the CITRR is between 17.65% and 141.14%. Dongying city in Shandong province has the highest carbon intensity reduction rate of 141.14%, which is mainly related to its economic development level and industrial structure. Dongying city is the rising place of Shengli Oil field, the second largest oil industry base in China, and an important node of Bohai Rim Economic zone. Data show that, in 2005, Dongying city’s per-capita GDP reached 61,000 yuan, ranking second in China, and the proportion of secondary industry reached 82.28%, ranking third in China. The CITRR of Heihe city in Heilongjiang province is only 17.65%, which means that Heihe city’s economic development level is relatively low. According to the data, in 2005 Heihe city’s per-capita GDP was RMB 0.72 million, and the secondary industry accounted for 15.70%.

4.2. Spatial Correlation Analysis of CITRR of Each City

In ArcGIS 10.6, the regional border (CONTIGUITY_EDGES_CORNERS) is used as the rule to calculate the spatial autocorrelation of the CITRR of each city to obtain the global Moran’s I index value. The analysis results show that the p value is 0.00, which passes the significance test at 1% level, and the Moran’s index is 0.38, indicating that the target reduction rate of China’s urban carbon intensity presents significant spatial positive autocorrelation.
Although Moran’s I index can judge the spatial correlation of the CITRR of Chinese’s cities from a global perspective, it cannot identify the spatial aggregation patterns. In order to show the CITRR of each city more intuitively, quantile method is used to divide the cities’ CITRR into three levels in ArcGIS 10.6, in which 0.01–43.18% is the low-grade CITRR, 43.19–54.34% is the medium-grade CITRR, and 54.35–141.14% is the high-grade CITRR (Figure 2).
As we can see from Figure 2, cities with the high-grade CITRR are mainly concentrated in coastal areas. High-grade CITRR cities in inland area do not have obvious aggregation. Cities with the medium-grade CITRR is clustered in the northern region and banded in the southern region. Cities with the low-grade CITRR in inland areas show clustering.

4.3. The Relationship between Carbon Intensity and CITRR

In ArcGIS 10.6, the carbon intensity of each city is divided into three levels by quantile method, among which 0.01–2.46 t/10,000 yuan is a low-grade carbon intensity city, 2.47–5.13 t/10,000 yuan is a medium-grade carbon intensity city, and 5.14–27.36 t/10,000 yuan is a high-grade carbon intensity city (Figure 3). Comparing Figure 2 and Figure 3, it is found that the CITRR of the southeast coastal areas is at a high-grade while the carbon intensity is at a low-grade. The CITRR in North China is at a low-grade or medium-grade and the carbon intensity is at a high-grade. The southeast coastal area is the pioneer area of China’s reform, opening up, and modernization. In the process of rapid economic development lasting for more than ten or twenty years, the industrial structure of this region has been further optimized and the economic strength has been rapidly improved, and a pattern of urban-rural integration and urban sprawl has been basically formed. Therefore, the southeast coastal area has a low-grade carbon intensity, and its emission reduction capacity is more prominent due to its higher economic development and scientific and technological capacity than other regions, so the CITRR is higher than that of other regions. North China is not only the center of China’s political and cultural exchanges but also the main concentration area of China’s coal industry. It is a resource-rich region with rapid economic development. In terms of economy, enterprises that have long relied on resource consumption to increase output value have become the dominant economy in North China and, therefore, have a high-grade carbon intensity. The lack of high-tech industries to drive the economy may be the reason why the CITRR in North China is at a medium-low level.

5. Discussion

5.1. Non-Proportional Allocation

Eight cities CITRR (Shanghai (106.3%), Beijing (107.42%), Shizuishan (113.06%), Xining (115.40%), Karamay (115.93%), Jiayuguan (116.33%), Wuhai (124.26%), and Dongying (141.14%) have exceed 100%. CITRR exceeding 100% does not mean that the carbon intensity of these cities will fall to zero or even negative by 2030 but indicates that these cities have strong emission reduction capacity and responsibility. Reasons for this situation are there are a large number of cities participate in carbon intensity target reduction allocation and the differences in socio-economic, energy, and technological conditions between cities, which makes the relative reduction factors of each city present a huge span. This can also confirm the importance of non-proportional allocation of carbon intensity reduction targets.

5.2. CITRR and Economic Development

This study found that the CITRR of Chinese’s cities show a basic trend of gradual decline from south to north and from the coast to the inland (Figure 2), which is the same as the overall trend of economic development [47], which is similar to previous studies, that is, the more developed prefecture-level cities are, the greater the possibility to reduce carbon intensity [31]. The continuous decline in China’s carbon intensity is benefit from the continuous optimization of the industrial structure. Affected by the Coronavirus Disease 2019 (COVID-19) pandemic, a large number of economic activities slowed down in the first quarter of 2020 and the tertiary industry most directly affected. In addition, the expansion of investment measures implemented to eliminate the impact of the epidemic has a stronger pulling effect on the secondary industry than the tertiary industry. Therefore, the added value proportion of the tertiary industry is likely to decline in 2020, which implies that, in the short term, in response to the COVID-19 epidemic, expanding investment will slow down China’s carbon intensity [48]. During the COVID-19 era, CO2 emissions have been greatly reduced [49]. But, the COVID-19 pandemic would not provide countries with a strong reason to delay climate change mitigation efforts [50]. Therefore, cities should make full use of resource endowments, location advantages, and existing industrial foundations, focus on project construction according to local conditions, and effectively transform economic development methods to avoid the increase in carbon intensity due to economic stimulus policies.

5.3. Spatial Correlation

When formulating carbon emission reduction policies, the spatial effect of carbon emission in each region should be fully considered. In addition to considering the carbon emissions of the region itself, the carbon emissions of neighboring regions should also be considered comprehensively, and the active cooperation between regions should be strengthened [51]. This study showed that the CITRR of Chinese’s cities presents obvious spatial clustering. If the spatial clustering characteristics can be effectively utilized through corresponding policies, and economically developed regions can play a demonstrative and leading role in urban carbon emission reduction, it is bound to have a multiplier effect in reducing carbon emissions in China. Carbon emission quota allocation is considered as a basic and key step to establish an effective national carbon emission trading (CET) market in China [18]. Therefore, this study can provide basic information for promoting the establishment of China’s CET market and medium-term and long-term regional coordinated emission reduction mechanism.

5.4. Method Deficiencies

The most important principle for the regional decomposition of carbon emission reduction targets is equity [52]. Based on the differences between cities, this study makes appropriate adjustments based on the overall average reduction range, so that the emission reduction tasks undertaken by each city can be matched with its own conditions. The shortcoming of this method is that it fails to take into account the influence of policy factors. Although China’s social and economic development has undergone tremendous changes from 2005 to 2030, the overall economic development trend presents a basic trend of gradual decline from south to north and from coastal to inland. It can be seen that the research results in this study are consistent with economic development, which can still provide the scientific basis for decision-makers to decompose and implement China’s “2030 Carbon intensity reduction target” between cities.

6. Conclusions

This study selects 2005 as the base year and 2030 as the target year to allocate the Chinese’s carbon intensity reduction targets promised on the Paris Agreement on a city level. The multi-index method takes into account the multiple factors of carbon emission rights allocation, and the improved equal-proportion distribution method takes the objective difference of each region into consideration. The main conclusions are as follows:
  • The range of changes in the CITRR is relatively large across the nation. The southeast coast is an area with developed economy and technological capabilities and a high-level CITRR. North China is a resource-rich economy that develops rapidly and has a high-level carbon intensity and a low-level CITRR. Cities should choose differentiated low-carbon development paths combining their resource endowments, industrial structure, economic foundation, and other aspects of heterogeneous characteristics.
  • The CITRR of city presents significant spatial positive correlation. When formulating carbon emission reduction policies, the spatial effects of carbon emissions in each city should be fully considered. In addition to considering the city’s own carbon emission reduction, the carbon emission reduction situation of neighboring cities should be comprehensively considered, for mobilizing the demonstration and leadership of economically developed regions in emission reduction are conducive to the steady advancement of carbon emission reduction.
  • In summary, the allocation method considers fairness and efficiency, reflects the difference between cities, and the allocation result is more easily accepted by all parties. Meanwhile, this method breaks the limitation of data and is likely to be implemented in practical operation, providing a new way for the allocation of carbon emission reduction targets.

Author Contributions

F.Y. and L.S. conceived and designed the methodologies; F.Y. collected and analyzed the data; L.G. and F.Y. wrote the paper; L.G. and F.Y. revised the paper; L.S. and L.G. Acquired Funding. All authors have read and agreed to the published version of the manuscript.

Funding

This work was supported by the National Key Research and Development Program of China (2018YFC0704703).

Acknowledgments

This research visualizes the carbon intensity data in the “China city CO2 emissions Dataset (2005)” in order to display the research results. We would like to sincerely thank the China City Greenhouse Gas Working Group. This work was supported the National Key Research and Development Program of China (2018YFC0704703).

Conflicts of Interest

The authors declare no conflict of interest.

References

  1. Noah, S.D. Changes in ecologically critical terrestrial climate conditions. Science 2013, 341, 486–492. [Google Scholar]
  2. Rogelj, J.; Elzen, M.D.; Höhne, N.; Fransen, T.; Fekete, N.H.H.; Winkler, H.; Schaeffer, R.; Sha, F.; Riahi, J.R.K.; Meinshausen, M. Paris Agreement climate proposals need a boost to keep warming well below 2 °C. Nat. Cell Biol. 2016, 534, 631–639. [Google Scholar] [CrossRef] [PubMed] [Green Version]
  3. Global Carbon Atlas. CO2 Emissions Data. Available online: http://www.globalcarbonatlas.org/en/CO2-emissions (accessed on 4 October 2020).
  4. Gallagher, K.S.; Zhang, F.; Orvis, R.; Rissman, J.; Liu, Q. Assessing the Policy gaps for achieving China’s climate targets in the Paris Agreement. Nat. Commun. 2019, 10, 1–10. [Google Scholar] [CrossRef] [PubMed] [Green Version]
  5. Elzen, M.D.; Fekete, H.; Höhne, N.; Admiraal, A.; Forsell, N.; Hof, A.F.; Olivier, J.G.; Roelfsema, M.; Van Soest, H. Greenhouse gas emissions from current and enhanced policies of China until 2030: Can emissions peak before 2030? Energy Policy 2016, 89, 224–236. [Google Scholar] [CrossRef] [Green Version]
  6. Liu, C.; Cai, B.; Chen, C.; Wang, H.; Li, Z.; Beijing Municipal Research Institute of Environmental Protection; Center for Climate and Environmental Policy, Chinese Academy for Environmental Planning. Review of Carbon Mitigation Targets Allocation in China. Sci. Geogr. Sin. 2013, 33, 9. (In Chinese) [Google Scholar]
  7. Kong, Y.; Zhao, T.; Yuan, R.; Chen, C. Allocation of carbon emission quotas in Chinese provinces based on equality and efficiency principles. J. Clean. Prod. 2019, 211, 222–232. [Google Scholar] [CrossRef]
  8. Liang, S.; Zhao, J.; He, S.; Xu, Q.; Ma, X. Spatial econometric analysis of carbon emission intensity in Chinese provinces from the perspective of innovation-driven. Environ. Sci. Pollut. Res. 2019, 26, 13878–13895. [Google Scholar] [CrossRef]
  9. Gu, C.; Tan, Z.; Liu, W.; Yu, T.; Han, Q.; Liu, H.; Dai, Y.; Liu, Z.; Zheng, S. Study on Climate Change, Carbon Emissions and Low-carbon City Planning. Urban Plan. Forum 2009, 3, 38–45. (In Chinese) [Google Scholar]
  10. He, Y. Chinese Energy Carbon Dioxide Emissions Control Objectives and Geographical Distribution Statistics; Southwestern University of Finance and Economics: Chengdu, China, 2013. (In Chinese) [Google Scholar]
  11. Jotzo, F.; Pezzey, J.C.V. Optimal intensity targets for greenhouse gas emissions trading under uncertainty. Environ. Resour. Econ. 2007, 38, 259–284. [Google Scholar] [CrossRef]
  12. Zheng, B.; Zhang, Q.; Davis, S.J.; Ciais, P.; Hong, C.; Li, M.; Liu, F.; Tong, D.; Li, H.; He, K. Infrastructure Shapes Differences in the Carbon Intensities of Chinese Cities. Environ. Sci. Technol. 2018, 52, 6032–6041. [Google Scholar] [CrossRef]
  13. Shan, Y.; Guan, D.; Hubacek, K.; Zheng, B.; Davis, S.J.; Jia, L.; Liu, J.; Liu, Z.; Fromer, N.; Mi, Z.; et al. City-level climate change mitigation in China. Sci. Adv. 2018, 4, eaaq0390. [Google Scholar] [CrossRef] [PubMed] [Green Version]
  14. Wang, S.; Liu, X. China’s city-level energy-related CO2 emissions: Spatiotemporal patterns and driving forces. Appl. Energy 2017, 200, 204–214. [Google Scholar] [CrossRef]
  15. Wang, S.; Huang, Y.; Zhou, Y. Spatial spillover effect and driving forces of carbon emission intensity at the city level in China. J. Geogr. Sci. 2019, 29, 231–252. [Google Scholar] [CrossRef] [Green Version]
  16. Li, S. Accounting for the Overall Carbon Emission Allowance and Its Cross-Administraive Regional Allocation: A Case of Zhejiang Province; Zhejiang University: Hangzhou, China, 2019. (In Chinese) [Google Scholar]
  17. Chang, K.; Chang, H. Cutting CO2 intensity targets of interprovincial emissions trading in China. Appl. Energy 2016, 163, 211–221. [Google Scholar] [CrossRef]
  18. Qin, Q.; Liu, Y.; Li, X.; Li, H. A multi-criteria decision analysis model for carbon emission quota allocation in China’s east coastal areas: Efficiency and equity. J. Clean. Prod. 2017, 168, 410–419. [Google Scholar] [CrossRef]
  19. Feng, Z.; Tang, W.; Niu, Z.; Wu, Q. Bi-level allocation of carbon emission permits based on clustering analysis and weighted voting: A case study in China. Appl. Energy 2018, 228, 1122–1135. [Google Scholar] [CrossRef]
  20. Zhang, Y.-J.; Wang, A.-D.; Da, Y.-B. Regional allocation of carbon emission quotas in China: Evidence from the Shapley value method. Energy Policy 2014, 74, 454–464. [Google Scholar] [CrossRef]
  21. Zhang, J.; Hao, J.-F. Carbon emission quota allocation among China’s industrial sectors based on the equity and efficiency principles. Ann. Oper. Res. 2016, 255, 117–140. [Google Scholar] [CrossRef]
  22. Liu, Q.; Wang, Q. Pollutant Reduction Alloction Based on Regional Differences—COD Reduction Allocation Between Provinces as a Case. Resour. Environ. Yangtze Basin 2012, 21, 512–517. (In Chinese) [Google Scholar]
  23. Wang, Q.; Zhao, X. Allocation of carbon dioxide emission reduction targets in China based on the improved equal proportion distribution. J. Arid Land Resour. Environ. 2019, 33, 1–8. (In Chinese) [Google Scholar]
  24. Zhao, R.; Min, N.; Geng, Y.; He, Y. Allocation of carbon emissions among industries/sectors: An emissions intensity reduction constrained approach. J. Clean. Prod. 2017, 142, 3083–3094. [Google Scholar] [CrossRef]
  25. Grossman, G.M.; Krueger, A.B. Environmental Impacts of a North American Free Trade Agreement; National Bureau of Economic Research: Cambridge, MA, USA, 1991. [Google Scholar]
  26. Magazzino, C.; Cerulli, G. The determinants of CO2 emissions in MENA countries: A responsiveness scores approach. Int. J. Sustain. Dev. World Ecol. 2019, 26, 522–534. [Google Scholar] [CrossRef]
  27. Ang, B.; Liu, N. A cross-country analysis of aggregate energy and carbon intensities. Energy Policy 2006, 34, 2398–2404. [Google Scholar] [CrossRef]
  28. Sustainable Development Strategy Study Group Chinese Academy of Sciences. China Sustainable Development Strategy Report 2009—China’s Approach towards a Low Carbon Future; Science Press: Beijing, China, 2009. (In Chinese) [Google Scholar]
  29. Chang, N. Changing industrial structure to reduce carbon dioxide emissions: A Chinese application. J. Clean. Prod. 2015, 103, 40–48. [Google Scholar] [CrossRef]
  30. Huang, J. Investigating the driving forces of China’s carbon intensity based on a dynamic spatial model. Environ. Sci. Pollut. Res. 2018, 25, 21833–21843. [Google Scholar] [CrossRef]
  31. Wang, Z.; Zhang, B.; Liu, T. Empirical analysis on the factors influencing national and regional carbon intensity in China. Renew. Sustain. Energy Rev. 2016, 55, 34–42. [Google Scholar] [CrossRef]
  32. Li, J.; Huang, X.; Yang, H.; Chuai, X.; Wu, C. Convergence of carbon intensity in the Yangtze River Delta, China. Habitat Int. 2017, 60, 58–68. [Google Scholar] [CrossRef]
  33. Zhao, X.; Burnett, J.W.; Fletcher, J.J. Spatial analysis of China province-level CO2 emission intensity. Renew. Sustain. Energy Rev. 2014, 33, 1–10. [Google Scholar] [CrossRef] [Green Version]
  34. Hao, Y.; Liao, H.; Wei, Y.-M. Is China’s carbon reduction target allocation reasonable? An analysis based on carbon intensity convergence. Appl. Energy 2015, 142, 229–239. [Google Scholar] [CrossRef]
  35. Dong, F.; Long, R.; Li, Z.; Dai, Y. Analysis of carbon emission intensity, urbanization and energy mix: Evidence from China. Nat. Hazards 2016, 82, 1375–1391. [Google Scholar] [CrossRef]
  36. Zhu, B.; Ye, S.; Jiang, M.; Wang, P.; Wu, Z.; Xie, R.; Chevallier, J.; Wei, Y.-M. Achieving the carbon intensity target of China: A least squares support vector machine with mixture kernel function approach. Appl. Energy 2019, 233, 196–207. [Google Scholar] [CrossRef]
  37. Soimakallio, S.; Saikku, L. CO2 emissions attributed to annual average electricity consumption in OECD (the Organisation for Economic Co-operation and Development) countries. Energy 2012, 38, 13–20. [Google Scholar] [CrossRef]
  38. Zhang, H. Effects of electricity consumption on carbon intensity across Chinese manufacturing sectors. Environ. Sci. Pollut. Res. 2019, 26, 27414–27434. [Google Scholar] [CrossRef] [PubMed]
  39. Jaffe, A.B.; Newell, R.G.; Stavins, R.N. A tale of two market failures: Technology and environmental policy. Ecol. Econ. 2005, 54, 164–174. [Google Scholar] [CrossRef] [Green Version]
  40. Vollebergh, H.R.; Kemfert, C. The role of technological change for a sustainable development. Ecol. Econ. 2005, 54, 133–147. [Google Scholar] [CrossRef]
  41. Apergis, N.; Eleftheriou, S.; Payne, J.E. The relationship between international financial reporting standards, carbon emissions, and R&D expenditures: Evidence from European manufacturing firms. Ecol. Econ. 2013, 88, 57–66. [Google Scholar] [CrossRef]
  42. Berkhout, P.H.; Muskens, J.C.; Velthuijsen, J.W. Defining the rebound effect. Energy Policy 2000, 28, 425–432. [Google Scholar] [CrossRef]
  43. China City Greenhouse Gas Working Group. China City CO2 Emissions Dataset (2005); China Environment Publishing Group: Beijing, China, 2020. (In Chinese) [Google Scholar]
  44. Poo, M.-M. Scientific leap-forward in the critical period: The thirteenth Five-Year Plan of the Chinese Academy of Sciences (CAS). Natl. Sci. Rev. 2016, 3, 393. [Google Scholar] [CrossRef] [Green Version]
  45. The World Bank; Development Research Center of the State Council PRC. China 2030: Building a Modern, Harmonious, and Creative Society; World Bank Publications: Beijing, China, 2013. [Google Scholar]
  46. Qian, Y.; Sun, L.; Qiu, Q.; Tang, L.; Shang, X.; Lu, C. Analysis of CO2 Drivers and Emissions Forecast in a Typical Industry-Oriented County: Changxing County, China. Energies 2020, 13, 1212. [Google Scholar] [CrossRef] [Green Version]
  47. Pan, W.; Zhang, R.; Pan, Y. CO2 emissions in coastal and inland regions in China:Perspectives based on the final products. J. Tsinghua Univ. Sci. Technol. 2016, 56, 417–423. (In Chinese) [Google Scholar]
  48. Wang, K.; Lu, M.; Wang, Q. The impact of the COVID-19 epidemic on China’s CO2 emissions. J. Beijing Inst. Technol. Soc. Sci. Ed. 2020, 4, 11–16. (In Chinese) [Google Scholar]
  49. Le Quéré, C.; Jackson, R.B.; Jones, M.W.; Smith, A.J.P.; Abernethy, S.; Andrew, R.; De-Gol, A.J.; Willis, D.R.; Shan, Y.; Canadell, J.G.; et al. Temporary reduction in daily global CO2 emissions during the COVID-19 forced confinement. Nat. Clim. Chang. 2020, 10, 647–653. [Google Scholar] [CrossRef]
  50. Smith, L.V.; Tarui, N.; Yamagata, T. Assessing the Impact of COVID-19 on Global Fossil Fuel Consumption and CO2 Emissions. SSRN Electron. J. 2020. [Google Scholar] [CrossRef]
  51. Xu, J.; Xu, Y. Analysis of Chinese Regional Carbon Emissions Based on Spatial Panel Data. Ecol. Econ. 2015, 31, 32–36. (In Chinese) [Google Scholar]
  52. Hou, L.; Tang, L.; Qian, Y.; Chen, H.; Wang, L. Study of county-level low-carbon standards in China based on carbon emissions per capita. Int. J. Sustain. Dev. World Ecol. 2019, 26, 698–707. [Google Scholar] [CrossRef]
Figure 1. Technical route of the research.
Energies 13 06006 g001
Figure 2. CITRR distribution of Chinese cities.
Energies 13 06006 g002
Figure 3. Carbon intensity distribution of Chinese cities.
Energies 13 06006 g003
Table 1. Allocation methods of carbon emission reduction targets.
MethodPrincipleAdvantageDisadvantage
Index MethodSingle index methodSelect a certain index for quantitative allocation.Much easier to understand and operate, the results are intuitive.It is one-sided and only reflect one factor of carbon emission right, which easily to produce extreme results.
Multi-index methodTwo or more indexes are selected for quantitative allocation.It is widely used and takes into account the multiple factors of carbon emission rights allocation.The index weight and its dynamic adjustment have direct influence on the final allocation result.
Game Theory The allocation weight is determined according to the contribution of each emission subject to the overall.Consider the contribution and demand differences of each subject.The operation is complex, transparency and feasibility is questionable.
DEA MethodEstimate the relative efficiency based on the input and output factors of different emission subjects.The allocation result can achieve the highest overall allocation efficiency.Excessive emphasis on the maximization of distributive efficiency, the results may lack fairness and rationality, which may to be questioned by people.
Improved Equal-Proportion Distribution Method Make adjustments based on differences between regions and the overall average reduction, so that the emission reduction tasks undertaken by each region match its own conditions.Considering the objective difference of each region, it is easy to implement in practice.It is impossible to measure the potential contribution of specific policy measures to achieving the carbon intensity target.
Integrated Multiple methods or models are used for allocation.gather the advantages of a variety of methods.The process is complex, the operation is difficult, each link may exist deviation, high uncertainty.
Table 2. Carbon intensity reduction target allocation index system.
Factors Affecting Carbon StrengthIndexIndex ConnotationIndex Attribute
Economic FactorsGDP Per-capitaReflect the level of economic development+
Proportion of secondary industryReflect industrial structure+
Population FactorsTotal populationReflect the total population+
Agricultural/
Non-agricultural population
Reflect demographic structure
Energy FactorsTen thousand yuan of gross output power consumptionReflect energy consumption+
Technological FactorsScientific financial expenditure/local financial general budget expenditureReflect investment in scientific research+
Note: “+” indicates that carbon intensity increases as the index value increases, and “−” indicates that carbon intensity decreases as the index value increases.
Table 3. Evaluation indexes weight.
IndexWeight
GDP per-capita0.253
Proportion of secondary industry0.047
Total population0.172
Agricultural/Non-agricultural population0.042
Ten thousand yuan of gross output power consumption0.285
Scientific financial expenditure/
local financial general budget expenditure
0.200
Publisher’s Note: MDPI stays neutral with regard to jurisdictional claims in published maps and institutional affiliations.

