Article

Thermo-Fluid Dynamics Analysis of Fire Smoke Dispersion and Control Strategy in Buildings

by
Ricardo S. Gomez
1,*,
Túlio R. N. Porto
2,
Hortência L. F. Magalhães
3,
Antonio C. Q. Santos
2,
Victor H. V. Viana
4,
Kelly C. Gomes
1,5 and
Antonio G. B. Lima
2
1
Postgraduate Program in Mechanical Engineering, Federal University of Paraiba, João Pessoa 58051-900, PB, Brazil
2
Department of Mechanical Engineering, Federal University of Campina Grande, Campina Grande 58429-900, PB, Brazil
3
Department of Chemical Engineering, Federal University of Campina Grande, Campina Grande 58429-900, PB, Brazil
4
Postgraduate Program in Security Engineering, University Center of Patos (UNIFIP), Campina Grande 58416-440, PB, Brazil
5
Department of Renewable Energy Engineering, Federal University of Paraiba, João Pessoa 58051-900, PB, Brazil
*
Author to whom correspondence should be addressed.
Energies 2020, 13(22), 6000; https://doi.org/10.3390/en13226000
Submission received: 15 October 2020 / Revised: 11 November 2020 / Accepted: 12 November 2020 / Published: 17 November 2020

Abstract

:
Smoke is the main threat of death in fires. For this reason, it becomes extremely important to understand the dispersion of this pollutant and to verify the influence of different control systems on its spread through buildings, in order to avoid or minimize its effects on living beings. Thus, this work aims to perform thermo-fluid dynamic study of smoke dispersion in a closed environment. All numerical analysis was performed using the Fire Dynamics Simulator (FDS) software. Different simulations were carried out to evaluate the influence of the exhaust system (natural or mechanical), the heat release rate (HRR), ventilation and the smoke curtain in the pollutant dispersion. Results of the smoke layer interface height, temperature profile, average exhaust volumetric flow rate, pressure and velocity distribution are presented and discussed. The results indicate that an increase in the natural exhaust area increases the smoke layer interface height, only for the well-ventilated compartment (open windows); an increase in the HRR accelerates the downward vertical displacement of the smoke layer and that the 3 m smoke curtain is efficient in exhausting smoke, only in the case of poorly ventilated compartments (i.e., with closed windows).

Graphical Abstract

1. Introduction

Fire is an irreversible process that involves the production of flame, heat, smoke and toxic gases, which can cause material losses, physical trauma, severe burns, respiratory and cardiovascular diseases, and death [1,2]. The main causes of fire are electrical failures, activities related to cooking, friction that occurs in machines and equipment, cutting and welding processes, improper handling of materials and equipment, leakage or release of flammable liquids and/or gases, human errors or unsafe human behavior, such as smoking in inappropriate places, and arson [1,3,4,5,6,7,8,9].
Researchers are unanimous in asserting that the main threat of death from fires is smoke [2,10,11,12,13,14,15,16,17]. According to Anseeuw et al. [14], 60% to 80% of deaths at the fire scene are attributed to smoke inhalation. This is because, during a fire, the burning of solid fuels causes a reduction in the oxygen concentration in the environment and an incomplete combustion of gases, generating highly toxic products such as CO and HCN, contributing to the occurrence of death by asphyxiation at the fire scene [10]. In addition to the problem of inhalation, smoke can cause fear, panic, tearing and irritation of the eyes, and reduced visibility, factors in turn make it difficult to safely exit the building.
Stefanidou et al. [2] presented the main toxic and irritating chemicals generated by the combustion of common building materials, as well as the main factors that contribute to the development of smoke inhalation injuries. In general, the smoke initially affects the upper airways (upper respiratory tract) of the fire victim and may, in a short time, becoming a complex life-threatening systemic disease, affecting all organs in the body [18].
In a fire, as the materials undergo combustion, they release hot smoke that, being lighter than ambient air, moves vertically upwards faster than horizontally, developing an inverted cone shape, well known as a plume. When the plume reaches the top of the building, with a certain speed, the smoke spreads radially across the ceiling, forming a layer of smoke (or hot gases). After the smoke covers the entire ceiling, it tends to move vertically downwards until the entire environment is filled with smoke or until mass flow rate entering the hot gas layer is balanced by the mass flow rate of exhaustion [12].
The smoke layer interface height, an extremely important parameter in the design of smoke exhaust systems, is defined as the distance, vertically, between the building floor and the smoke layer interface. Thus, it is of great importance, for people’s survival, that the smoke layer interface height is above the height of their heads, for a sufficient time, so that an efficient evacuation from the fire scene is possible, that is, that this procedure occurs with minimal toxic gases inhalation.
In Brazil, the subject of fire safety started to be widely discussed after the tragedy that occurred at a nightclub located in the city of Santa Maria-RS, in January 2013. At that time, where 242 people died and almost 700 were injured. Even so, until the present moment, there is no national standard in the country that defines the parameters to be adopted in smoke control design. In the absence of these standards, the Technical Instructions established by the Fire Department of the Military Police of the State of São Paulo, 2019, which have as reference several specifications contained in international regulations, such as the NFPA and DIN standards, provide minimum fire safety requirements and, in some cases, specifying design parameters and fire protection systems installation.
Given the above, scientific studies related to fires in closed compartments are crucial for the design of smoke control systems, allowing the development and improvement of engineering strategies and techniques aimed at protecting the lives of its occupants, the facilities and equipment.
The use of computational fluid dynamics (CFD) to solve problems related to confined fires has become quite popular due to advances in computational power and numerical methods [19]. This technique has provided a better understanding of the behavior of this phenomenon and has made it possible to reduce costs, time and risks, when compared to experimental analyzes, especially in hypothetical scenarios of fires that are difficult to be implemented through experiments [17]. However, it is important to emphasize that experimental tests play important role in the development and validation of mathematical models to be used as the CFD tools.
One of the main CFD software packages used to study the behavior of fires in buildings is the Fire Dynamics Simulator (FDS), developed and available at no cost from the National Institute for Standards and Technology (NIST, Gaithersburg, MD, USA). In order to reduce or even eliminate the uncertainties of the numerical results, several studies proposed to verify [20,21] and validate [12,16,17,22,23,24,25,26] the models used by the FDS software.
In addition to the FDS software, other CFD tools have already been used in the literature to study the behavior of fires in closed environments, such as CFX [27,28,29], FLUENT [30,31] and ISIS CODE [32,33,34].
Qin et al. [20] investigated the influence of different exhaust systems for a fire in a gymnasium with a capacity for 18,000 people, using the FDS software. The authors observed that an increase in the speed of the mechanical exhaust fan positioned on the ceiling, in the range between 2.0 and 3.0 m/s, does not necessarily promote a more efficient smoke exhaustion, thus, there is a critical speed that depends on the heat release rate (HRR) from the fire. Further, the downward vertical displacement of smoke layer for the mechanical exhaust fan at a speed of 3.0 m/s occurred more quickly as compared to the natural exhaust system located in the same position. For the cases in which the mechanical exhaust fans were installed on the walls, the smoke exhaust occurred much more efficiently as compared to the use of natural exhaust fans in the same position, and a critical speed was not obtained, that is, the higher the fan speed, the lower the downward vertical displacement of the smoke. In this last analysis, an increase in speed from 1.5 to 3.0 m/s of the mechanical exhaust fan provided a more efficient smoke exhaust.
Qin et al. [12] validated the FDS software by comparing numerical results with experimental data for a fire in an atrium with internal dimensions of 22.40 m × 11.90 m and 27.00 m height, and cases with low (560 kW) and high (4 MW) HRR. For both cases, it was observed that the natural smoke exhaust vents are more efficient when located on the roof of the atrium. On the other hand, when the exhaust vents are located on the walls of the atrium, higher positions are preferred. Subsequently, the authors evaluated the influence of the positioning of the burners, noting that the smoke layer descends more rapidly when the burner is located in the center of the atrium.
Xiao [24] compared numerical results using FDS with experimental data of temperature and mass flow rate in the doorway of a room with dimensions of 9.75 m × 4.88 m × 2.44 m (length × width × height). This compartment has only one opening and a 0.46 m2 propane burner with different heat release rates. From the obtained results, the author observed a reasonable agreement between the results of temperature and mass flow rate in the opening for the cases with and without sprinkler. A greater discrepancy was observed between the numerical and experimental results of temperature and mass flow rate in the opening, for the case with sprinkler, due to the stronger turbulence, uncertainties in the fire spread rate and in the water behavior (spray angles, number of drops per second, initial speed and average drop diameter).
Ayala et al. [26] showed good agreement between the numerical results obtained by the FDS software and the experimental data of 1.36 MW and 2.34 MW pool fires burning inside a 20 m cubic atrium with a natural ventilation system. In addition, the authors showed that the area-to-height-squared ratio of the atrium, in the range of 0.3 to 3.8, does not present significant effects on the temperature and smoke layer growth.
Abotaleb [16] performed a numerical analysis using the FDS software to evaluate the influence of smoke management techniques in a building with dimensions of 10.00 m × 10.00 m and 12.00 m in height. The author observed that using six mechanical make-up air on the walls and a mechanical exhaust fan on the roof with total volumetric flow rates equivalent to 36 and 40 air changes per hour (ACH), respectively, decreasing the downward vertical displacement of the smoke layer interface height and the average temperature by 71.18% and 31.6%, respectively.
Shih et al. [35] performed a numerical simulation using the FDS software, proving that make-up air has a significantly influences on the effectiveness of a natural smoke exhaust system in a tall space, with dimensions of 8.00 m × 1.00 m and 10.00 m height, under fire scenario. In the research, the authors used the Schlieren photography technique, that allows visualization of the post-combustion hot gas distribution in the model space, to validate the simulation results.
Yuen et al. [17] used the FDS software to numerically evaluate the efficiency of natural exhaust fans and a smoke curtain in an atrium. In this research, the values of temperature and smoke layer interface height were compared with experimental measures reported by Hägglund et al. [36], obtaining good agreement for both cases (with and without a smoke curtain). The authors observed that the smoke curtain is efficient to compartmentalize the smoke, as long as its height is sufficient to completely block the spread of smoke to the other side of the environment.
Huang et al. [37] performed a numerical analysis using the FDS to evaluate the relationship between the obscuration ratio, the main parameter of smoke detectors, and soot yield, which is defined as the mass of soot produced per mass of fuel reacted. The simulated compartment has dimensions 10.00 m × 7.00 m × 4.00 m (length × width × height) without openings to the outside and a with fire source in the center. After analyzing several fire scenarios, the authors observed that the smoke speed, in the vertical, was 0.54 m/s and, the higher the soot yield, the higher the obscuration rate. In addition, the results of the simulation indicate that, at a height of 3.00 m from the floor, the diameter of the smoke plume varied between 0.30 and 0.60 m during the first 300 s of firing.
Tan et al. [38] numerically investigated the influence of HRR and ambient pressure on the efficiency of the smoke extraction system in road tunnel fires using FDS software. In addition, the authors showed that there is a critical exhaust rate at which there is an excessive fresh air discharge from the exhaust vent, decreasing the efficiency of the system.
More recently, Wang et al. [39] performed several numerical simulations to investigate the influence of different smoke control systems on smoke flow, temperature and visibility in a subway station, assisting passenger evacuation and firefighting. As results, the authors presented the best scheme for air control and smoke exhaustion for different fire locations.
Despite the importance, no studies were found to evaluate, jointly, the influence of the type and dimensions of the exhaust system, HRR, natural ventilation (openings in the lower region of the compartment for air intake) and smoke curtain in the temperature distribution and smoke dispersion during a fire in an enclosed space.
Thus, complementing the cited works, the main purpose of this work is to evaluate the thermo-fluid dynamic behavior of smoke originated from a fire in an enclosed space using the FDS software. The studied cases were elaborated in order to verify the influence of the HRR, natural exhaust fans, mechanical exhaust fans, smoke curtain and ventilation (opening windows) in the lower compartment at the smoke layer interface height, in the temperature distribution in the simulated compartment and in the exhaust volumetric flow rate. In addition, the influence of the smoke curtain and opening windows on the pressure and smoke velocity vector fields inside the compartment under analysis are also evaluated.

2. Methodology

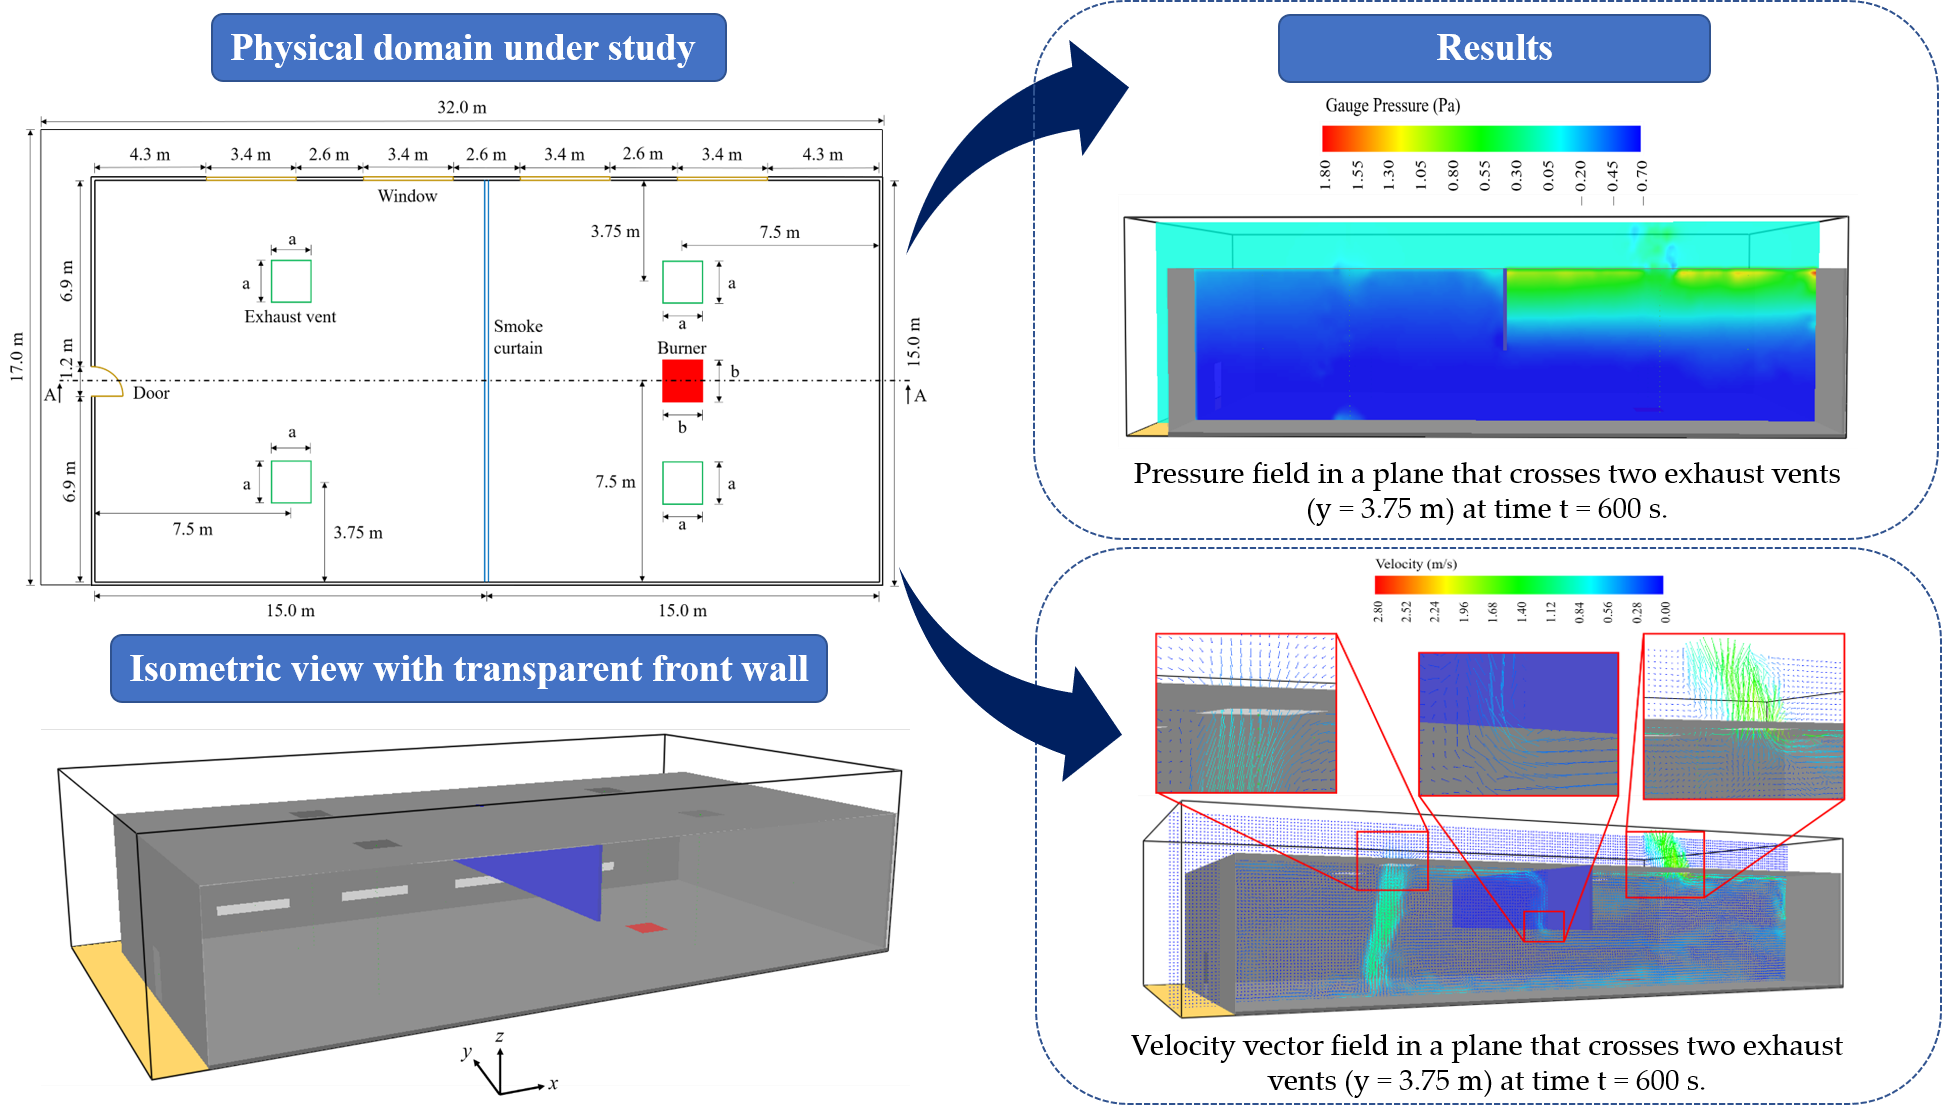
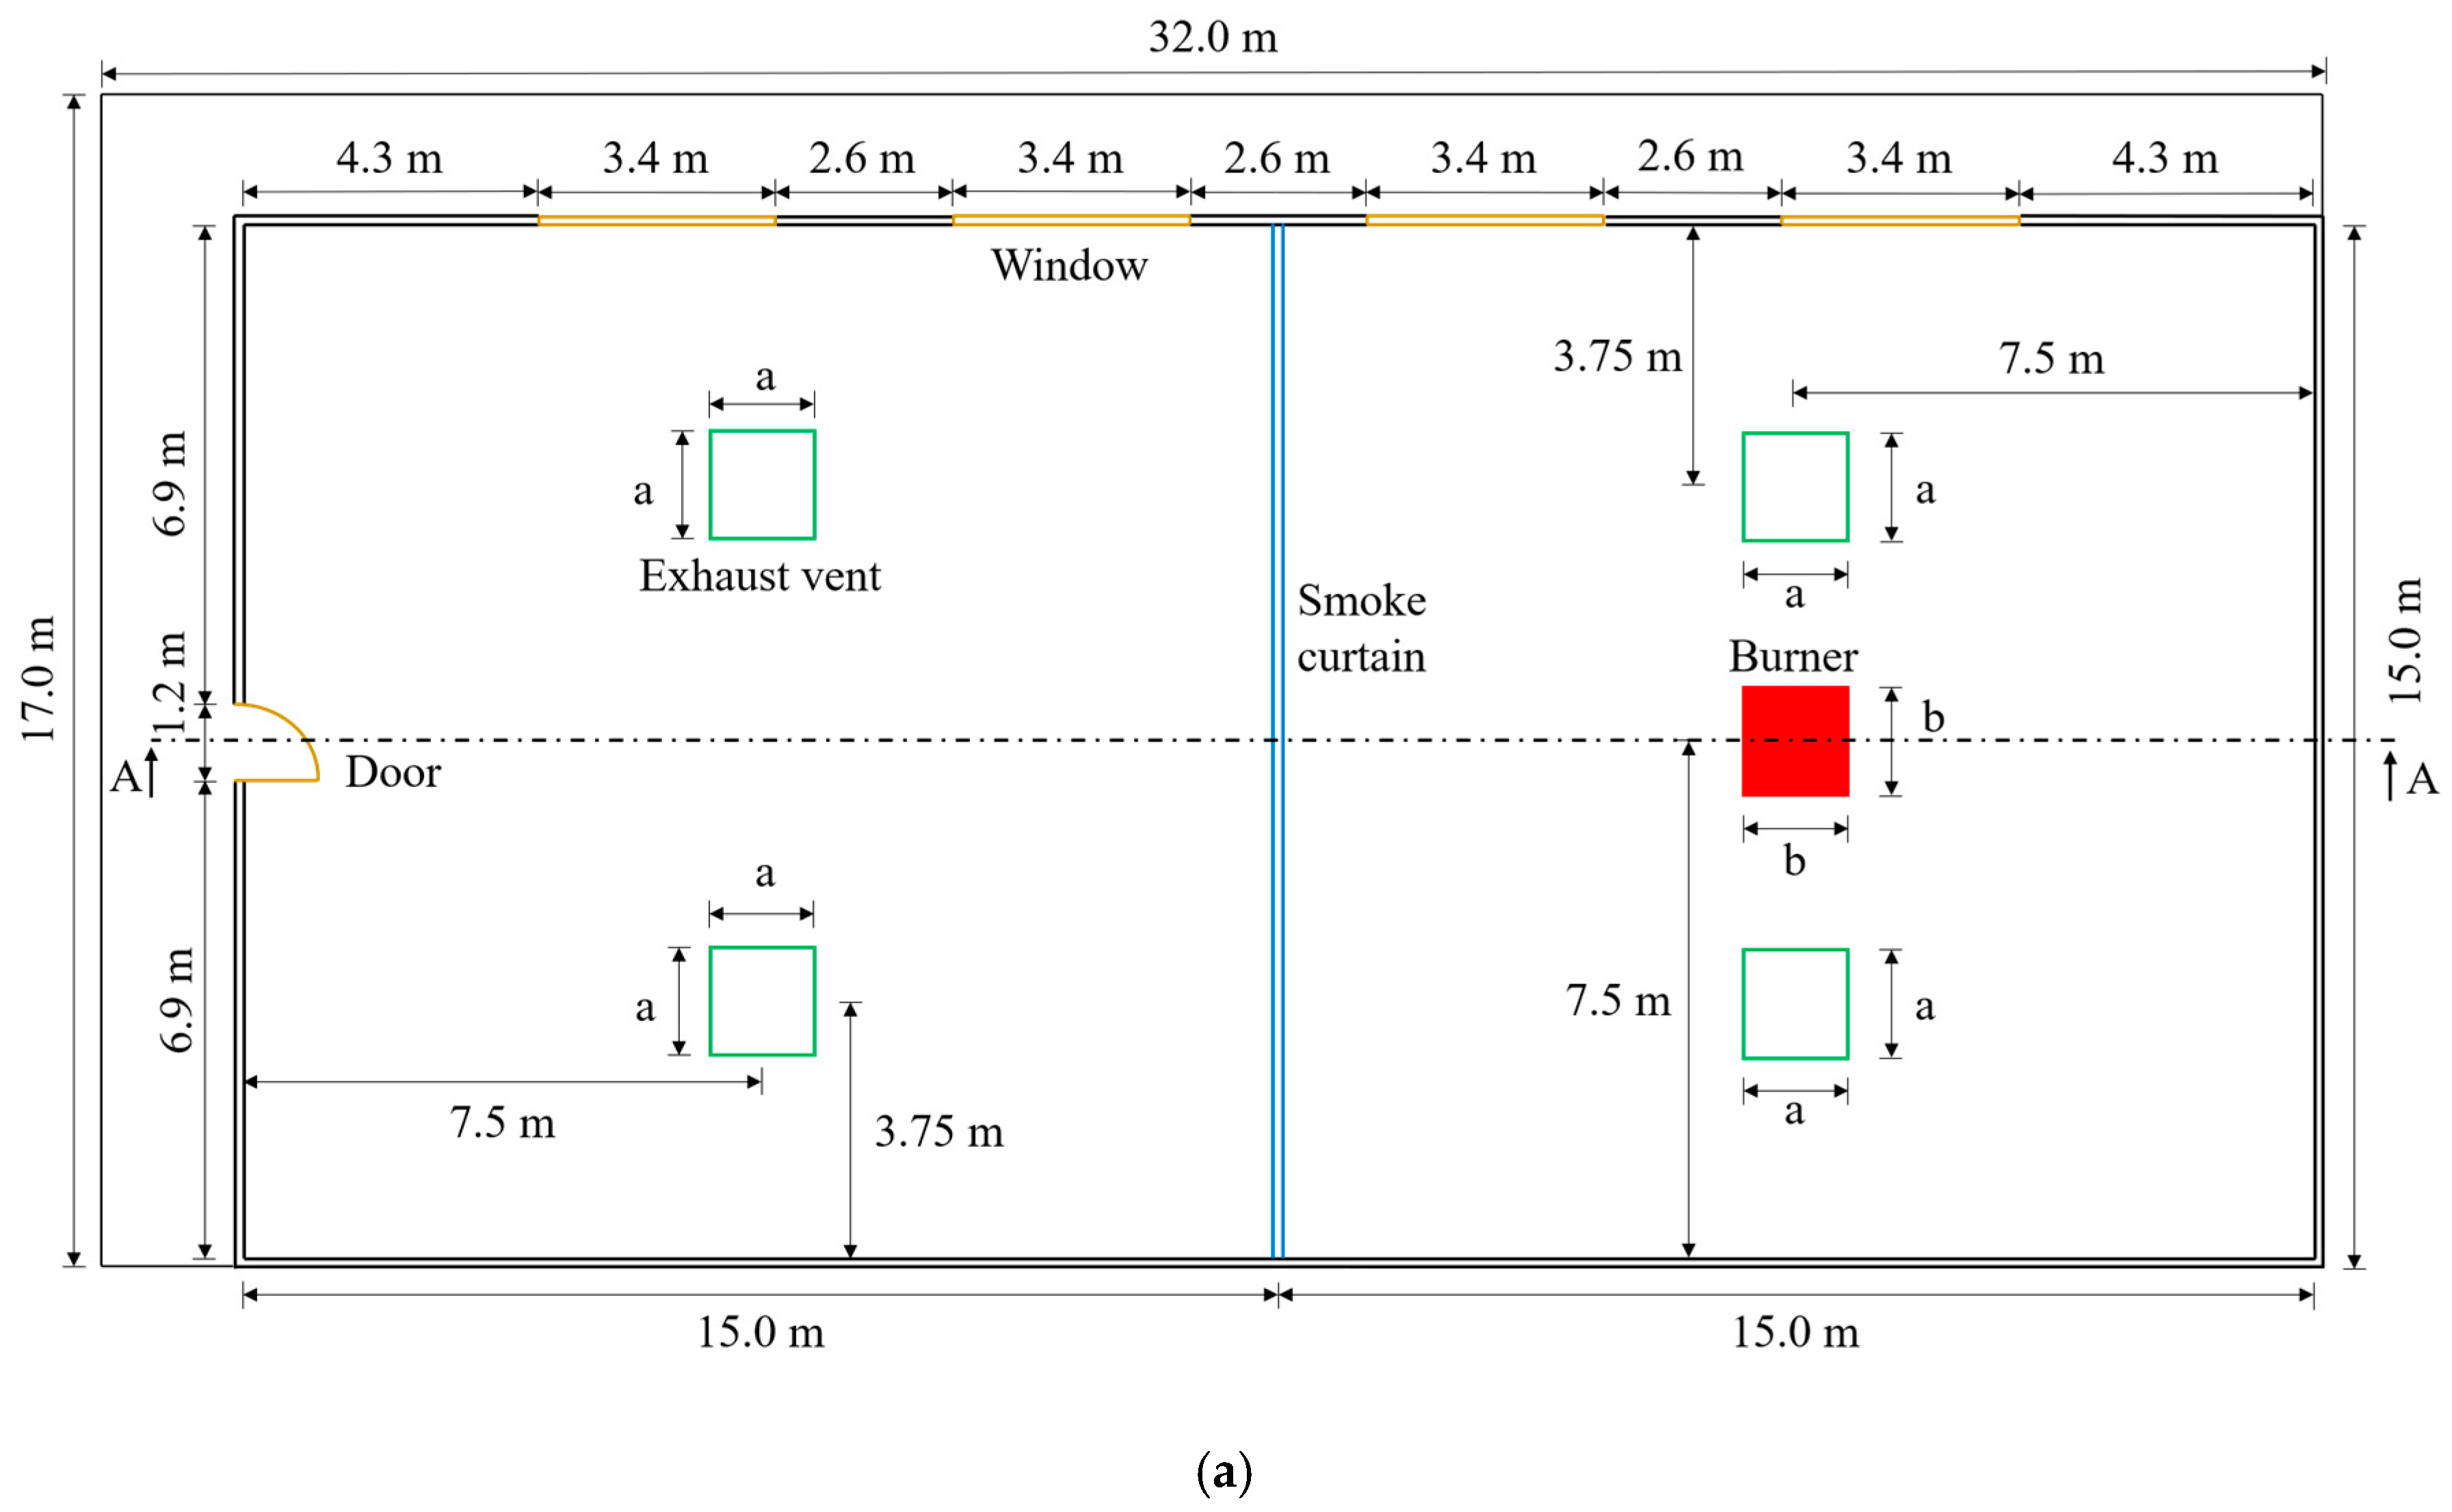
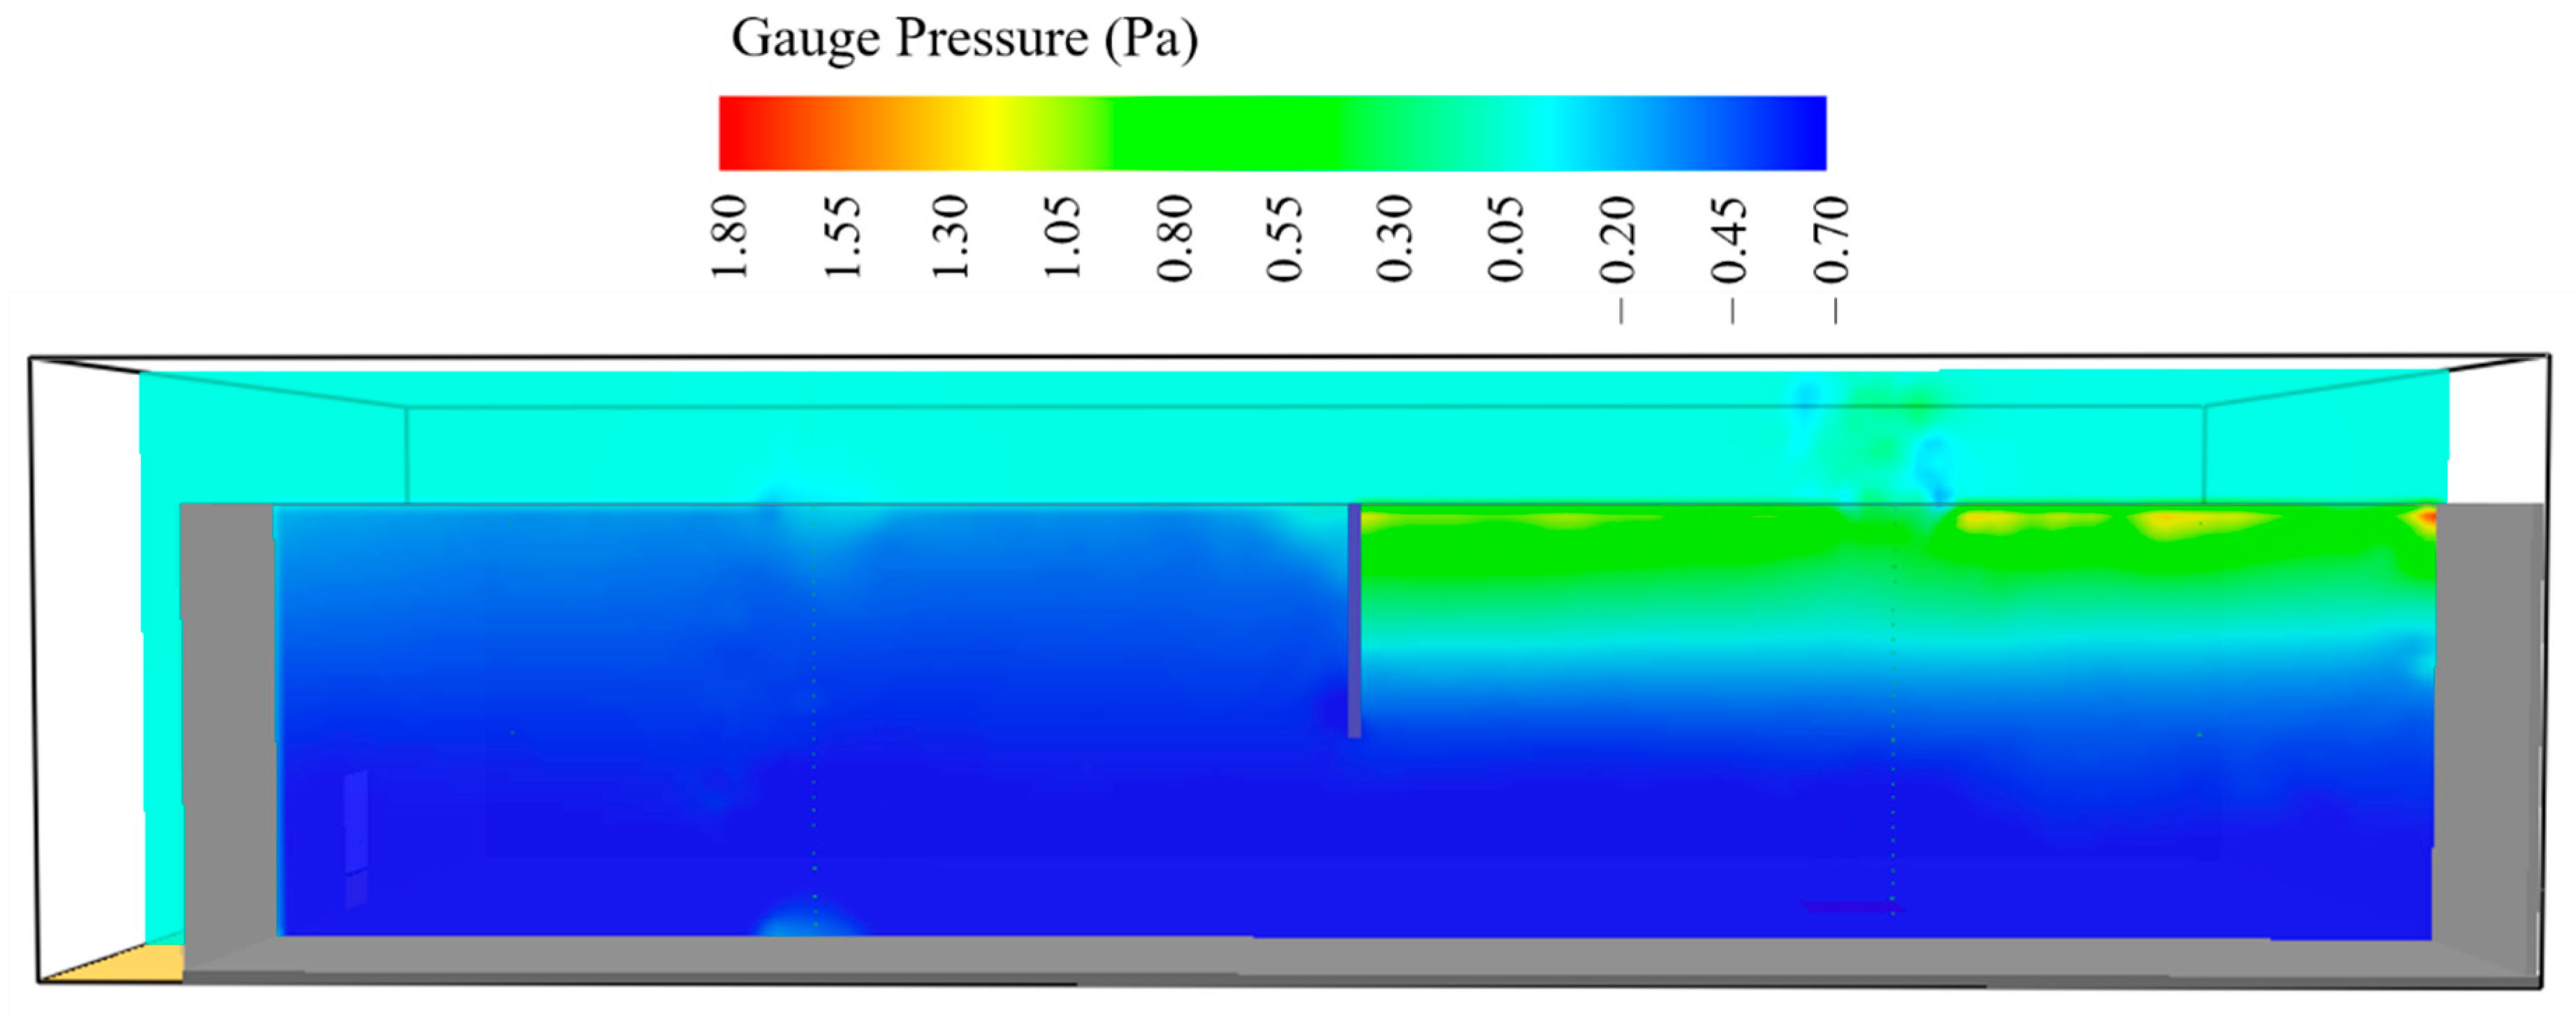
2.1. The Physical Problem and the Computational Domain

The physical problem under study consists in evaluating the fluid dynamic behavior, spread and exhaust of the smoke generated from a burner located in a closed compartment. The compartment has dimensions 30.00 m × 15.00 m × 6.00 m (length × width × height), containing a door and four windows (of the same dimension), four exhaust fans, a smoke curtain and a burner centered in the right quadrant of the compartment, as shown in Figure 1.
The FDS software developers recommend that the computational domain should be extended beyond the physical domain when there are openings (doors, windows and exhaust vents), in order to guarantee a pressure boundary condition in the openings that is closer to reality [40]. In view of this recommendation, Wang et al. [41] carried out a numerical study and proved that the values predicted by the FDS software for the mass flow through a door were closer to the experimental data for greater distances between the limit of the computational domain and the opening of the physical domain.
Thus, in this research, the computational domain was extended 2 m beyond the dimensions of the compartment on the three faces where there are openings to the external environment. After extension, the computational domain started to have the following dimensions: 32.00 m × 17.00 m × 8.00 m, as shown in Figure 1.
The representative numerical mesh of the physical domain used in the simulations is composed entirely of structured, hexahedral, evenly spaced elements with aspect ratio equal to 1 (one), that is, all sides of each element have the same dimension, as illustrated in Figure 2.

2.2. The Mathematical Model

For the numerical analysis, we used the FDS software, version 6.7.4, which solves the conservation equations of mass, species, linear momentum and energy, and of turbulence, with emphasis on the transport of smoke and heat. The FDS uses an approximation for low Mach numbers, developed by Rehm and Baum [42], large eddy simulation (LES) model to treat turbulence, and the Deardorff model [43] to calculate the turbulent viscosity. The FDS software also includes combustion, evaporation, pyrolysis and radiation heat transfer models.

2.2.1. The Governing Equations

The governing equations (equation of state, conservation of mass, species, linear momentum and energy) that describe the physical problem under study are presented in Equations (1)–(5), as follows:
(a)
Mass conservation:
ρ t + · ( ρ u ) = m ˙ b ,
where ρ is the density, u is the velocity vector and m ˙ b is the source term associated with the addition of mass from evaporating droplets or other subgrid-scale particles that represent, for example, sprinkler and fuel sprays, vegetation, and any other type of small, unresolvable object.
(b)
Species conservation:
( ρ Y α ) t + · ( ρ Y α u ) = · ( ρ D α Y α ) + m ˙ α + m ˙ b , α ,
where Y α and D α are the mass fraction and diffusivity of species α . m ˙ α and m ˙ b , α are the mass production rate per unit volume of species α by chemical reactions and evaporating droplets/particles, respectively.
(c)
Linear momentum conservation:
( ρ u ) t + · ρ u u = p + ρ g + f b + τ i j ,
where p is the pressure, g is the gravitational acceleration vector, f b is the external force vector (excluding gravity) and τ i j is the viscous stress tensor.
(d)
Energy conservation:
( ρ h s ) t + · ( ρ h s u ) = D p D t + q ˙ q ˙ b · q ˙ ,
where h s is the enthalpy, q ˙ is the heat release rate per unit volume from a chemical reaction and q ˙ b is the energy transferred to subgrid-scale droplets and particles (for example, sprinkler), and q ˙ represents the conductive, diffusive and radiative heat fluxes.
(e)
Equation of state (ideal gas law):
p = ρ R ¯ T M ,
where R ¯ is the universal constant, T is the absolute temperature and M is the molecular weight of the gas mixture.
More information on the mathematical model and submodels used in this research can be found in the FDS Technical Reference Guide [44].

2.2.2. Initial and Boundary Conditions

As an initial condition, atmospheric pressure P0, temperature T0, air relative humidity, RH0, velocity u0, and mass fractions for air Yair,0, and soot Ysoot,0 were considered. The values of these parameters are shown in Table 1.
Open boundary conditions were used at the maximum and minimum extremes of the computational domain, as shown in Figure 3. This means that the fluid is allowed to flow into or out of the computational domain depending on the local pressure gradient (upwind boundary condition). Typically, in this kind of boundary condition, the gradients of the tangential velocity components are set to zero [44].

2.2.3. Heat Release Rate

The heat release rate (HRR) is the amount of energy per unit time that a material releases into the environment when it undergoes combustion. Once started, the fire goes through three stages: growth, fully developed (in which the HRR remains constant) and decay [45,46]. Normally the growth phase of the fire is modeled in such a way that the HRR is directly proportional to the time squared (t-squared fires) [47,48], that is:
H R R g r o w t h = α × t 2 ,
where α is the fire growth coefficient in kW/s2 and t is the time in s.

2.3. Numerical Solution Method

The algorithm for solving the governing equations uses an explicit predictor-corrector finite difference scheme, with second-order precision in space and time. At each time step, between the predictor and corrector procedures, the algorithm checks whether the Courant-Friedrichs-Lewy (CFL) stability criterion is satisfied, that is:
CFL =   δ t × max ( | u | δ x , | v | δ y , | w | δ z ) < CFL max ,
where CFL max varies between 0.8 and 1.0; δ t is the time step, u , v and w are the components of the velocity vector in the x, y and z directions, respectively. If the criterion is not satisfied, the time step is adjusted (reduced), returning to the beginning of the predictor procedure. If the stability criterion is satisfied, the procedure continues to the corrective procedure. In this way, the time step in the numerical simulation is not constant.
In the FDS software, the spatial variables are discretized using a staggered grid [49], that is, scalar quantities (e.g., pressure, temperature, density), velocity components and vorticity components are assigned to the centers, faces and edges of each cell, respectively. The radiation heat transfer is quantified using the finite volume method and assuming gray gas radiation model [44].

2.4. Thermo-Physical Properties of Materials

The material used to model the floor, walls and ceiling of the compartment was concrete, 10 cm thick. The density ρ , specific heat cp, thermal conductivity k, and emissivity ε of the concrete are shown in Table 2.
The source term of heat and smoke release was obtained considering the burning of wood, with chemical formulation CH1.7O0.74N0.002. The yields of soot (ysoot) and carbon monoxide (yCO), heat of combustion (Δh) and Heat Release Rate Per Unit Area (HRRPUA) are shown in Table 2.
The thermo-physical properties of the air are temperature-dependent (ideal gas law) and calculated by the software at each control volume and for each instant of time.

2.5. Cases Studied

Table 3 shows the operational conditions of the door, windows (open or closed), and smoke curtain (with or without), type of exhaust system, HRR from the burner and dimensions of the exhaust vents (a) and of the burner (b) for each of the twelve simulated cases.
As HRRPUA = 100 kW/m2 (Table 2), burners with negligible height and surface areas of 9.00 m2 (b = 3.00 m) and 2.25 m2 (b = 1.50 m) have HRR of 900 kW and 225 kW, respectively. For all analyzed cases, a fast growth rate (α = 0.0469 kW/s2) was considered, according to Alpert [54], with a fully developed HRR as indicated in Table 3, that is equivalent to the maximum value of the growth phase. The simulations were carried out in the initial 600 s of the fire process. Thus, the decay phase was not analyzed. Furthermore, it was considered that the smoke layer interface height is the distance from the floor to the point where the mass fraction of soot is approximately two orders of magnitude lower than in the fire zone, as suggested by Sinclair [55] and validated by Qin et al. [20] and Qin et al. [12]. Based on the mass fraction results obtained in the fire zone, from the simulations, a value of 10−6 for the mass fraction of soot in the other locations of the environment was adopted, to determine the interface between the two layers; one with low temperatures and smoke concentrations, located in the lower region of the compartment, and the other with high temperatures and smoke concentrations, located in the upper region of the compartment. To monitor the temperature and smoke layer interface height transient history, 29 temperature and soot mass fraction measurement points were defined below each of the four exhaust fans, with a vertical spacing of 0.20 m, as shown in Figure 4.
At a given instant of time, the smoke layer interface height below a given exhaust fan was established when the soot mass fraction at a given measurement point reached the value of 10−6. Thus, for cases in which there is no smoke curtain (cases 1–8, 11 and 12), the smoke layer interface height was obtained from the arithmetic mean of the values found for each of the four measurement columns. For cases with a smoke curtain (cases 9 and 10), there are two different smoke layer interface height, each obtained from the arithmetic mean of the values found for each of the two measurement columns located on each side of the compartment’s smoke curtain.

3. Results and Discussion

3.1. Mesh Convergence Analysis

To ensure that the results obtained in the simulations were independent of the number of control volumes, a mesh convergence study was made, for case 6 (Table 3) considering 04 (four) distinct meshes, named M1, M2, M3 and M4, as reported in Table 4. Figure 5 presents the results of this mesh convergence analysis for four investigated parameters: smoke layer interface height, average temperature (t = 600 s), exhaust volumetric flow rate and HRR. From the analysis of Figure 5, it can be seen that the transient results obtained for the smoke layer interface height as a function of time and the temperature profile at t = 600 s for the coarsest mesh (M4) show significant variations as compared to the obtained results for the more refined mesh (M1). It is also observed that the results obtained for the M3 mesh shows good concordance as compared with that to the M1 mesh, except for the temperature profile at t = 600 s, indicating only an acceptable agreement. Comparing the meshes M1 and M2, there is a good agreement for all analyzed parameters.
In order to reduce the computational effort and maintain a good accuracy of the obtained results, a mesh with 1,492,736 elements (M2) was chosen to be used in the simulations of the other cases under study. Thus, the present work uses a uniform mesh with an element size of approximately 14.26 cm, more refined than the values used by Qin et al. [12], Abotaleb [16] and Yuen et al. [17] in their researches.

3.2. Thermo-Fluid Dynamic Analysis of Processes

3.2.1. Natural Exhaust with Closed Windows

Figure 6 shows the influence of the natural exhaust area, for the situation of the compartment with closed windows and HRR = 900 kW, in the smoke layer interface height as a function of time, in the average temperature profile for the time t = 600 s, in the average exhaust volumetric flow rate as a function of time and in the HRR as a function of time.
Upon examining Figure 6a–c, it may be observed that although the volume of gases exhausted in case 4 is approximately 35% greater than the value presented in case 3, during the initial 600 s of fire, the increase in the exhaust area for the poorly ventilated compartment (closed windows in the lower region of the compartment, cases 1, 3 and 4) does not provide great variations in the smoke layer interface height along most of the time and presents a slightly lower result between 320 and 400 s. A similar result was obtained by Qin et al. [12]. This behavior can be explained by the exhaust of gases with a lower soot concentration through the exhaust system with a larger area.
The smoke layer takes 180 s to reach a height of 1.80 m from the floor, to the compartment without an exhaust system (case 1), and, for other cases in that a natural exhaust system is used, this time is approximately 195 s, that is, a delay of only 15 s.
A higher volumetric exhaust flow rate provokes suction of the environment air outside of the compartment (T = 28 °C) through the door, justifying the achievement of lower temperatures for case 4 (Figure 6b). At time t = 600 s, the temperature, at a height of 1.80 m from the floor, is reduced from 65.50 °C (without exhaust) to 55.96 °C and 49.46 °C, when using exhaust systems with total areas of 2.25 and 9.00 m2, respectively.
From Figure 6d, it can be seen that the heat release rates in the growth phase, for the three cases analyzed, are in accordance with the formulation presented in Equation (6) and that in the fully developed phase (after 138.53 s) there were small oscillations around the value of 900 kW.

3.2.2. Natural Exhaust with Open Windows

For physical situation where the compartment has open windows and HRR = 900 kW, Figure 7 illustrates the transient effect of the natural exhaust area in the smoke layer interface height, average exhaust volumetric flow rate and in the HRR, and in the average temperature profile for the time t = 600 s.
After analyzing Figure 7a, one can observe that, for the well-ventilated compartment (with open windows), the area of the exhaust fans significantly influences the smoke layer interface height, the temperature profile and the average exhaust volumetric flow rate.
The exhaust volume for case 6, during the first 600 s of fire, is approximately 130% higher comparing to case 5, delaying the downward displacement of the smoke layer, especially after 160 s, and reducing the temperature inside the entire compartment.
The smoke layer takes 188 s to reach a height of 1.80 m from the floor for the compartment without exhaust system (case 2), while this time is 206 s and 290 s for cases 5 and 6, respectively. It is observed that, even after 600 s, the smoke layer does not reach the floor, for both compartments with exhaust systems (cases 5 and 6), differently from what was previously presented for the cases with closed windows (cases 3 and 4). For case 2, the smoke reaches the floor at time t = 352 s and the minimum values obtained for the smoke layer interface height for cases 5 and 6 were 0.35 and 1.25 m, respectively.
For time t = 600 s, the temperature at a height of 1.80 m from the floor is reduced from 65.24 °C (without exhaust) to 50.72 °C and 33.81 °C when using exhaust systems with total areas of 2.25 and 9.00 m2, respectively.
Figure 7d indicates that the results of the heat release rates for the cases 2, 5 and 6 are in accordance with Equation (6) (growth phase) and Table 3 (HRR for fully developed phase).
Figure 8 illustrates the temperature distribution for the compartment with natural exhaust (9.00 m2 total), HRR = 900 kW, door and windows open and without smoke curtain (case 6) at different moments of the process.
Upon examining Figure 8, it is observed that 100 s after the start of the fire, the temperature in the plane y = 3.75 m did not vary significantly. This is because the fire is still growing. It can be seen, between 100 and 200 s, that there is a very significant variation in temperature in the analyzed plane, due to the fact that the fire reached the fully developed stage at t = 138.53 s and, consequently, the HRR is maximum from that instant. It is also observed that the temperature doesn’t vary significantly in the analyzed plane, after 300 s. This fact indicates that the heat released by the burner is balanced by the enthalpy of the mixture that leaves the compartment through the exhaust fans.
Also, from the analysis of Figure 8 and t ≥ 200 s, it is evident the formation of an interface between two distinct layers: one with high temperature and concentration of soot, in the upper region of the compartment, and the other with low temperature and concentration of soot in the lower compartment. Further, there is a greater variation in temperature in the vertical direction (z axis) of the plane, when compared to that variation in the horizontal direction (x axis) of the plane under analysis. In this plane, the highest temperatures are located, predominantly, on the right side of the compartment, region where is placed the burner (source term of heat).

3.2.3. Natural Exhaust with Different Heat Release Rates

For compartments with natural exhaust area of 9.00 m2, Figure 9 shows the transient behavior of the smoke layer interface height, average exhaust volumetric flow rate and HRR, and the average temperature profile in different height at t = 600 s, for two heat release rates HRR = 225 and 900 W.
Upon analyzing Figure 9, it is evident that the HRR from the burner affects the smoke layer interface height, temperature profile and the average exhaust volumetric flow rate, for both compartments (with open and closed windows).
For the compartment with closed windows (cases 4 and 7), reducing the HRR from 900 kW to 225 kW reduces the downward vertical displacement of the smoke layer. Whereas for case 4 the smoke reaches the floor at time t = 360 s, the minimum smoke layer interface height for case 7 is 1.45 m, occurred in the instant of time t = 574 s. For the compartment with open windows (cases 6 and 8), the reduction of the HRR makes the minimum smoke layer interface height to increase from 1.25 m to 2.95 m, in cases 6 and 8, respectively.
While the total energy released during the initial 600 s of fire (integral of the HRR over time) for cases with HRR = 900 kW is 3.66 times greater than that for cases with HRR = 225 kW, the volume of gases removed from the compartment is 1.88 times higher than that for compartments with closed windows (comparing cases 4 and 7), and 1.79 times higher than that for environments with open windows (comparing cases 6 and 8), respectively, at the same time interval.
From the analysis of Figure 9a,b, it is evident the importance of open windows to promote smoke extraction, increase the smoke layer interface height, and reduce the temperature of the compartment, regardless of the HRR. Besides, it is also observed that even with a HRR 4 times higher during most part of the fire process (fully developed phase), the minimum smoke layer interface height (Figure 9a) and the temperature below 2.00 m at t = 600 s (Figure 9b), both for case 6, are very similar to those obtained for case 7. Thus, it is clearly shown the importance of a well-ventilated environment, in order to promote the control of the room temperature and a more efficient smoke outlet through natural exhaust fans.
Analyzing Figure 9d, it can be seen that, up to 69.26 s, the HRR is the same for all cases, according to the growth rate established for the fire (α = 0.0469 kW/s2). For the cases 7 and 8, at this instant of time, the fully developed phase is reached, with small oscillations around the value of 225 kW, as defined in Table 3.

3.2.4. Natural Exhaust with Smoke Curtain and Closed Windows

Figure 10 illustrates the influence of the smoke curtain, for compartments with natural exhaust system (total area of 9.00 m2), closed windows and HRR = 225 kW, in the smoke layer interface height as a function of time, in the average temperature profile for the time t = 600 s, in the average exhaust volumetric flow rate as a function of time and in the HRR as a function of time.
Upon examining this figure, it can be seen that the 3.00 m smoke curtain was efficient to restrict the smoke on the right side of the compartment with four natural exhaust vents of 2.25 m2 each, closed windows and maximum HRR = 225 kW during the initial 600 s of fire. For a higher HRR, a larger total exhaust area and/or a higher smoke curtain would probably be needed to ensure smoke confinement in the upper right region of the compartment. Now, from the analysis of the Figure 10b, it is possible to observe that the use of the smoke curtain promotes a significant reduction in temperature on the left side of the compartment and a moderate reduction in temperature on the right side, up to a height of 3.40 m.
Figure 11 and Figure 12 illustrate, respectively, the pressure field and the velocity vector field for the compartment with smoke curtain, open windows and HRR = 225 kW. After analyzing Figure 11, it was observed that the greatest pressures occur, precisely, in the regions closest to the exhaust vents located on the right side of the compartment.
Furthermore, it can be seen that the smoke curtain, in addition to functioning as a physical barrier, is also responsible for maintaining positive pressure in the upper right region of the compartment (Figure 11), forcing hot gases out of the internal environment through the natural exhaust fans located at the right side of the smoke curtain, clearly seen in Figure 12.
The pressure gradient between the upper right region of the compartment and the external environment (outside of the compartment) justifies the higher exhaust volumetric flow rate obtained for case 9 when compared to case 7 (Figure 10c). For a better understanding, the volume of gases removed by the two exhaust fans located on the right side of the compartment with smoke curtain (case 9), during the first 600 s of the fire, is 60% higher than the total volume that came out of the four exhaust fans in the compartment without a smoke curtain (case 7).
As the amount of gases removed from the right side of the compartment (case 9) is greater than the amount of air entering the compartment, much of the environment is depressurized (below atmospheric pressure), as seen in Figure 11, provoking the entry of more external air, at 28 °C, through the door and exhaust fans on the left side (Figure 12). All these physical phenomena justify the negative values for the average exhaust volumetric flow rate on the left side (Figure 10c) and low temperatures obtained between 3.80 and 6.00 m for the left side of the compartment (case 9), as shown in Figure 10b. Besides, in Figure 12, at approximately 600 s after the start of the fire, it can be seen that a small amount of gases begins to flow around the smoke curtain, moving from the right side to the left side of the compartment. As the volumetric flow rate and soot concentration of the gases surrounding the smoke curtain are lower, the smoke layer interface height on the left side of the compartment wasn´t affected (Figure 10a).

3.2.5. Natural Exhaust with Smoke Curtain and Open Windows

As considering the compartments with natural exhaust (9.00 m2), open windows and HRR = 225 kW, Figure 13 shows the influence of the smoke curtain in the smoke layer interface height as a function of time, in the average temperature profile for the time t = 600 s, in the average exhaust volumetric flow rate as a function of time and in the HRR as a function of time. Figure 14 and Figure 15 illustrate, respectively, the pressure field and the velocity vector field for the compartment with smoke curtain, open windows and HRR = 225 kW.
From the analysis of Figure 13a, it can be noticed that the 3.00 m smoke curtain is sufficient to restrict the smoke on the right side of the compartment, given that the smoke layer interface height on the left side (case 10) remains in 6.00 m, in 600 s elapsed time.
Since the minimum smoke layer interface height for case 8 is 2.80 m (left side) and considering that the purpose of smoke control systems is to avoid contact between smoke and people, the smoke curtain is not so useful for the well-ventilated compartment (open windows), for the physical situation with four natural exhaust fans of 2.25 m2 each and maximum HRR of 225 kW. In contrast, it was observed for the poorly ventilated compartment (closed windows) that the smoke layer interface height went from 0.80 m (case 7-left side) to 3.00 m (case 9-right side) when using smoke curtain.
Upon analyzing Figure 13b, it is observed that the use of the smoke curtain does not promote significant improvements in the temperature distribution in the compartment up to a height of 2.00 m. For heights above 3.00 m, the temperature on the right side of the compartment with a smoke curtain is, on average, 4.2 °C higher than the values obtained for case 8, due to the compartmentalization of hot gases. On the other hand, the average temperature on the left side of the compartment, between 3.00 and 6.00 m in height, is reduced by 5.3 °C when using the smoke curtain.
Analyzing Figure 13c, one can observe that air enters through the exhaust fans located on the left side of the compartment, due to a slightly negative pressure in the region, up to approximately 370 s. During this time interval, the volume of air entering the exhaust fans, for case 10 (with smoke curtain and open windows), corresponds to approximately 25% of the value obtained for case 9 (with smoke curtain and closed windows). After this time interval, the upper left region of the compartment has a slightly positive pressure, due to the air flow, with low concentration of soot, that surrounds the smoke curtain (Figure 15) and the effect of the natural convection that promotes upward vertical displacement of the hotter air, causing the escape of gases through the exhaust fans. Even so, in the interval between 370 and 600 s the volume of gases that was exhausted from the left side of the compartment corresponds to only 6% of the total exhaust volume in the same period of time.
Regarding the total volume of gases removed from the compartment by the exhaust fans during the 600 s of fire, the value obtained for case 10 (with smoke curtain) represents only 77% of the value obtained for case 8 (without smoke curtain), proving the low efficiency of the smoke curtain in the smoke protection for the well-ventilated compartment (open windows).
Now analyzing Figure 14, a slightly higher pressure gradient is observed between the upper right region of the compartment and the external environment, for case 10, when compared to case 9 (Figure 11), promoting a exhaust volumetric flow rate of gases 12% higher at the analyzed time, evidenced by the velocity vectors in Figure 15, and a 10% higher volume of gases exhausted during the first 600 s of fire.
There is also a lower pressure gradient between the other regions of the compartment and the external environment (outside of the compartment) when compared to case 9 (Figure 11) due to a larger ventilation area (open windows), which facilitates air renewal. For the instant of time t = 600 s, the lower region has a slightly negative pressure, promoting the entry of air through the windows and door, while the upper left region of the compartment has a slightly positive pressure, promoting the exit of air through the exhaust fans, as seen in Figure 15.
By the inclined direction of the velocity vectors at the exhaust fan on the left side of the compartment (Figure 15), it can be verified that the air, with a low concentration of soot, surrounding the smoke curtain, is the main responsible for the exhaust phenomenon that occurs on the left side.

3.2.6. Mechanical Exhaust without Smoke Curtain and Open Windows

In this section, we compared two mechanical exhaust systems, with total volumetric flow rates of 18.00 m3/h (case 11) and 36 m3/h (case 12), with the natural exhaust system (case 6). The results of this analysis for the compartment with open windows and a HRR of 900 kW are shown in Figure 16.
Although it presents results with a lot of oscillation, the mechanical exhaust system with a total volumetric flow rate of 36.00 m3/h has the best results for the smoke layer interface height (Figure 16a). The downward vertical displacement of the smoke layer for cases 6 and 11 are very close, with the mechanical exhaust system showing a slight advantage compared to the natural exhaust system.
With respect to Figure 16b, it is observed that the greater the distance from the floor, the greater the temperature difference between the three systems. The mechanical exhaust system with a total volumetric flow rate of 36.00 m3/h presented the lowest temperatures and, in contrast, the natural exhaust system presented the highest temperatures in all height.
From Figure 16c, it can be seen that the average exhaust volumetric flow rates of the natural and mechanical exhaust systems increase gradually and abruptly, respectively, over time. The volumetric flow rates adopted for mechanical exhaust systems are greater than the maximum value reached by the natural exhaust system. The total volumes of gases exhausted during the initial 600 s of fire for cases 11 and 12 are, respectively, 1.68 and 3.36 times greater than those obtained for case 6.
Despite presenting advantages in delaying the downward vertical displacement of the smoke layer and in reducing the internal temperature, the mechanical exhaust system reported in case 12, promotes very high speeds (3.00 m/s) in the occupation area of people inside the compartment (below a height of 2.00 m), more than double the values obtained for cases 6 and 11. Another disadvantage is that the unpredictability of the HRR of a real fire makes it difficult the effective design of suitable mechanical exhaust systems with fixed volumetric flow rate, making the use of a natural exhaust system recommended [20].

4. Conclusions

This work aimed to perform a numerical analysis, using the FDS software, to evaluate the thermo-fluid dynamic behavior of the smoke generated by a fire in an enclosed space. From the obtained results, it can be concluded that:
(a)
For a poorly ventilated compartment (closed windows) and a HRR of 900 kW, the increase in the natural exhaust area did not improve the smoke layer interface height. In all cases, the smoke reached the floor in less than 450 s and when using any of the natural exhaust systems, there was a delay of only 15 s in the time necessary for the smoke to reach a height of 1.80 m from the floor.
(b)
For the well-ventilated compartment (open windows) and HRR of 900 kW, the increase in the natural exhaust area significantly increased the volume of gases exhausted, delaying the vertical displacement of the smoke layer and reducing the temperature in the entire compartment. For the case without an exhaust system, smoke reaches the floor and, for the cases with natural exhaust areas of 2.25 and 9.00 m2, the minimum values obtained for the smoke layer interface height were 0.35 and 1.25 m, respectively.
(c)
The increase in the HRR from the burner accelerates the downward vertical displacement of the smoke layer and increases the volume of gases exhausted and the compartment temperature, regardless of the ventilation (open or closed windows).
(d)
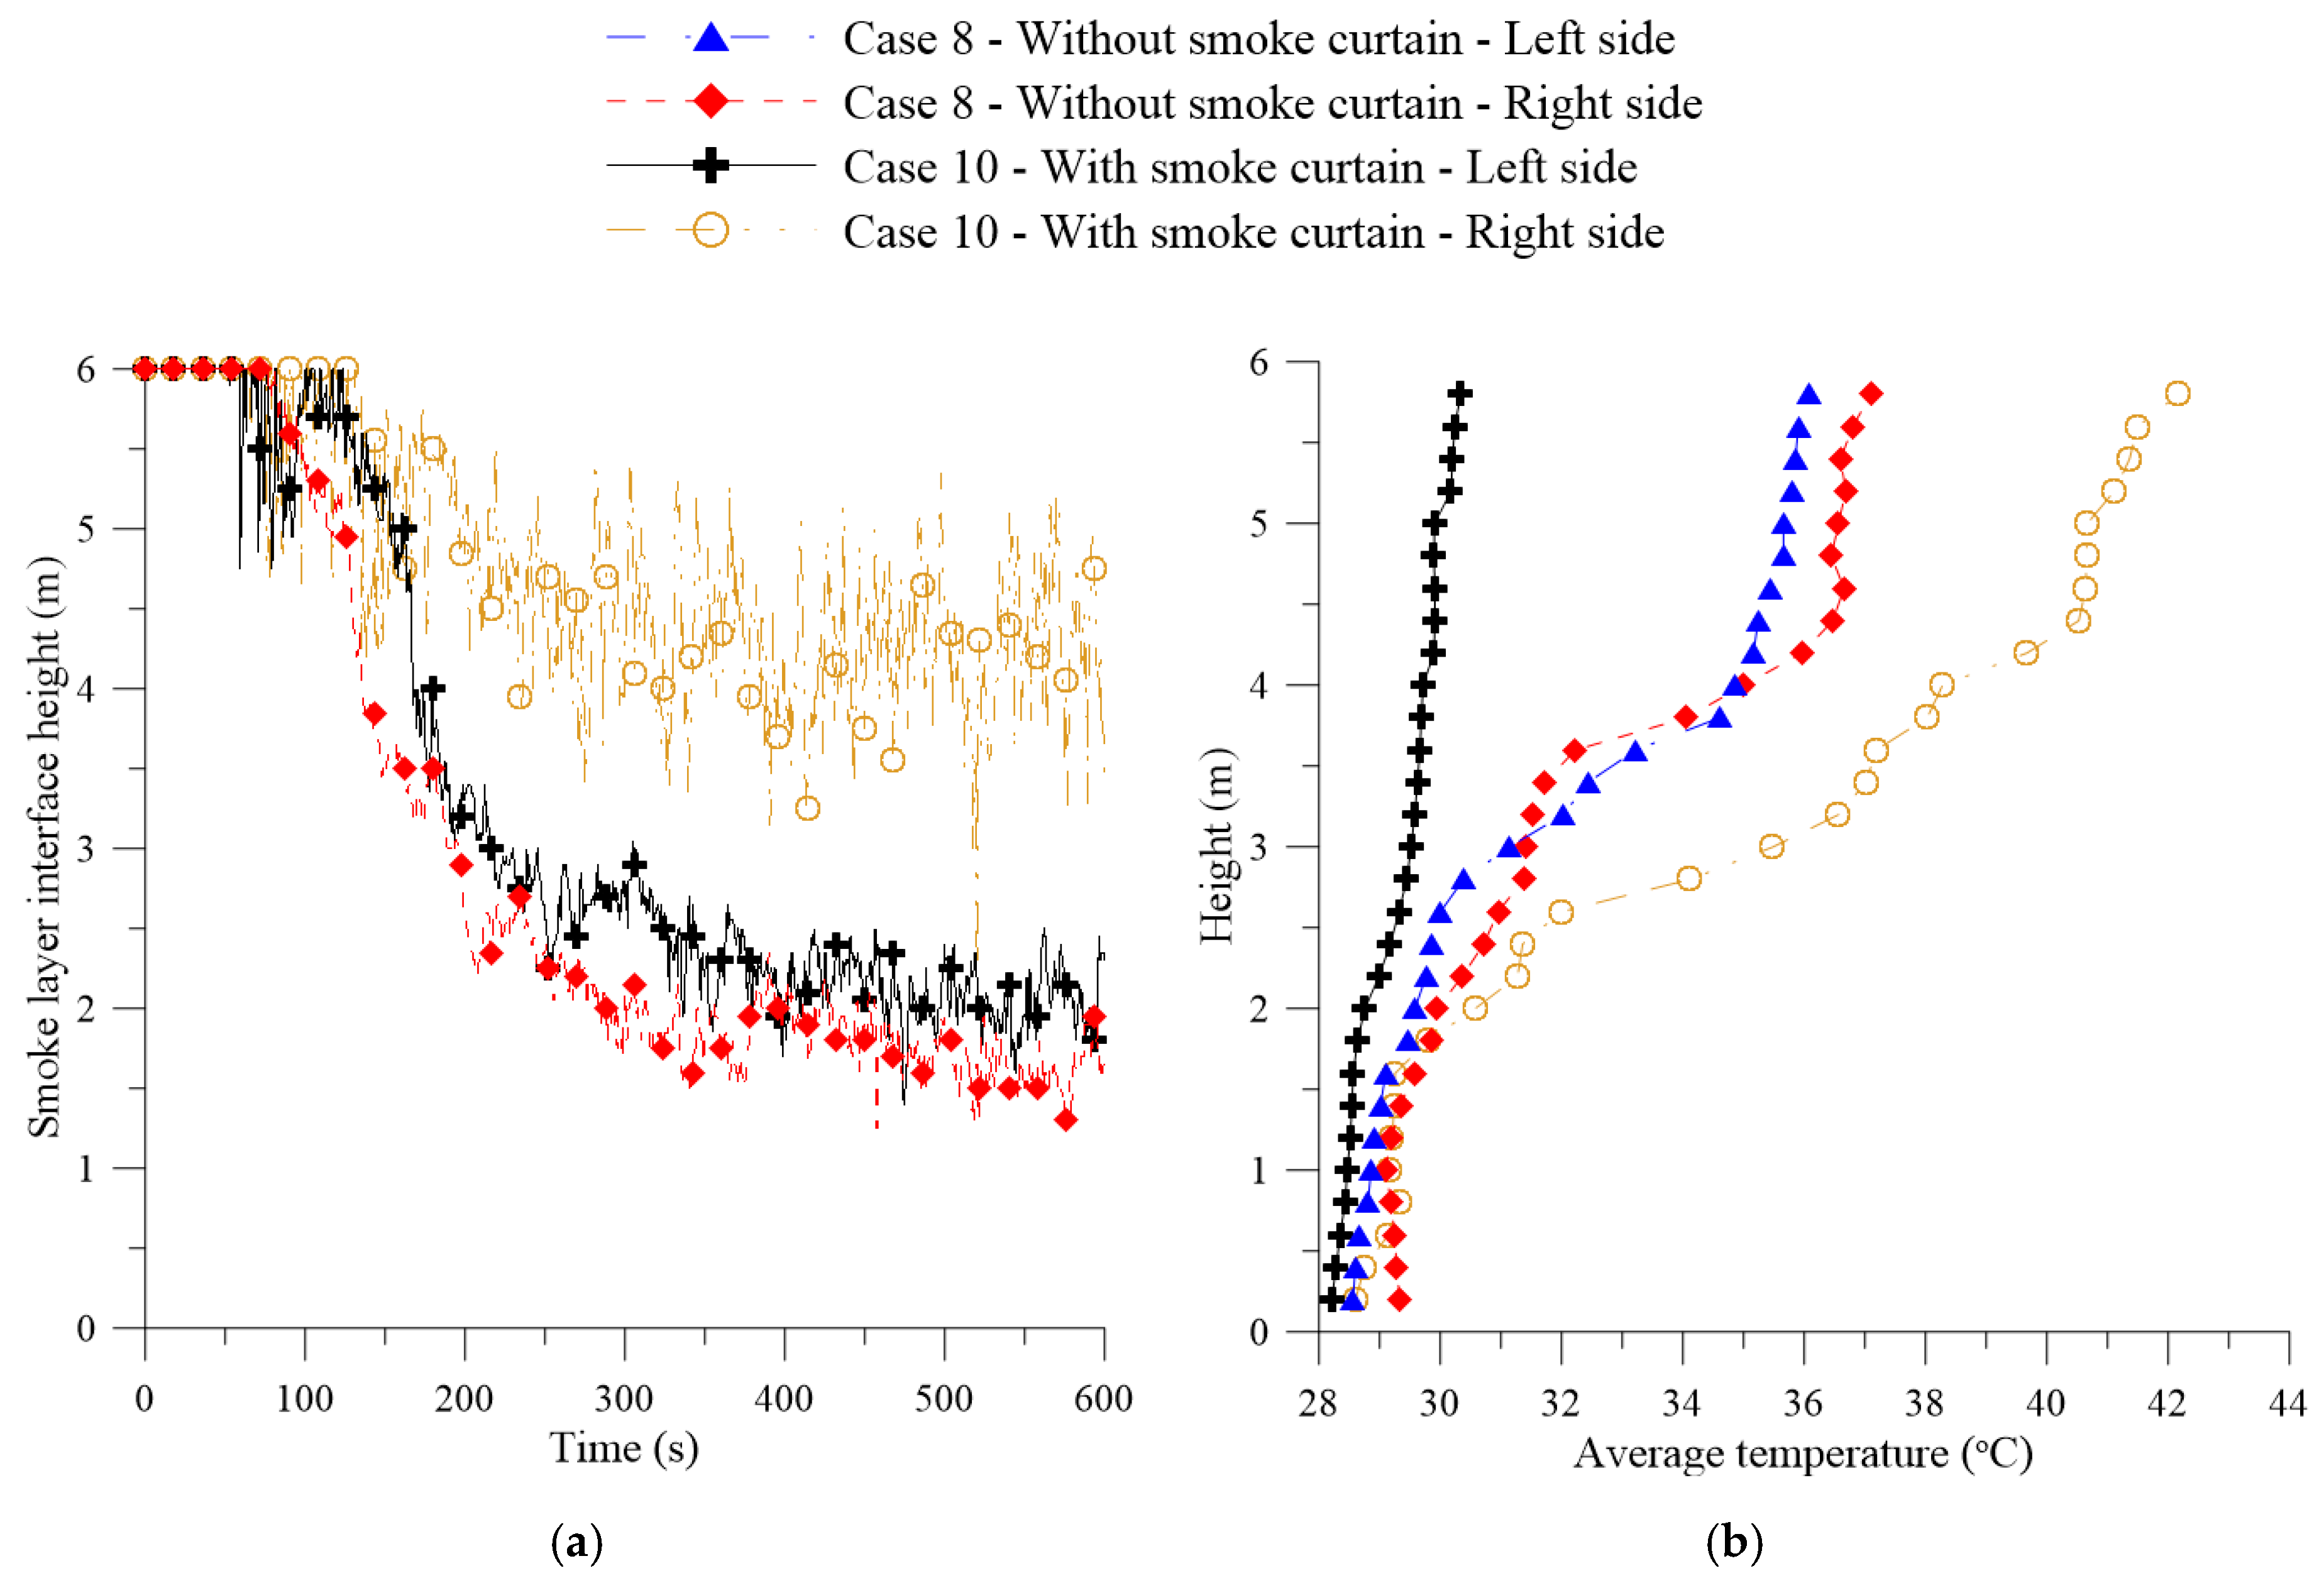
Although the use of the 3.00 m smoke curtain was sufficient to restrict the smoke on the right side of the compartment, with HRR = 225 kW, for both cases analyzed. The use of a smoke curtain was efficient in smoke exhaustion, only for the case of poorly ventilated environment (closed windows), in which the exhaust fans on the left side acted as air intakes.
(e)
Although the mechanical exhaust system with a total volumetric flow rate of 36.00 m3/h has shown good results in the downward displacement of the smoke layer and in the reduction of the internal temperature; it promotes very high speeds in the occupation area of people inside the compartment.
Finally, it is concluded that the FDS is a very useful tool for analyzing real fire situations, making it possible to carry out several comparative analyzes without inherent risks of experimental tests, with reduction of costs and time, assisting designers to develop more efficient smoke control systems for each type of building.

Author Contributions

Conceptualization, R.S.G., H.L.F.M., A.C.Q.S., V.H.V.V., K.C.G. and A.G.B.L.; Formal analysis, R.S.G., T.R.N.P., H.L.F.M., A.C.Q.S., V.H.V.V., K.C.G. and A.G.B.L.; Investigation, R.S.G. and T.R.N.P.; Methodology, R.S.G., T.R.N.P., H.L.F.M., K.C.G. and A.G.B.L.; Software, R.S.G., T.R.N.P. and H.L.F.M.; Supervision, A.C.Q.S., V.H.V.V., K.C.G. and A.G.B.L.; Writing—original draft, R.S.G., K.C.G. and A.G.B.L.; Writing—review & editing, R.S.G., A.C.Q.S., V.H.V.V., K.C.G. and A.G.B.L. All authors have read and agreed to the published version of the manuscript.

Funding

This research was funded by CNPq (grant number: 313531/2019-6), CAPES, and FINEP (Brazilian research agencies).

Acknowledgments

The authors would like to thank the Computational Laboratory of Thermal and Fluids, Mechanical Engineering Department, Federal University of Campina Grande (Brazil), for the research infrastructure and the references cited in the manuscript.

Conflicts of Interest

The authors declare no conflict of interest.

Abbreviations

FDSFire Dynamic Simulator
CFDComputational Fluid Dynamic
CFL Courant-Friedrichs-Lewy constraint
CFL max Maximum allowed value for CFL
cpSpecific heat
f b External force vector (excluding gravity)
g Gravitational acceleration vector
HRRHeat Release Rate
HRRPUAHeat Release Rate Per Unit Area
H R R g r o w t h Heat Release Rate in the growth phase
h s Enthalpy
KThermal conductivity
m ˙ b Mass production rate per unit volume by evaporating droplets/particles
m ˙ α Mass production rate per unit volume of species α by chemical reactions
m ˙ b , α Mass production rate per unit volume of species α by evaporating droplets/particles
NISTNational Institute for Standards and Technology
p Pressure
P0Initial pressure
q ˙ Heat release rate per unit volume from a chemical reaction
q ˙ b Energy transferred to subgrid-scale droplets/particles
q ˙ Heat flux vector
RH0Initial relative humidity
T Temperature
T0Initial temperature
TTime
u Velocity vector
u0Initial velocity vector
uVelocity component in the x direction
vVelocity component in the y direction
wVelocity component in the z direction
Y α Mass fraction of species α
Yair,0Initial mass fraction of air
Ysoot,0Initial mass fraction of soot
α Fire growth coefficient
ΔhHeat of combustion
εEmissivity
ρ Density
τ i j Viscous stress tensor

References

  1. Khan, E.A.; Ahmed, M.A.; Khan, E.H.; Majumder, S.C. Fire Emergency Evacuation Simulation of a shopping mall using Fire Dynamic Simulator (FDS). J. Chem. Eng. 2017, 30, 32–36. [Google Scholar] [CrossRef] [Green Version]
  2. Stefanidou, M.; Athanaselis, S.; Spiliopoulou, C. Health impacts of fire smoke inhalation. Inhal. Toxicol. 2008, 20, 761–766. [Google Scholar] [CrossRef] [PubMed]
  3. Thompson, O.F.; Galea, E.R.; Hulse, L.M. A review of the literature on human behaviour in dwelling fires. Saf. Sci. 2018, 109, 303–312. [Google Scholar] [CrossRef]
  4. Xiong, L.; Bruck, D.; Ball, M. Preventing accidental residential fires: The role of human involvement in non-injury house fires. Fire Mater. 2017, 41, 3–16. [Google Scholar] [CrossRef] [Green Version]
  5. Mihailidou, E.K.; Antoniadis, K.D.; Assael, M.J. The 319 major industrial accidents since 1917. Int. Rev. Chem. Eng. 2012, 4, 529–540. [Google Scholar]
  6. Miller, I. Human Behaviour Contributing to Unintentional Residential Fire Deaths, 1997–2003; New Zealand Fire Service Commission, 2005; Available online: https://fireandemergency.nz/assets/Documents/Research-and-reports/Report-47-Human-Behaviour-Contributing-to-Unintentional-Residential-Fire-Deaths-1997-2003.pdf (accessed on 30 July 2020).
  7. Shen, T.-S.; Huang, Y.-H.; Chien, S.-W. Using fire dynamic simulation (FDS) to reconstruct an arson fire scene. Build. Environ. 2008, 43, 1036–1045. [Google Scholar] [CrossRef]
  8. Hu, L.H.; Huo, R.; Li, Y.Z.; Wang, H.B.; Chow, W.K. Full-scale burning tests on studying smoke temperature and velocity along a corridor. Tunn. Undergr. Space Technol. 2005, 20, 223–229. [Google Scholar] [CrossRef]
  9. Barillo, D.J.; Goode, R. Fire fatality study: Demographics of fire victims. Burns 1996, 22, 85–88. [Google Scholar] [CrossRef]
  10. Antonio, A.C.P.; Castro, P.S.; Freire, L.O. Smoke inhalation injury during enclosed-space fires: An update. J. Bras. Pneumol. 2013, 39, 373–381. [Google Scholar] [CrossRef] [Green Version]
  11. Black, W.Z. Smoke movement in elevator shafts during a high-rise structural fire. Fire Saf. J. 2009, 44, 168–182. [Google Scholar] [CrossRef]
  12. Qin, T.X.; Guo, Y.C.; Chan, C.K.; Lin, W.Y. Numerical simulation of the spread of smoke in an atrium under fire scenario. Build. Environ. 2009, 44, 56–65. [Google Scholar] [CrossRef]
  13. Klote, J.H.; Ferreira, M.J.; Kashef, A.; Turnbull, P.G.; Milke, J.A. Handbook of Smoke Control Engineering; American Society of Heating Refrigerating and Air-Conditioning Engineers: Atlanta, GA, USA, 2012; ISBN 1936504243. [Google Scholar]
  14. Anseeuw, K.; Delvau, N.; Burillo-Putze, G.; De Iaco, F.; Geldner, G.; Holmström, P.; Lambert, Y.; Sabbe, M. Cyanide poisoning by fire smoke inhalation: A European expert consensus. Eur. J. Emerg. Med. 2013, 20, 2–9. [Google Scholar] [CrossRef] [PubMed]
  15. Król, M.; Król, A. Multi-criteria numerical analysis of factors influencing the efficiency of natural smoke venting of atria. J. Wind Eng. Ind. Aerodyn. 2017, 170, 149–161. [Google Scholar] [CrossRef]
  16. Abotaleb, H.A. Numerical study on smoke exhaust system in a mall with mechanical make-up techniques. Alexandria Eng. J. 2018, 57, 2961–2974. [Google Scholar] [CrossRef]
  17. Yuen, A.C.Y.; Chen, T.B.Y.; Yang, W.; Wang, C.; Li, A.; Yeoh, G.H.; Chan, Q.N.; Chan, M.C. Natural ventilated smoke control simulation case study using different settings of smoke vents and curtains in a large Atrium. Fire 2019, 2, 7. [Google Scholar] [CrossRef] [Green Version]
  18. Gupta, K.; Mehrotra, M.; Kumar, P.; Gogia, A.R.; Prasad, A.; Fisher, J.A. Smoke inhalation injury: Etiopathogenesis, diagnosis, and management. Indian J. Crit. Care Med. Peer-Rev. Off. Publ. Indian Soc. Crit. Care Med. 2018, 22, 180. [Google Scholar] [CrossRef]
  19. Chen, T.B.Y.; Yuen, A.C.Y.; Yeoh, G.H.; Timchenko, V.; Cheung, S.C.P.; Chan, Q.N.; Yang, W.; Lu, H. Numerical study of fire spread using the level-set method with large eddy simulation incorporating detailed chemical kinetics gas-phase combustion model. J. Comput. Sci. 2018, 24, 8–23. [Google Scholar] [CrossRef]
  20. Qin, T.X.; Guo, Y.C.; Chan, C.K.; Lin, W.Y. Numerical investigation of smoke exhaust mechanism in a gymnasium under fire scenarios. Build. Environ. 2006, 41, 1203–1213. [Google Scholar] [CrossRef]
  21. McGrattan, K.; Hostikka, S.; McDermott, R.; Floyd, J.; Vanella, M.; Weinschenk, C.; Overholt, K. Fire Dynamics Simulator Technical Reference Guide Volume 2: Verification, 6th ed.; National Institute of Standards and Technology (NIST): Gaithersburg, MD, USA, 2017. [Google Scholar]
  22. Zalok, E.; Hadjisophocleous, G.V. Assessment of the use of fire dynamics simulator in performance-based design. Fire Technol. 2011, 47, 1081–1100. [Google Scholar] [CrossRef]
  23. Gutiérrez-Montes, C.; Sanmiguel-Rojas, E.; Viedma, A.; Rein, G. Experimental data and numerical modelling of 1.3 and 2.3 MW fires in a 20 m cubic atrium. Build. Environ. 2009, 44, 1827–1839. [Google Scholar] [CrossRef] [Green Version]
  24. Xiao, B. Comparison of numerical and experimental results of fire induced doorway flows. Fire Technol. 2012, 48, 595–614. [Google Scholar] [CrossRef]
  25. McGrattan, K.; Hostikka, S.; McDermott, R.; Floyd, J.; Weinschenk, C.; Overholt, K. Fire Dynamics Simulator Technical Reference Guide Volume 3: Validation, 6th ed.; National Institute of Standards and Technology (NIST): Gaithersburg, MD, USA, 2017. [Google Scholar]
  26. Ayala, P.; Cantizano, A.; Gutiérrez-Montes, C.; Rein, G. Influence of atrium roof geometries on the numerical predictions of fire tests under natural ventilation conditions. Energy Build. 2013, 65, 382–390. [Google Scholar] [CrossRef]
  27. Liu, Y.; Moser, A.; Sinai, Y. Comparison of a CFD fire model against a ventilated fire experiment in an enclosure. Int. J. Vent. 2004, 3, 169–181. [Google Scholar] [CrossRef]
  28. Hasib, R.; Kumar, R.; Kumar, S. Simulation of an experimental compartment fire by CFD. Build. Environ. 2007, 42, 3149–3160. [Google Scholar] [CrossRef]
  29. Barsim, M.M.; Bassily, M.A.; El-Batsh, H.M.; Rihan, Y.A.; Sherif, M.M. Numerical simulation of an experimental atrium fires in combined natural and forced ventilation by CFD. Int. J. Vent. 2020, 19, 1–24. [Google Scholar] [CrossRef]
  30. Meroney, R.N. Wind effects on atria fires. J. Wind Eng. Ind. Aerodyn. 2011, 99, 443–447. [Google Scholar] [CrossRef]
  31. Gutiérrez-Montes, C.; Sanmiguel-Rojas, E.; Kaiser, A.S.; Viedma, A. Numerical model and validation experiments of atrium enclosure fire in a new fire test facility. Build. Environ. 2008, 43, 1912–1928. [Google Scholar] [CrossRef] [Green Version]
  32. Lapuerta, C.; Suard, S.; Babik, F.; Rigollet, L. Validation process of ISIS CFD software for fire simulation. Nucl. Eng. Des. 2012, 253, 367–373. [Google Scholar] [CrossRef]
  33. Suard, S.; Koched, A.; Pretrel, H.; Audouin, L. Numerical simulations of fire-induced doorway flows in a small scale enclosure. Int. J. Heat Mass Transf. 2015, 81, 578–590. [Google Scholar] [CrossRef]
  34. Pretrel, H.; Suard, S.; Audouin, L. Experimental and numerical study of low frequency oscillatory behaviour of a large-scale hydrocarbon pool fire in a mechanically ventilated compartment. Fire Saf. J. 2016, 83, 38–53. [Google Scholar] [CrossRef]
  35. Shih, C.; Chen, Y.; Su, C.; Wang, S.; Yang, Y. Analysis of makeup air in a natural smoke vent system in a tall space using numerical simulation and Schlieren technique. Int. J. Numer. Methods Heat Fluid Flow 2019. [Google Scholar] [CrossRef]
  36. Hagglund, B. Effects of Inlets on Natural Fire Vents: An Experimental Study; DIANE Publishing: Stockholm, Sweden, 1996; ISBN 0788137298. [Google Scholar]
  37. Huang, Y.; Chen, X.; Zhang, C. Numerical simulation of the variation of obscuration ratio at the fire early phase with various soot yield rate. Case Stud. Therm. Eng. 2020, 18, 100572. [Google Scholar] [CrossRef]
  38. Tan, T.; Yu, L.; Ding, L.; Gao, Z.; Ji, J. Numerical investigation on the effect of ambient pressure on mechanical smoke extraction efficiency in tunnel fires. Fire Saf. J. 2020, 103136. [Google Scholar] [CrossRef]
  39. Wang, K.; Cai, W.; Zhang, Y.; Hao, H.; Wang, Z. Numerical simulation of fire smoke control methods in subway stations and collaborative control system for emergency rescue. Process Saf. Environ. Prot. 2021, 147, 146–161. [Google Scholar] [CrossRef]
  40. McGrattan, K.; Hostikka, S.; McDermott, R.; Floyd, J.; Vanella, M. Fire Dynamics Simulator: User’s Guide, 6th ed.; National Institute of Standards and Technology (NIST): Gaithersburg, MD, USA, 2017. [Google Scholar]
  41. Wang, L.; Lim, J.; Quintiere, J.G. On the prediction of fire-induced vent flows using FDS. J. Fire Sci. 2011, 30, 110–121. [Google Scholar] [CrossRef]
  42. Rehm, R.G.; Baum, H.R. The equations of motion for thermally driven, buoyant flows. J. Res. NBS 1978, 83, 297–308. [Google Scholar] [CrossRef]
  43. Deardorff, J.W. Stratocumulus-capped mixed layers derived from a three-dimensional model. Boundary-Layer Meteorol. 1980, 18, 495–527. [Google Scholar] [CrossRef]
  44. McGrattan, K.; Hostikka, S.; McDermott, R.; Floyd, J.; McDermott, R.; Vanella, M. Fire Dynamics Simulator Technical Reference Guide Volumes 1: Mathematical Model, 6th ed.; National Institute of Standards and Technology, Building and Fire Research: Gaithersburg, MD, USA, 2017. [Google Scholar]
  45. Chisum, W.J.; Turvey, B.E. Crime Reconstruction; Academic Press: Waltham, MA, USA, 2011; ISBN 0123864615. [Google Scholar]
  46. Maevski, I.Y. Design Fires in Road Tunnels; National Academy of Sciences: Washington, DC, USA, 2011; ISBN 0309143306. [Google Scholar]
  47. Wu, G.-Y.; Chen, R.-C. The analysis of the natural smoke filling times in an atrium. J. Combust. 2010, 2010. [Google Scholar] [CrossRef] [Green Version]
  48. Hurley, M.J.; Rosenbaum, E.R. Performance-Based Fire Safety Design; CRC Press: Boca Raton, FL, USA, 2015; ISBN 1482246562. [Google Scholar]
  49. Harlow, F.H.; Welch, J.E. Numerical calculation of time-dependent viscous incompressible flow of fluid with free surface. Phys. Fluids 1965, 8, 2182–2189. [Google Scholar] [CrossRef]
  50. Hurley, M.J.; Gottuk, D.T.; Hall, J.R., Jr.; Harada, K.; Kuligowski, E.D.; Puchovsky, M.; Watts, J.M., Jr.; WIECZOREK, C.J. SFPE Handbook of Fire Protection Engineering; Springer: New York, NY, USA, 2015; ISBN 1493925652. [Google Scholar]
  51. Yang, J.; Wong, M.S.; Menenti, M.; Nichol, J. Modeling the effective emissivity of the urban canopy using sky view factor. ISPRS J. Photogramm. Remote Sens. 2015, 105, 211–219. [Google Scholar] [CrossRef]
  52. Tewarson, A. Generation of heat and gaseous, liquid, and solid products in fires. In The SFPE Handbook of Fire Protection Engineering; Springer: New York, NY, USA, 2008; Volume 4, pp. 3–109. [Google Scholar]
  53. de Freitas Rocha, M.A.; Landesmann, A. Combustion properties of Brazilian natural wood species. Fire Mater. 2016, 40, 219–228. [Google Scholar] [CrossRef]
  54. Alpert, R.L. Ceiling jet flows. In SFPE handbook of Fire Protection Engineering; Springer: New York, NY, USA, 2016; pp. 429–454. [Google Scholar]
  55. Sinclair, R. CFD simulation in atrium smoke management system design. ASHRAE Trans. 2001, 107, 711. [Google Scholar]
Figure 1. Physical domain under study (a) top view, (b) section A-A and (c) isometric view with transparent front wall.
Energies 13 06000 g001aEnergies 13 06000 g001b
Figure 2. Details of the numerical mesh used in the simulations.
Energies 13 06000 g002
Figure 3. Boundary conditions used in the numerical simulation.
Energies 13 06000 g003
Figure 4. Location details of the temperature and soot mass fraction measurement points inside the system.
Energies 13 06000 g004
Figure 5. Mesh convergence analysis for case 6: (a) smoke layer displacement; (b) average temperature profile at t = 600 s; (c) average exhaust volumetric flow rate and (d) HRR.
Energies 13 06000 g005aEnergies 13 06000 g005b
Figure 6. Influence of the natural exhaust area in the (a) smoke layer vertical displacement; (b) average temperature profile at t = 600 s; (c) average exhaust volumetric flow rate and (d) HRR (compartment with closed windows and HRR = 900 kW).
Energies 13 06000 g006aEnergies 13 06000 g006b
Figure 7. Influence of the natural exhaust area in the (a) smoke layer vertical displacement; (b) average temperature profile at t = 600 s; (c) average exhaust volumetric flow rate and (d) HRR (compartment with open windows and HRR = 900 kW).
Energies 13 06000 g007aEnergies 13 06000 g007b
Figure 8. Temperature distribution in an xz plane that crosses two exhaust vents (y = 3.75 m) for different time periods (case 6).
Energies 13 06000 g008
Figure 9. Influence of the HRR in the (a) smoke layer vertical displacement; (b) average temperature profile at t = 600 s; (c) average exhaust volumetric flow rate and (d) HRR (compartments with natural exhaust areas of 9.00 m2).
Energies 13 06000 g009
Figure 10. Influence of the smoke curtain in the (a) smoke layer vertical displacement; (b) average temperature profile at t = 600 s; (c) average exhaust volumetric flow rate and (d) HRR (compartments with natural exhaust areas of 9.00 m2, closed windows and HRR = 225 kW).
Energies 13 06000 g010aEnergies 13 06000 g010b
Figure 11. Pressure field in a plane that crosses two exhaust vents (y = 3.75 m) at time t = 600 s (case 9).
Energies 13 06000 g011
Figure 12. Velocity vector field in a plane that crosses two exhaust vents (y = 3.75 m) at time t = 600 s (case 9).
Energies 13 06000 g012
Figure 13. Influence of the smoke curtain in the (a) smoke layer vertical displacement; (b) average temperature profile at t = 600 s; (c) average exhaust volumetric flow rate and (d) HRR (compartments with natural exhaust areas of 9.00 m2, open windows and HRR = 225 kW).
Energies 13 06000 g013aEnergies 13 06000 g013b
Figure 14. Pressure field in a plane that crosses two exhaust vents (y = 3.75 m) at time t = 600 s (case 10).
Energies 13 06000 g014
Figure 15. Velocity vector field in a plane that crosses two exhaust vents (y = 3.75 m) at time t = 600 s (case 10).
Energies 13 06000 g015
Figure 16. Influence of the mechanical exhaust system in the (a) smoke layer vertical displacement; (b) average temperature profile at t = 600 s; (c) average exhaust volumetric flow rate and (d) HRR (compartment with open windows and HRR = 900 kW).
Energies 13 06000 g016
Table 1. Initial condition for the problem under study.
P0 (Pa)T0 (°C)RH0 (%)u0 (m/s)Yair,0 (-)Ysoot,0 (-)
101,3252870010
Table 2. Thermo-physical properties of materials used in the simulations.
ParameterMaterialSource
ConcreteWood (Fuel)
ρ (kg/m3)2100-[50]
cp (kJ/(kg·K))0.88-[50]
k (W/(m·K))1.37-[50]
ε (-)0.92-[51]
ysoot (kg/kg)-0.0015[52]
yCO (kg/kg)-0.004[52]
Δh-16,400[52]
HRRPUA (kW/m2)-100[53]
Table 3. Cases studied numerically in this research.
CaseDoor
(2.20 m2)
Windows
(6.80 m2 Total)
Exhaust SystemSmoke CurtainHRR
(kW)
a *
(m)
b *
(m)
1OpenClosedWithoutWithout9000.003.0
2OpenOpenWithoutWithout9000.003.0
3OpenClosedNatural (2.25 m2 total)Without9000.753.0
4OpenClosedNatural (9.00 m2 total)Without9001.503.0
5OpenOpenNatural (2.25 m2 total)Without9000.753.0
6OpenOpenNatural (9.00 m2 total)Without9001.503.0
7OpenClosedNatural (9.00 m2 total)Without2251.501.5
8OpenOpenNatural (9.00 m2 total)Without2251.501.5
9OpenClosedNatural (9.00 m2 total)With2251.501.5
10OpenOpenNatural (9.00 m2 total)With2251.501.5
11OpenOpenMechanical (18.00 m3/h total)Without9001.503.0
12OpenOpenMechanical (36.00 m3/h total)Without9001.503.0
* Geometrical parameters a and b are specified in the Figure 1.
Table 4. Characteristics of the analyzed meshes.
MeshNumber of Elements in Each DirectionTotal Number of ElementsElement Size (cm)
M1320 × 170 × 804,352,00010.00
M2224 × 119 × 561,492,73614.26
M3160 × 85 × 40544,00020.00
M4128 × 68 × 32378,52825.00
Publisher’s Note: MDPI stays neutral with regard to jurisdictional claims in published maps and institutional affiliations.

