Abstract
The achievement of climate neutrality and eco-economic decoupling requires explicit measures to reduce greenhouse gases (GHG) emissions and to implement circular economy (CE) principles in practice. The energy sector is of particular importance in meeting these challenges because it exerts a substantial environmental impact. Therefore, it is extremely important to determine how essential GHG and CE issues are for companies operating in the energy sector. This can be reflected in corporate strategies, but it can also be disclosed to the public in sustainability reports. For this reason, this article presents a comprehensive analysis of sustainability reports based on the latest GRI Standards published by companies representing the energy sector in the European Union to determine the existence, quality, and specificity of reporting GHG and CE issues. The research results demonstrate that sustainability reports from the energy sector companies tend to focus more on GHG issues. They rarely point to actions related to CE, including actions enabling a reduction in GHG emissions, as those with high priority. In addition, declarations from the analyzed companies regarding intentions related to GHG and CE issues at the strategic level find a rather poor reflection in the description of specific actions in this area or in demonstrating appropriate indicators at the operational level. Considering the indicators included in the reports, the analyzed companies insufficiently describe the methods they use to gather, compile, and analyze information on the effectiveness of actions taken to address GHG and CE issues. As for the identification of potential determinants of the quality of reporting GHG and CE issues, the research results indicate that it is mostly influenced by external assurance and the report option. Sustainability reports submitted for external assurance and reports with the comprehensive option are significantly more developed than other types of reports. However, the clarity of reports with the core option is higher compared to the comprehensive group. In addition, it was indicated that the clarity of stand-alone reports is higher compared to other types of reports.
1. Introduction
Climate change resulting from the emission of a significant amount of greenhouse gases (GHG), the depletion of non-renewable resources, and the increasing amount of waste is among the most serious challenges the world is facing today. Its occurrence increasingly affects people, ecosystems, and the functioning of economic operators, threatening their safety and stability. For this reason, the international community is constantly looking for solutions to help reduce GHG, tackle climate change, prevent the excessive depletion of resources, and reduce the amount of waste generated.
Statistics show that the European Union (EU) is the third biggest GHG emitter (after China and the United States) [1]. Acknowledging that climate change can have a number of serious consequences, the EU has adopted a series of ambitious climate and energy targets in recent years [2,3,4]. Their implementation will enable the EU economy to achieve climate neutrality by 2050 (i.e., it will become an economy with net zero GHG). The European Commission assumes that achieving this goal will be possible provided that the following actions are taken [4]:
- maximizing energy efficiency, including effective energy management in buildings;
- maximizing the use of renewable energy sources;
- implementing the principles of clean, safe, and connected mobility;
- implementing the concept of circular economy (CE) as a key factor in reducing GHG emissions;
- developing an appropriate intelligent network infrastructure and interconnections;
- harnessing the bioeconomy and creating the necessary carbon sinks;
- tackling residual CO2 emissions through carbon capture and storage (CCS).
The energy sector, which in 2018 was responsible for over 83% of GHG emissions produced in the EU, will have a key role in the transition to a climate neutral economy. The companies of this economic sector were obliged many years ago to implement measures to reduce GHG emissions, which resulted in declining GHG emissions in this sector. However, in order to achieve climate neutrality in 2050, further actions in the energy sector are necessary to increase the level of decarbonization of the energy production process, increase the use of carbon-free energy sources, develop energy-efficient technologies, and increase the use of carbon capture and sequestration/utilization/storage where GHG have not been prevented or reduced otherwise [5].
Meanwhile, the energy sector may apply the principles of the circular economy (CE), which have been identified in the long-term vision as key activities contributing to the reduction of GHG and ensuring the competitiveness of the EU economy [4]. This is ever more important because in 2020 the EU has adopted a new Circular Economy Action Plan [6]. The aim of CE concept is to maintain the value of products, materials, and resources as long as possible based on transition from a linear economic model (“take-make-dispose”) to a circular model (“take-make-re-use”) [7,8]. Applying the CE principles in the energy sector may encompasses [9]:
- efficiently using natural resources by reducing energy production based on non-renewable resources and increasing the production of energy from renewable sources;
- increasing the level of utilization of side streams and waste generated in the energy production process;
- reducing the energy losses occurring during its transmission thanks to the modernization of power grids;
- increasing the recycling of materials generated during the modernization of power plants and energy grids (for the use of secondary raw materials contained in them);
- increasing the utilization of excess energy and heat generated in production units in other industries through their receiving and transmission to the power grids;
- increasing the utilization of excess energy and heat generated by end energy consumers by connecting the micro-installations with the power grid;
- striving to replace products with a service.
The achievement of climate neutrality by the EU will be possible, provided that companies, especially in the energy sector, continue to take measures to reduce GHG emissions. The same applies to the practical implementation of the CE principles. Therefore, it becomes important to determine to what extent GHG and CE issues are considered essential by energy sector companies. It is believed that these issues should be included not only in the corporate strategies but also publicly disclosed, voluntarily or obligatorily (i.e., in accordance with Directive 2013/34/EU [10]) as a part of sustainability reporting.
In recent years, sustainability reporting has attracted growing interest from academics, business representatives, and policy makers constituting a key platform for communicating economic, environmental, and social performance as well as impacts caused by everyday activities of organizations. It can be considered as synonymous with other non-financial reporting terms such as corporate social responsibility reporting or triple bottom line reporting. There are different guidelines for sustainability reporting: GRI Sustainability Reporting Standards [11], the OECD Guidelines for Multinational Enterprises [12], the UN Global Compact (Communication on Progress) [13], and the ISO 26000 (International Standard for Social Responsibility) [14]. However, the GRI Standards seem to be the most trusted and widely used all around the world. These standards enable organizations to understand, measure, and assess sustainability performance and disclose the relevant results in a similar way. They are focused on disclosures related to material topics that reflect reporting organizations’ significant impacts (positive or negative) on the economy, environment, and/or society or that significantly influences the assessments and decisions of stakeholders [11].
The range of evaluative information, including performance reporting such as sustainability reports, is still increasing. However, the notion of quality and the quality of evaluative information is multifaceted and contested [15]. This is because quality may in this respect be related to a specific product (i.e., the technical quality of the information), a specific process (i.e., the quality of the process applied to obtain the information), as well as the usefulness of the generated and disclosed information [16]. The problems related to the quality of sustainability reports are investigated fairly often, but studies in this research area hardly ever concentrate exclusively on the energy sector. In addition, although various publications on sustainability reports from the energy sector have been published in recent years, studies on GHG and CE issues are still scarce. In particular, this is due to the scarcity of research on the implementation of the latest GRI Standards. For this reason, this article presents an analysis of sustainability reports based on the latest GRI Standards guidelines published by companies representing energy sector in the EU to determine the existence, quality, and specificity of disclosures concerning GHG and CE issues. To the best of our knowledge such research has not been performed until now, and those that have been published on this subject so far, assessed reports that were prepared before 2018, when the concept of transition to a climate-neutral economy was adopted. The aims of the performed analyses were:
- to identify whether and to what extent energy sector companies include issues related to GHG and CE in sustainable reports;
- to assess the quality of reporting GHG and CE issues in sustainable reports of energy sector companies;
- to determine factors influencing the quality of reporting GHG and CE issues in the energy sector.
The remainder of this article is organized as follows: Section 2 presents the results of the literature review that especially explored the existing research on the quality assessment of sustainability reports of energy sector companies, with particular emphasis on GHG and CE issues. The research methodology is described in detail in Section 3. Section 4 shows and discusses the results of the statistical analysis of collected data, including descriptive statistics of relevant variables and comparative statistical analysis. Section 5 summarizes this article with conclusions and indicates possible directions for future research and limitations.
2. Literature Review
In order to facilitate the achievement of the aims established in this study, it was necessary to develop the theoretical background concerning: (1) the identification of the foremost research topics related to GHG issues in the energy sector, (2) the indication of publications concerning CE issues in the energy sector, (3) the analysis of existing research on quality assessment of sustainability reporting in the energy sector, (4) the exploration of studies that cover GHG and CE issues in sustainability reports of energy sector companies, and (5) an overview of selected factors affecting quality of sustainability reporting.
The performed literature review indicates that the main sources of GHG emissions in the energy sector are combustion processes and energy losses occurring at the stage of energy production and distribution [17,18,19,20]. Due to the considerable share of the energy sector companies in GHG emissions and the significance of the emission impact on human life, the reduction in the emissions has become the main subject of many systematic and complex studies. It should be noted that the reduction in GHG emissions is often equated with the concepts of decarbonization, carbon footprint minimization, and low-carbon, zero-carbon, or carbon neutral power generation [21,22,23,24]. More in-depth analyses were carried out to determine specific actions to reduce GHG emissions in the energy sector [17,18]. The studies also point to the possibility of reducing GHG emissions in combustion processes that cannot be eliminated by using the carbon capture and storage (CCS) technology [25,26]. Nevertheless, the recent studies indicate the particular position of the comprehensive assessment of innovative solutions reducing GHG emissions based on lifecycle considerations [23,27,28]. In addition, optimization modeling techniques for sustainable energy systems to mitigate energy related GHG emissions are of particular importance [19]. GHG emissions cause unfavorable changes in the environment, which has a negative influence on the global economy and economic situation and prospects of individual countries. This significant research stream is focused on the forecasts concerning the effects of GHG impact and possible methods of the energy sector transformation [12,29,30,31,32]. An unequivocal conclusion from to-date research is that the main direction of the energy industry transformation is to increase the share of renewable energy sources in the energy mix. However, the volume of GHG emissions varies depending on the type of renewable energy sources [23,24,27,33].
Although the importance of the CE concept in the energy sector is more and more emphasized, the literature review points out that so far there have been few publications describing the implementation of CE principles in the energy sector. There are noteworthy reports prepared by the Deloitte team from Finland [9,34] which characterize CE principles that would enable the move from a linear to a circular model in the energy sector, including some examples of CE activities introduced by Finnish energy companies. There are also publications evaluating the readiness of energy companies to transition to a circular economy and discussing the issue of waste management from coal combustion as part of the CE concept. In this line of research, Bielecka and Kulczycka (2020) verified the readiness of the seven coal-fired power plants located in Poland to implement CE models for coal combustion products management [35]. Using a comparative analysis, Rosiek (2018) estimated the economic, social, and environmental benefits of introducing CE in the sector of coal combustion products, including those generated during the production of energy and heat in power plants [36]. Moreover, Gosh and Kumar (2020) presented several innovative uses of fly ash as part of the implementation of the CE concept [37]. Another group of research on the CE concept application in the energy sector is focused on specific aspects of renewable energy production methods (e.g., [38,39]). There are also studies investigating the industrial symbiosis between various entities, which allows for the use of energy excess and side streams generated in power plants and other industries, which is one of the principles of implementing the CE concept [40,41]. The last group of research in this area evaluates the effectiveness of introducing CE principles by companies in the energy sector (e.g., [42]).
The existing studies on sustainability reporting are remarkably diverse in terms of their subject and scope. It is noticeable that the vast majority of this research is qualitative and is based on content analysis. Nevertheless, many studies in this area cover small samples and concentrate on individual countries. Analyzing the research that cover the energy sector, we can distinguish studies concerning different sectors with energy being one of them, well as a few studies focused solely on the energy sector. A general overview of the research identified in this domain is presented in Table A1 in the Appendix A. The studies covering different sectors most often have general conclusions and do not take into account the characteristics of individual sectors such as energy [43,44,45,46,47,48,49,50,51,52,53,54,55]. However, among this type of research there are also exceptions, allowing conclusions to be drawn regarding the specificity and quality of sustainability reporting in the energy sector [56,57,58,59,60,61,62,63]. Considering the studies focused solely on the energy sector, various research approaches, different assessment subjects and samples types and size have been adopted. Regarding research focused on a single country, Chang (2013) [64] assessed environmental information disclosures included in social responsibility reports published by Chinese electric firms. Moseñe et al. (2013) [65] compared levels of compliance with GRI environmental indicators in sustainability reports of Spanish wind energy companies. Using exploratory and comparative study, Camargos et al. (2014) [66] analyzed application of the GRI-G3 guidelines and indicators in sustainability reports of Brazilian companies from electric utilities sector. In order to assess the sustainability performance of electricity power industry in Brazil, Sartori et al. (2017) [67] applied data envelopment analysis making use of indicators from GRI reports. Taking into account research composed of multi-country samples, Alrazi et al. (2010) [68] assessed the quality of environmental information reporting published by electric utilities companies from worldwide countries. Bakhtina and Goudriaan (2011) [69] focused on the employment issues in CSR reports of large multinational energy companies. Based on the annual reports of global independent power producers, Ng and Nathwani (2012) [70] conducted a comparative case study implementing a sustainability performance scorecard. Steinweg and Wilde-Ramsing (2012) [71] applied a GRI content index template to overview the use of the GRI guidelines in CSR/sustainability reports and associated websites of European electric utility companies. The content analysis and logic and conversation theory were used by Slacik and Greiling (2019) [72] to explore the coverage and quality of documented material aspects in sustainability reports (based on GRI-G4 guidelines) published by English and German electric utility companies. In addition, the same authors assessed the sustainability reporting practices and coverage rates of G4-indicators included in sustainability reports (GRI-G4) published by electric utilities companies representing several dozen countries [73]. In turn, documentary analysis was applied by Traxler and Greiling (2019) [74] to evaluate the coverage of GRI indicators included in sustainability reports (GRI-G4) disclosed by electric utility companies worldwide.
It should be noted that there are also studies focusing on GHG issues within the sustainability reports of energy sector companies. Based on qualitative and inductive content analysis, Talbot and Boiral (2018) [75] investigated the impression management strategies and quality of climate information disclosed in sustainability reports (G3 or G3.1 guidelines) of 21 worldwide energy companies. Kraft (2018) [76] investigated the climate disclosure strategies in electric utilities in response to specific market characteristics. Alrazi et al. (2014) [77] performed a quantitative and qualitative assessment of carbon-related information included in annual reports, stand-alone sustainability reports, and websites of 9 Malaysian major power producers. A similar research by Alrazi et al. (2016) [78] focused on the quality of CO2 emissions information disclosed by 205 electricity generation companies from 35 worldwide countries. In addition, based on the carbon disclosure index, Bahari et al. (2016) [79] examined the extent of carbon information in reports published by 90 electricity generating companies representing top GHG emitting countries in Asia (i.e., China, India, and Japan). Considering CE issues in sustainability reports of energy sector companies, to the best of our knowledge, there have been no in-depth analyses in this area so far.
The studies performed so far indicate that there are various factors affecting the quality of sustainability reporting. Companies that operate in multiple organizational fields are subject to complex regulatory regimes [80]. Therefore, industries may differ in terms of potential benefits from CSR initiatives [81]. Recent studies confirmed industry-level differences in sustainability reporting [56]. In particular, this is the issue for companies operating in environmentally sensitive sectors [45,48,49,52,82]. However, regardless of the industry related environmental risk and sensitivity, Outtes-Wanderley et al. (2008) indicated that companies representing the energy sector, banking, and telecommunications provide the highest quality CSR information disclosure [83]. The involvement of companies in international markets is expected to force them to disclose more information [84]. Nevertheless, studies on this topic provide mixed findings. Some researchers found that companies with international market orientation are more likely to report CSR issues [85], but others have not found a relation between area of activity (i.e., domestic or international) and sustainability reporting quality [48,73]. There is also growing number of studies focused on ‘mandatory against voluntary’ non-financial disclosure issues, in particular in the context of the Directive 2014/95/EU requirements. It is suggested that mandatory regulations may enforce compliance of disclosures [86] and recent research confirms the role of legal requirements in improving the quality of non-financial information [87]. The recent studies indicate dynamic increase in the number of stand-alone sustainability reports, in particular among the largest firms [53]. Companies publish stand-alone reports to show their great commitment to sustainability issues [88], to signal their superior position in this area [89,90], or to provide higher quality information to adequately respond to public pressure [91]. However, it was found that stand-alone reports are not associated with overall quality index [53], and there are no indications that stand-alone reports are more credible than combined reports [52]. The prior literature provides evidence that external assurance of sustainability reports improves their credibility [92,93] and overall quality [50]. Moreover, auditor size and type affect the quality and amount of information in CSR disclosures [94,95]. Nonetheless, Michelon et al. (2015) found that external assurance is not associated with disclosure quality [53]. Voluntary standards are expected to achieve better reporting credibility, but an exaggerated focus on standards might be counterproductive of the aim of enhancing sustainability reporting [96]. Lock and Seele (2016) proved that CSR reports using standardized GRI guidelines are more credible than those without them. The high application levels also increase reports credibility [52]. However, Michelon et al. (2015) found that GRI Standards followers do not provide a higher quality of information [53].
The conducted review showed that although various publications on sustainability reporting in the energy sector have been published in recent years, the studies that cover GHG and CE issues are still rare in the literature. In addition, they focus on specific topics which undoubtedly requires expansion and updating due to the dynamism in the analyzed research domain. In particular, this is due to the scarcity of the research on implementation of the latest GRI Standards. Moreover, the quality of reporting GHG and CE issues and factors affecting the occurrence and scope of such disclosures of the energy sector companies operating in the EU seem to be very interesting and need to be further investigated.
3. Materials and Methods
In order to determine whether and how GHG and CE issues are included in the sustainability reports, an analysis of the sustainability reports published by companies representing the energy sector in the EU was carried out. The choice of the energy sector was due to the fact that this sector generates the most GHG of all sectors, and the use of the CE concept is more and more often indicated as one of the ways to reduce GHG emissions generated by energy companies and achieve climate neutrality in the EU by 2050.
The research presented in this article was carried out according to the following phases:
- Phase 1: Study design.
- Phase 2: Selection of the research sample.
- Phase 3: Data collection.
- Phase 4: Calculation of indicators to assess quality of reporting GHG and CE issues.
- Phase 5: Statistical analysis of collected data.
- Phase 6: Results interpretation and drawing conclusions.
The details of consecutive phases and particular steps of the research methodology adopted in this study are presented in Figure 1.
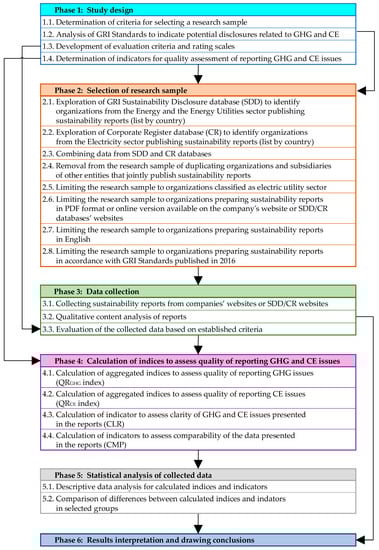
Figure 1.
Research methodology.
3.1. Study Design
At the beginning of the first phase of this research, the criteria for selecting reports analyzed and assessed in the subsequent phases were defined. It was assumed that the research sample will consist of the following reports:
- prepared by companies from the energy sector whose headquarters are located in the EU countries;
- prepared based on the up to date GRI Standards guidelines (which is due to the fact that the GRI guidelines are one of the most popular guidelines chosen by companies voluntarily or obligatorily reporting non-financial data);
- available in an English version (it was decided that in order to avoid a translation error all reports available only in the native language will be rejected);
- available in PDF format or online version on the company’s website or on websites where information on sustainability reports is collected.
It was decided that two databases would be used to achieve a suitable sample of sustainability reports prepared by companies from energy sector:
- GRI’s Sustainability Disclosure Database (SDD)—a global online database containing over 63,000 sustainability reports published by nearly 15,000 organizations (more than 38,000 reports were prepared in accordance with the GRI Standards guidelines);
- Corporate Register (CR)—a global online directory of corporate responsibility reports containing over 124,000 reports prepared by over 20,000 organizations.
Due to the fact that GRI guidelines published in 2016 became effective for reports published on or after 1 July 2018, it was decided that only reports published after that date would be selected for analysis. In addition, it was assumed that the latest report disclosed by companies during this period would be considered for further investigation. This choice resulted from the fact that in subsequent reports, companies often duplicate information presented in reports from previous years (i.e., the risk of duplicating assessments) and there is no uniformity in the frequency of publishing sustainability reports (i.e., the number of analyzed reports from each company would be different). The last issue taken into account during designing the sample selection criterion was the assumption that three main types of reports will be analyzed: sustainability/CSR reports, integrated reports, and annual reports. This choice was influenced by the fact that each type of these reports can be prepared in accordance with GRI guidelines and each company decides what type of report will be chosen considering the scope of data that it intends to voluntarily or obligatorily present.
In the next step, the GRI guidelines published in 2016 were analyzed to indicate how and where the information on GHG and CE issues may be disclosed in the reports prepared by companies from the energy sector. It should be noted that this analysis does not include new topic-specific standard—GRI 306: Waste released in 2020, because it will apply to reports published on or after 1 January 2022. For this reason, the previous thematic standard—GRI 306: Effluents and Waste—issued in 2016 was taken into account as the basis for the waste-related issues. As a result of the analysis of the GRI guidelines, the assessment criteria and relevant scoring scales were determined. A detailed description of the assessment criteria and scoring scales is presented in Section 3.3.
The last step in this phase was the determination of the approach to quality assessment of reporting GHG and CE issues in sustainability reports prepared by companies from the energy sector. Based on the review of literature on reporting quality assessment using scoring frameworks (e.g., [44,51,59,63,72,97,98]) it was decided that separate indices will be calculated to assess the quality of reporting GHG issues (QRGHG index) and quality of reporting CE issues (QRCE index). In addition, distinct indicators to assess clarity of reports (CLR) and comparability of data (CMP) presented in the analyzed reports were proposed. The formulas for calculating relevant indices and indicators are presented in Section 3.4.
3.2. Selection of the Research Sample
The selection of the research sample took place in January 2020. As mentioned earlier, two databases were used to search the information about organizations publishing sustainability reports: GRI’s Sustainability Disclosure Database (SDD) and Corporate Register (CR). In the first step of this phase, the GRI SDD was explored, using two sector names (i.e., Energy Sector and Energy Utilities Sector) as a search criteria and names of individual countries that are the EU members. The review identified 260 organizations that have so far published at least one sustainability report, of which 170 belonged to the Energy Sector and 90 to the Energy Utilities Sector. A similar review was carried out for the CR database, except that in this case only one business sector name was used as the search criteria (i.e., Electricity Sector) and the names of individual countries that are the EU members. As a result, 152 companies from the electricity sector that have published at least one sustainability report so far were identified.
In the next step, data from the SDD and CR databases were combined, which allowed for the removal of duplicated organizations from the research sample. In addition, considering that energy companies operating in different countries may be part of a multinational energy group, the websites of all gathered companies were searched to determine if the company is part of such a group. In such a situation, it was checked whether the given group prepares one sustainability report presenting the impact of all the organizations belonging to the group. If the answer was positive, then only the parent company remained in the research sample and the subsidiaries were removed. This solution allowed us to avoid duplicating assessments of the same reports content. Consequently, the research sample was limited to 326 organizations.
Due to the fact that both SDD and CR include companies involved in the exploration, refining, transportation, and sale of crude oil, natural gas, and petrochemical products among the companies belonging to the energy sector, in the next step the areas of activity of these companies were reviewed. It was found that these companies may have a different approach to reporting GHG and CE issues than companies involved in energy production and distribution, which was confirmed by the separately prepared GRI Sector Information for the energy utilities sector and oil and gas sector. Therefore, we decided to remove from the research sample companies from the oil and gas sector whose activity is in no way related to the production, distribution and sale of electricity, leaving only the electric utility companies, i.e., companies in the electric power industry that engage in electricity generation, transmission, distribution, and sales [99]. These companies may be engaged in all or some specific aspects of the industry. There were 228 such companies in the research sample.
In the next step, the companies’ websites were explored to check if a PDF format or an online version of the sustainability report was available. It turned out that only two companies from Finland, one company from Portugal, and one from Spain had no PDF format or online version available. For this reason, these organizations were excluded from further analysis. Then, it was verified whether an English version of the report was available. Unfortunately, as many as 101 organizations published their reports exclusively in their native language (mostly in Austria, Spain, and Italy). These reports were removed from the research sample to avoid translation errors.
The last step in this phase was to investigate whether relevant reports were prepared based on the GRI guidelines published in 2016. For this purpose, the information presented in the SDD and CR databases, as well as information on the company’s website or contained in sustainability reports, was verified again. On this basis, it was found that only 61 organizations from the energy sector in the EU publishing sustainability reports could be included in the final research sample. The quantitative data characterizing individual stages of the research sample selection are summarized in Table A2 in the Appendix A.
3.3. Data Collection
In the data collection phase, reports from all organizations included in the final research sample were obtained, then analyzed and assessed in accordance with established criteria. The latest available sustainability report was found for each organization from the research sample. The collection of reports took place in February and March 2020, however, in mid-April 2020, it was checked again for a newer version of the company’s sustainability report (due to the fact that at the beginning of April many organizations were publishing reports for the previous year). As a result, 61 reports were collected (in PDF format or online version available on the company’s website), of which 1 was published in 2018, 34 in 2019, and 26 in 2020. The most reports in the research sample came from Italy, Spain, Finland, and Poland. However, the research sample did not include any reports from Bulgaria, Cyprus, Denmark, Estonia, Luxembourg, Malta and Slovakia. Figure 2 shows the number of reports included in the research sample, divided into individual EU countries. In addition, a list of all collected and analyzed reports with more detailed information is provided in Table A3 in Appendix A.
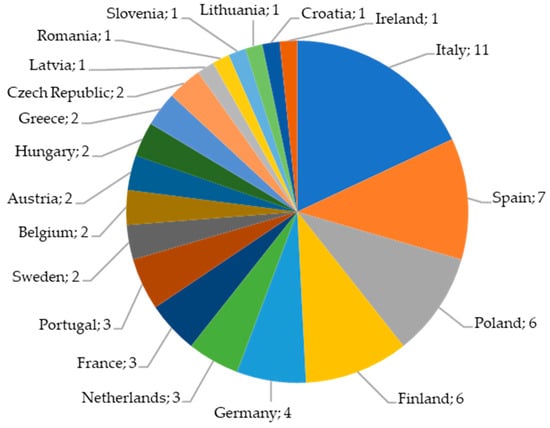
Figure 2.
Number of sustainability reports included in the research sample (by country).
Considering the reports included in the final research sample, it can be concluded that almost 66% of reports were prepared by large multinational energy groups, which include companies operating in various countries. Of the companies we studied, 56% were those that, apart from operating in key segments of the energy market, also conduct other activities (e.g., coal mining or natural gas production, distribution, and supply). As many as 75% of the companies included in the research sample are required to report non-financial data (including data on environmental impact) in accordance with the Directive 2014/95/EU [100]. Almost 61% of the companies publish separate sustainability/CSR reports while other organizations present data on sustainability issues in annual reports with sustainability/CSR sections or in integrated reports (combining information previously presented in a separate financial statement, management commentary, activity report, or sustainability/CSR report in a coherent whole). All reports were prepared based on the GRI Standards, of which almost 74% in core option, 15% in comprehensive option, and 11% as GRI-related (i.e., reports prepared in the format recommended by GRI Standards, but without any information on which option of the report was selected). Most of the reports (75%) were verified by external units providing a limited assurance independent engagement in accordance with ISAE 3000 or the AA1000 Assurance Standard (2008) with 2018 addendum. The main characteristics of the research sample are shown in Figure 3.
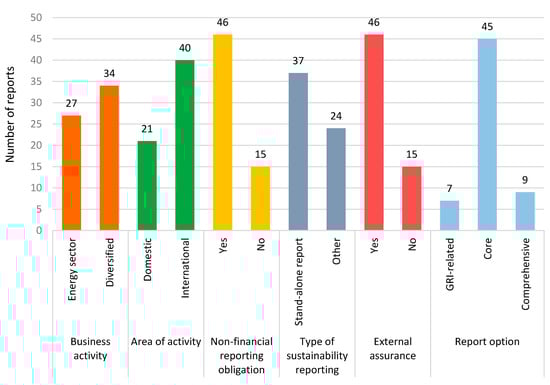
Figure 3.
Characteristic of research sample.
In the next step, the qualitative content analysis of each of the identified reports was carried out [46,101,102]. This approach makes it possible to assess what is disclosed and how it is done by analyzing the content using and scoring specific criteria [103]. It was used in the prior research to explore sustainability reporting practices and to determine sustainability reporting quality (e.g., [44,52,54,59,63,72,97,98,103,104]). In this study, qualitative content analysis was focused on the selected general and topic-specific disclosures included in GRI Standards identified as potentially related to GHG and CE issues. All observations for each report were classified and digitally stored together to formulate explicit conclusions and calculate relevant indices and indicators [105].
The final step in this phase was the assessment of the reports. In order to assess the quality of the analyzed sustainability reports a measurement system focused on relevant reporting practices was adopted comprising criteria specific to GHG and CE issues as well as general ones. These criteria were systematically identified based on the analysis of Universal Standards and Topic-specific Standards included in the GRI Standards guidelines published in 2016 [106], to determine the possible inclusion of GHG and CE issues. The following assessment criteria were established:
- Quality of reporting GHG issues (QRGHG), comprising:
- ○
- The occurrence of GHG issues at the strategic level (OSLGHG)—defined by their occurrence in the statement from senior decision-maker (Disclosure 102-14), key impacts, risks, and opportunities (Disclosure 102-15), list of material topics (Disclosure 102-47), explanation of the material topic and its boundary and the management approach and its components (Disclosure 103-1 and 103-2).
- ○
- The scope of information related to GHG issues (SIGHG)—measured by indicators concerning direct GHG emissions (Disclosure 305-1), energy indirect GHG emissions (Disclosure 305-2), other indirect GHG emissions (Disclosure 305-3), GHG emissions intensity (Disclosure 305-4), and reduction of GHG emissions (Disclosure 305-5).
- ○
- The accuracy of information related to GHG issues (AGHG)—based on description of the specific methods used to gather, compile, and analyze information related to disclosures on emissions (Disclosure 305-1, 305-2, 305-3, 305-4 and 305-5).
- Quality of reporting CE issues (QRCE), comprising:
- ○
- The occurrence of CE issues at the strategic level (OSLCE)—described by their occurrence in the statement from senior decision-maker (Disclosure 102-14), key impacts, risks, and opportunities (Disclosure 102-15), list of material topics (Disclosure 102-47), explanation of the material topic and its boundary, and the management approach and its components (Disclosure 103-1 and 103-2).
- ○
- The scope of information related to CE issues (SICE)—defined by indicators concerning materials used by weight or volume (Disclosure 301-1), recycled input materials used (Disclosure 301-2), energy consumption within the organization (Disclosure 302-1), energy consumption outside of the organization (Disclosure 302-2), energy intensity (Disclosure 302-3), reduction of energy consumption (Disclosure 302-4), and waste by type and disposal method (Disclosure 306-2).
- ○
- The accuracy of information related to CE issues (ACE)—based on description of the methods used to gather, compile, and analyze information related to disclosures on materials (Disclosure 301-1 and 301-1), energy (Disclosure 302-1, 302-2, 302-3 and 302-4) and waste (Disclosure 306-2).
- Clarity of reports (CLR)—based on the assessment of their content with regard to information available and required by stakeholders, the avoidance of excessive and unnecessary detail, possibilities of finding the specific information without unreasonable effort, the avoidance of technical terms or other content which may be unfamiliar to stakeholders, and the inclusion of relevant explanations.
- Comparability (CMP)—based on the assessment of the consistency of reported information and presentation of this information in a manner that empowers stakeholders to analyze changes over time, analytical comparisons on a year-to-year basis, including total numbers as well as ratios (e.g., normalized data per unit of production), and supporting analyses relative to other organizations.
Each criterion was assessed by using a 3-point scoring system similar to the scales applied in previous studies [63,71,107]. In general, depending in particular criterion the scale was as follows: 0—when relevant information for a specific disclosure topic was not mentioned or described, 1—when relevant information was partially provided or partially compliant with the disclosure requirements, and 2—when relevant information was compliant with the specific disclosure requirements. All analyzed sustainability reports were reviewed by three experts. In the case of discrepancies in the assessment results, the differences were discussed between experts and settled [74]. The applied assessment criteria and relevant scoring scales are presented in Table A4 in the Appendix A.
3.4. Calculation of Quality Assessment Indicators for Reporting GHG and CE Issues
The adopted research methodology makes use of aggregated indices on two quality assessment levels. The aggregation of qualitative assessment indices and indicators is an approach frequently used in the literature. It is an effective way to characterize and analyze selected quality features of sustainability reports [44,50,59,108]. Three indices (based on aggregating of selected indicators) were established on the first level and one aggregated index on the second, separately for the GHG issues and the CE issues.
The following three indices related to quality of reporting GHG issues assessment criteria were established on the first aggregation level:
- The occurrence of GHG issues at the strategic level (OSLGHG), calculated according to Equation (1);
- The scope of information related to GHG issues (SIGHG), calculated according to Equation (2);
- The accuracy of data related to GHG issues (AGHG), calculated according to Equation (3).
The aggregated index measuring quality of reporting GHG issues (QRGHG) was established on the second level. Being the arithmetic mean of the three indices mentioned above, the index was calculated according to Equation (4):
The quality indices related to the reporting CE issues were established in the same manner. The following three indices related to quality of reporting CE issues assessment criteria were established:
- The occurrence of CE issues at the strategic level (OSLCE), calculated according to Equation (5),
- The scope of information related to CE issues (SICE), calculated according to Equation (6),
- The accuracy of data related to CE issues (ACE), calculated according to Equation (7).
The aggregated index measuring the quality of reporting CE issues (QRCE), was calculated according to Equation (8) as the arithmetic mean of the three indices defined above.
In addition, two general indicators were used to assess the clarity of reports (CLR), in particular in relation to GHG and CE issues disclosed, and comparability (CMP) characterizing the presented data in terms of its consistency and possibilities of analyzing changes over time and making analytical comparisons.
3.5. Statistical Analysis of Collected Data
The statistical analysis of collected data was carried out in two steps. The first step was to calculate the descriptive statistics for all variables, such as mean and standard deviation values, and medians, minimum and maximum quality assessment values.
In the second step a comparative statistical analysis was conducted. A comparison was drawn at this stage of mean values of established quality indices and indicators in the determined groups of reports.
Six criteria were adopted for the division of reports into groups for comparisons. The established criteria and the groups are as follows:
- business activity—two groups: ‘energy sector’: reports of companies involved exclusively in the production, distribution, and sales of electricity, ‘diversified’—reports of companies conducting diversified business activity (including e.g., gas, petroleum or water distribution);
- non-financial reporting obligation—two groups: ‘yes’—reports of companies obliged to report non-financial information, ‘no’—reports of companies with no such obligation;
- area of activity—two groups: ‘domestic’—reports of companies operating in the territory of a single country, ‘international’—reports of companies operating in two or more countries;
- type of sustainability reporting—two groups: ‘stand-alone reports’—reports of the sustainability/CSR nature only, ‘other’—reports of a different character (e.g., integrated reports, annual reports);
- external assurance—two groups: ‘yes’—reports submitted for verification to an independent external unit, ‘no’—reports not submitted for external verification;
- report option—three groups: ‘GRI-related’—reports prepared based on the GRI Standards without stating any option, ‘core’—reports prepared in accordance with the GRI Standards core option, ‘comprehensive’—reports prepared in accordance with the GRI Standards comprehensive option.
To investigate the importance of differences between the mean values established in the groups, normality tests were performed of all analyzed indices and indicators. Due to the better power for a given statistical significance, the probability distribution of individual indices and indicators was verified using the Shapiro–Wilk tests [109]. The obtained results pointed to the lack of normality of the distributions of the variables under consideration. For this reason, nonparametric statistical tests were applied in further analyzes. In two groups the mean values were compared using the Mann–Whitney U test. Considering comparisons in three groups (i.e., based on report option) the Kruskal– Wallis one-way analysis of variance by ranks with post-hoc test was applied.
The final phase of the study included the interpretation of our results and the presentation of our main findings.
4. Results and Discussion
4.1. Descriptive Results
The first step of the analysis of the obtained results was characterization of the descriptive statistics on the quality of reporting GHG issues (QRGHG). On average, the QRGHG value totaled 1.31 for all the evaluated reports, which indicates a relatively high quality of reporting in this area. It should be emphasized, however, that there are differences between the values of component indices of the QRGHG. In particular, the occurrence of GHG issues at the strategic level (OSLGHG) is by far the most developed—its mean reached the highest value (1.66). Examples of statements from senior decision-maker in relation to GHG issues included in the analyzed sustainability reports are presented in Table 1.

Table 1.
Examples of statements from senior decision-maker in relation to greenhouse gases (GHG) issues.
The scope of information related to GHG issues (SIGHG) was assessed at the level of 1.19, and the mean for the accuracy of information related to GHG issues (AGHG) totaled 1.07.
With respect to OSLGHG index, the highest mean (1.79) was obtained for the explanation of the material topic and its boundary and the management approach and its components (OSLGHG-BMA); the lowest mean (1.56) was found for key impacts, risks, and opportunities (OSLGHG-IRO). All indicators in this case reached relatively high values. The obtained values of standard deviation indicate that the evaluated reports are fairly homogeneous. For the OSLGHG-IRO the standard deviation value is rather high (0.76), but for the other indictors the standard deviation values are included in the range of 0.45–0.59.
In the case of SIGHG index, the direct GHG emissions (SIGHG-DE) won by far the highest mean of 1.62. The means obtained for the other indicators are included in the range of 0.92–1.23. The lowest mean was obtained for the reduction of GHG emissions (SIGHG-RE). It should be noted that the standard deviation values for the above-mentioned indicators are relatively high. This is due to considerable differences between the frequency of the occurrence of individual indicators included in the SIGHG index in the analyzed reports and between the detail of their description. The most frequent were indicators related to direct GHG emissions (SIGHG-DE). Only 5 of the evaluated reports failed to include them. The other indirect GHG emissions (SIGHG-OE) and reduction of GHG emissions (SIGHG-RE) were the least frequent. These two indicators were not disclosed in 25 and 26 reports, respectively.
In the case of the AGHG, the mean and the standard deviation values (1.07 and 0.75, respectively) are equal to the values obtained for their only component indicator: disclosure on emissions (AGHG-E).
The second step of results analysis was presentation of the descriptive statistics on the quality of reporting CE issues (QRCE). For the QRCE, the mean totaled 0.79. Considering the adopted assessment scale, this demonstrates that the quality of reporting in this area is rather poor, especially in comparison with similar results obtained for GHG issues. The component indices of the QRCE are at a different and lower level compared to the same indices adopted for GHG issues. The occurrence of CE issues at the strategic level (OSLCE) is the most developed, but the mean obtained for it is still relatively low—1.16. Examples of statements from senior decision-maker in relation to CE issues included in the analyzed sustainability reports are presented in Table 2.
Table 2.
Examples of statements from senior decision-maker in relation to circular economy (CE) issues.
The scope of information related to CE issues (SICE) was assessed at the level of 0.74, and the mean value for the accuracy of information related to CE issues (ACE) totaled 0.47.
As for the OSLCE index, it can be noticed that its component indicators are assessed in the range from 0.92 for statement from a senior decision-maker (OSLCE-SDM) to 1.39 for an explanation of the material topic and its boundary and the management approach and its components (OSLCE-BMA). It can also be seen clearly that CE issues are frequently omitted in the key statements made by the senior decision-makers representing the analyzed companies. The obtained means are slightly less homogeneous compared to reports on GHG issues. The standard deviation values are included in the range from 0.53 for the OSLCE-BMA to 0.80 for key impacts, risks, and opportunities (OSLCE-IRO).
In the case of the SICE index, the decidedly highest mean of 1.39 was obtained for energy consumption within the organization (SICE-ECW). Waste by type and disposal method (SICE-WD) came second with the mean of 1.15. The decidedly lowest mean of 0.13 was obtained for the recycled input materials used (SICE-RM). The standard deviation values for these indicators are included in the range from 0.43 for the SICE-RM to 0.93 for energy intensity (SICE-EI). It follows from the analysis of the reports that the most common disclosed in them was SICE-ECW and SICE-WD. They were not included only in 4 and 11 of the analyzed reports, respectively. There was very little information (if any at all) on SICE-RM or energy consumption outside the organization (SICE-ECO). Information on these issues was given only in 6 and 14 reports, respectively.
In terms of the ACE index, disclosure on energy (ACE-E) won the highest mean of 0.64; the mean for disclosure on waste (ACE-W) totaled 0.49, and the lowest mean of 0.28 was obtained for disclosure on materials (ACE-M). The standard deviation values in this case are included in the range from 0.52 for the ACE-M to 0.66 for ACE-E.
Comparing the values of descriptive statistics on indices concerning the assessment of the quality of reporting GHG and CE issues, it can be noticed that the means of all indices related to GHG issues are higher than those obtained for the CE issues. The QRGHG is by 0.52 higher compared to the QRCE. In the case of component indices, the biggest difference of 0.60 is found for AGHG and ACE. For OSLGHG and OSLGE, the difference totals 0.50 and the smallest difference of 0.45 was recorded between SIGHG and SICE.
The third step of results analysis in this phase revealed that the analyzed reports are characterized by a relatively high value of clarity (CLR)—the obtained mean totals 1.56, at a rather low level of comparability (CMP) (1.08).
The detailed descriptive statistics on the obtained results of the analysis are presented in Table 3.
Table 3.
Descriptive statistics of the indices and indicators related to the assessment criteria.
4.2. Factors Influencing the Quality of Reporting GHG and CE Issues
In order to identify potential determinants of the quality of reporting GHG and CE issues, an analysis was conducted of the significance of the differences between the means obtained for the indices and indicators distinguished in relation to: (1) business activity, (2) area of activity, (3) non-financial reporting obligation, (4) type of sustainable reporting, (5) external assurance, and (6) report option.
In the case of business activity, the mean values obtained for the quality of reporting GHG and CE issues (QRGHG and QRCE, respectively) as well as for comparability (CMP), are higher in the group of reports prepared by companies with a diversified business activity. However, it should be noted that the differences are relatively small, and it is only for CMP that they become statistically relevant (p = 0.009). In the case of clarity (CLR) and occurrence of CE issues at the strategic level (OSLCE), a higher mean was obtained for reports from the energy sector, but the differences were of no statistical relevance. The results of the analysis indicate that business activity has an essential impact on comparability only. Interestingly, the reports of companies with a diversified business activity are more advanced compared to companies operating exclusively in the energy sector. These results suggest that diversified companies are more likely to disclose information in a manner that empowers stakeholders to analyze changes over time and to make analytical comparisons (i.e., disclosures of total and absolute numbers at least per two years, ratio per one year, or changes in ratios on a year-to-year basis). This may be the effect of operation in multiple organizational fields that makes it necessary to respond to numerous regulatory regimes and normative orders [80].
Considering the analyzed reports with respect to area of activity, the statistically significant difference occurs only for OSLGHG (p = 0.049). Attention should be drawn to the differences concerning the SIGHG, QRCE, and CMP. However, the obtained p-values (p = 0.059, p = 0.095, and p = 0.095, respectively) are above the 0.05 threshold. It should be added that the means obtained in the analyzed groups of reports are higher (except for the CLR) for companies operating internationally. The conducted analysis suggests that the area of activity influences sustainability reporting in terms of the occurrence of GHG issues at strategic level. This indicates that emphasizing sensitivity to climate change issues can have an impact on sustaining or improving international reputation [110]. In addition, Kolk and Fortanier (2013) claim that the internationalization of activity forces companies to balance between pressures of diverse stakeholders groups from home and host countries and this forces companies to disclose specific information [84].
With respect to the non-financial reporting obligation, the statistically significant difference (p = 0.025) occurs for OSLGHG. As for the indicators expressed as SIGHG and OSLCE, the p-values are above the 0.05 threshold but still relatively low (0.055 and 0.079, respectively). The differences in the case of QRGHG and QRCE indices were found to be insignificant. It is worth noting, however, that except for the accuracy of data related to GHG issues (AGHG), the means obtained in the group of companies with the non-financial reporting obligation are higher compared to other companies. The prior research emphasized the role of regulation in improving the quality of disclosures [87]. However, this study indicates that non-financial information obligation inclines energy sector companies to disclose to a greater extent mostly GHG and CE issues at strategic levels.
Considering the analyzed reports in terms of the Type of sustainability reporting, the statistically significant difference occurs only for clarity (CLR) (p = 0.038). The obtained mean is higher for stand-alone reports. No essential differences were observed for the other analyzed indices and indicators in the groups of companies distinguished based on the report type. In general, this is in line with research of Michelon et al. (2015) and Lock and Seele (2016), who found no differences between stand-alone reports and combined reports in terms of their quality and credibility [52,53]. It follows from the results that CLR of stand-alone reports is higher compared to other types of reports. It should be emphasized that combined reports (i.e., annual reports, integrated reports) are usually longer (e.g., due to inclusion of financial information) than stand-alone publications and this may influence their clarity [52].
With respect to the external assurance, statistically relevant differences were observed for the QRGHG (p = 0.000), OSLGHG (p = 0.000), SIGHG (p = 0.001), QRCE (p = 0.002), SICE (p = 0.004), ACE (p = 0.005), CLR (p = 0.009), and CMP (p = 0.004). In this case, the obtained means were in each and every case higher for the companies whose reports were submitted to external assurance entities. This analysis shows that the external assurance has a wide impact on the quality of reporting GHG and CE issues as well as clarity of reports and comparability. These results confirmed evidence from prior studies on reporting quality and credibility in terms of external verification [50,92,93].
Considering the report option, statistically significant differences were found for: SIGHG (p = 0.002), SICE (p = 0.046), CLR (p = 0.005) and CMP (p = 0.017). It should be noted that for the QRGHG and QRCE indices, the obtained p-values are above the 0.05 threshold. However, they remain at relatively low levels of 0.086 and 0.106, respectively. The Kruskal–Walis post-hoc analysis revealed that statistically significant differences occur first and foremost between the core and comprehensive groups (for QRGHG SIGHG SICE), and the relevant mean values are higher for the comprehensive group. It is only for the CLR that a statistically relevant difference occurred between the GRI-related and core reports, with the mean higher for the core group (interestingly, the core reports were characterized by higher clarity compared to reports from the comprehensive group). It is interesting that for some indices mean values are higher for the GRI-related group compared to core reports. However, it must be emphasized that only 7 GRI-related reports were assessed and therefore these results ought to be treated with utmost caution. Lock and Seele (2016) found that reports with high application levels of GRI guidelines are more credible than those without [52]. Based on the vast majority of analyzed quality indices and indicators this study confirms that sustainability reports with comprehensive option are significantly more developed than other reports. With respect to higher clarity of core reports compared to comprehensive group it may be affected by the criteria to claim a report has been prepared in accordance with the GRI Standards as the core or comprehensive option. For example, the comprehensive option means that for each identified material topic covered by a topic-specific GRI Standard, report must be in compliance with all reporting requirements for all topic-specific disclosures (while at least one topic-specific disclosure is expected for the core option) [11] The disclosure of large amount of detailed data may affect its clarity for stakeholders. Therefore, avoidance of excessive and unnecessary detail or other content likely to be unfamiliar is of particular importance.
Detailed results of the analyses concerning the significance of differences between the investigated groups of companies are presented in Table 4 and Table 5.
Table 4.
Mann–Whitney U test results for comparison of report quality indices and indicators among the analyzed groups.
Table 5.
Kruskal–Wallis analysis for analyzed indices and indicators among the report option groups.
5. Conclusions
The achievement of climate neutrality and eco-economic decoupling requires explicit measures focused on GHG and CE issues. The energy sector is of particular importance in meeting these challenges because it exerts a substantial environmental impact. As indicated by the literature review, GHG issues are investigated in the context of the energy sector far more frequently than CE issues. The processes being the main source of GHG emissions are well known and so are the assumptions of the energy sector transformation needed to reduce them. What is still missing, though, is comprehensive research on the way in which the energy sector companies approach these issues. In the case of the CE concept in the energy sector, the main directions to follow to realize its assumptions in practice have already been identified. However, there are no in-depth studies on practical implementation of the solutions developed in this area. Therefore, it is extremely important to determine how essential GHG and CE issues are for companies operating in the energy sector. This can be reflected in corporate strategies, but it can also be disclosed to the public in sustainability reports.
The results of in-depth analysis on disclosed GHG and CE issues show that the quality of sustainability reporting the former is substantially higher compared to the latter. This concerns the occurrence of the analyzed issues at the strategic level, as well as the scope of information and the accuracy of data related to them. Both for GHG and CE issues, the highest quality of the reported information occurred at the strategic level. Information on individual indicators was presented with an average quality. The quality of the information accuracy was evaluated the lowest. Moreover, the reported information ranked relatively high for clarity and relatively low for comparability. In general, the research results indicate that sustainability reports from the energy sector companies tend to focus more on GHG issues. They rarely point to actions related to CE, including actions enabling a reduction in GHG emissions, as those with a high priority. Undoubtedly, this shows that the energy sector companies should take a greater interest in CE issues. It should also be emphasized that declarations from the analyzed companies about their intentions related to GHG and CE issues at the strategic level are rather poorly reflected in the description of specific actions in this area or in demonstrating appropriate indicators at the operational level. As for the indicators included in the reports, it should be noted that the analyzed companies insufficiently describe the methods they use to gather, compile, and analyze information on the effectiveness of actions taken to address GHG and, in particular, CE issues.
As for identification of potential determinants of the quality of reporting GHG and CE issues, the results of the presented research demonstrate that external assurance has a statistically significant impact on almost all indices and indicators of the assessment of the reporting quality under analysis. In the case of reports submitted for external assurance, the mean values obtained are decidedly higher. Many statistically essential differences can be observed for the report option. Based on the vast majority of analyzed quality indices and indicators this study confirms that sustainability reports with the comprehensive option are significantly more developed than other reports. However, the higher clarity of core reports compared to comprehensive group was observed which suggests that disclosure of large amount of detailed data may affect clarity of sustainability reports. With respect to area of activity and non-financial reporting obligation, a statistically significant difference occurs for the occurrence of GHG issues at the strategic level. Nevertheless, in general, most of the analyzed indices and indicators reached higher values for companies operating internationally. Similarly, most of the analyzed means obtained in the group of companies with the non-financial reporting obligation are higher compared to other companies. According to the research results, the business activity and the type of sustainability reporting have the smallest impact on the reported information quality. However, it should be emphasized that Business activity has an essential impact on comparability and reports of companies with a diversified business activity (i.e., operating in multiple organizational fields) are more advanced compared to companies operating exclusively in the energy sector. Clarity, in turn, of stand-alone reports is higher compared to other types of reports.
It should be mentioned that according to the Directive 2014/95/EU on disclosure of non-financial information [100], a significant part of companies whose sustainability reports have been analyzed are required to disclose environmental issues that include information on GHG and CE. Most of these companies disclose only information on the overall environmental and social impact of their activities. It is worth noting that the latest guidelines of the European Commission on reporting non-financial information [111,112] recommend that companies, especially from the energy sector, also disclose information on the impact of environmental issues, including in particular the impact of climate change, on the development, results, and financial situation of the companies. This information should assess the risks associated with the transition to a low carbon and climate resilient economy, including the policy, legal, technology, market, and reputational risks [112].
The presented analysis included reports prepared in accordance with the GRI guidelines, which entered into force in 2018. It should be noted that the Global Sustainability Standards Board (GSSB) constantly reviews the standards to update them and to develops new standards. A major update to the GRI Standards is currently underway. This applies to GRI’s Universal Standards, which consist of GRI 101: Foundation 2016, GRI 102: General Disclosures 2016, and GRI 103: Management Approach, 2016. The revisions seek to improve the quality and consistency of reporting and to improve how organizations use the standards to disclose their impacts on the economy, environment, and people. This may have a positive impact on improving quality of reporting GHG and CE issues. Updated Standards are to be released in the first half of 2021.
Although considerable efforts have been made to perform this analysis in the most accurate manner, like all studies, this one is not without limitations. Nevertheless, the obtained findings offer new directions for future research. The main identified limitation concerns the sample selection. The research was focused exclusively on the energy sector. Therefore, future studies assessing GHG and CE issues in other industries may provide new results using a broader perspective. To generate an appropriate sample of sustainability reports, the two most recognized global online databases were used (i.e., GRI’s Sustainability Disclosure Database and Corporate Register). However, as companies are not obliged to add reports to these databases, organizations that did not do so were omitted in the research sample. Taking account of the purpose of this study, reports based on the latest GRI Standards were selected and analyzed as the best practice in terms of sustainability reporting. The idea of acquiring information on GHG and CE issues in the future from other corporate documents and websites is worth considering. A decision was made to analyze sustainability reports published in English only. As shown by the research results, energy companies to a large extent publish sustainability reports in their native languages. Therefore, future studies may be extended to cover reports disclosed in languages other than English. However, this would mean engaging an international research team. The research could also be improved by enlarging the sample size. The presented analysis is focused on the EU member states. Further studies with a wider sample including companies from other regions would highlight new important aspects of the analyzed issues. The directions for further research may also comprise other possible factors influencing the quality of reporting GHG and CE issues, e.g., the company size or the country specificity. Unfortunately, this study was dominated by reports from large companies (i.e., the analysis covered 59 documents from large entities and 2 from medium-sized organizations), and there was a limited number of companies from the same country. Future studies with a larger sample of companies operating in different countries would make the findings more generalizable. It should also be noted that the focus of this study was on reporting and not on actual performance in terms of GHG and CE issues. In addition, the research was based on subjective evaluation, but all reports were reviewed by three experts and whenever discrepancies appeared in the assessment, the differences were discussed and settled.
Nevertheless, it should be emphasized again that efforts were made to provide as comprehensive evidence in the area under analysis as possible. Therefore, despite the above mentioned limitations, we believe that this study makes important contributions to state-of-the-art assessment of the quality of reporting GHG and CE issues in sustainability reports from the companies representing the energy sector in the EU and to exploration of specific factors influencing this quality.
Author Contributions
Conceptualization, A.J. and A.R.; methodology, A.J., A.R. and M.S.; formal analysis, M.S.; investigation, A.J., A.R. and M.S.; writing—original draft preparation, A.J., A.R. and M.S.; writing—review and editing, A.J. and A.R.; visualization, A.J., A.R. and M.S. All authors have read and agreed to the published version of the manuscript.
Funding
The research presented in the paper was supported by statutory work 13/030/BK_20/0059 carried out at the Chair of Production Engineering, Faculty of Organization and Management, Silesian University of Technology.
Conflicts of Interest
The authors declare no conflict of interest.
Appendix A
Table A1.
Overview of research on the sustainability reports assessment in the energy sector.
Table A1.
Overview of research on the sustainability reports assessment in the energy sector.
| Authors | Method | Assessment Subject | Types of Analysis | Types of Reports | Sample |
|---|---|---|---|---|---|
| Alrazi et al. (2010) [68] | Content analysis | Environmental reporting quality | Quality | Corporate website, annual reports and a stand-alone report on sustainability issues | 51 electric utilities from 19 countries (Australia, Brazil, Canada, Chile, Czech Republic, France, Germany, Italy, Japan, Korea, Hong Kong, Malaysia, New Zealand, Portugal, Russia, Spain, Thailand, UK, USA) |
| Alrazi et al. (2014) [77] | Content analysis | Carbon-related information | Quantity and quality | Annual reports, stand-alone sustainability reports and corporate websites | 9 Malaysian companies (major power producers) |
| Alrazi et al. (2016) [78] | Content analysis | Quality of CO2 emissions information and overall environmental information | Quality | Corporate website, annual reports and a stand-alone report on sustainability issues | 205 electricity generation firms representing 35 countries. |
| Al-Shaer (2020) [43] | Assessment of the adoption and non-adoption of sustainability reporting practices | Quality of sustainability reporting | Quality | Any types of reports | 350 UK companies (10 different industrial sectors, including energy and utilities) |
| Amran et al. (2014) [44] | Content analysis based on measure of sustainability reporting quality | Credibility of sustainability reports | Quality | Sustainability reports and annual reports | 113 Asia-Pacific region companies from 12 countries (Australia, New Zealand, China, India, Indonesia, Korea, Malaysia, Philippines, Singapore, Taiwan, Thailand, Japan) (different sectors, including electricity generation) |
| Bahari et al. (2016) [79] | Content analysis using carbon disclosure index | Extent of carbon information reporting | Quality | Annual reports, stand-alone sustainability reports and corporate websites | 90 Asian electricity generating companies (44 Indian, 26 Chinese, 20 Japanese) |
| Bakhtina and Goudriaan (2011) [69] | Content analysis | Quality of reporting employment issues as part of corporate social responsibility | Quality | CSR reports | 10 large multinational energy companies |
| Barkemeyer et al. (2015) [56] | Content analysis | Content of corporate sustainability reports | Quality | Sustainability reports prepared in accordance with GRI G3 guidelines | 933 companies from 30 countries (7 different sectors, including 188 companies from electricity sector) |
| Bhatia and Tuli (2018) [57] | Content analysis using sustainability disclosure index based on the GRI-G3 guidelines | Quality of sustainability disclosures | Quality | Sustainability reports | 232 companies from BRIC countries, UK and USA (different sectors, including 19 companies from power sector) |
| Bonsón and Bednárová (2015) [45] | Content analysis using Integrated Scorecard Taxonomy Scoreboard | Extent to which Eurozone companies report on CSR indicators | Quality | Annual reports or separated sustainability reports | 306 Eurozone companies from 12 countries (19 different subsectors, including utilities) |
| Camargos et al. (2014) [66] | Content analysis using exploratory and comparative study | Analysis of patterns of using the GRI guidelines and indicators | Quality | Sustainability reports prepared in accordance with the GRI-G3 guidelines | 12 Brazilian companies (electric utilities sector) |
| Chang (2013) [64] | Content analysis | Analysis of environmental information disclosure | Quality | Social responsibility reports | 25 Chinese electric firms |
| Ching et al. (2013) [46] | Content analysis based on GRI framework | Quality of information disclosed | Quality | Reports with socio-environmental information | 60 Brazilian companies (4 different economic sectors, including electric utility companies) |
| Daub (2007) [47] | Benchmark study based on individual criteria | Quality of corporate sustainability reporting | Quality | Reports with information on economic, ecological or social performance | 76 Swiss companies (different sectors, including energy supply companies) |
| Dyduch and Krasodomska (2017) [48] | Content analysis using disclosure weighted index | Quality of CSR disclosures | Quality | CSR disclosures in annual reports and integrated reports | 60 Polish non-financial companies (different sectors, including 6 companies representing energy industry) |
| Fernandez-Feijoo et al. (2014) [49] | Quantitative content analysis | Transparency of the sustainability reports | Quantity | Sustainability reports from the GRI database | 1047 companies from 10 countries (38 different sectors, including energy and energy utilities) |
| Gallego (2006) [58] | Content analysis | Analysis of economic, social and environmental information | Quality and quantity | Sustainability reports and annual reports | 19 Spanish companies (different sectors, including 7 companies representing energy and water) |
| Hąbek (2017) [50] | Content analysis using a quality indicator | Quality of CSR reports | Quality | CSR reports—GRI-based and non-GRI | 44 companies from Visegrad Group (Czech Republic, Hungary, Poland, Slovakia) (different sectors, including energy and energy utilities) |
| Kraft (2018) [76] | Content analysis | Substantiveness of climate disclosures | Quality | Annual reports | 45 electric utilities companies operating in the USA |
| Leitonienea and Sapkauskiene (2015) [51] | Content analysis using a quality index | Quality of CSR information | Quality | Reports of socially responsible companies | 48 Lithuanian companies (different sectors, including 4 energy companies) |
| Lock and Seele (2016) [52] | Human and software-enhanced quantitative content analysis | Credibility of CSR reports | Quantity and quality | CSR reports—GRI-based (G3, G3.1, and G4) and non-GRI | 237 European companies from 11 countries (Austria, Belgium, France, Germany, Italy, the Netherlands, Poland, Spain, Sweden, Switzerland, UK) (different sectors, including 33 companies from energy and energy utilities) |
| Loza Adaui (2020) [59] | Content analysis using multidimensional approach for SRQ evaluation | Quality of sustainability reporting | Quality | Sustainability reports or annual reports containing sustainability disclosures | 27 Peruvian companies (different sectors, including 10 companies from energy, electricity and oil sector) |
| Matuszak and Różańska (2017) [60] | Content analysis | Extent and quality of CSR reporting quantify the CSR-disclosure practices, | Quality | CSR disclosure data in annual reports, CSR reports and the websites | 150 Polish companies (26 different sectors, including 6 energy companies) |
| Michelon et al. (2015) [53] | Content analysis based on GRI (G3) framework | Quality of CSR disclosures | Quantity and quality | CSR or sustainability reports—GRI based and non-GRI | 112 UK companies (different sectors, including utility industries) |
| Moseñe et al. (2013) [65] | Content analysis | Comparison of the levels of compliance with GRI indicators of environmental sustainability | Quality | Sustainability reports | 7 Spanish companies (wind energy sector) |
| Ng and Nathwani (2012) [70] | Comparative case study using sustainability performance scorecard | Assessment of sustainability performance | Quality | Annual reports | 3 global companies (independent power producers) |
| Papoutsi and Sodhi (2020) [54] | Content analysis using scoring system | Extent to which sustainability reports indicate corporate sustainability performance | Quality | Sustainability reports obtained from the Sustainability Disclosure Database | 331 companies: 117 American or Canadian and 214 European. (18 different sectors, including 35 energy and utilities companies) |
| Rankin et al. (2011) [61] | Content analysis | Extent and credibility of GHG disclosure | Quality | Annual reports and stand-alone environment or sustainability reports | 187 Australian companies (different sectors, including 61 energy and mining companies) |
| Roca and Searcy (2012) [55] | Content analysis | Analysis of indicators disclosed in corporate sustainability reports | Quantity and quality | Corporate sustainability reports | 94 Canadian companies (different sectors, including electricity) |
| Sartori et al. (2017) [67] | Data Envelopment Analysis using sustainability indicators | Assessment of sustainability performance | Quantity and quality | GRI reports | 17 Brazilian companies (electricity power industry) |
| Slacik and Greiling (2019) [72] | Content analysis and logic and conversation theory (LCT) | The coverage and quality of documented material aspects | Quality | Sustainability reports prepared in accordance with GRI-G4 guidelines | 186 English and German companies (electric utility sector) |
| Slacik and Greiling (2020) [73] | Quantitative content analysis | Sustainability reporting practice and coverage rates of G4-indicators | Quantity | Sustainability reports prepared in accordance with GRI-G4 | 186 companies from 45 countries (electric utilities sector) |
| Steinweg and Wilde-Ramsing (2012) [71] | Content analysis using GRI Content Index template and Checklist | Overview of the use of the GRI Guidelines | Quality | CSR/sustainability reports and associated or accompanying websites—GRI-based and non-GRI | 19 European companies (electric utility sector) |
| Szczepankiewicz and Mućko (2016) [62] | Content analysis | Quality and variety of information disclosed | Quantity and quality | CSR and similar reports prepared in accordance with the GRI-G4 guidelines | 9 Polish companies (energy and mining sector, including 6 energy companies) |
| Talbot and Boiral (2018) [75] | Qualitative and inductive content analysis | Quality of climate information and impression management strategies | Quality | Sustainability reports prepared in accordance with the G3 or G3.1 of GRI guidelines | 21 companies from different countries (energy sector) |
| Traxler and Greiling (2019) [74] | Documentary analysis | Coverage of GRI indicators | Quantity | Sustainability reports prepared in accordance with GRI-G4 | 83 companies from 28 different countries (electric utilities sector) |
| Tsalis et al. (2020) [63] | Content analysis and benchmarking-scoring framework | Level of alignment of CSR practices with the scope of UN-SDGs. | Quality | Stand-alone sustainability reports | 20 Greek companies (different industry sectors, including 4 energy and energy utilities companies) |
Table A2.
Summary of quantitative data from the subsequent steps of selection of research sample.
Table A2.
Summary of quantitative data from the subsequent steps of selection of research sample.
| Country | Number of Organizations Included in the Databases | Total Number of Organizations after Removal of Duplicate Organizations and Subsidiary Companies of other Entities Contained in the Databases | Number of Organization Categorized as Electric Utility Company | Number of Organization Preparing Report in PDF or Online Version | Number of Organization Preparing Report in English | Number of Organization Preparing Report in Accordance with GRI Standard (Final Research Sample) | ||
|---|---|---|---|---|---|---|---|---|
| SDD GRI Database | Corporate Register | |||||||
| Energy Sector | Energy Utilities Sector | Electricity Sector | ||||||
| Austria | 9 | 10 | 10 | 26 | 22 | 22 | 7 | 2 |
| Belgium | 2 | 5 | 5 | 11 | 5 | 5 | 4 | 2 |
| Bulgaria | 0 | 0 | 0 | 0 | 0 | 0 | 0 | 0 |
| Croatia | 2 | 0 | 1 | 3 | 1 | 1 | 1 | 1 |
| Cyprus | 0 | 0 | 0 | 0 | 0 | 0 | 0 | 0 |
| Czech Republic | 3 | 0 | 1 | 2 | 2 | 2 | 2 | 2 |
| Denmark | 3 | 1 | 10 | 13 | 11 | 11 | 10 | 0 |
| Estonia | 1 | 0 | 1 | 1 | 1 | 1 | 1 | 0 |
| Finland | 17 | 4 | 9 | 22 | 18 | 16 | 10 | 6 |
| France | 12 | 7 | 13 | 25 | 15 | 15 | 10 | 3 |
| Germany | 15 | 13 | 21 | 35 | 28 | 28 | 6 | 4 |
| Greece | 8 | 3 | 2 | 9 | 3 | 3 | 2 | 2 |
| Hungary | 7 | 4 | 6 | 14 | 11 | 11 | 9 | 2 |
| Ireland | 0 | 2 | n.d. | 2 | 1 | 1 | 1 | 1 |
| Italy | 23 | 12 | 17 | 44 | 33 | 33 | 14 | 11 |
| Latvia | 1 | 1 | 2 | 2 | 2 | 2 | 1 | 1 |
| Lithuania | 0 | 1 | 4 | 4 | 4 | 4 | 4 | 1 |
| Luxemburg | 1 | 1 | 0 | 2 | 1 | 1 | 1 | 0 |
| Malta | 0 | 0 | 0 | 0 | 0 | 0 | 0 | 0 |
| Netherlands | 8 | 5 | 0 | 13 | 6 | 6 | 5 | 3 |
| Poland | 10 | 7 | 4 | 13 | 7 | 7 | 7 | 6 |
| Portugal | 4 | 2 | 4 | 9 | 7 | 6 | 4 | 3 |
| Romania | 7 | 1 | 4 | 8 | 3 | 3 | 3 | 1 |
| Slovakia | 1 | 0 | 0 | 1 | 1 | 1 | 1 | 0 |
| Slovenia | 1 | 0 | 2 | 3 | 2 | 2 | 2 | 1 |
| Spain | 21 | 9 | 20 | 36 | 30 | 29 | 16 | 7 |
| Sweden | 14 | 2 | 16 | 28 | 14 | 14 | 2 | 2 |
| Total: | 170 | 90 | 152 | 326 | 228 | 224 | 123 | 61 |
Table A3.
List of sustainability reports included in the research sample.
Table A3.
List of sustainability reports included in the research sample.
| Company Name | Country | Report Title | Year of Publication |
|---|---|---|---|
| A2A SpA | Italy | 2018 Integrated report 2018 Supplement integrated report | 2019 |
| AB Kauno Energija | Lithuania | Consolidated Sustainability Report in Accordance with GRI Standards 2018 | 2019 |
| Acea SpA | Italy | Sustainability report Acea group 2018 | 2019 |
| Aliander NV | Netherlands | Annual Report 2018 | 2019 |
| Alperia SpA | Italy | Our commitment to the future. Sustainability Report 2018 | 2019 |
| ALTEO Group | Hungary | ALTEO Group / Integrated Report 2018 | 2019 |
| Caruna | Finland | CARUNA. Positive energy. Caruna’s year 2019 | 2020 |
| CEZ Group | Czech Republic | The CEZ Group Sustainability Report. Energy for the future. | 2019 |
| CNTEE Transelectrica SA | Romania | Sustainability report 2018 | 2019 |
| E.ON SE | Germany | 2019 Sustainability Report. Our energy future is green. | 2020 |
| EDF Group | France | Reference Document 2018 including the Annual Financial Report | 2019 |
| EDP | Portugal | EDP. Sustainability Report 2019 | 2020 |
| EEW Energy from Waste GmbH | Germany | Sustainability report 2018 | 2019 |
| Elawan Energy S.L. | Spain | Sustainability Report 2018 | 2019 |
| Elecnor Group | Spain | Integrated Report 2018 | 2019 |
| Electricity Supply Board (ESB) | Ireland | EBS. Energy for generations. Sustainability Report 2017 | 2018 |
| ELES d.o.o. | Slovenia | New era of energy. Annual Report of ELES for 2018 | 2019 |
| Elia Group | Belgium | Ready to accelerate. Sustainability report 2019 | 2020 |
| Ellevio AB | Sweden | Ellevio 2019 | 2020 |
| Enea Group | Poland | Enea Group CSR Report 2018 | 2019 |
| Enel SpA | Italy | Sustainability report 2018 | 2019 |
| Energa Group | Poland | Our responsibility 2018 | 2019 |
| Energetický a průmyslový holding (EPH) | Czech Republic | EPH. Sustainability Report 2018 | 2019 |
| Enexis Holding NV | Netherlands | Energy in a NEW REALITY. Annual report 2019 | 2020 |
| ENI SpA | Italy | ENI for 2019 Sustainability performance Eni for 2019 A just transition | 2020 |
| ERG SpA | Italy | Sustainability report 2018 | 2019 |
| EVN Group | Austria | Energy. Water. Life. EVN Full Report 2018/19 | 2019 |
| Falck Renewables SpA | Italy | Sustainability at the CORE report 2019 | 2020 |
| Fingrid Oyj | Finland | Annual Report 2019 Fingrid | 2020 |
| Fluvius System Operator CVBA | Belgium | Annual report 2018. Connecting sustainably. | 2019 |
| Fortum | Finland | Fortum. Join the change. Sustainability 2019 | 2020 |
| Galp Energia, SGPS, S.A. | Portugal | Energy emotion. Galp Integrated Report 2019 | 2020 |
| GASUM | Finland | Gasum Corporate Responsibility 2018 | 2019 |
| HEP Group (Hrvatska elektroprivreda d.d.) | Croatia | Open way for sustainability. Sustainability Report 2018 | 2019 |
| Hera Group | Italy | Sustainability report 2019 | 2020 |
| Iberdrola Group | Spain | Statement of Non-Financial Information. Sustainability Report. Financial year 2019 | 2020 |
| Iren SpA | Italy | Sustainability report 2018 | 2019 |
| Latvenergo AS | Latvia | Sustainability and Annual Report 2019 | 2020 |
| MVM Group | Hungary | MVM Group Integrated Report 2018 | 2019 |
| Naturgy Energy Group | Spain | 2018 Corporate Responsibility Report | 2019 |
| PGE Polska Grupa Energetyczna | Poland | Integrated Report 2018 PGE Capital Group | 2019 |
| Polski Koncern Naftowy ORLEN (PKN ORLEN) | Poland | Orlen Group 2018 Integreted Report | 2019 |
| Polskie Sieci Elektroenergetyczne (PSE) | Poland | Filling Poland with Power. PSE Impact Report 2018 | 2019 |
| PUBLIC POWER CORPORATION (PPC) | Greece | Corporate Social Responsibility and Sustainability Report 2018 | 2019 |
| Red Eléctrica Group | Spain | Sustainability report 2018 | 2019 |
| REN (Redes Energéticas Nacionais) | Portugal | REN. Driving Energy. Reports&Accounts 2019 | 2020 |
| REPSOL Group | Spain | Integrated Management Report 2019 | 2020 |
| RWE AG | Germany | Our Responsibility 2019 | 2020 |
| Siemens Gamesa Renewable Energy | Spain | Consolidated Non-Financial Statement 2019 (former Sustainability Report) | 2020 |
| SOL SpA | Italy | Sustainability report SOL group 2018 | 2019 |
| SUEZ | France | A company for society. 2019 Integrated Report | 2019 |
| TAURON | Poland | Report on non-financial information of TAURON Capital Group for 2019 | 2020 |
| TenneT Holding BV | Netherlands | Integrated Annual Report 2019 CSR data linked to Integrated Annual Report 2019 | 2020 |
| Teollisuuden Voima Oyj (TVO) | Finland | Responsibility Report 2019 | 2020 |
| TERNA ENERGY S.A. | Greece | Terna Group. Sustainable Development Report 2018 | 2019 |
| Terna SpA | Italy | Sustainability report 2019 | 2020 |
| TOTAL S.A. | France | Universal Registration Document 2019 including Annual Financial Report | 2020 |
| Uniper SE | Germany | Sustainability report 2019. Empower Energy Evolution. | 2020 |
| Vapo Group | Finland | Vapo Group Corporate Responsibility Report 2018. Sustainable everyday living | 2019 |
| Vattenfall AB | Sweden | Annual and Sustainability Report 2019 | 2020 |
| Verbund AG | Austria | Shaping a sustainable energy future. Our drive. Our energy. Integrated Annual Report 2019 | 2020 |
Table A4.
Assessment criteria and applied scoring scales.
Table A4.
Assessment criteria and applied scoring scales.
| Criterion Name | Assessment Scale |
|---|---|
| Quality of reporting GHG issues (QRGHG) | |
| Occurrence of GHG issues at strategic level (OSLGHG) | 0—GHG issues not mentioned 1—GHG issues mentioned indirectly 2—GHG issues mentioned directly |
| Statement from senior decision-maker (OSLGHG-SDM) | |
| Key impacts, risks, and opportunities (OSLGHG-IRO) | |
| List of material topics (OSLGHG-LMT) | |
| Explanation of the material topic and its boundary and the management approach and its components (OSLGHG-BMA) | |
| Scope of information related to GHG issues (SIGHG) | 0—lack of relevant indicators 1—indicators partially compliant with the disclosure requirements 2—indicators compliant with the disclosure requirements |
| Direct GHG emissions (SIGHG-DE) | |
| Energy indirect GHG emissions (SIGHG-IE) | |
| Other indirect GHG emissions (SIGHG-OE) | |
| GHG emissions intensity (SIGHG-EI) | |
| Reduction of GHG emissions (SIGHG-RE) | |
| Accuracy of data related to GHG issues (AGHG) | |
| Disclosure on emissions (AGHG-E) | 0—methods not described 1—methods partially described 2—full description of relevant methods |
| Quality of reporting CE issues (QRCE) | |
| Occurrence of CE issues at strategic level (OSLCE) | 0—CE issues not mentioned 1—CE issues mentioned indirectly 2—CE issues mentioned directly |
| Statement from senior decision-maker (OSLCE-SDM) | |
| Key impacts, risks, and opportunities (OSLCE-IRO) | |
| List of material topics (OSLCE-LMT) | |
| Explanation of the material topic and its boundary and the management approach and its components (OSLCE-BMA) | |
| Scope of information related to CE issues (SICE) | 0—lack of relevant indicators 1—indicators partially compliant with the disclosure requirements 2—indicators compliant with the disclosure requirements |
| Materials used by weight or volume (SICE-MU) | |
| Recycled input materials used (SICE-RM) | |
| Energy consumption within the organization (SICE-ECW) | |
| Energy consumption outside of the organization (SICE-ECO) | |
| Energy intensity (SICE-EI) | |
| Reduction of energy consumption (SICE-RE) | |
| Waste by type and disposal method (SICE-WD) | |
| Accuracy of data related to CE issues (ACE) | |
| Disclosure on materials (ACE-M) | 0—methods not described 1—methods partially described 2—full description of relevant methods |
| Disclosure on energy (ACE-E) | |
| Disclosure on waste (ACE-W) | |
| Clarity (CLR) | 0—difficult to read and to find specific information, unfamiliar content 1—relatively difficult to read and to find specific information, content relatively unfamiliar to the reader 2—easy to read and to find specific information, content familiar to the reader |
| Comparability (CMP) | 0—indicators include only total and absolute numbers per one year 1—indicators include total and absolute numbers at least per two years or ratio per one year 2—indicators enable determination of the trend of changes in ratios on a year-to-year basis |
References
- Enerdata. Energy Statistical Yearbook 2020; Enerdata: Grenoble, France, 2020. [Google Scholar]
- European Commission. Communication from the Commission to the European Parliament, the Council, the European Economic and Social Committee and the Committee of the Regions. A Policy Framework for Climate and Energy in the Period from 2020 to 2030; European Commission: Brussels, Belgium, 2014; COM/2014/015. [Google Scholar]
- European Commission. Communication from the Commission to the European Parliament, the Council, the European Economic and Social Committee, the Committee of the Regions and the European Investment Bank. Clean Energy for all Europeans; European Commission: Brussels, Belgium, 2016; COM (2016) 860. [Google Scholar]
- European Commission. Communication from the Commission to the European Parliament, the European Council, the Council, the European Economic and Social Committee, the Committee of the Regions and the European Investment Bank. A Clean Planet for All. A European Strategic Long-Term Vision for a Prosperous, Modern, Competitive and Climate Neutral Economy; European Commission: Brussels, Belgium, 2018; COM (2018) 773. [Google Scholar]
- European Commission. In-Depth Analysis in Support of the Commission Communication COM (2018) 773. A Clean Planet for All. A European Long-Term Strategic Vision for a Prosperous, Modern, Competitive and Climate Neutral Economy; European Commission: Brussels, Belgium, 2018. [Google Scholar]
- European Commission. Communication from the Commission to the European Parliament, the Council, the European Economic and Social Committee and the Committee of the Regions. A new Circular Economy Action Plan For a Cleaner and More Competitive Europe; European Commission: Brussels, Belgium, 2020; COM/2020/98. [Google Scholar]
- Grdic, Z.S.; Nizic, M.K.; Rudan, E. Circular Economy Concept in the Context of Economic Development in EU Countries. Sustainability 2020, 12, 3060. [Google Scholar] [CrossRef]
- Baran, J.; Janik, A.; Ryszko, A.; Szafraniec, M. Towards a circular economy in Poland: Are we moving to a recycling society? In Proceedings of the CLC 2016: Carpathian Logistics Congress, Zakopane, Poland, 28–30 November 2016; TANGER Ltd.: Ostrava, Moravia, 2017; pp. 463–469. [Google Scholar]
- Deloitte Oy. Circular Economy in the Energy Industry. Summary of the Final Report. Available online: https://energia.fi/en/news_and_publications/publications/circular_economy_in_the_energy_industry_-_deloitte_oy_2018.html#material-view (accessed on 15 June 2020).
- Directive 2013/34/EU of the European Parliament and of the Council of 26 June 2013 on the Annual Financial Statements, Consolidated Financial Statements and Related Reports of Certain Types of Undertakings, Amending Directive 2006/43/EC of the European Parliament and of the Council and repealing Council Directives 78/660/EEC and 83/349/EEC. Off. J. L 2013, 182, 19–76.
- Global Reporting Initiative. Consolidated Set of GRI Sustainability Reporting Standards 2020; Global Reporting Initiative, Global Sustainability Standards Board: Amsterdam, the Netherlands, 2020. [Google Scholar]
- Organisation for Economic Co-operation and Development. OECD Guidelines for Multinational Enterprises; OECD Publishing: Paris, France, 2011. [Google Scholar] [CrossRef]
- United Nations Global Compact. UN Global Compact Policy on Communicating Progress; United Nations Global Compact: New York, NY, USA, 2013. [Google Scholar]
- International Organization for Standardization. ISO 26000:2010. Guidance on Social Responsibility; International Organization for Standardization: Geneva, Switzerland, 2010. [Google Scholar]
- Stake, R.E.; Schwandt, T.A. On discerning quality in evaluation. In The SAGE Handbook of Evaluation; Shaw, I., Greene, J.C., Mark, M.M., Eds.; SAGE: Thousand Oaks, CA, USA, 2006; pp. 404–418. [Google Scholar] [CrossRef]
- Schwartz, R.; Mayne, J. Assuring the quality of evaluative information: Theory and practice. Eval. Program Plan. 2005, 28, 1–14. [Google Scholar] [CrossRef]
- European Commission. Reference Document on Best Available Techniques for Energy Efficiency; European Commission: Brussels, Belgium, 2009. [Google Scholar]
- European Commission. Best Available Techniques (BAT) Reference Document for Large Combustion Plants; European Commission: Brussels, Belgium, 2017. [Google Scholar]
- Bazmi, A.A.; Zahedi, G. Sustainable energy systems: Role of optimization modeling techniques in power generation and supply—A review. Renew. Sustain. Energy Rev. 2011, 15, 3480–3500. [Google Scholar] [CrossRef]
- Nejat, P.; Jomehzadeh, F.; Taheri, M.M.; Gohari, M.; Abd Majid, M.Z. A global review of energy consumption, CO2 emissions and policy in the residential sector (with an overview of the top ten CO2 emitting countries). Renew. Sustain. Energy Rev. 2015, 43, 843–862. [Google Scholar] [CrossRef]
- Pulselli, R.M.; Marchi, M.; Neri, E.; Marchettini, N.; Bastianoni, S. Carbon accounting framework for decarbonization of European city neighborhoods. J. Clean. Prod. 2019, 208, 850–868. [Google Scholar] [CrossRef]
- Gencer, E.; Torkamani, S.; Miller, I.; Wu, T.W.; O’Sullivan, F. Sustainable energy system analysis modeling environment: Analysing life cycle emission of the energy transition. Appl. Energy 2020, 277, 115550. [Google Scholar] [CrossRef]
- Yamaki, A.; Kanematsu, Y.; Kikuchi, Y. Lifecycle greenhouse gas emissions of thermal energy storage implemented in a paper mill for wind energy utilization. Energy 2020, 205. [Google Scholar] [CrossRef]
- Jagemann, C.; Fursch, M.; Hagspiel, S.; Nagl, S. Decarbonizing Europe’s power sector by 2050—Analyzing the economic implications of alternative decarbonization pathways. Energy Econ. 2013, 40, 622–636. [Google Scholar] [CrossRef]
- D’Alessandro, D.M.; Smit, B.; Long, J.R. Carbon dioxide capture: Prospects for new materials. Angew. Chem. Int. Ed. 2010, 49, 6058–6082. [Google Scholar] [CrossRef]
- Wu, Y.; Li, P. The potential of coupled carbon storage and geothermal extraction in a CO2-enhanced geothermal system: A review. Geotherm. Energy 2020, 8. [Google Scholar] [CrossRef]
- Amponsah, N.Y.; Troldborg, M.; Kington, B.; Aalders, I.; Hough, R.L. Greenhouse gas emissions from renewable energy sources: A review of lifecycle considerations. Renew. Sustain. Energy Rev. 2014, 39, 461–475. [Google Scholar] [CrossRef]
- Ou, X.M.; Yan, X.Y.; Zhang, X.L. Life-cycle energy consumption and greenhouse gas emissions for electricity generation and supply in China. Appl. Energy 2011, 88, 289–297. [Google Scholar] [CrossRef]
- IPCC. Global Warming of 1.5 °C, Intergovernmental Panel on Climate Change; IPCC: Geneva, Switzerland, 2018.
- IPCC. Climate Change and Land—An IPCC Special Report on Climate Change, Desertification, Land Degradation, Sustainable Land Management, Food Security, and Greenhouse Gas Fluxes in Terrestrial Ecosystems—Summary for Policymakers; Intergovernmental Panel on Climate Change: Geneva, Switzerland, 2019.
- European Environmental Agency. Adaption Challenges and Opportunities for the European Energy System. Build a Climate-Resilient Low-Carbon Energy System; European Environmental Agency: Luxemburg, 2019.
- Zhang, L.; Wang, Q.L.; Li, W.; Li, S.J. Scenario analysis on greenhouse gas emission of power sector. J. Zhejiang Univ. 2015, 49, 2244–2251. [Google Scholar] [CrossRef]
- Nugent, D.; Sovacool, B.K. Assessing the lifecycle greenhouse gas emissions from solar PV and wind energy: A critical meta-survey. Energy Policy 2014, 65, 229–244. [Google Scholar] [CrossRef]
- Poukka, R. The Future of the Global Energy Market Circular Economy in Energy Industry. Available online: https://www.valmet.com/globalassets/media/events/2018/customer-days-2018/energy/the-future-of-the-global-energy-market_riikka-poukka.pdf (accessed on 15 June 2020).
- Bielecka, A.; Kulczycka, J. Coal Combustion Products Management toward a Circular Economy—A Case Study of the Coal Power Plant Sector in Poland. Energies 2020, 13, 3603. [Google Scholar] [CrossRef]
- Rosiek, J. The implementation of Circular Economy Concept in the Polish Coal Combustion Products Sector—Selected problems. Econ. Environ. Stud. 2018, 18, 353–373. [Google Scholar] [CrossRef]
- Ghosh, S.K.; Kumar, V. Circular Economy and Fly Ash Management; Springer: Singapore, 2020. [Google Scholar] [CrossRef]
- Brown, H. Towards A Circular Energy Economy: Cross-Sector Successes in Brazil and India. Consilience 2018, 20, 23–42. [Google Scholar]
- Zvirgzdins, J.; Linkevics, O. Pumped-storage hydropower plants as enablers for transition to circular economy in energy sector: A case of Latvia. Latv. J. Phys. Tech. Sci. 2020, 57, 20–31. [Google Scholar] [CrossRef]
- Cui, H.Y. The Development of Circular Economy of Thermal Power in Western Jilin. Adv. Mater. Res. 2014, 962–965, 2323–2326. [Google Scholar] [CrossRef]
- Olabi, A.G. Circular economy and renewable energy. Energy 2019, 181, 450–454. [Google Scholar] [CrossRef]
- Zeng, S.; Hu, H.; Wang, W. Circular Economy Assessment for Coal-fired Power Plants Based on Supper-Efficiency DEA Model. In Proceedings of the International Conference on Energy and Environment Technology, Guilin, China, 16–18 October 2009; pp. 50–54. [Google Scholar] [CrossRef]
- Al-Shaer, H. Sustainability reporting quality and post-audit financial reporting quality: Empirical evidence from the UK. Bus. Strategy Environ. 2020, 1–19. [Google Scholar] [CrossRef]
- Amran, A.; Lee, S.P.; Devi, S.S. The Influence of Governance Structure and Strategic Corporate Social Responsibility toward Sustainability Reporting Quality. Bus. Strategy Environ. 2014, 23, 217–235. [Google Scholar] [CrossRef]
- Bonsón, E.; Bednárová, M. CSR reporting practices of Eurozone companies. Rev. Contab. 2015, 18, 182–193. [Google Scholar] [CrossRef]
- Ching, H.Y.; Gerab, F.; Toste, T. Analysis of Sustainability Reports and Quality of Information Disclosed of Top Brazilian Companies. Int. Bus. Res. 2013, 6, 62–77. [Google Scholar] [CrossRef]
- Daub, C.-H. Assessing the quality of sustainability reporting: An alternative methodological approach. J. Clean. Prod. 2007, 15, 75–85. [Google Scholar] [CrossRef]
- Dyduch, J.; Krasodomska, J. Determinants of Corporate Social Responsibility Disclosure: An Empirical Study of Polish Listed Companies. Sustainability 2017, 9, 1934. [Google Scholar] [CrossRef]
- Fernandez-Feijoo, B.; Romero, S.; Ruiz, S. Effect of Stakeholders’ Pressure on Transparency of Sustainability Reports within the GRI Framework. J. Bus. Ethics 2014, 122, 53–63. [Google Scholar] [CrossRef]
- Hąbek, P. CSR Reporting Practices in Visegrad Group Countries and the Quality of Disclosure. Sustainability 2017, 9, 2322. [Google Scholar] [CrossRef]
- Leitonienea, S.; Sapkauskiene, A. Quality of Corporate Social Responsibility Information. Procedia Soc. Behav. Sci. 2015, 213, 334–339. [Google Scholar] [CrossRef]
- Lock, I.; Seele, P. The credibility of CSR reports in Europe. Evidence from a quantitative content analysis in 11 countries. J. Clean. Prod. 2016, 122, 186–200. [Google Scholar] [CrossRef]
- Michelon, G.; Pilonato, S.; Ricceri, F. CSR reporting practices and the quality of disclosure: An empirical analysis. Crit. Perspect. Account. 2015, 33, 59–78. [Google Scholar] [CrossRef]
- Papoutsi, A.; Sodhi, M.S. Does disclosure in sustainability reports indicate actual sustainability performance? J. Clean. Prod. 2020, 260, 121049. [Google Scholar] [CrossRef]
- Roca, L.C.; Searcy, C. An analysis of indicators disclosed in corporate sustainability reports. J. Clean. Prod. 2012, 20, 103–118. [Google Scholar] [CrossRef]
- Barkemeyer, R.; Preuss, L.; Lee, L. On the effectiveness of private transnational governance regimes—Evaluating corporate sustainability reporting according to the Global Reporting Initiative. J. World Bus. 2015, 50, 312–325. [Google Scholar] [CrossRef]
- Bhatia, A.; Tuli, S. Sustainability reporting: An empirical evaluation of emerging and developed economies. J. Glob. Responsib. 2018, 9, 207–234. [Google Scholar] [CrossRef]
- Gallego, I. The use of economic, social and environmental indicators as a measure of sustainable development in Spain. Corp. Soc. Responsib. Environ. Manag. 2006, 13, 78–97. [Google Scholar] [CrossRef]
- Loza Adaui, C.R. Sustainability Reporting Quality of Peruvian Listed Companies and the Impact of Regulatory Requirements of Sustainability Disclosures. Sustainability 2020, 12, 1135. [Google Scholar] [CrossRef]
- Matuszak, Ł.; Różańska, E. CSR Disclosure in Polish-Listed Companies in the Light of Directive 2014/95/EU Requirements: Empirical Evidence. Sustainability 2017, 9, 2304. [Google Scholar] [CrossRef]
- Rankin, M.; Windsor, C.; Wahyuni, D. An investigation of voluntary corporate greenhouse gas emissions reporting in a market governance system: Australian evidence. Account. Audit. Account. J. 2011, 24, 1037–1070. [Google Scholar] [CrossRef]
- Szczepankiewicz, E.I.; Mućko, P. CSR Reporting Practices of Polish Energy and Mining Companies. Sustainability 2016, 8, 126. [Google Scholar] [CrossRef]
- Tsalis, T.A.; Malamateniou, K.E.; Koulouriotis, D.; Nikolaou, I.E. New challenges for corporate sustainability reporting: United Nations’ 2030 Agenda for sustainable development and the sustainable development goals. Corp. Soc. Responsib. Environ. Manag. 2020, 27, 1617–1629. [Google Scholar] [CrossRef]
- Chang, K. The effects of ownership and capital structure on environmental information disclosure: Empirical evidence from Chinese listed electric firms. WSEAS Trans. Syst. 2013, 12, 637–649. [Google Scholar]
- Moseñe, J.A.; Burritt, R.L.; Sanagustín, M.V.; Moneva, J.M.; Tingey-Holyoak, J. Environmental reporting in the Spanish wind energy sector: An institutional view. J. Clean. Prod. 2013, 40, 199–211. [Google Scholar] [CrossRef]
- Camargos, M.R.; Jannuzzi, G.M.; Gavira, M.O. Analysis of the sustainability reporting initiatives of electric utilities in Brazil. Industrija 2014, 42, 127–147. [Google Scholar] [CrossRef]
- Sartori, S.; Witjesb, S.; Campos, L.M.S. Sustainability performance for Brazilian electricity power industry: An assessment integrating social, economic and environmental issues. Energy Policy 2017, 111, 41–51. [Google Scholar] [CrossRef]
- Alrazi, B.; De Villiers, C.; Van Staden, C. The environmental reporting of electric utilities: An international comparison. In Proceedings of the 9th CSEAR Australasian Conference, Albury Wodonga, Australia, 5–7 December 2010. [Google Scholar]
- Bakhtina, K.; Goudriaan, J.W. CSR reporting in multinational energy companies. Transf. Eur. Rev. Labour Res. 2011, 17, 95–99. [Google Scholar] [CrossRef]
- Ng, A.W.; Nathwani, J. Sustainability performance disclosures: The case of independent power producers. Renew. Sustain. Energy Rev. 2012, 16, 1940–1948. [Google Scholar] [CrossRef]
- Steinweg, T.; Wilde-Ramsing, J. Use of the Global Reporting Initiative (GRI) in Sustainability Reporting by European Electricity Companies; Stichting Onderzoek Multinationale Ondernemingen (SOMO), Centre for Research on Multinational Corporations: Amsterdam, The Netherlands, 2012. [Google Scholar]
- Slacik, J.; Greiling, D. Compliance with materiality in G4-sustainability reports by electric utilities. Int. J. Energy Sect. Manag. 2019, 14, 583–608. [Google Scholar] [CrossRef]
- Slacik, J.; Greiling, D. Coverage of G4-indicators in GRI-sustainability reports by electric utilities. J. Public Budg. Account. Financ. Manag. 2020, in press. [Google Scholar] [CrossRef]
- Traxler, A.A.; Greiling, D. Sustainable public value reporting of electric utilities. Balt. J. Manag. 2019, 14, 103–121. [Google Scholar] [CrossRef]
- Talbot, D.; Boiral, O. GHG Reporting and Impression Management: An Assessment of Sustainability Reports from the Energy Sector. J. Bus. Ethics 2018, 147, 367–383. [Google Scholar] [CrossRef]
- Kraft, B. Shedding light on stakeholder power in a regulated market: A study of variation in electric utilities’ climate change disclosures. Organ. Environ. 2018, 31, 314–338. [Google Scholar] [CrossRef]
- Alrazi, B. The carbon disclosure of the Malaysian major power producers: An exploratory study. J. Bus. Manag. 2014, 3, 12–25. [Google Scholar]
- Alrazi, B.; De Villiers, C.; Van Staden, C. The environmental disclosures of the electricity generation industry: A global perspective. Account. Bus. Res. 2016, 46, 665–701. [Google Scholar] [CrossRef]
- Bahari, N.A.S.; Alrazi, B.; Husin, N.M. A comparative analysis of carbon reporting by electricity generating companies in China, India, and Japan. Procedia Econ. Financ. 2016, 35, 74–81. [Google Scholar] [CrossRef][Green Version]
- Kraatz, M.S.; Block, E.S. Organizational implications of institutional pluralism. In The SAGE Handbook of Organizational Institutionalism; Greenwood, R., Oliver, C., Suddaby, R., Sahlin-Andersson, K., Eds.; SAGE: Thousand Oaks, CA, USA, 2008. [Google Scholar]
- Carroll, A.B.; Shabana, K.M. The business case for corporate social responsibility: A review of concepts, research and practice. Int. J. Manag. Rev. 2010, 12, 85–105. [Google Scholar] [CrossRef]
- Reverte, C. The impact of better corporate social responsibility disclosure on the cost of equity capital. Corp. Soc. Responsib. Environ. Manag. 2012, 19, 253–272. [Google Scholar] [CrossRef]
- Outtes-Wanderley, L.; Soares, L.; Lucian, R.; Farache, F.; de Sousa Filho Milton, J. CSR information disclosure on the web: A context-based approach analyzing the influence of country of origin and industry sector. J. Bus. Ethics 2008, 82, 369–378. [Google Scholar] [CrossRef]
- Kolk, A.; Fortanier, F. Internationalization and environmental disclosure: The role of home and host institutions. Multinatl. Bus. Rev. 2013, 21, 87–114. [Google Scholar] [CrossRef]
- Chapple, W.; Moon, J. Corporate social responsibility (CSR) in Asia: A seven-country study of CSR web site reporting. Bus. Soc. 2005, 44, 415–441. [Google Scholar] [CrossRef]
- Hess, D. The three pillars of corporate social reporting as new governance regulation: Disclosure, dialogue and development. Bus. Ethics Q. 2008, 18, 447–482. [Google Scholar] [CrossRef]
- Venturelli, A.; Caputo, F.; Cosma, S.; Leopizzi, R.; PizziDirective, S. Directive 2014/95/EU: Are Italian Companies Already Compliant? Sustainability 2017, 9, 1385. [Google Scholar] [CrossRef]
- Clarkson, P.M.; Li, Y.; Richardson, G.D.; Vasvari, F.P. Does it really pay to be green? Determinants and consequences of proactive environmental strategies. J. Account. Public Policy 2011, 30, 122–144. [Google Scholar] [CrossRef]
- Healy, P.; Palepu, K. Information asymmetry, corporate disclosure, and the capital markets: A review of the empirical disclosure literature. J. Account. Econ. 2001, 31, 405–440. [Google Scholar] [CrossRef]
- Mahoney, L.S.; Thorne, L.; Cecil, L.; LaGore, W. A research note on standalone corporate social responsibility reports: Signaling or greenwashing? Crit. Perspect. Account. 2013, 24, 350–359. [Google Scholar] [CrossRef]
- Dhaliwal, D.S.; Li, O.Z.; Tsang, A.; Yang, Y.G. Corporate social responsibility disclosure and the cost of equity capital: The roles of stakeholder orientation and financial transparency. J. Account. Public Policy 2014, 33, 328–355. [Google Scholar] [CrossRef]
- Pflugrath, G.; Roebuck, P.; Simnett, R. Impact of assurance and assurer’s professional affiliation on financial analysts’ assessment of credibility of corporate social responsibility information. Audit. J. Pract. Theory 2011, 30, 239–254. [Google Scholar] [CrossRef]
- Park, J.; Brorson, T. Experiences of and views on third-party assurance of corporate environmental and sustainability reports. J. Clean. Prod. 2015, 13, 1095–1106. [Google Scholar] [CrossRef]
- Brown, J.; Falaschetti, D.; Orlando, M. Auditor independence and earnings quality: Evidence for market discipline vs. Sarbanes-Oxley proscriptions. Am. Law Econ. Rev. 2010, 12, 39–68. [Google Scholar] [CrossRef]
- El-Halaby, S.; Hussainey, K. The determinants of social accountability disclosure: Evidence from Islamic banks around the world. Int. J. Bus. 2015, 20, 202–223. [Google Scholar]
- de Colle, S.; Henriques, A.; Sarasvathy, S. The paradox of corporate social responsibility standards. J. Bus. Ethics 2014, 125, 177–191. [Google Scholar] [CrossRef]
- Cantele, S.; Tsalis, T.A.; Nikolaou, I.E. A New Framework for Assessing the Sustainability Reporting Disclosure of Water Utilities. Sustainability 2018, 10, 433. [Google Scholar] [CrossRef]
- Hąbek, P.; Wolniak, R. Assessing the quality of corporate social responsibility reports: The case of reporting practices in selected European Union member states. Qual. Quant. 2015, 50, 399–420. [Google Scholar] [CrossRef]
- Global Reporting Initiative. GRI G4 Electric Utilities Sector Disclosure; Global Reporting Initiative: Amsterdam, The Netherlands, 2014. [Google Scholar]
- Directive 2014/95/EU of the European Parliament and of the Council of 22 October 2014 Amending Directive 2013/34/EU as Regards Disclosure of Non-Financial and Diversity Information by Certain Large Undertakings and Groups. Off. J. L 2014, 330, 1–9.
- Mayring, P. Qualitative content analysis. Forum Qual. Soc. Res. 2000, 1, 20. [Google Scholar] [CrossRef]
- Guthrie, J.; Abeysekera, I. Content analysis of social, environmental reporting: What is new? J. Hum. Resour. Cost. Account. 2006, 10, 114–126. [Google Scholar] [CrossRef]
- Helfaya, A.; Whittington, M. Does designing environmental sustainability disclosure quality measures make a difference? Bus. Strategy Environ. 2019, 28, 525–541. [Google Scholar] [CrossRef]
- Helfaya, A.; Whittington, M.; Alawattage, C. Exploring the Quality of Corporate Environmental Reporting. Account. Audit. Account. J. 2019, 32, 163–193. [Google Scholar] [CrossRef]
- Beske, F.; Haustein, E.; Lorson, P.C. Materiality analysis in sustainability and integrated reports. Sustain. Account. Manag. Policy J. 2020, 11, 162–186. [Google Scholar] [CrossRef]
- Global Reporting Initiative. Consolidated Set of GRI Sustainability Reporting Standards 2016; Global Reporting Initiative, Global Sustainability Standards Board: Amsterdam, The Netherlands, 2016. [Google Scholar]
- Morhardt, J.E.; Baird, S.; Freeman, K. Scoring corporate environmental and sustainability reports using GRI 2000, ISO 14031 and other criteria. Corp. Soc. Responsib. Environ. Manag. 2002, 9, 215–233. [Google Scholar] [CrossRef]
- Lee, K. Does Size Matter Evaluating Corporate Environmental Disclosure in the Australian Mining and Metal Industry A Combined Approach of Quantity and Quality Measurement. Bus. Strategy Environ. 2017, 26, 209–223. [Google Scholar] [CrossRef]
- Shapiro, S.S.; Wilk, M.B.; Chen, H.J. A comparative study of various tests of normality. J. Am. Stat. Assoc. 1968, 63, 1343–1372. [Google Scholar] [CrossRef]
- González González, J.M. Determinants of socially responsible corporate behaviours in the Spanish electricity sector. Soc. Responsib. J. 2010, 386–403. [Google Scholar] [CrossRef]
- European Commission. Communication from the Commission—Guidelines on Non-Financial Reporting (Methodology for Reporting Non-Financial Information); European Commission: Brussels, Belgium, 2017; C/2017/4234. [Google Scholar]
- European Commission. Communication from the Commission—Guidelines on Non-Financial Reporting: Supplement on Reporting Climate-Related Information; European Commission: Brussels, Belgium, 2019; C/2019/4490. [Google Scholar]


Publisher’s Note: MDPI stays neutral with regard to jurisdictional claims in published maps and institutional affiliations. |
© 2020 by the authors. Licensee MDPI, Basel, Switzerland. This article is an open access article distributed under the terms and conditions of the Creative Commons Attribution (CC BY) license (http://creativecommons.org/licenses/by/4.0/).