Article

Optimisation of Direct Battery Thermal Management for EVs Operating in Low-Temperature Climates

by
James Jeffs
1,*,
Truong Quang Dinh
1,
Widanalage Dhammika Widanage
1,
Andrew McGordon
1 and
Alessandro Picarelli
2
1
WMG, University of Warwick, Coventry CV4 7AL, UK
2
Claytex Ltd., Edmund House, Rugby Rd., Leamington Spa CV32 6EL, UK
*
Author to whom correspondence should be addressed.
Energies 2020, 13(22), 5980; https://doi.org/10.3390/en13225980
Submission received: 21 October 2020 / Revised: 5 November 2020 / Accepted: 10 November 2020 / Published: 16 November 2020
(This article belongs to the Section E: Electric Vehicles)

Abstract

:
Electric vehicles (EVs) experience a range reduction at low temperatures caused by the impact of cabin heating and a reduction in lithium ion performance. Heat pump equipped vehicles have been shown to reduce heating ventilation and air conditioning (HVAC) consumption and improve low ambient temperature range. Heating the electric battery, to improve its low temperature performance, leads to a reduction in heat availability for the cabin. In this paper, dynamic programming is used to find the optimal battery heating trajectory which can optimise the vehicle’s control for either cabin comfort or battery performance and, therefore, range. Using the strategy proposed in this research, a 6.2 % increase in range compared to no battery heating and 5.5 % increase in thermal comfort compared to full battery heating was achieved at an ambient temperature at −7 ° C.

1. Introduction

One potential barrier to the mass acceptance of electric vehicles (EVs) is range anxiety, which can be exacerbated at low ambient temperatures. Increased heating ventilation and air conditioning (HVAC) power consumption, coupled with reduced battery performance, leads to a range reduction of 40 % to 70 % at 20 ° C compared to 20 ° C [1,2]. In addressing this issue research has been focussed on the development of heat pump technologies as a more efficient mechanism to produce cabin heat [3,4,5]. Other research introduces the use of the heat pump to provide heat to the battery, thereby minimising the impact of cold temperatures [6,7,8,9]. There is a requirement to heat the battery and the cabin in such a way that the battery performance and the driving comfort, respectively, can be ensured. The objective of this research is, therefore, to develop a methodology which can actively balance the needs of these two factors according to a quantitative cost function.
The necessity for controlling the balance between battery and cabin heating is reflected by a shift in manufactures’ focus toward optimised thermal management. For example, in Reference [10], Bosch explains that their HVAC system is designed to provide heat to both the battery and cabin according to their requirements at low temperatures. In their system, this is achieved through two separate heating mechanisms. The cabin is heated via the heat pump, while the battery is heated via a positive thermal coefficient (PTC) heater and waste heat from the electric motor.
When operating in cold climates, up to 7.6 kW of heat can be required to heat the cabin [11]. By comparison, assuming most EVs have an efficiency of between 144 Wh/km to 225 Wh/km [12], then the equivalent average tractive effort on a World Harmonised Light Vehicle Test Procedure (WLTP) drive cycle would be 6.7 kW to 10.4 kW. In older electric vehicles, this heat was provided through PTC heaters with a maximum coefficient of performance of 1. In this case, the vehicle is capable of consuming as much energy through HVAC as through tractive effort. The increase in HVAC consumption is responsible for approximately 50 % of the the range loss seen at low temperatures [1]. The other 50 % of range loss arises from lithium ion cell capacity loss with temperature.
Lithium ion cells have emerged as the dominant energy storage technology for electric vehicles [13,14]. Despite this, Lithium ion cells experience significant energetic and Coulombic capacity losses at low temperatures, which can hinder their usefulness in colder climates. Reduced lithium ion diffusivity in the carbon electrode inhibits charge carrier extraction leading to a loss in capacity [15,16,17,18].
Studies in this area have shown a Coulombic capacity loss of 10 % to 50 % at 20 ° C and 10 % to 40 % at 10 ° C [16,19,20,21,22]. Poor diffusivity also leads to increased lithium density on the surface of the carbon electrode during charging events, which can result in lithium plating and the permanent loss of cycle-able material. These effects can be countered by deploying an efficient battery heating mechanism.
Low ambient temperatures can also lead to an increase in cell ageing and a reduction in power capability. In this study, neither of these effects have been considered. Cell ageing is accelerated when a cold battery is subjected to fast charging [23]; in this study, only the discharge of a cell is considered through a drive cycle. Power capability reduction caused by low ambient temperatures can cause the battery terminal voltage to drop below the minimum when high currents are drawn from the battery. Since most drive cycles are mild in terms of their current usage, this is unlikely to be a problem. This point has been demonstrated by Saxena et al., who showed that most EVs could withstand a 70% reduction in power, while still being able to complete regulation drive cycles [24].
The power requirement for cabin heating has reduced significantly with the advent of heat pumps. For example, Meyer et al. presented research on a vehicle in which HVAC consumption reduced by an approximate average of 34 % , in the temperature range of 18 ° C to 5 ° C, when using a heat pump compared to conventional PTC heating [3]. The area of heat pump research has flourished with the rise of electric vehicles. The primary appeal of the heat pump is its ability to upgrade waste heat from around the vehicle and make it useful for cabin heating. Through the use of waste heat, the heat pump is able to operate at a much high coefficient of performance (COP) than a PTC heater [4,25]. Along with the opportunity to use waste heat from multiple components of the vehicle came the question of which components could heat be extracted from. Ahn et al. demonstrated a heat pump system which could use waste heat from the vehicle’s motor, leading to a COP of between 3.2 and 3.4 [4]. In Ahn’s research, multiple levels of heat delivered from the motor were considered; however, these levels did not change dynamically through the drive cycle. Steiner et al. [5] investigated the benefits of using a heat pump to extract heat from a pre-heated battery; while this resulted in a 48% reduction in HVAC energy consumption, it is not preferable as the increased battery storage temperature may have adverse effects on battery ageing [26]. Leighton et al. proposed and demonstrated a heat pump system which was able to heat the battery and improved low temperature range by between 5.6 % and 23.2 % [6]. Like Ahn’s work, Leighton only considered the system operating in a fixed state throughout a drive cycle. Jeffs et al. demonstrated a methodology for comparing multiple operational modes in which 4 optional heat sources were considered and battery heating was considered as an optional heat sink [8]. Here, Jeffs showed that, under some conditions, heating the battery is preferable, but they only considered battery heating at the start of the cycle and did not consider whether further benefit could be gained by dynamically optimising the heating of the battery.
Authors have shown that it can be beneficial to heat the electric battery using a heat pump in cold conditions. However, so far, this has only been considered as a binary interaction, i.e., the battery is either heated or it is not. It is, therefore, important to investigate what further benefits can be gained through considering the thermal connection between the heat pump and battery dynamically. This should be done while also considering the impact that battery heating will have on cabin comfort and, therefore, developing a method for balancing the needs of the cabin and the battery. Using the battery as a heat sink will increase the batteries temperature, reducing the low temperature performance deficit, but it also reduces the amount of heat that can be delivered to the cabin. To heat both the cabin and the battery, one heat source needs to be split among two sinks. There is, therefore, a trade off between range (which is improved by heating the battery) and comfort (which is reduced by heating the battery), which needs to be considered. Contextually, this problem can be likened to that of the power split problem in hybrid vehicles. In this area of research, dynamic programming (DP) is considered to be the benchmark of what is potentially achievable for a system and is able to find the global minima in control optimisation problems [27,28].
DP is a method of generating optimised control trajectories for dynamic problems. A dynamic model is used to generate a cost matrix which describes the cost of an action given a control choice and a given vehicle state. An optimisation algorithm is then used to find a series of control options which leads to the minimum cost through the dynamic problem. The advantage of this method is that having full knowledge of the consequence of every control option at every time step allows for the absolute optimum control trajectory to be found. The disadvantage of this method is that it is rarely implementable in its pure form, since full knowledge of the duty cycle is required beforehand, and found optimal trajectories are only applicable to specific scenarios. It is, therefore, regarded as the best case scenario which implementable strategies aim to meet [29].
Other optimised control strategies, such as heuristic control techniques and static optimisation, are more implementable than DP but are sub-optimal in comparison [30]. For example, Wang et al. showed that DP could reduce the fuel costs of a Toyota Prius by 30 % , but, when a heuristic controller was created to mimic the DP results, the improvement reduced to 27 % [29].
The remainder of the paper is structured as follows: Section 2 describes the vehicle model used to conduct the research, Section 3 describes how the vehicle performance will be measured, Section 4 describes how the model is validated, Section 5 explains how a specific DP algorithm was implemented, and Section 5.2 defines the cost function that describes the balance between range and comfort; Section 6.3 and Section 6.4 show the results of implementing the DP method and the optimal control trajectories produced, and Section 6.5 describes a potential route to the actual implementation of the results presented. A review of the method used with suggestions of improvements is made in Section 7, and, finally, Section 8 summarises the progress made through this research.

2. Vehicle and Thermal Model

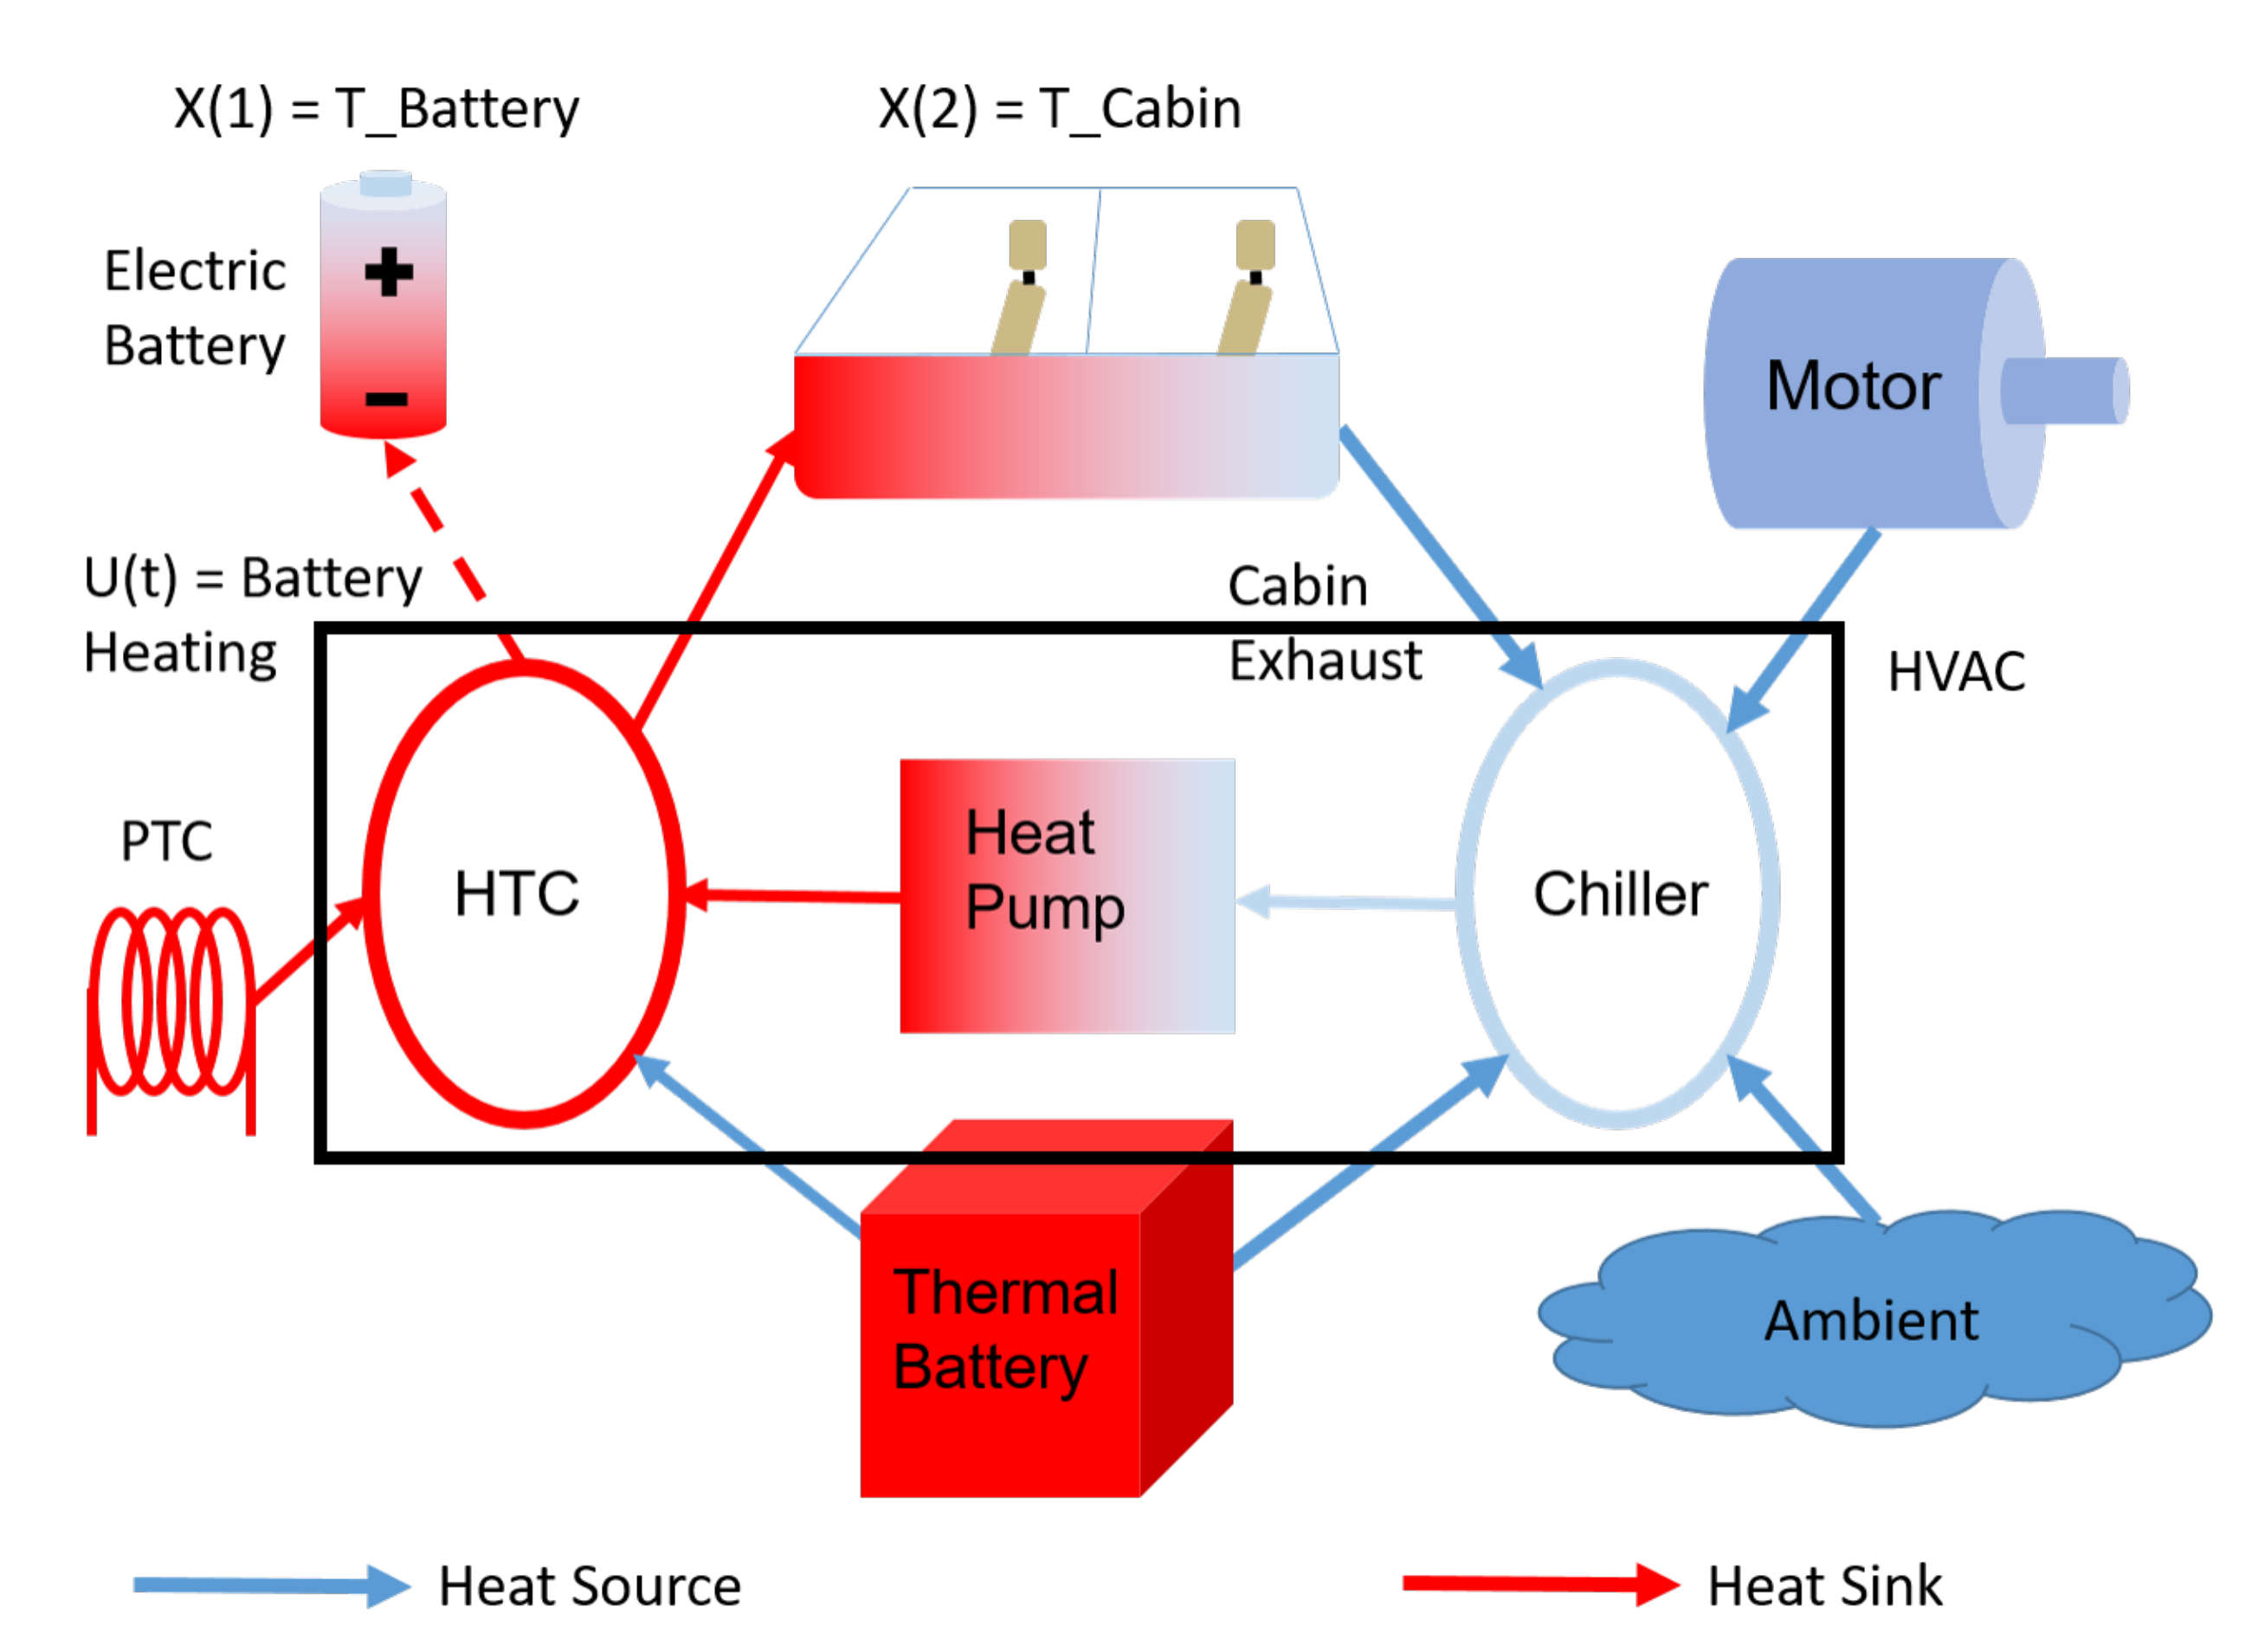
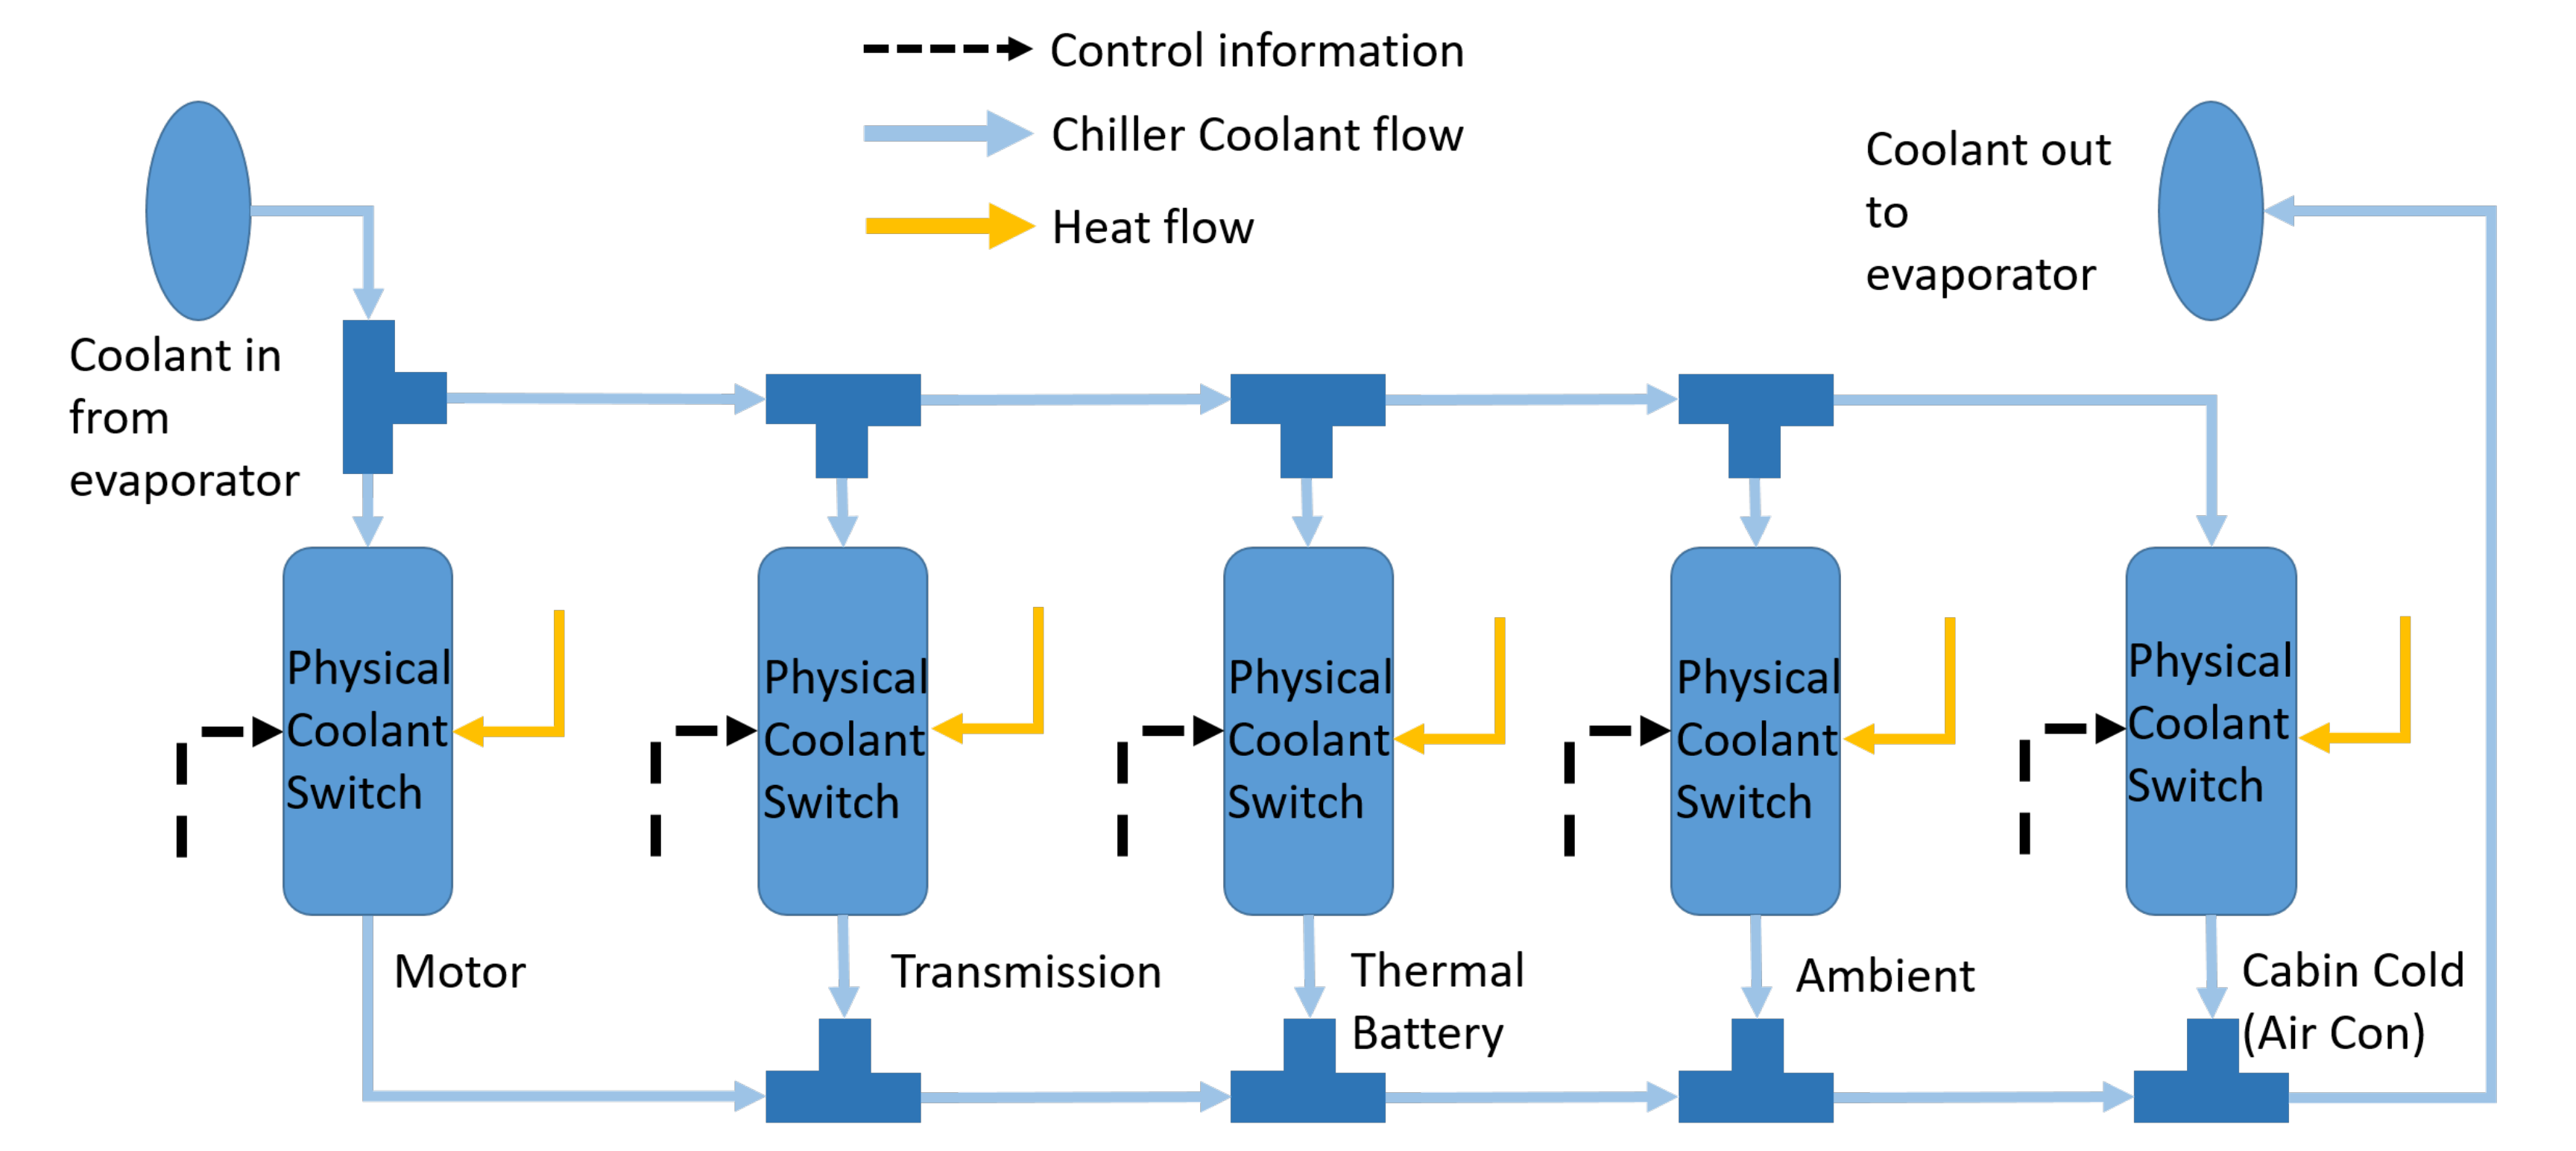
The architecture of the heat pump system can be seen in Figure 1. Here, the interactions between vehicle components and the heat pump are shown. The connection between the battery and heat pump is identified with a dashed line as it is the connection which will be optimised through dynamic programming. If the battery raises above its target temperature of 20 ° C, then the vehicle controller will cease heating of the battery.
Figure 1 shows a PTC heater which is required to support the heat pump in extremely low temperatures and during the warm up phase [31]. In extremely cold temperatures, the heat pump is not able to extract heat from ambient, so its heat output is reduced; in these conditions, the PTC heater is required to meet the heating load. Additionally, Kim et al. showed that a PTC heater is required during the warm up phase of the heat pump to provide adequate cabin heating [31]. Here, the PTC is controlled to supply 4 kW of heat from the beginning of the cycle until the cabin reaches its target temperature, or the high temperature coolant (HTC) circuit, which provides heat to the battery and the cabin, reaches its target temperature of 90 ° C.
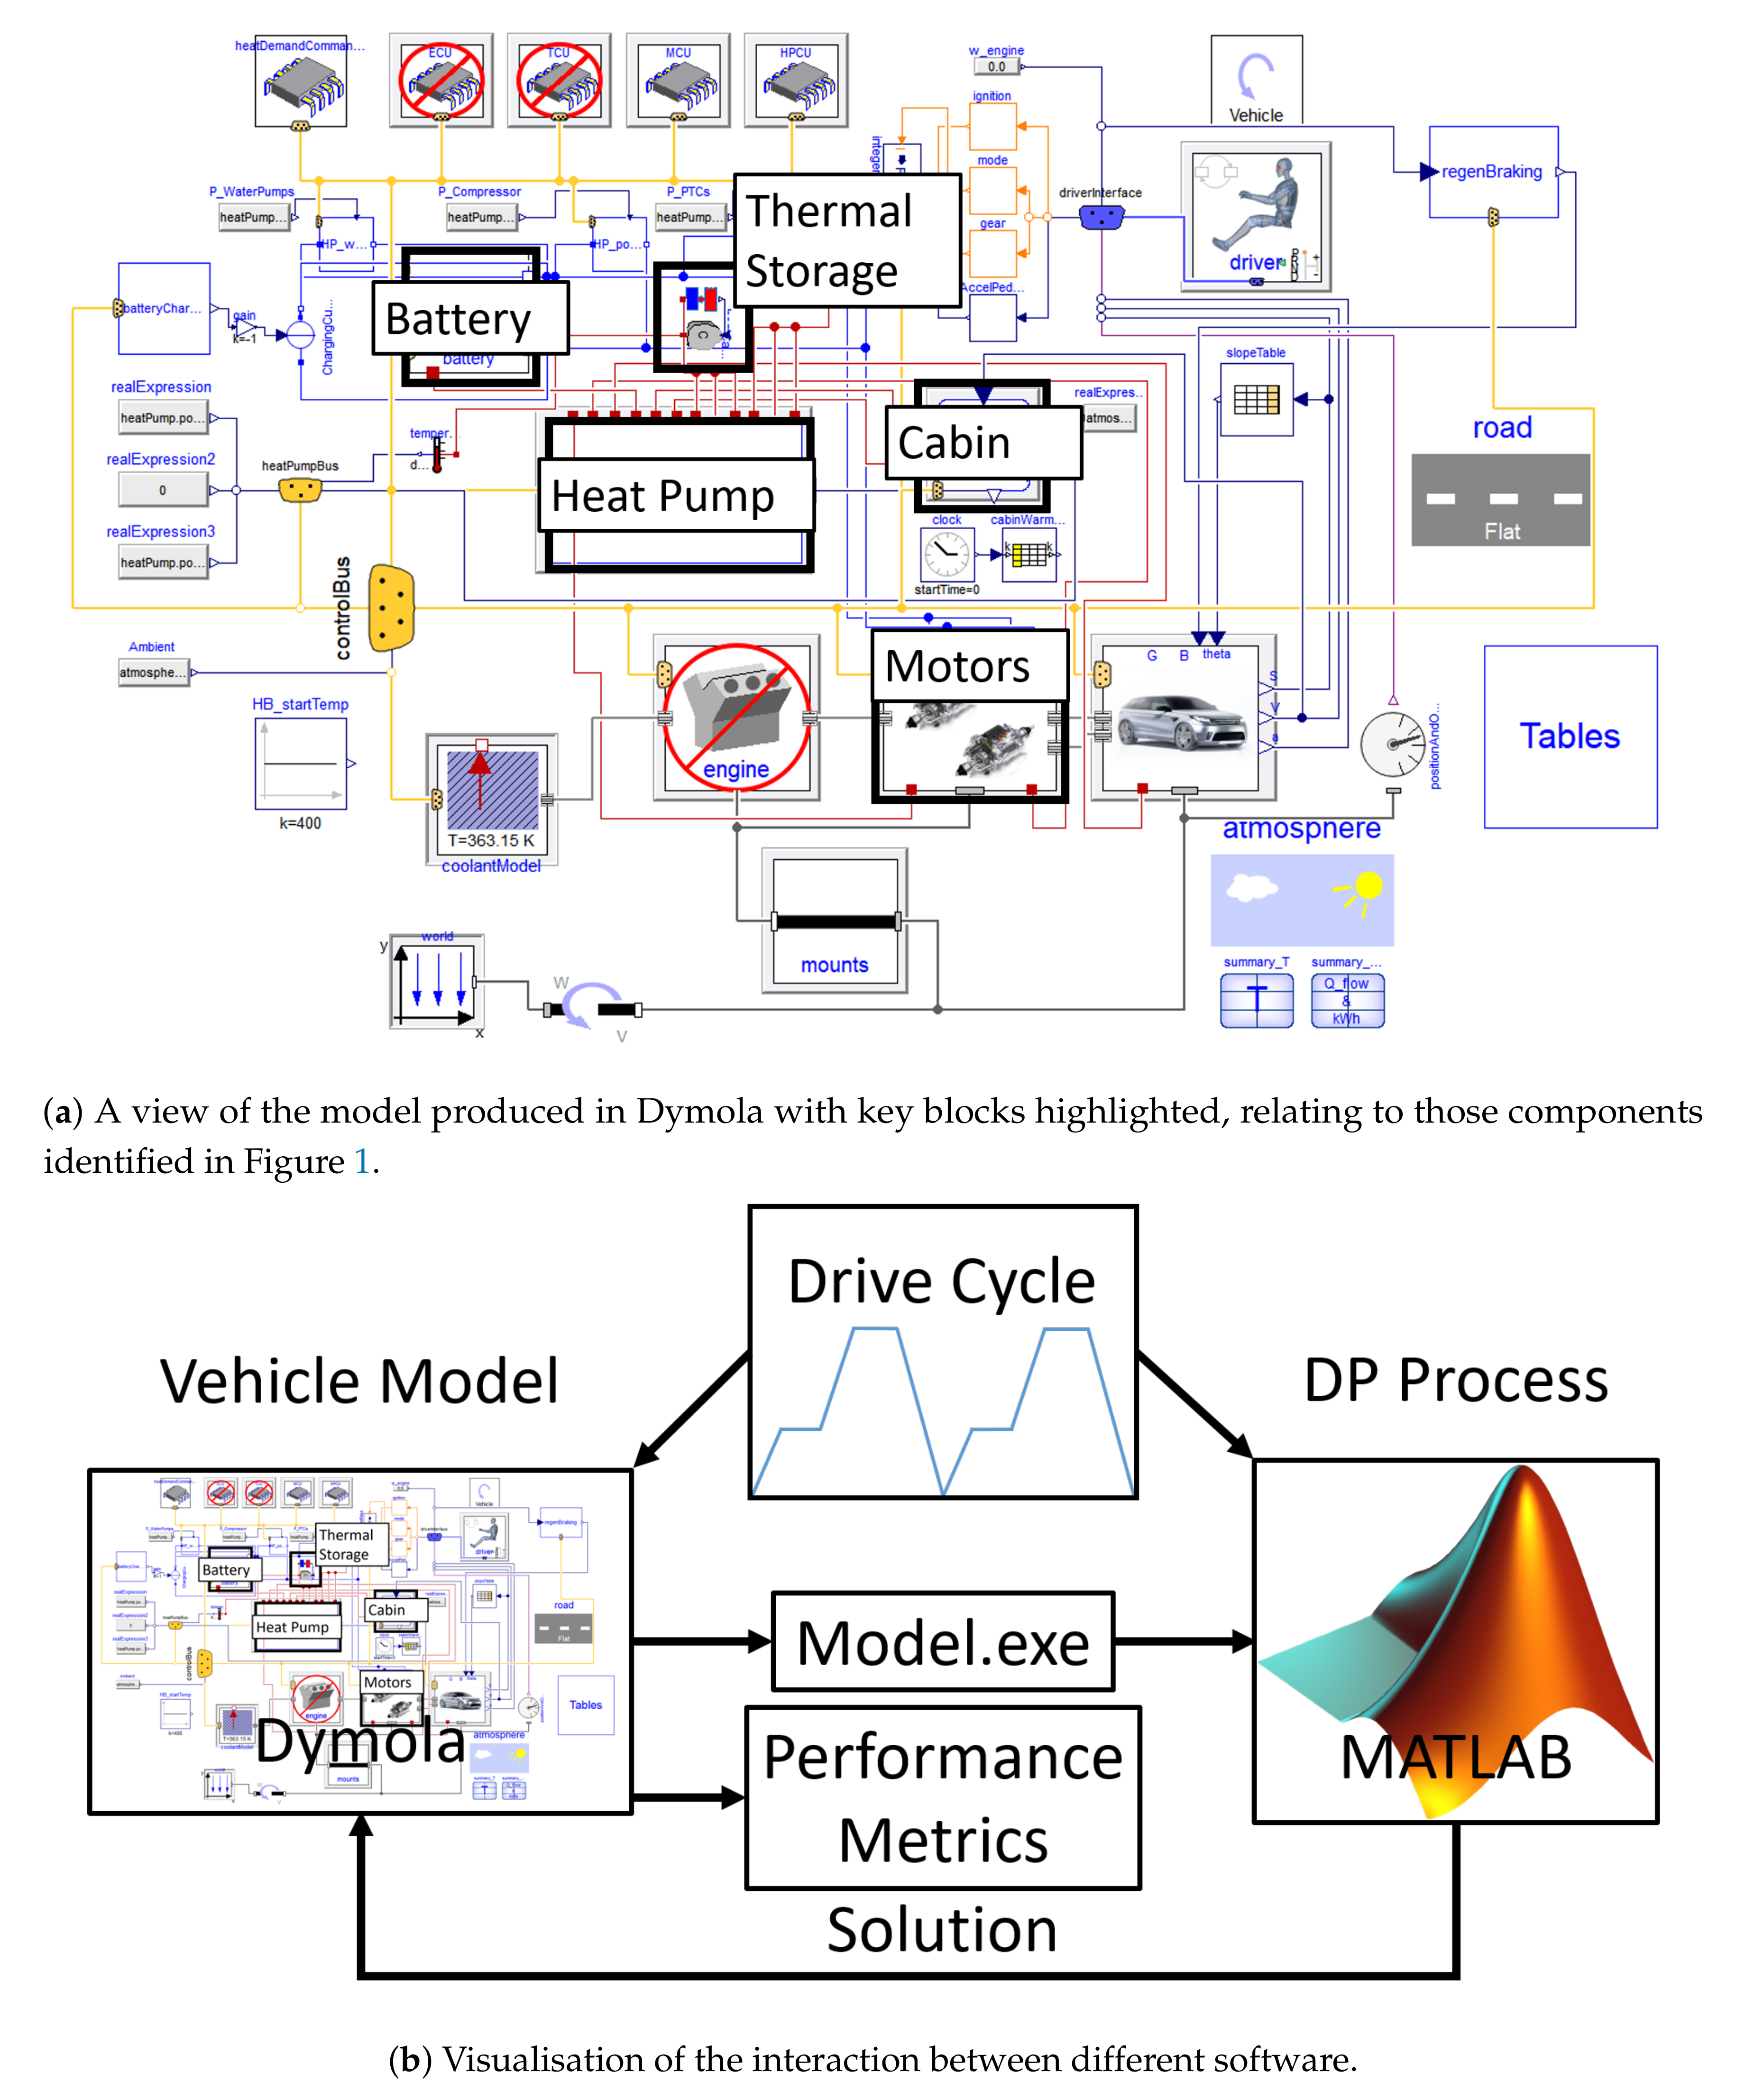
A vehicle model built in Dymola (Version 2019, Claytex ltd Libraries, Leamington Spa, UK) has been used to evaluate, develop, and optimise a battery thermal management control which balances comfort and range through the application of DP. The vehicle model is a hypothetical EV, which has parameters defined in Table 1. The model utilises a physical heat pump model, which uses waste heat from the motor and cabin exhaust. The system also collects heat from ambient and is further supported by a thermal storage system. This is in agreement with the results presented in Jeffs et al. concerning the most useful components to be used with a heat pump [8]. The models for the heat pump, battery, cabin, motor, and thermal storage will be explained in the remainder of this section. Full and further details of the model can be found in Reference [8,32]. Should the reader be further interested in the model, the libraries used are available from Claytex Ltd.

2.1. Heat Pump

The heat pump is able to extract heat from multiple sources around the vehicle, as shown in Reference [8,32]. Parameters relating to the heat pump’s operation can be found in Table 2.
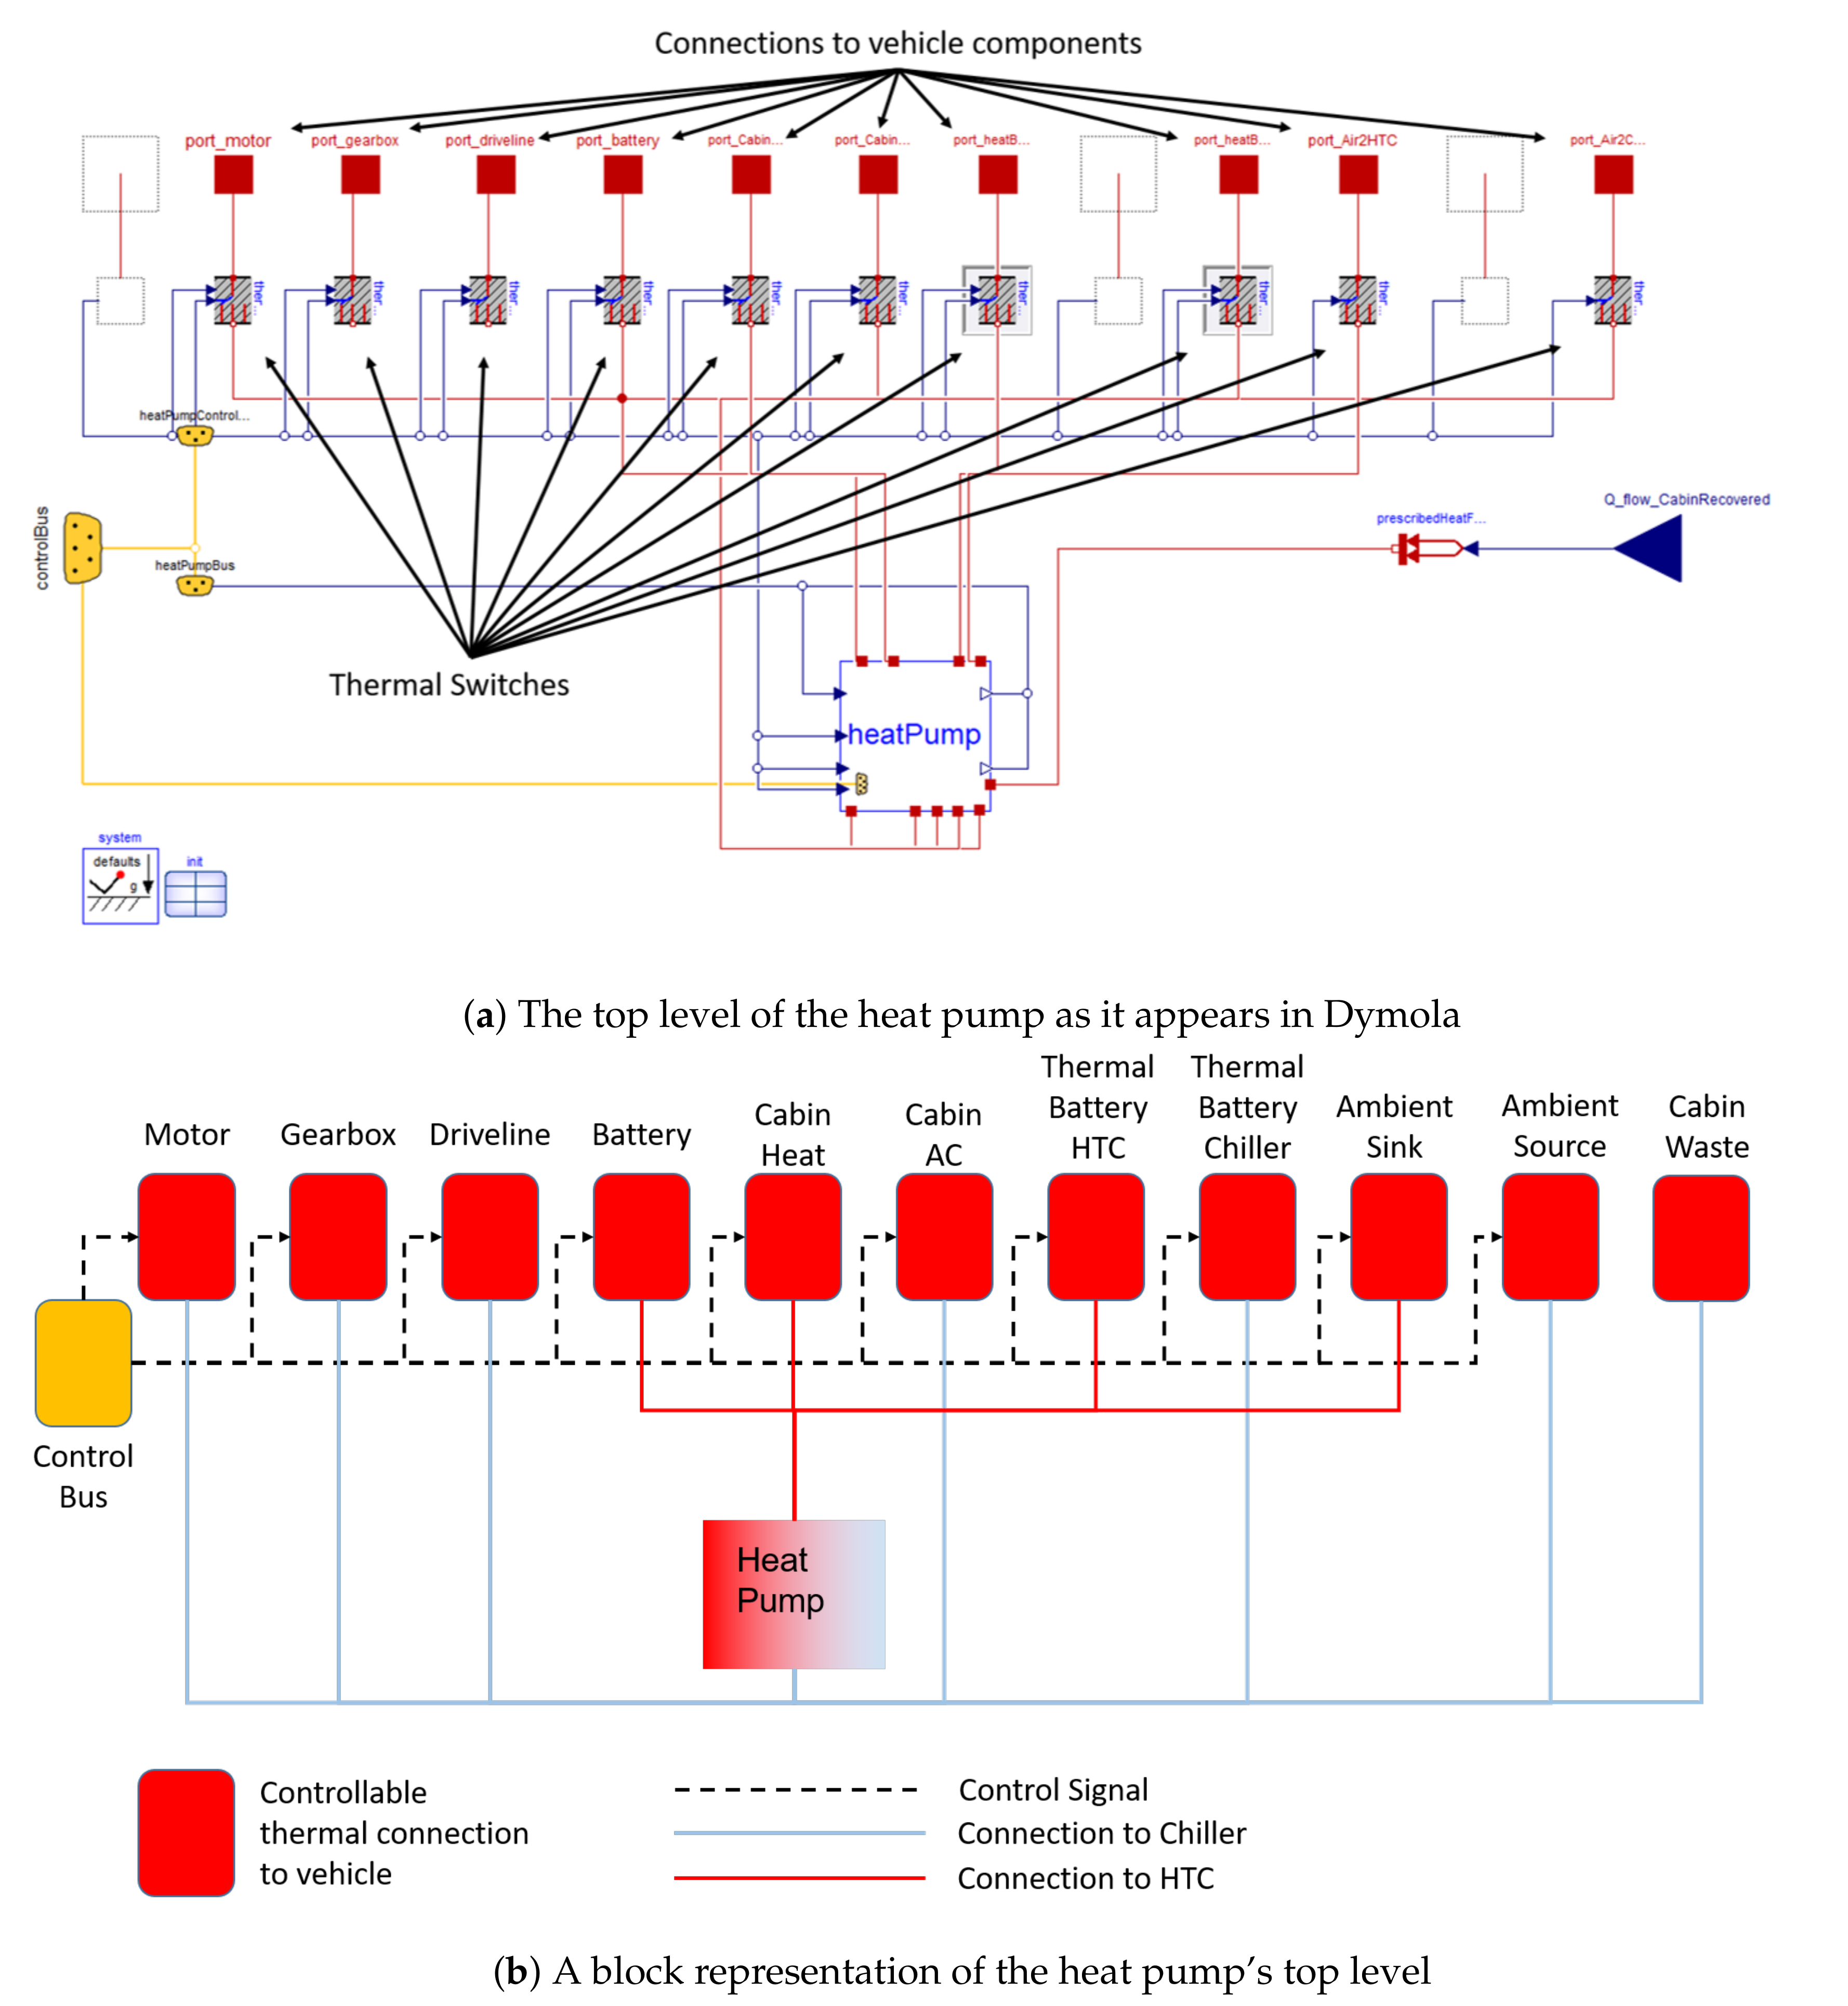
For the purposes of this work, focus is given to the connection between the heat pump and the battery. The top level of the heat pump is shown in Figure 2, and this corresponds to the box labelled HVAC in Figure 1. Figure 2a shows the model as it appears in Dymola, while Figure 2b gives a block representation of the Figure 2. Here, the thermal switch for the battery is used to isolate the battery from the heat pump when the battery has reached its target temperature of 20 ° C. When the battery is being heated, the heat flow is controlled by a dynamic thermal resistor inside the thermal switch, allowing the user to set a desired heat flow. In a physical vehicle, this would be controlled by the temperature of coolant sent to the battery and its mass flow rate. Here, dynamic thermal resistors are used to simplify the interaction while maintaining the functionality. The heat flow for the battery is set inside a heat pump control unit (HPCU), external to the heat pump model, which is described in Section 2.2.
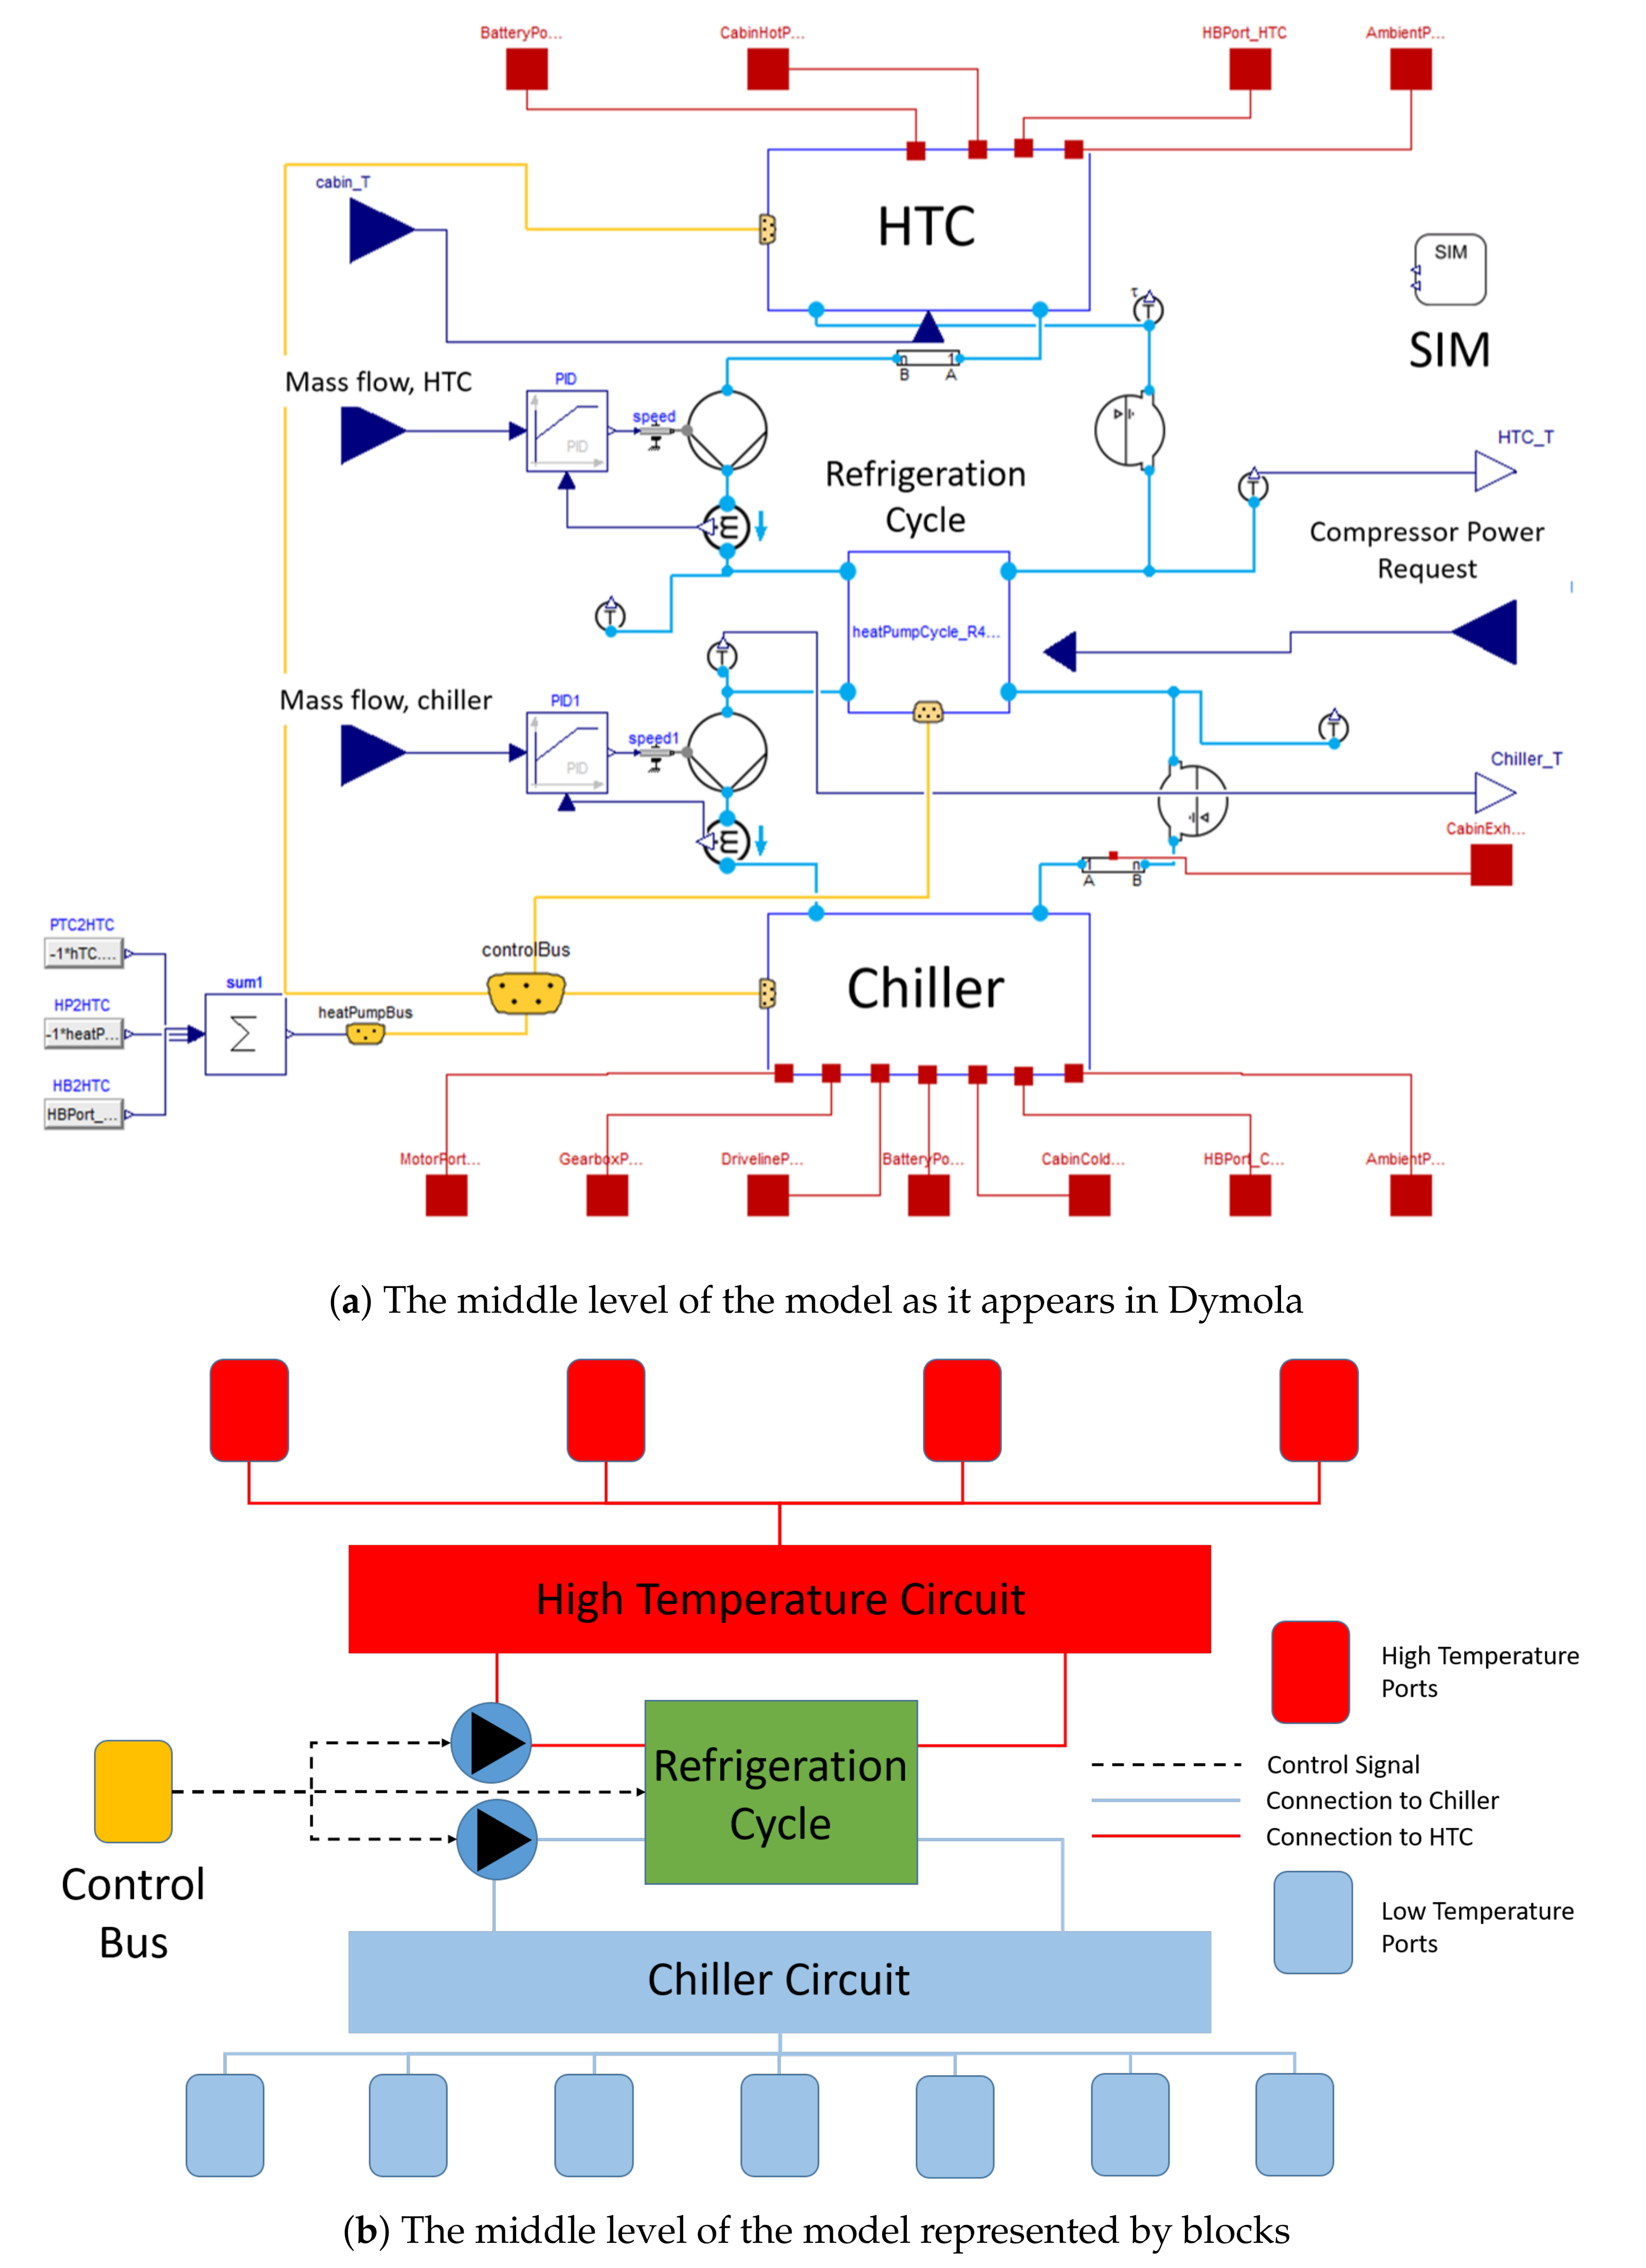
Inside the block labelled “Heat Pump” in Figure 2b is the middle layer of the heat pump seen in Figure 3. The middle level of the heat pump model is used to house, pump coolant between, and direct heat flows to the 3 main models of the heat pump. These are the HTC, chiller circuit, and refrigeration loop. Inputs to this level include coolant mass flow rate (which is then controlled by a pump and a proportional integral derivative (PID) controller), compressor power demand which is passed onto the refrigerant model, and cabin temperature which is used to shut off the PTC heater, which is located in the HTC. The coolant circuits themselves contain heat exchangers (HXs) which have been sized using examples and estimates taken from components found on existing vehicles. This level also sees the input of heat recuperated from cabin exhaust, which is used to increase the temperature of the chiller loop.
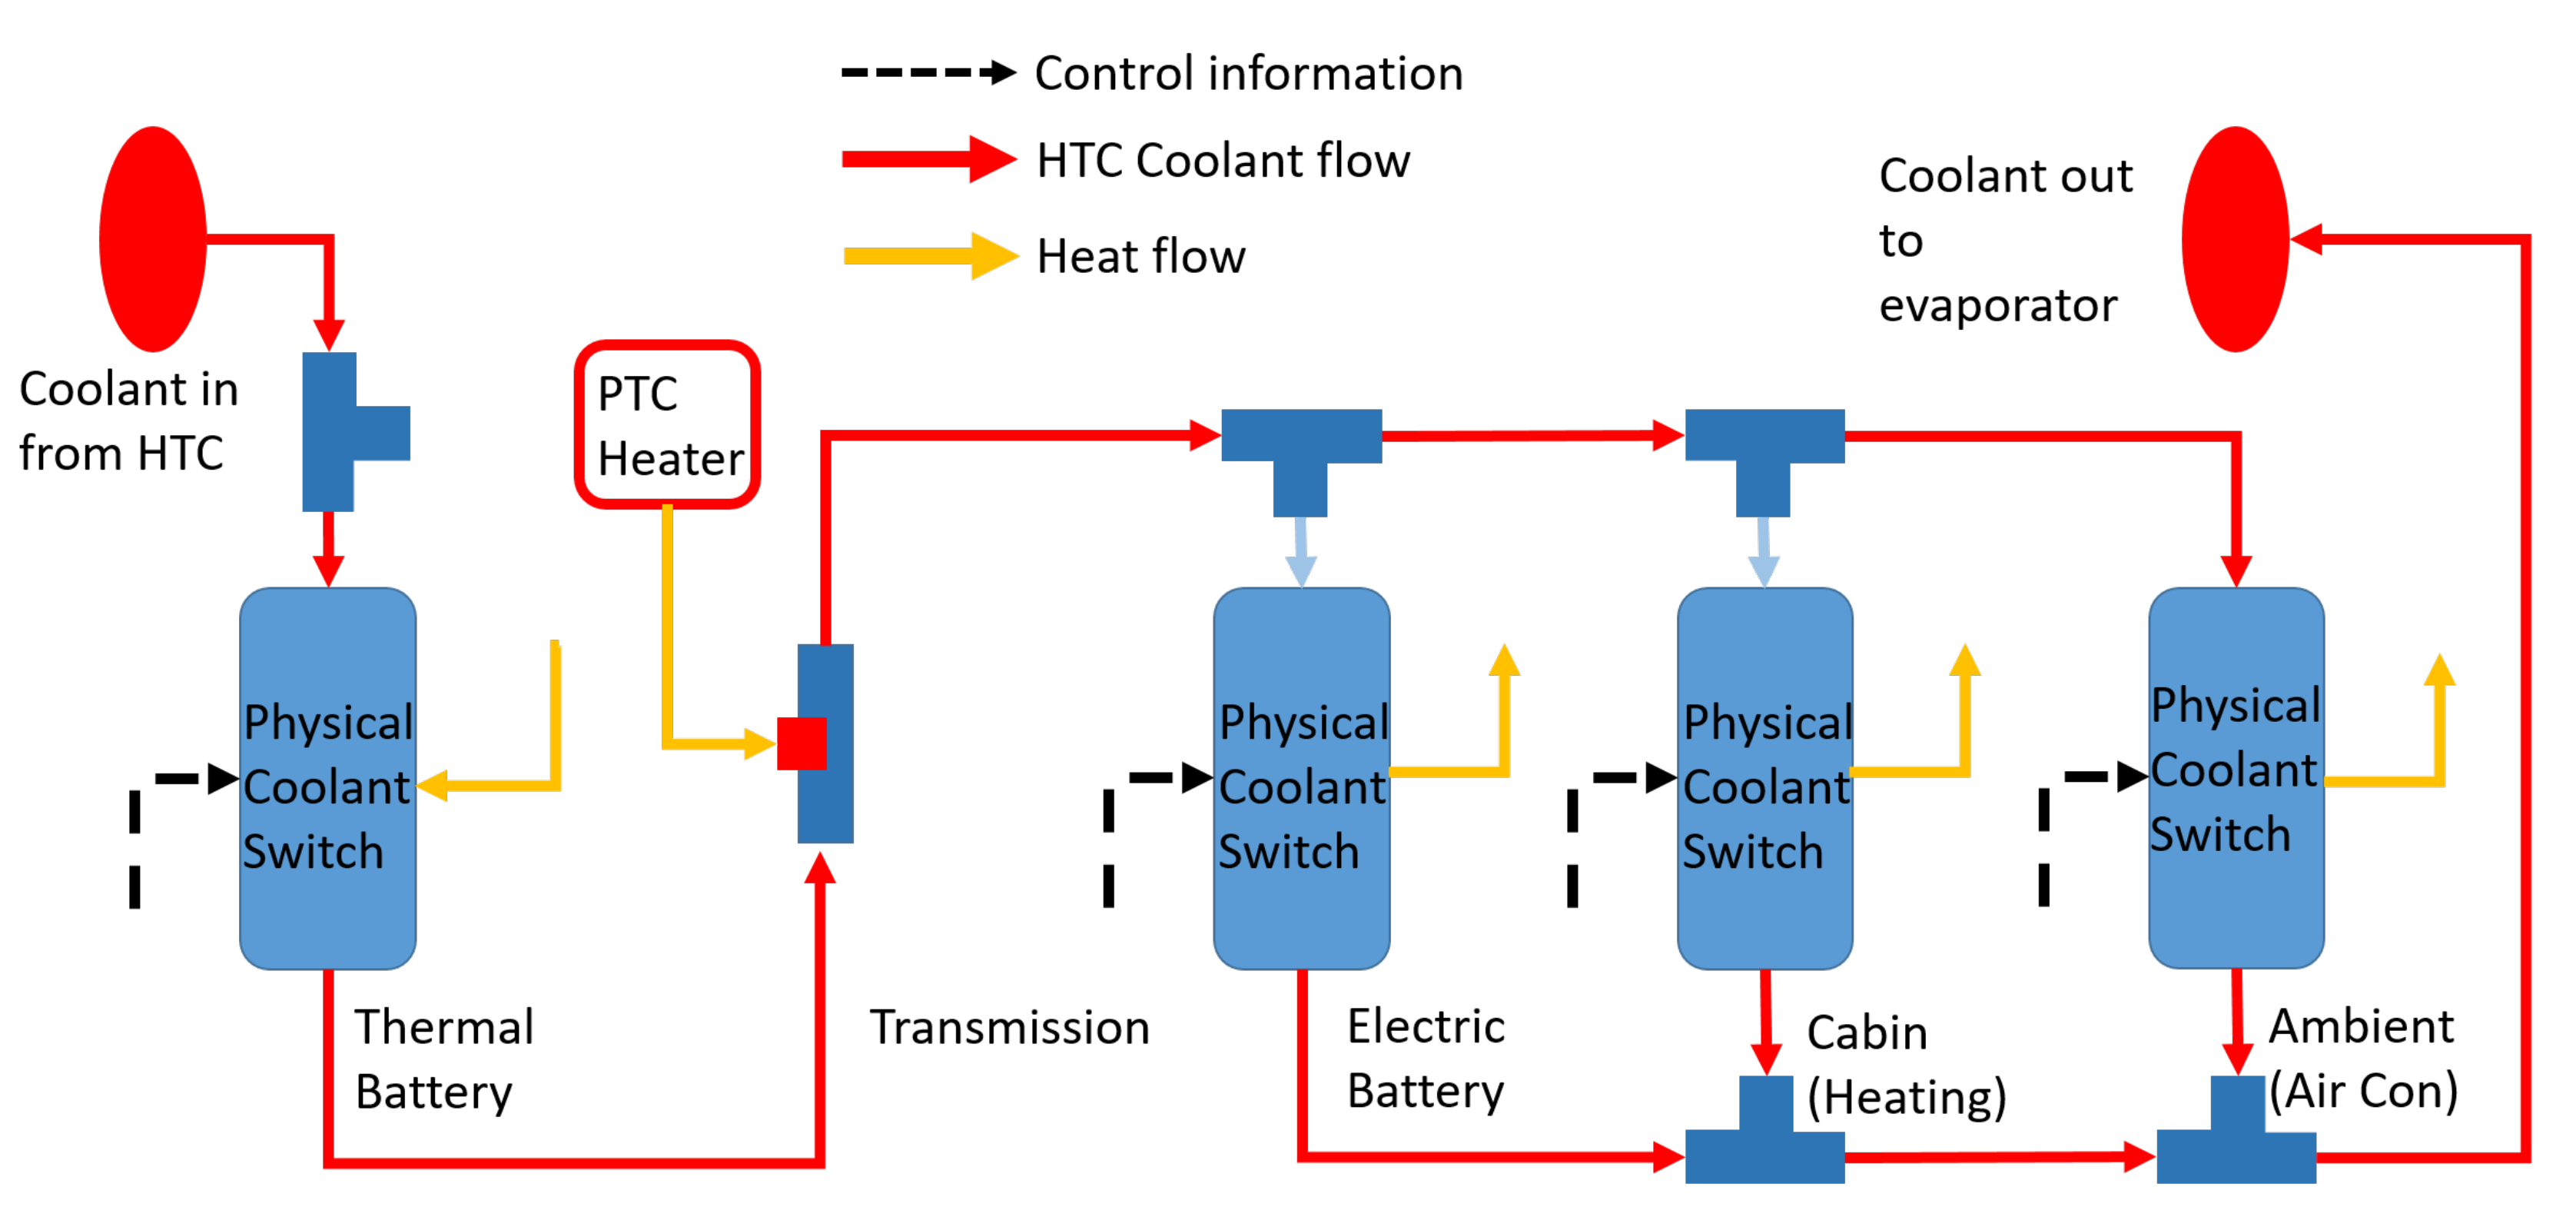
The coolant circuits, HTC, and chiller are shown in Figure 4 and Figure 5, respectively. They have operating temperatures of 90 ° C and 10 ° C, respectively. In Figure 4, the thermal battery and PTC heater are in series before the coolant reaches the cabin, battery, and ambient, which are in parallel. It can also be seen that all components with the exception of the PTC heater have a bypass option; this is the second control point for component connections which can be used to thermally isolate a component from the system. This arrangement was chosen so that the thermal battery could be used to increase the coolant temperature from the condenser output and under certain conditions negate the need for the PTC heater, which is set to turn off if the coolant temperature exceeds 85 ° C. The hot coolant is then split between the battery and the cabin; hence, when battery heating is operational, the cabin receives less mass flow through its HX. Additionally, as the battery heating is increased, the coolant outlet temperature will be lower, increasing the demand on the heat pump, or further reducing cabin heat when the compressor and PTC loads are saturated.
The chiller circuit is arranged in a similar way to the HTC, as seen in Figure 5, with the components capable of contributing heat to the system in parallel. These HXs allow heat to be extracted from; the motor and inverter (as one unit), the gearbox and driveline (which will be treated as one component and refereed to as transmission), the battery, the thermal battery, and ambient. For the purposes of this research, the transmission and battery are not used as heat sources. Battery cooling is implementable through chiller in case of excessive battery temperatures which are not seen in the scenarios tested here. The chiller circuit also uses bypasses to thermally isolate components from the heat pump.
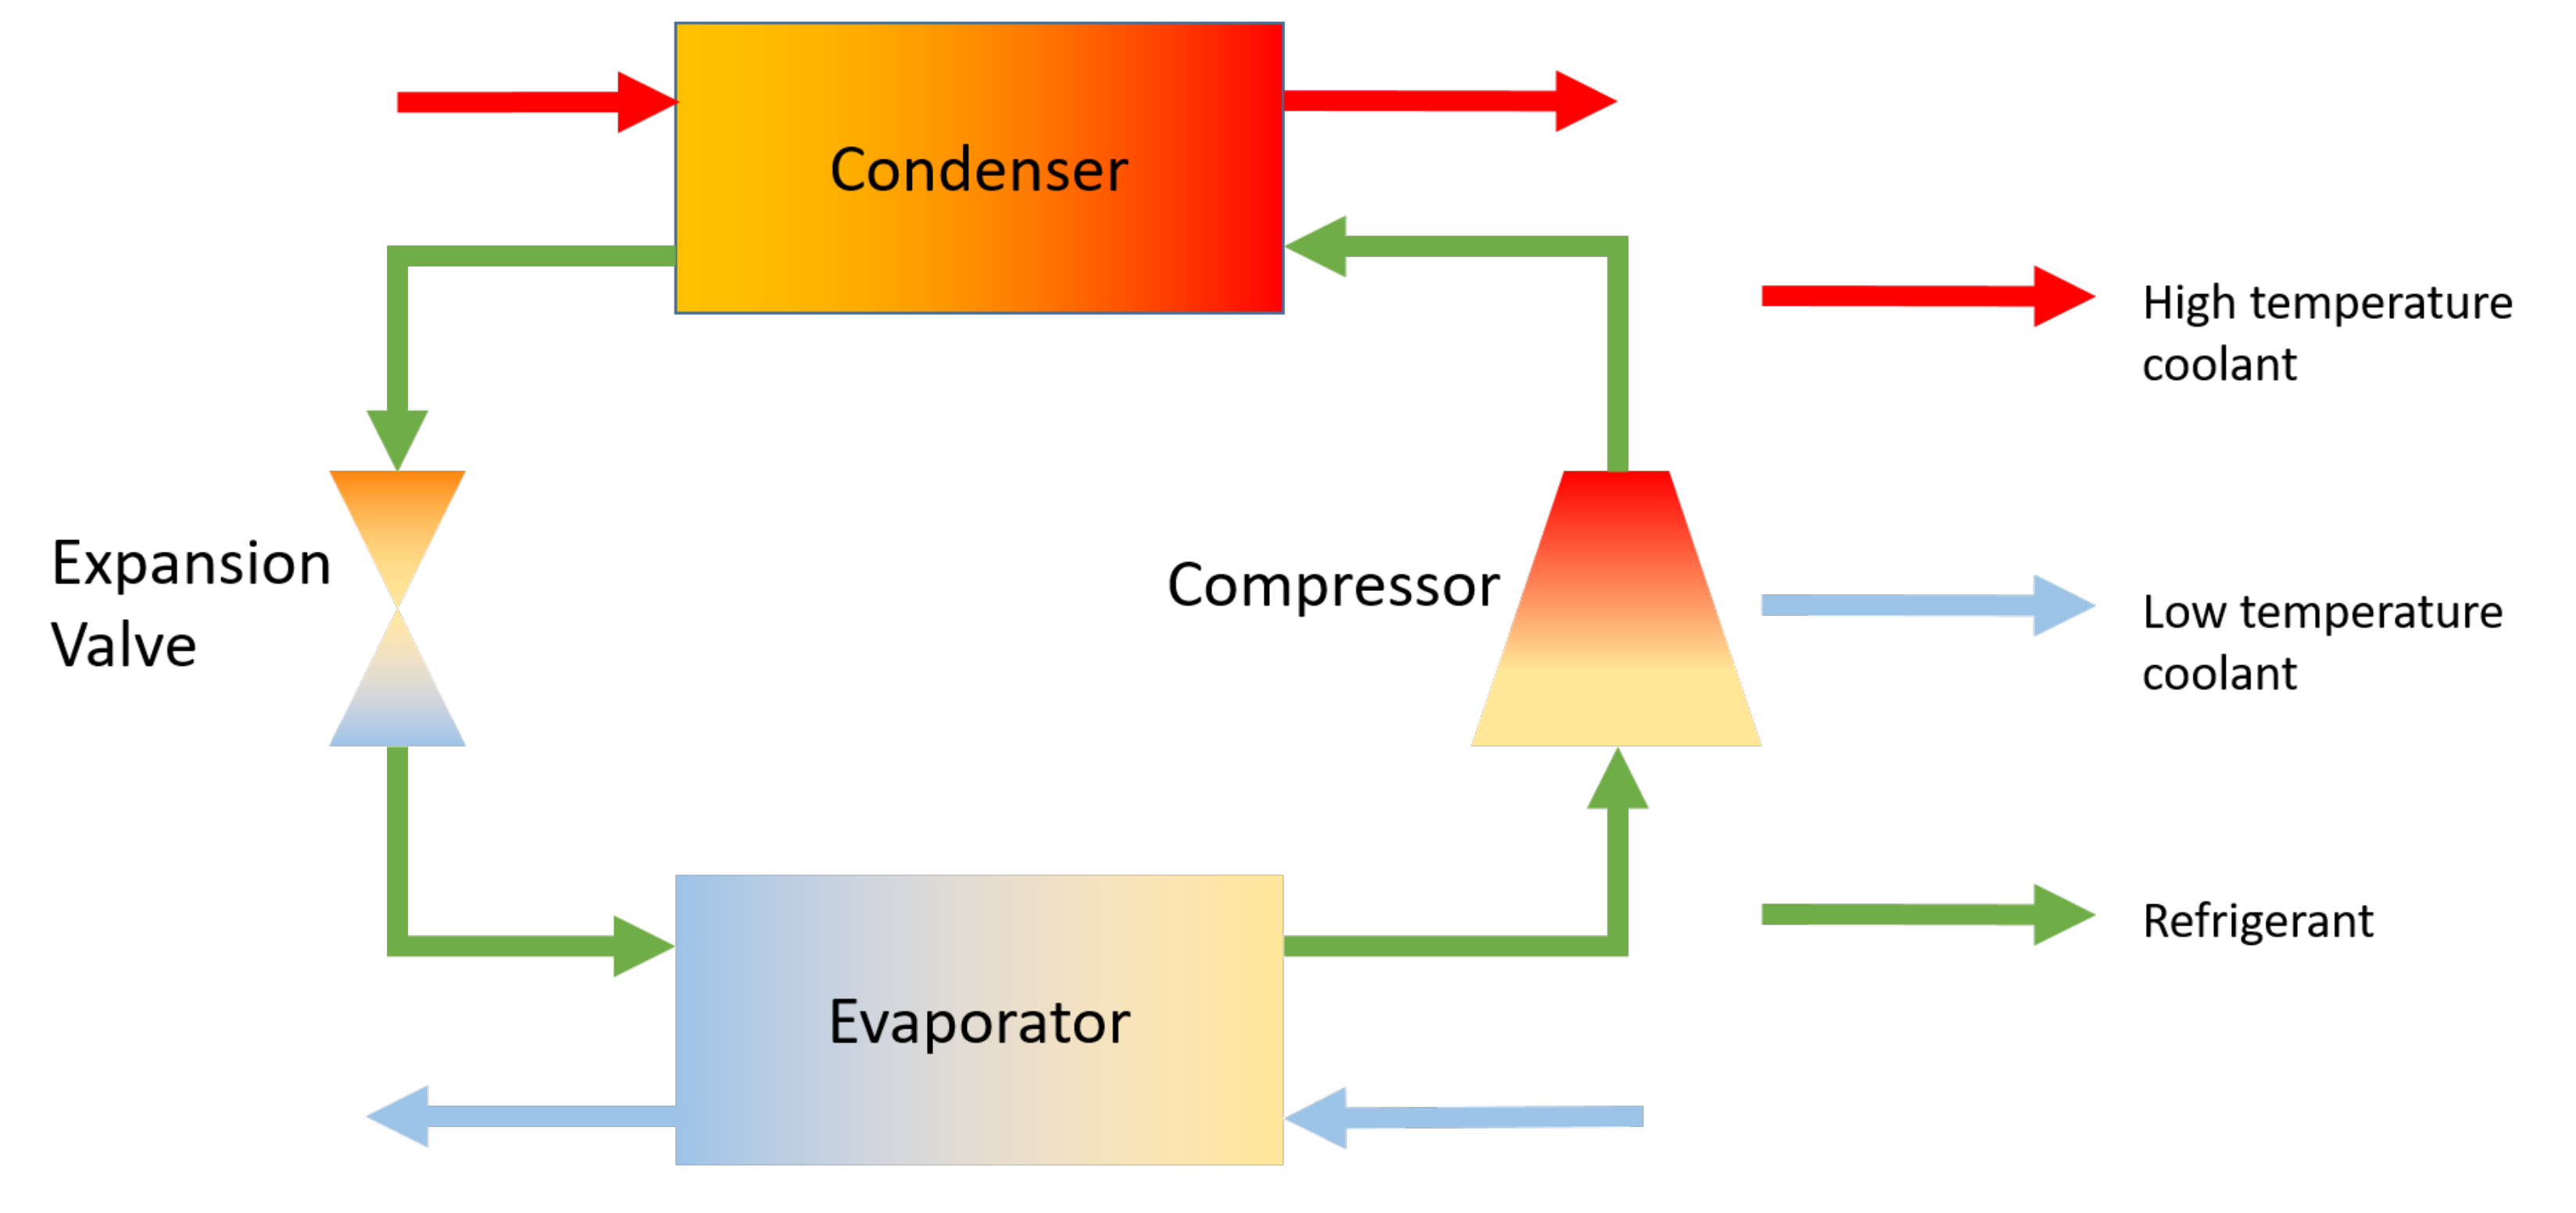
The bottom level of the heat pump contains the physical model of the refrigerant circuit. For this research, R134a is used as the refrigerant. The configuration of the refrigeration circuit is typical of what may be found in literature [4,6]. The refrigeration cycle uses refrigerant to coolant HXs (opposed to more traditional refrigerant to air HXs) to distribute and collect heat to/from the vehicle. The coolant system is limited by the melting and boiling points of the coolant; it is, therefore, important that the compressor is carefully controlled to prevent the coolant from freezing or boiling. The coolant is prevented from going beyond its temperature limits using the HPCU, which controls the compressor demand seen on the right of Figure 6. The refrigerant is protected from exceeding its pressure limit by the PID labelled “Pressure Control PID”, seen in Figure 6, which is set to limit the pressure to 30 bar; chosen corresponding to R134a’s pressure-enthalpy diagram. Since there are two power demands at this level, the demand according to the pressure controller and the demand input from the HPCU, the minimum of these values is used to control the compressor, ensuring that neither refrigerant pressure nor coolant temperature exceed their physical limits.

2.2. Heat Pump Control Unit (HPCU)

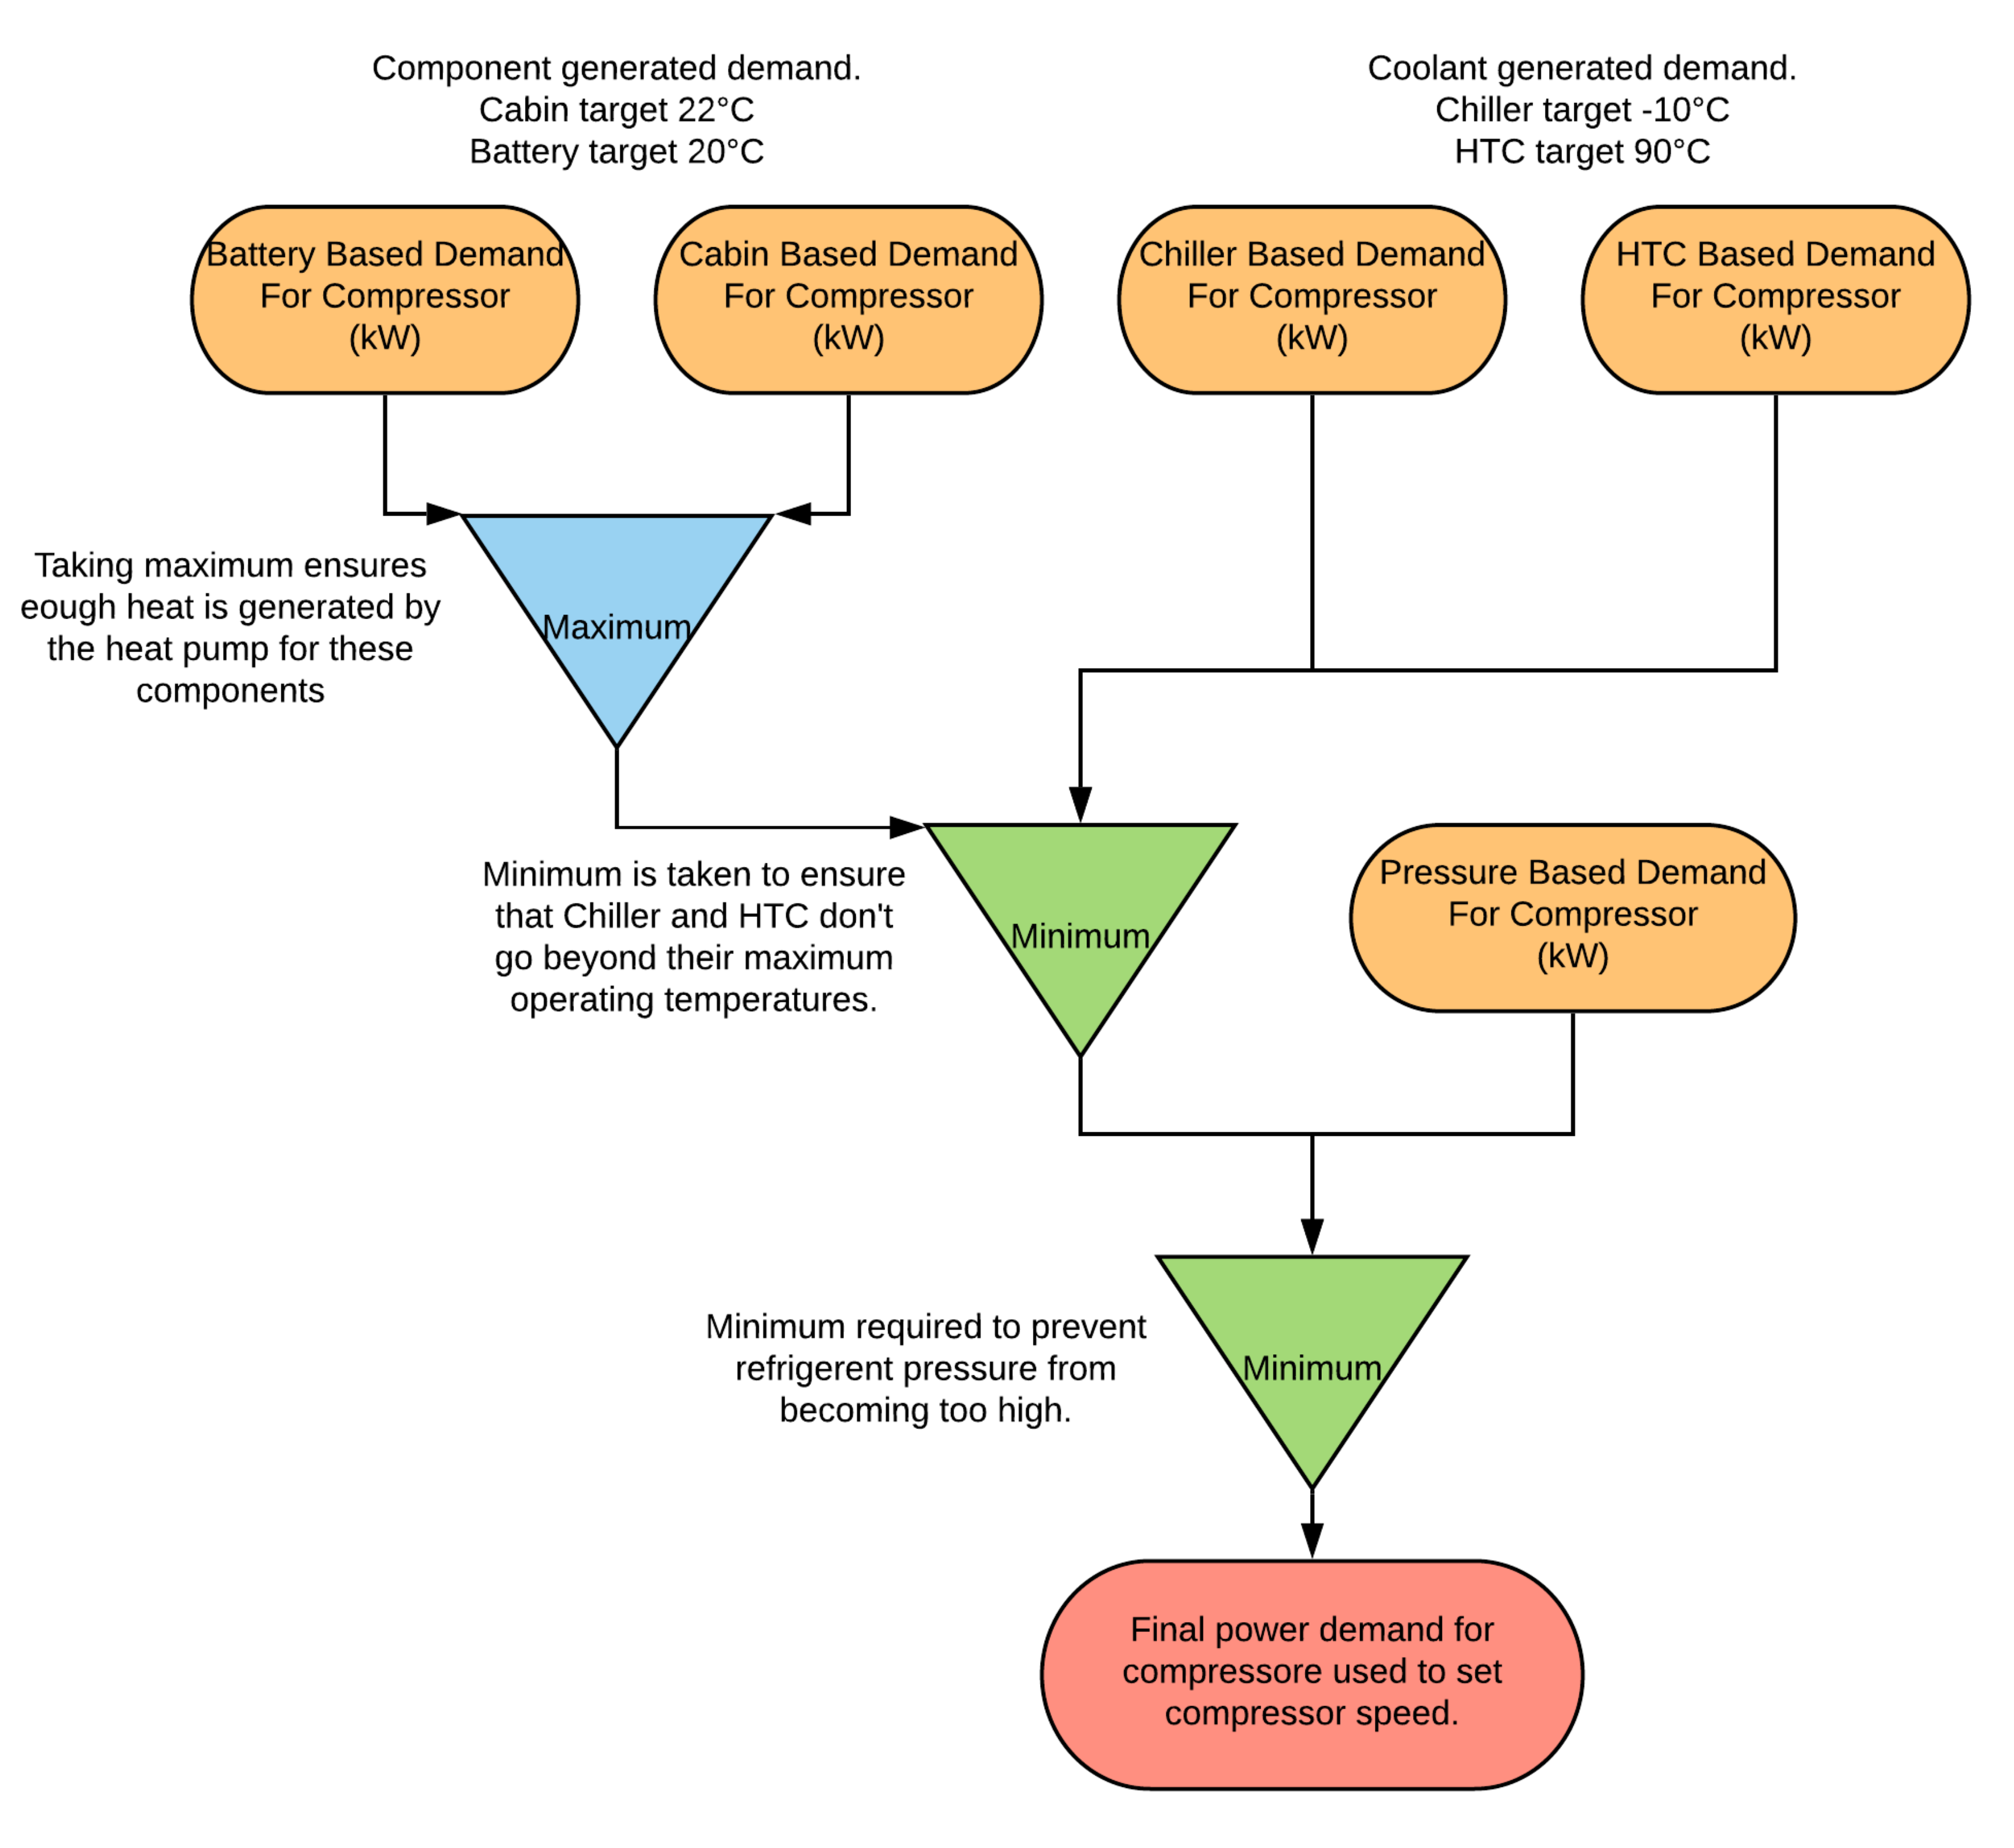
The heat pump control unit has two primary purposes: firstly, to set the desired amount of battery heating, which will be implemented using a heating schedule generated through the results of dynamic programming; and secondly, to set the desired power output of the heat pump compressor. The compressor controller, shown schematically in Figure 7, has the purpose of getting the cabin and battery to temperature, while ensuring that the HTC and chiller do not exceed their temperature limits. PID controllers are used to create a compressor power demand according to the battery and cabin current and target temperatures, and the greatest of these demands is taken to ensure there is enough heat to meet these requirements. Additionally, PID controllers are used to set a power demand needed to bring the chiller and HTC loops to their target temperatures. The minimum power request (from either the cabin and battery, the chiller, or the HTC controls) is then passed to the compressor; the minimum is used so that, if a component has reached its set point, it is not pushed beyond that target by the requirements of another component. This logic prevents the battery and cabin from overheating and reduces the chance of the model failing due to the coolant breaching its temperature limits.

2.3. Battery

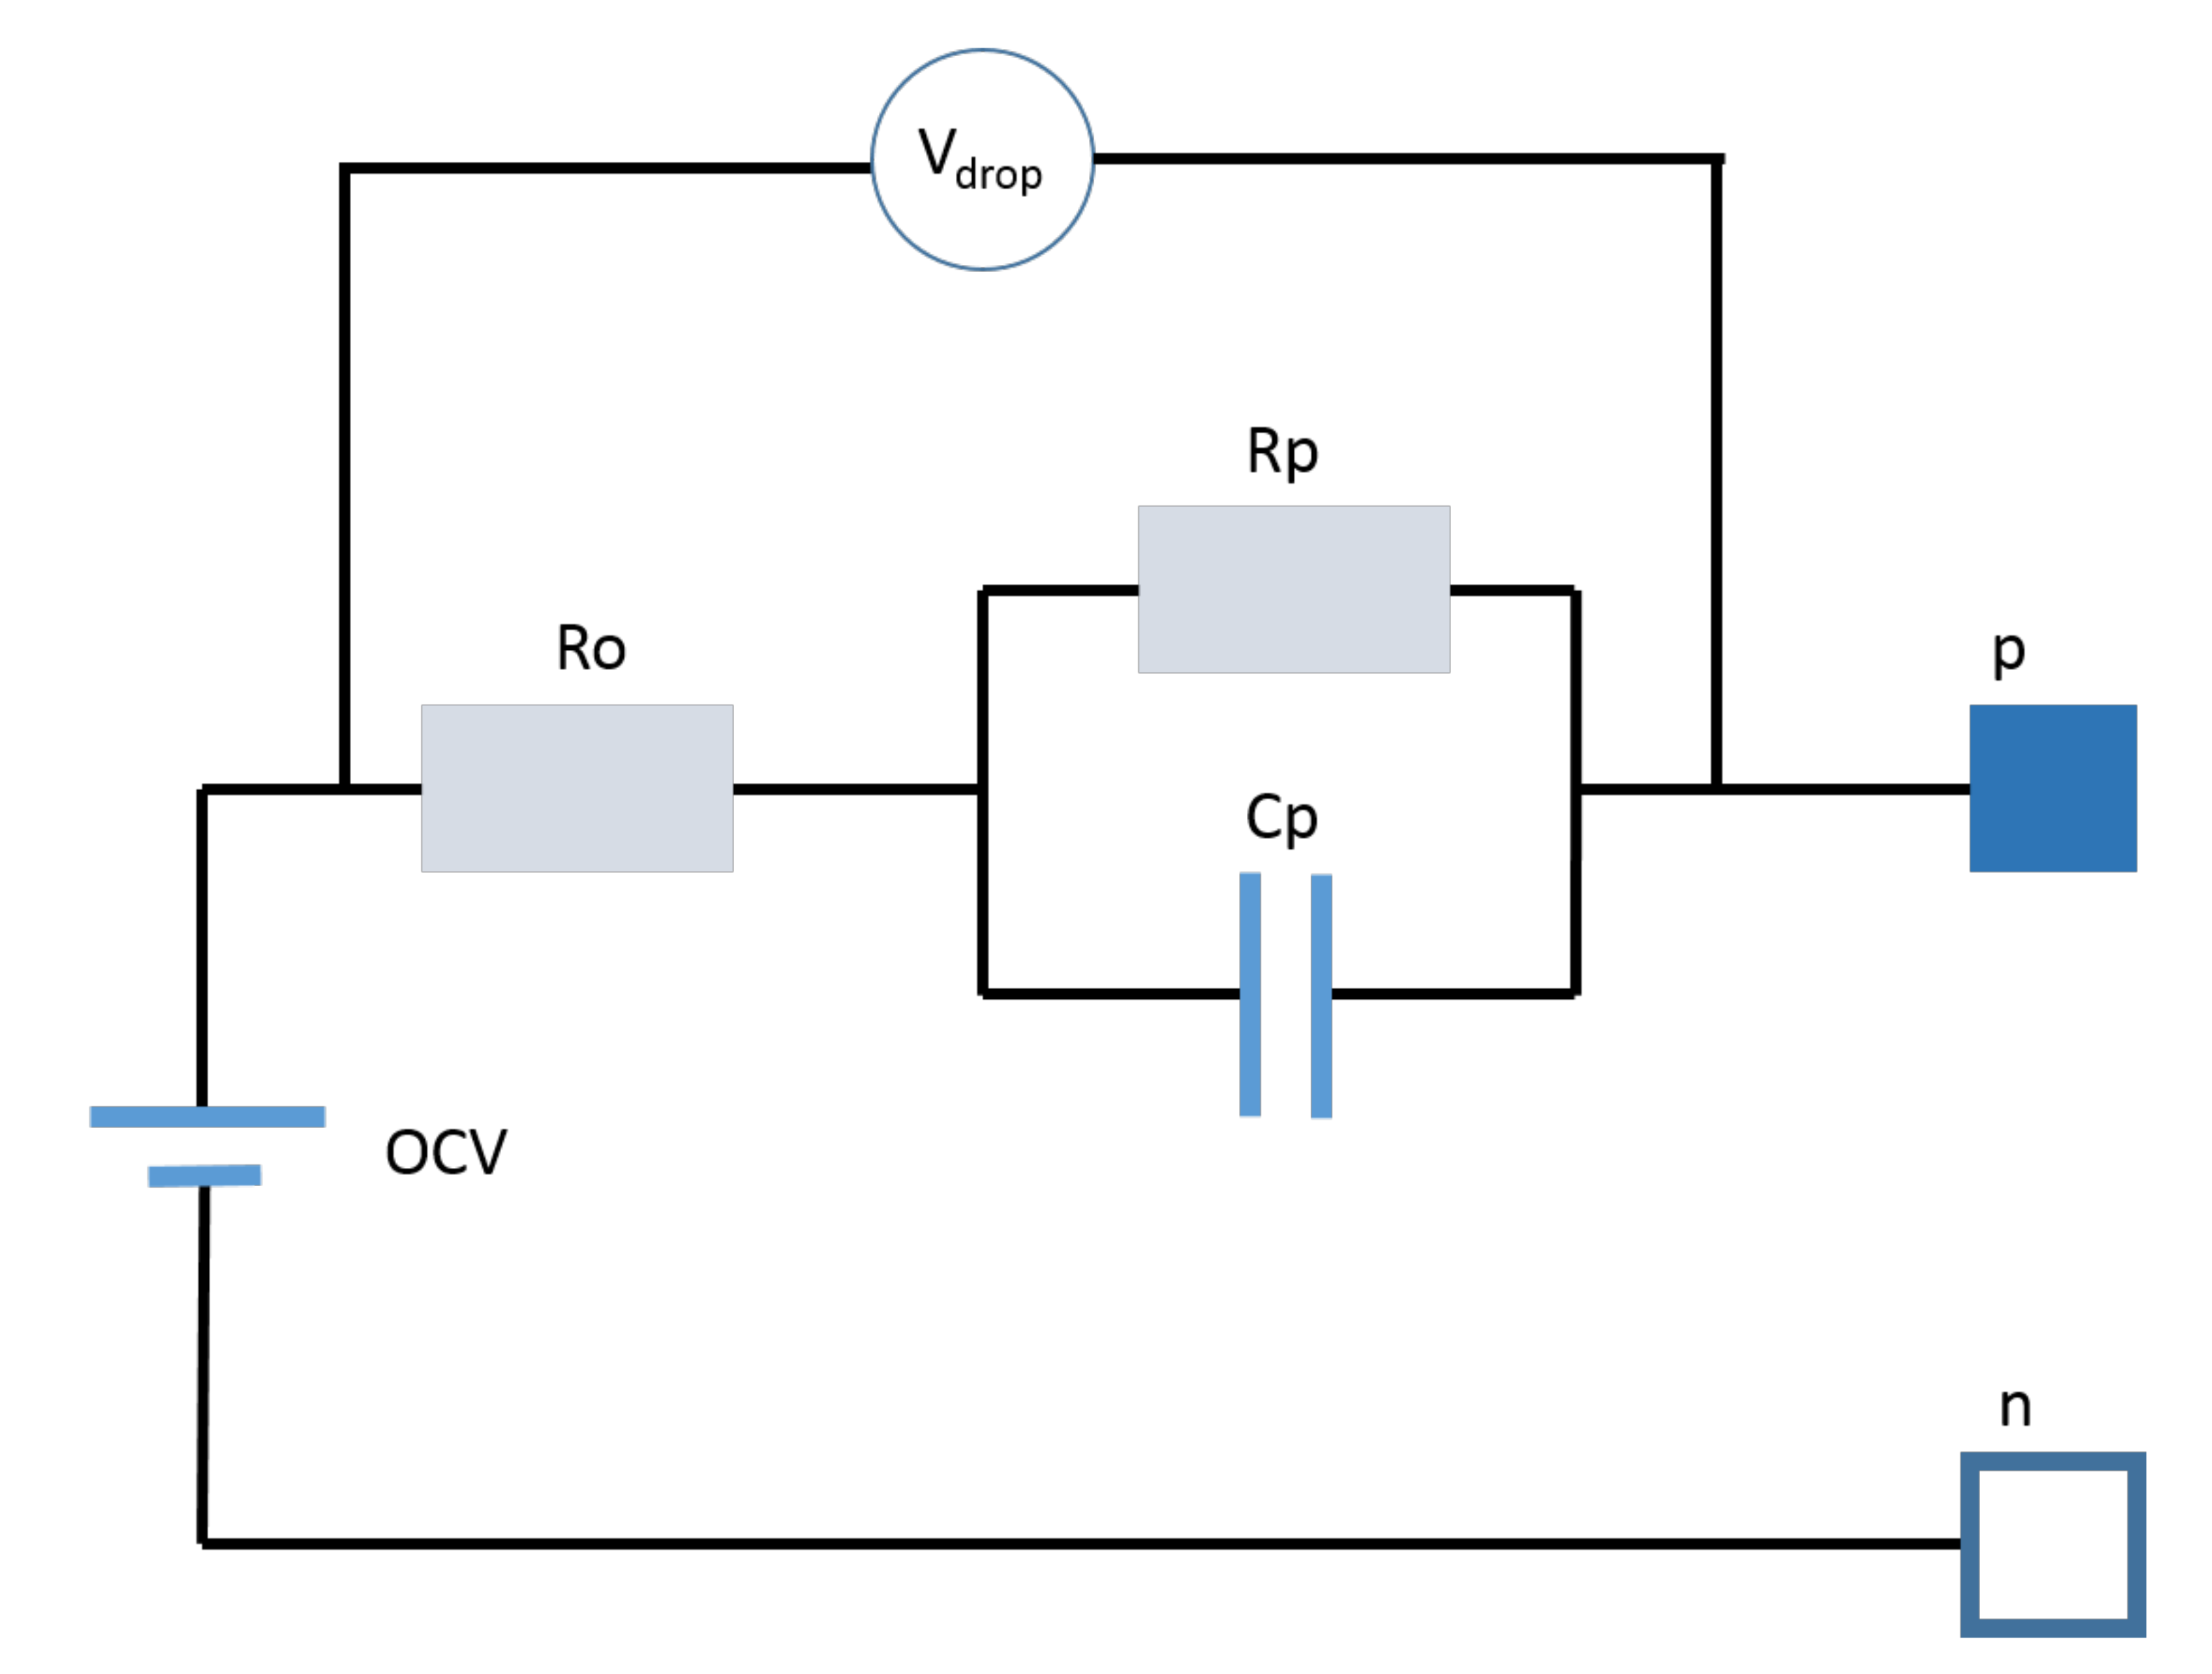
The battery model can be broken into two parts: electric and thermal. The electric side uses a first order RC (resistor-capacitor) network equivalent circuit model (ECM), as seen in Figure 8. The components in this model are parameterised using look up tables which are a function of component temperature, as measured using the thermal model, and the cell’s state of charge (SOC). The resistor and open circuit voltage (OCV) values are scaled by the number of cells in series to produce an RC circuit which represents one string of the pack. This data was generated specifically for Xalt 40Ah cells by Tripathy et al. in Reference [33]. This type of battery model is typically seen in literature [34,35] when modelling pack size batteries for vehicle application. In this application, the vehicle was configured in a 3p108s (3 parallel strings of 108 cells in series) arrangement giving a pack size of approximately 48 kWh (assuming a nominal voltage of 3.7 V).
Since the parameters of the RC network are dependent on temperature, a thermal model is used to estimate the bulk temperature of the pack. The waste heat is calculated using Equation (1).
Q b a t t e r y w a s t e = I 2 × ( R 0 ( T , S O C ) + R 1 ( T , S O C ) ) .
Here, Q b a t t e r y w a s t e is the waste heat generated by the battery, I is the battery current, and R 0 ( T , S O C ) and R 1 ( T , S O C ) are internal resistances corresponding to 
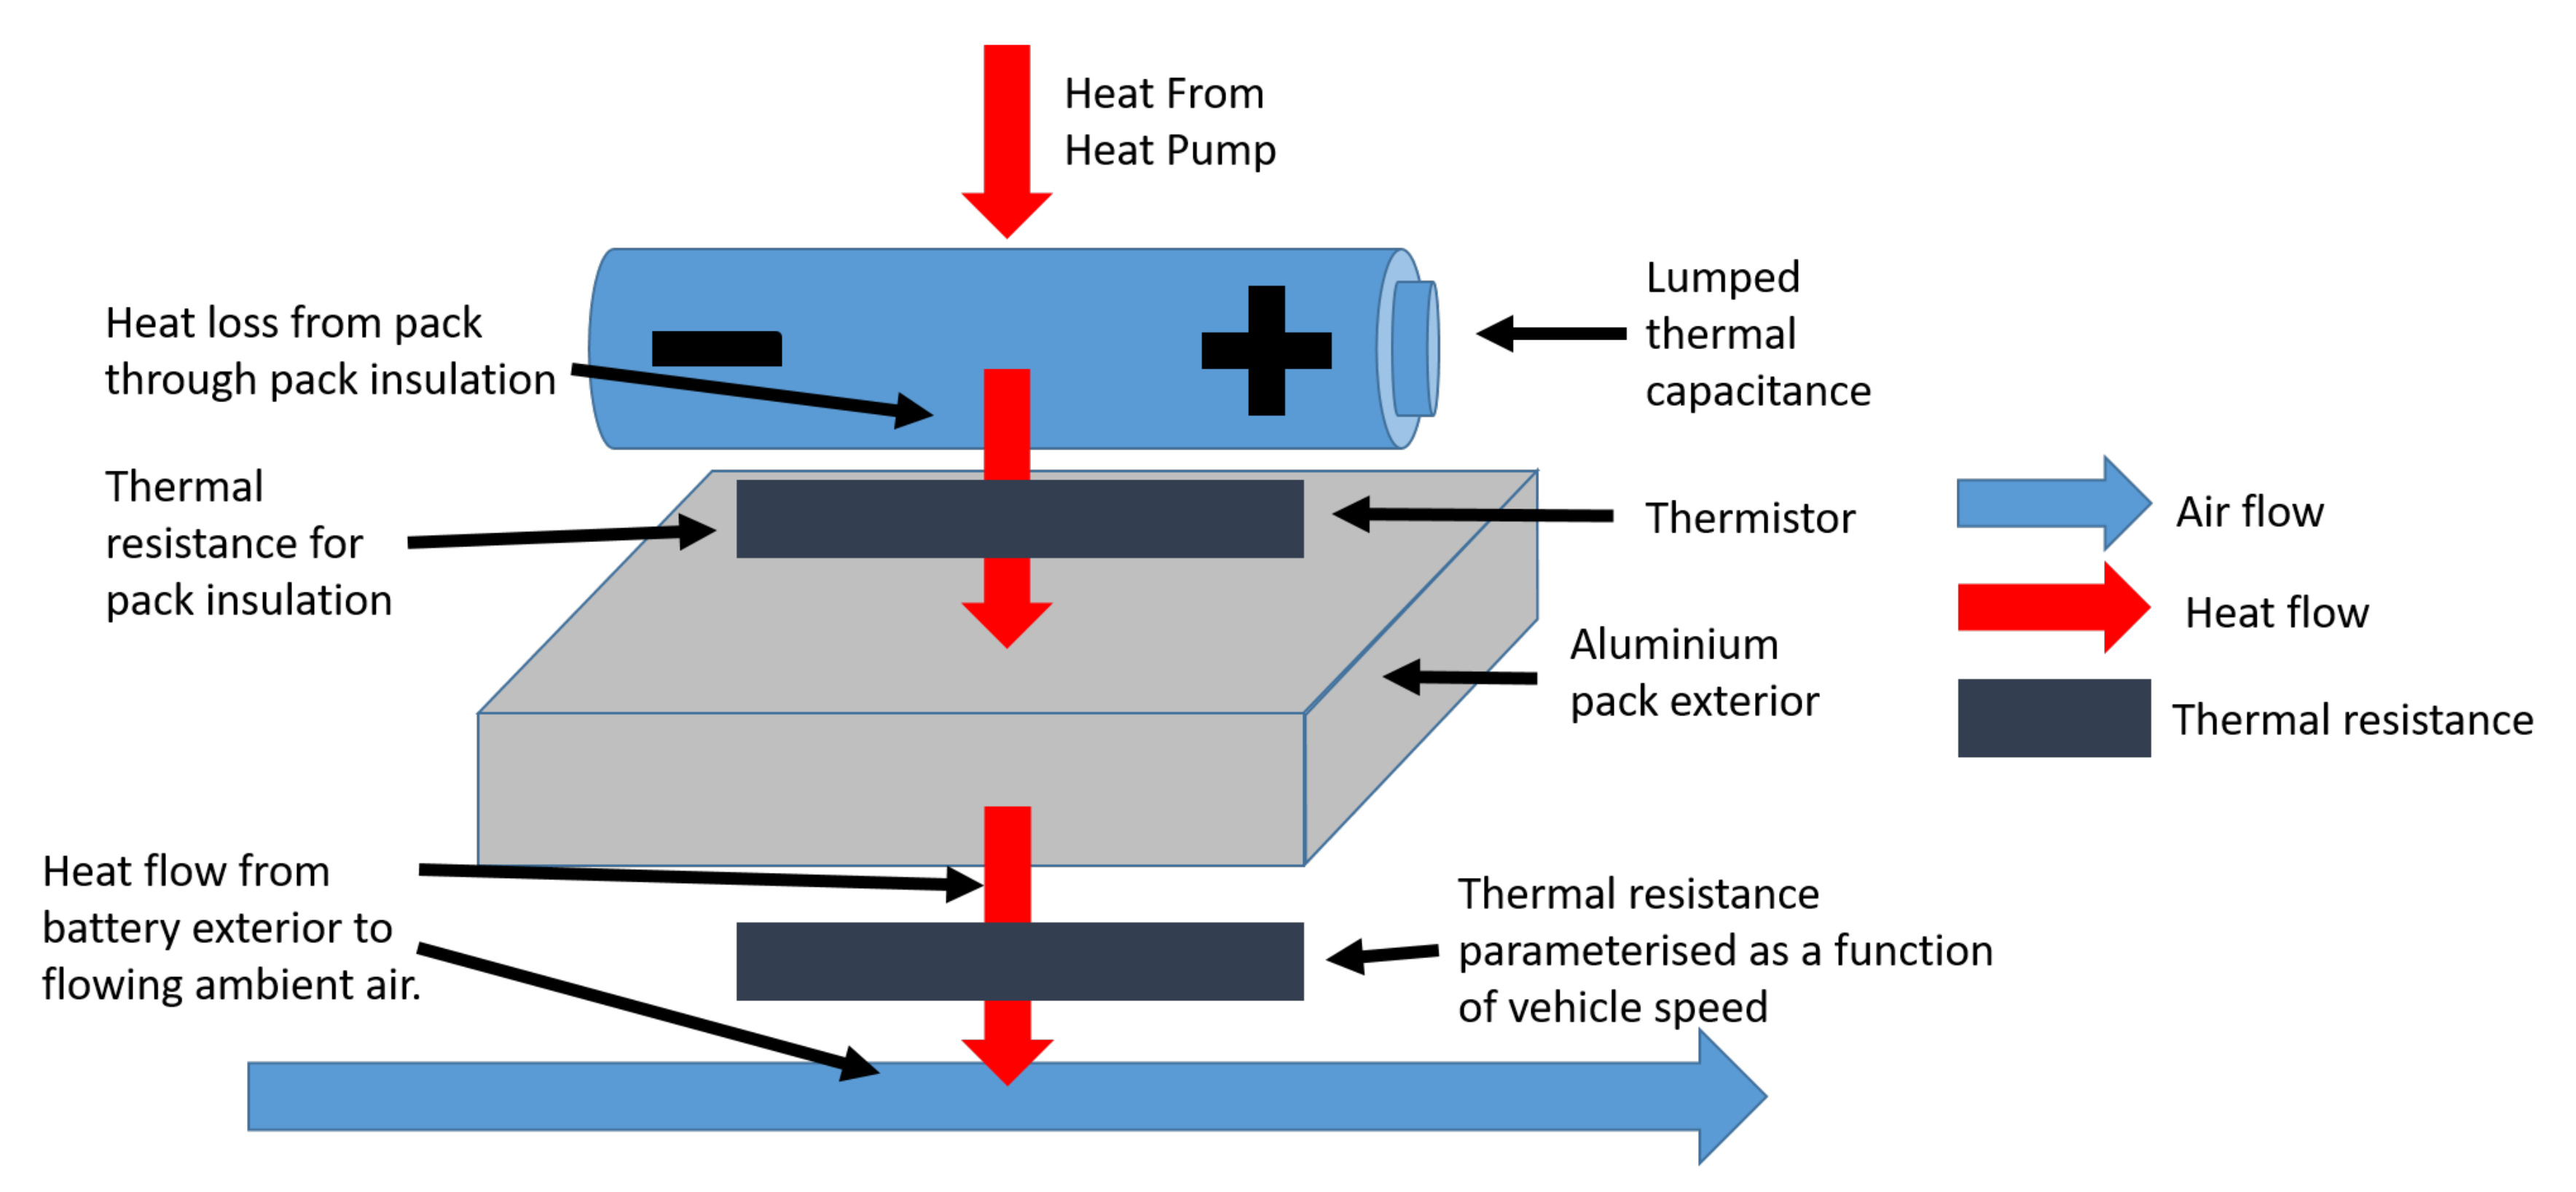
Figure 8 which are dependant on battery temperature and state of charge. A schematic representation of the thermal model of the battery can be seen in Figure 9. The battery has two modes of heat exchange: interaction with the thermal management system and thermal losses to ambient. The latter heat exchange is modelled using the flat plate parallel flow equation [36], given in Equation (2).
h ¯ = ( 0.037 R e 4 / 5 871 ) P r 1 / 3 k L ,
where h ¯ is the mean heat exchange coefficient of the plate, and k, R e , and P r are the thermal conductivity, Reynolds number, and Prandtl number of the convection fluid. The Reynolds number and Prandtl number are defined in Equations (3) and (4). L is the length of the surface over which the fluid is flowing, Here, 4 m is used as an approximation of the length of the underside of the vehicle.
R e = ρ v L μ ,
P r = C p μ k ,
where ρ , v, μ , and C p are density, velocity, dynamic viscosity, and specific heat capacity of convective fluid—in this case, air. The final heat flow to ambient is then given by
Q a m b i e n t = G ¯ ( T p l a t e T a m b i e n t )
or
Q a m b i e n t = h ¯ × W × L ( T p l a t e T a m b i e n t ) ,
where Q a m b i e n t is the heat rejected to ambient, G is the thermal conductance of the plate, W, L are the width and length of the plate, and T p l a t e T a m b i e n t defines the temperature difference between the plate and ambient.
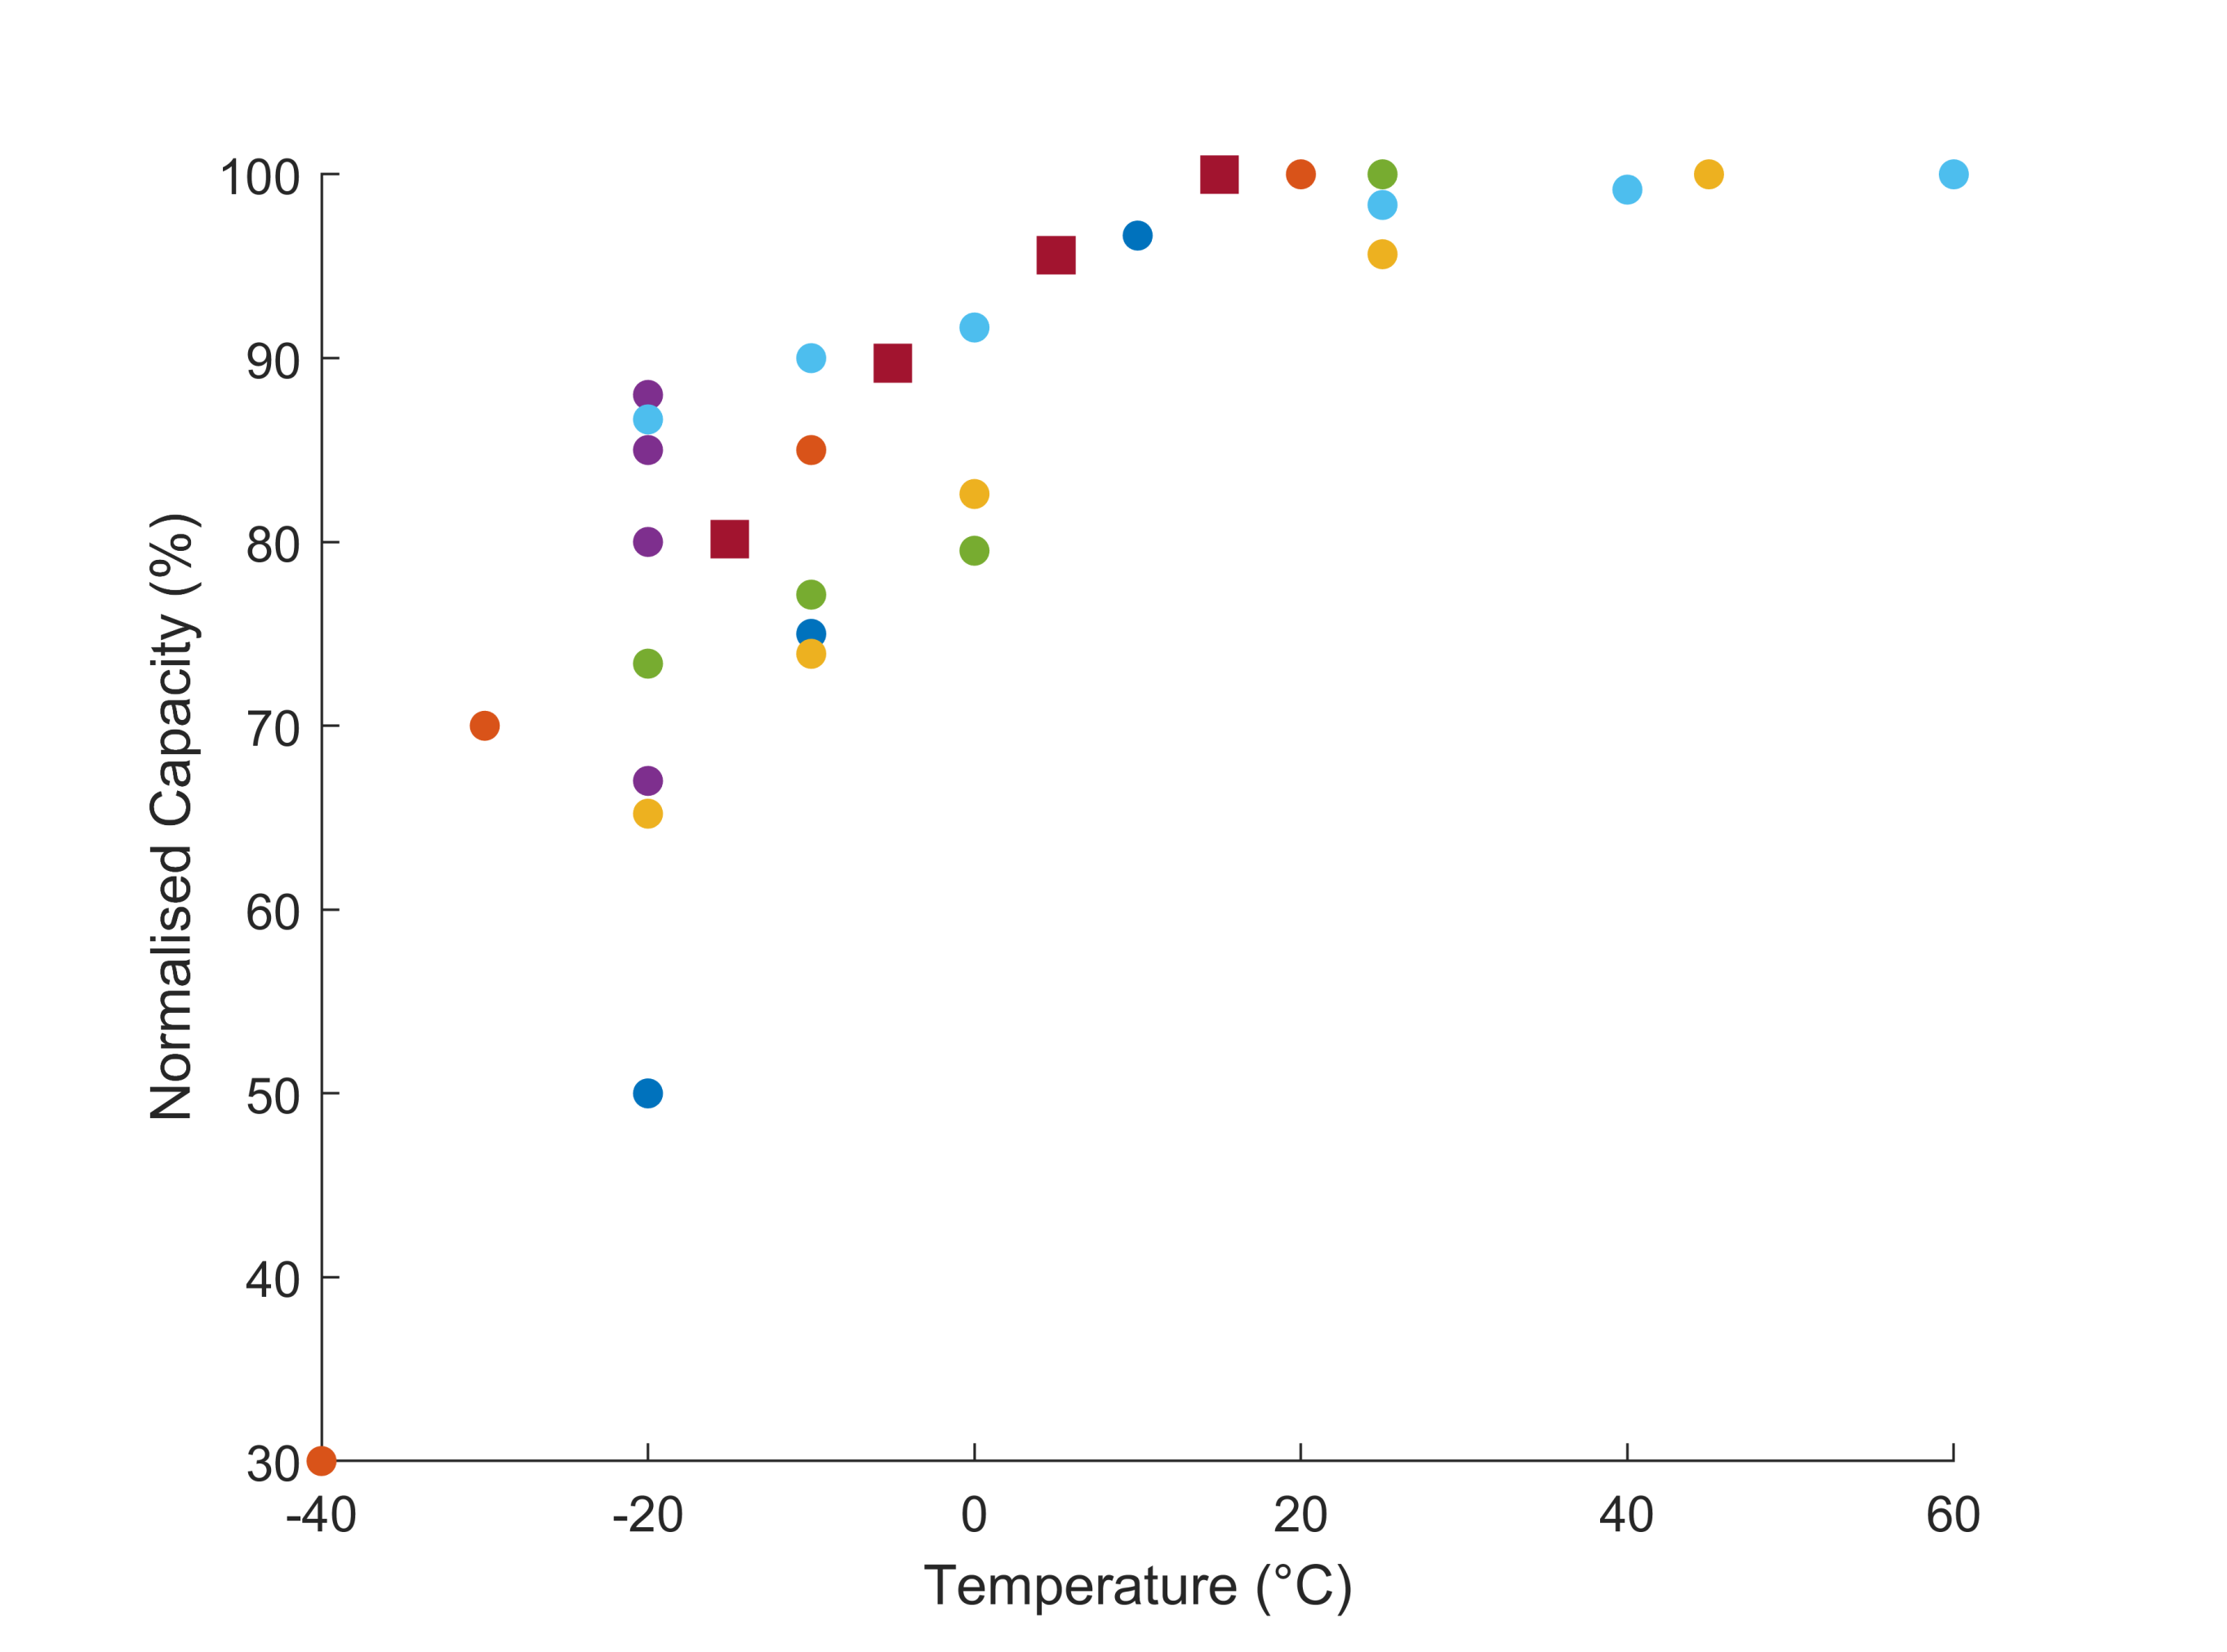
It should be noted from literature that the capacity of a battery is dependent on its temperature; in research concerning the operation of electric vehicles in low temperatures, this should be accounted for. A state of charge model is used to estimate the state of charge of the battery through the drive cycle as a function of temperature. To achieve this, the state of charge model has an additional lookup table which contains information about the proportion of capacity available as a function of temperature. This is then used to scale the Coulomb counting equation by the factor C e f f seen in Equation (7). This adjustment has been seen to improve the accuracy of SOC tracking and range prediction at low temperatures and so is an important addition to this work [33,37,38].
S O C ( t ) = S O C i n i t 1 C e f f ( T b a t t e r y ) 0 t I ( t ) d t .
Table 3 shows the values of C e f f as a function of temperature.

2.4. Motor

Motor waste heat is modelled using an efficiency lookup table. The motor’s thermal model consists of a lumped thermal capacitance representing the motor windings, which the heat is generated and extracted from. The heat pump aims to extract 1 kW of heat from the motor, and the motor is also able to lose heat to ambient through a fixed thermal resistance.
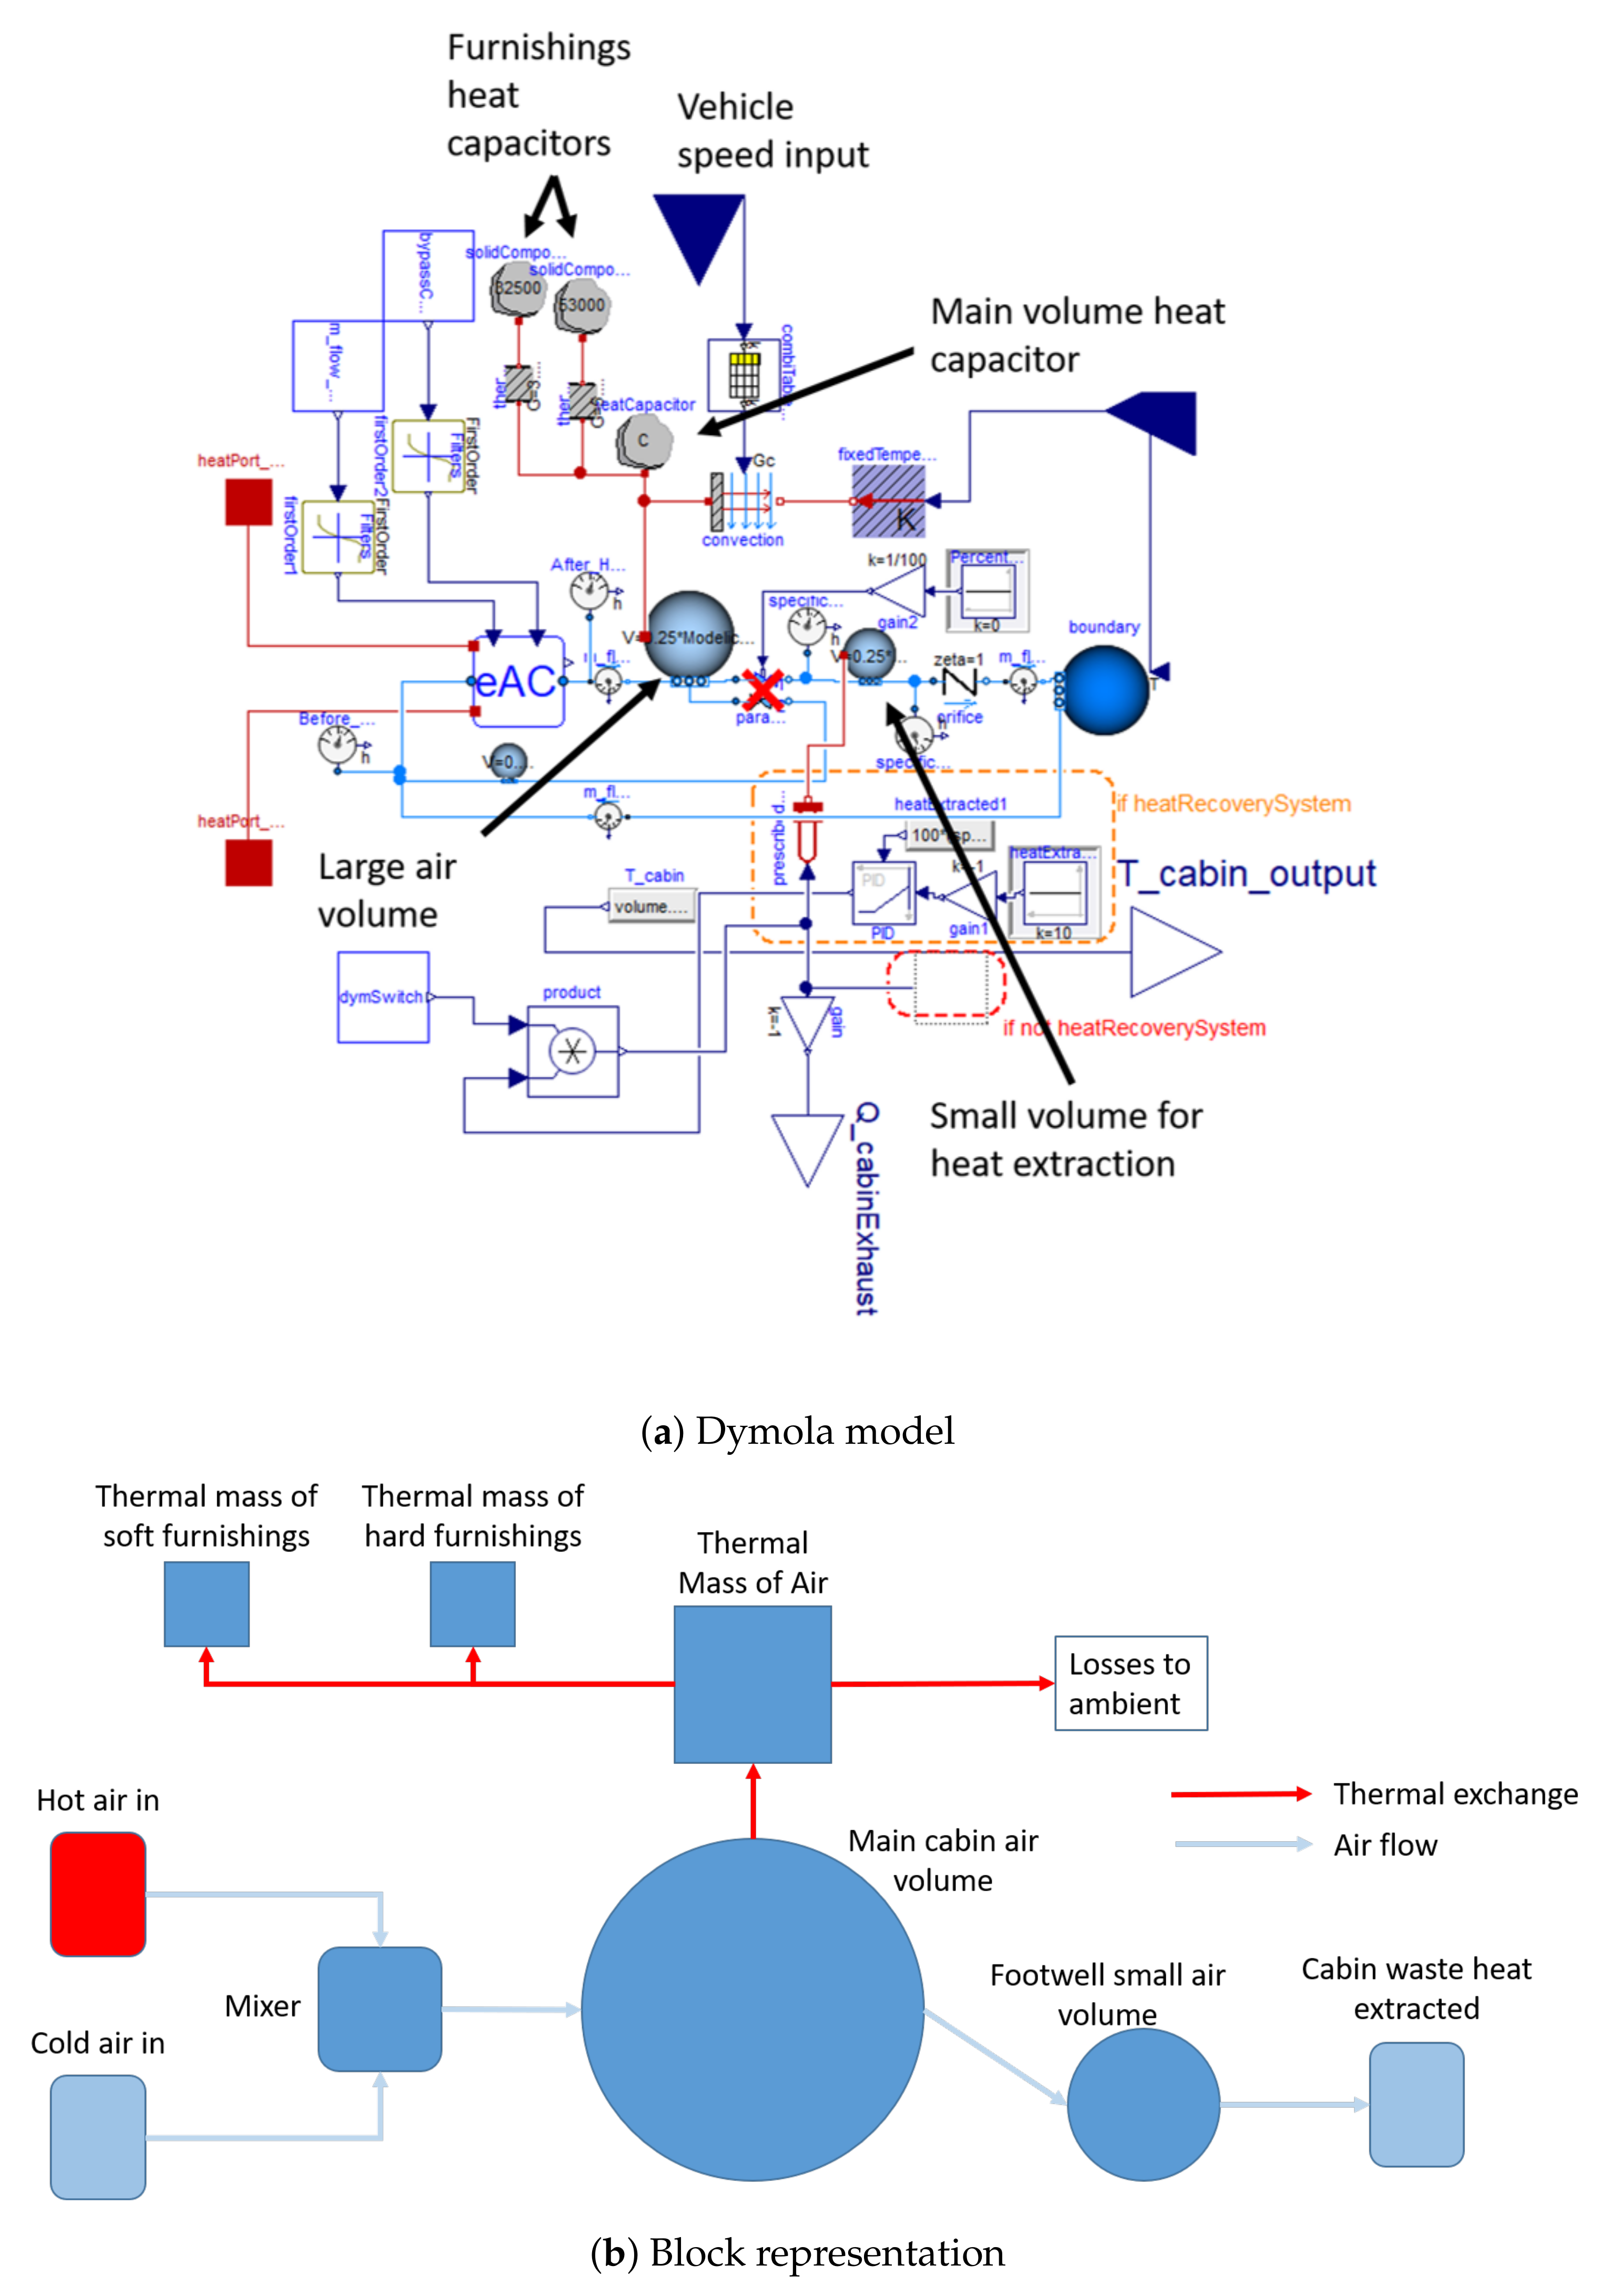
2.5. Cabin

The cabin has a target temperature of 22 ° C, which is measured at the “Large air volume” seen in Figure 10a. An infinite air source with ambient temperature is used as the air source for the cabin, where air into the cabin is heated in the “eAC” component, seen in Figure 10. The heated air is then pumped into the cabin, where a single air volume and heat capacitance are used to measure the cabin temperature. This heat capacitor has four modes of losing heat: convection to ambient through panels, thermal exchange with soft furnishings, thermal exchange with hard furnishings, and cabin air exhaust. The convection to ambient through the exterior surfaces is modelled using a variable thermal conductance with dependency on vehicle speed through a lookup table [40]. The model uses three heat capacitances: one for air, one for hard furnishings (such as dashboard panels, glass, etc.), and one for soft furnishings (such as the seats, carpet, etc.), with thermal resistances between the air and the furnishings. Finally, there are two volumes representing the air in the cabin: one large and one small. The larger air volume represents the majority of the cabin where the target temperature is imposed. The smaller air volume is used to harvest cabin exhaust waste heat, Here, 30% of the potential heat contained in the wasted air can be extracted and used in the heat pump. This amount reflects the claims made by BMW in Reference [41].

2.6. Thermal Storage

The thermal storage block utilises a phase change material (PCM) to store heat which can be redeployed instantly when the vehicle begins its journey. The material modelled is called paraffin 70-75, and its characteristics were found by Ukrainczy et al. [42] and are shown in Table 4.
The PCM is modelled using a thermal capacitor block with dynamic capacitance, allowing for the modelling of the latent heat release of the material. When the material temperature drops to T m e l t i n g + 1 the capacitance is increased from C p to C p + C l , then when the temperature falls beneath T m e l t i n g the capacitance is restored to C p . This approach for modelling PCMs has been used in other similar research [8,32,43].

3. Key Performance Indicators

The performance of the vehicle will be measured using three metrics; energy efficiency measured from battery, range, and comfort. This section defines how these key performance indicators (KPIs) are calculated. Firstly the energy efficiency of the battery is calculated using Equation (8).
E n e r g y e f f i c i e n c y = 1 D W L T P t 0 t e n d I ( t ) × V O C V ( t ) d t
Here, D W L T P is the WLTP distance ( 23.25 km), and I ( t ) and V O C V are the battery current and open circuit voltage, respectively.
The range is calculated using Equation (9):
R a n g e = D W L T P × E c a p C e f f ( T b a t t e r y ) t 0 t e n d I ( t ) × V O C V ( t ) d t ,
where E c a p is the maximum capacity of the battery (48 kWh), and C e f f is the effective capacity of the battery defined in Table 3.
Cabin comfort is defined as the mean cabin temperature given by Equation (10).
C a b i n c o m f o r t = t 0 t e n d T c a b i n d t .
These three KPIs will be used throughout this report to inspect the performance of the vehicle.

4. Validation

Here, the validation of the battery and complete vehicle is shown. This is used to demonstrate that the models used are representative of data presented in a range of literature.

4.1. Battery

The battery model was discharged at a rate of 0.1 C (to prevent self-heating from higher currents) at 15 ° C to 15 ° C in 10 ° C increments. The resulting recorded capacities are presented in Figure 11, alongside an amalgamation of data extracted from literature. Here, it can be seen that the battery capacity predicted by the model falls within the range of battery capacity results presented in literature and is, therefore, validated for the purposes of this research.

4.2. Complete System Validation

Here, the complete model is validated against high level parameters available from literature. At this level, the model is judged on energy efficiency, measured using Equation (8), which is key when assessing the performance of an electric vehicle and representative range reduction.
Firstly, the vehicle model is validated at room temperature against known EV efficiencies. Since the vehicle model is generic to electric SUVs, it is sensible to use similar vehicles against which to assess the performance. Table 5 highlights a range of similar vehicles and their efficiency.
The model is simulated at 23 ° C using no HVAC. Doing so, the complete vehicle used 243 Wh/km, which is within the boundaries set out in Table 5.
The final step of validation is to ensure that the vehicle captures a representative range reduction as the ambient temperature is lowered. Referring to literature, it has been seen that a range reduction in the region of 40 % to 70 % should be measured when moving from 15 ° C to 15 ° C [1,2,45]. This, therefore, defines the bounds which are used to validate the model. Table 6 shows the vehicle range, calculated using Equation (9), achieved by the vehicle using the WLTP cycle over a range of temperatures, without the heat pump engaged (only using the 4 kW PTC). The range reduction here is 41% when moving from 23 ° C to 15 ° C. While this is on the lower side of range loss, it should be noted that a 4 kW PTC would be undersized for a vehicle of this type on its own; therefore, higher HVAC consumption would be expected at lower ambient temperatures for a similar vehicle without a heat pump. However, the value still falls within the accepted range, indicating the model is representative of reality.

5. Dynamic Programming

When considering control optimisation, it is relevant to consider solutions for the power split problem in hybrid electric vehicles, which is conceptually similar to the heating split problem here. Cook et al. [30] performed a review of difference control techniques used for controlling the power split between the internal combustion engine and motor in hybrid electric vehicles. Cook considered heuristic or rule based controllers, steady state optimised control, and dynamic programming and highlighted that dynamic programming was the only method which could reliably find a global minimum. Cook et al. demonstrated this by showing that a controller based on dynamic programming results was able to reduce the fuel consumption of a hybrid vehicle by 54% compared to a 31% reduction using a rule based controller [30]. The Equivalent Consumption Minimisation Strategy (ECMS) is also a strategy considered, which calculates power split based on a simplified model to minimise the instantaneous fuel consumption based on current demand. This method is suboptimal as it is unable to account for the future state of the battery and future requirements [46,47,48].
DP has been used liberally in hybrid vehicles to optimise the power split between the internal combustion engine and electric motor but has not been used as frequently in the area of thermal management. Shojaei et al. [49] demonstrated an optimised battery cooling schedule during a 24-h duty cycle in high ambient temperatures. In this research, the control of the system was binary, with the option of having the chiller on or off. Perez et al. investigated the problem of splitting the power demand between the electric motor and internal combustion engine on a hybrid vehicle [50]. Here, a dynamic programming approach was used to minimise the cost function over a drive cycle, resulting in an optimal trajectory describing how the demand should be split. Wang et al. showed dynamic programming could reduce the fuel costs of a Toyota Prius by 30 % [29]. Others describe how DP represents the benchmark of what can be achieved in a dynamic problem [27,28].
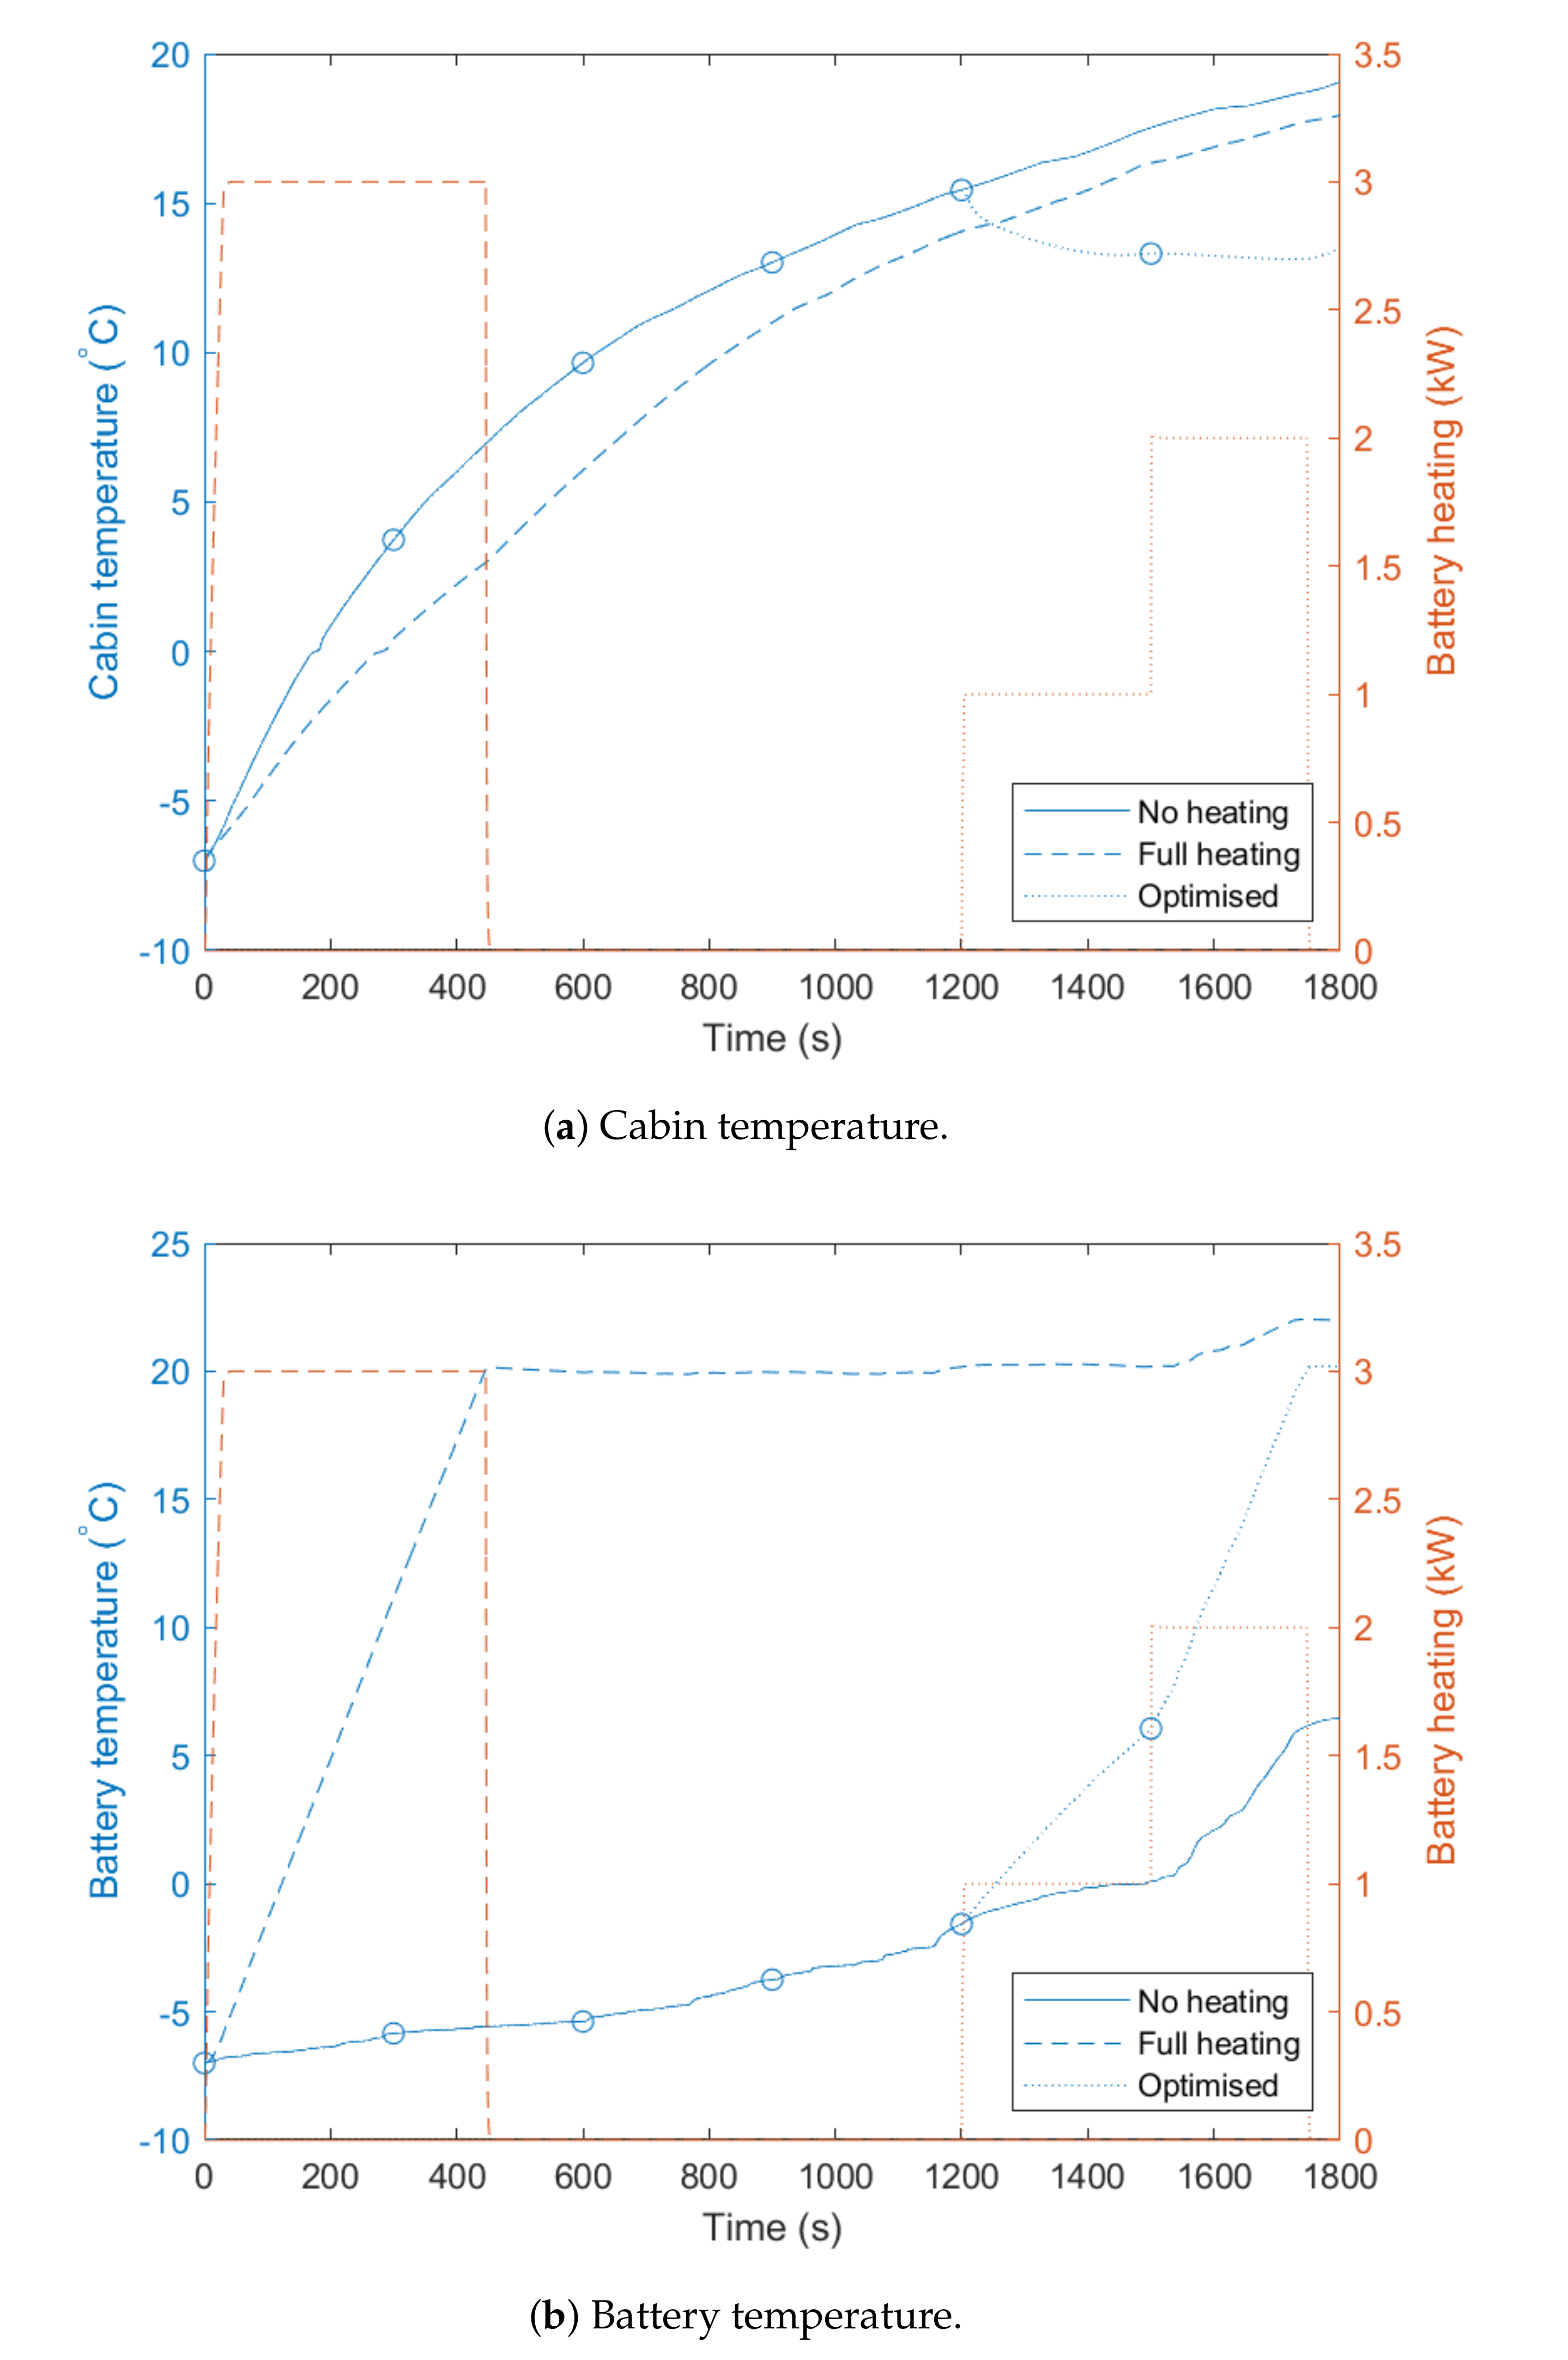
Although DP offers global optimality for control problems, it struggles to be implementable due to the “curse of dimensionality" which causes the computational problem to grow beyond manageable limits. However, it is the only option for ensuring global optimality and is, therefore, the most appropriate choice for exploratory research into the problem. DP has not yet been used to produce a multi-level heating trajectory for vehicle components during a drive cycle. The work in this paper, therefore, represents a new application of this well known technique. Furthermore, DP has been coupled to a cost function with variable weightings which can control the balance between energy, range, and comfort. To demonstrate the superiority of this control method, the DP has been compared to simple heating strategies in the results. The simple strategies used are no battery heating and full battery heating, where the battery is heated at 10 kW from the start of the cycle until it reaches target temperature.

5.1. Problem Definition

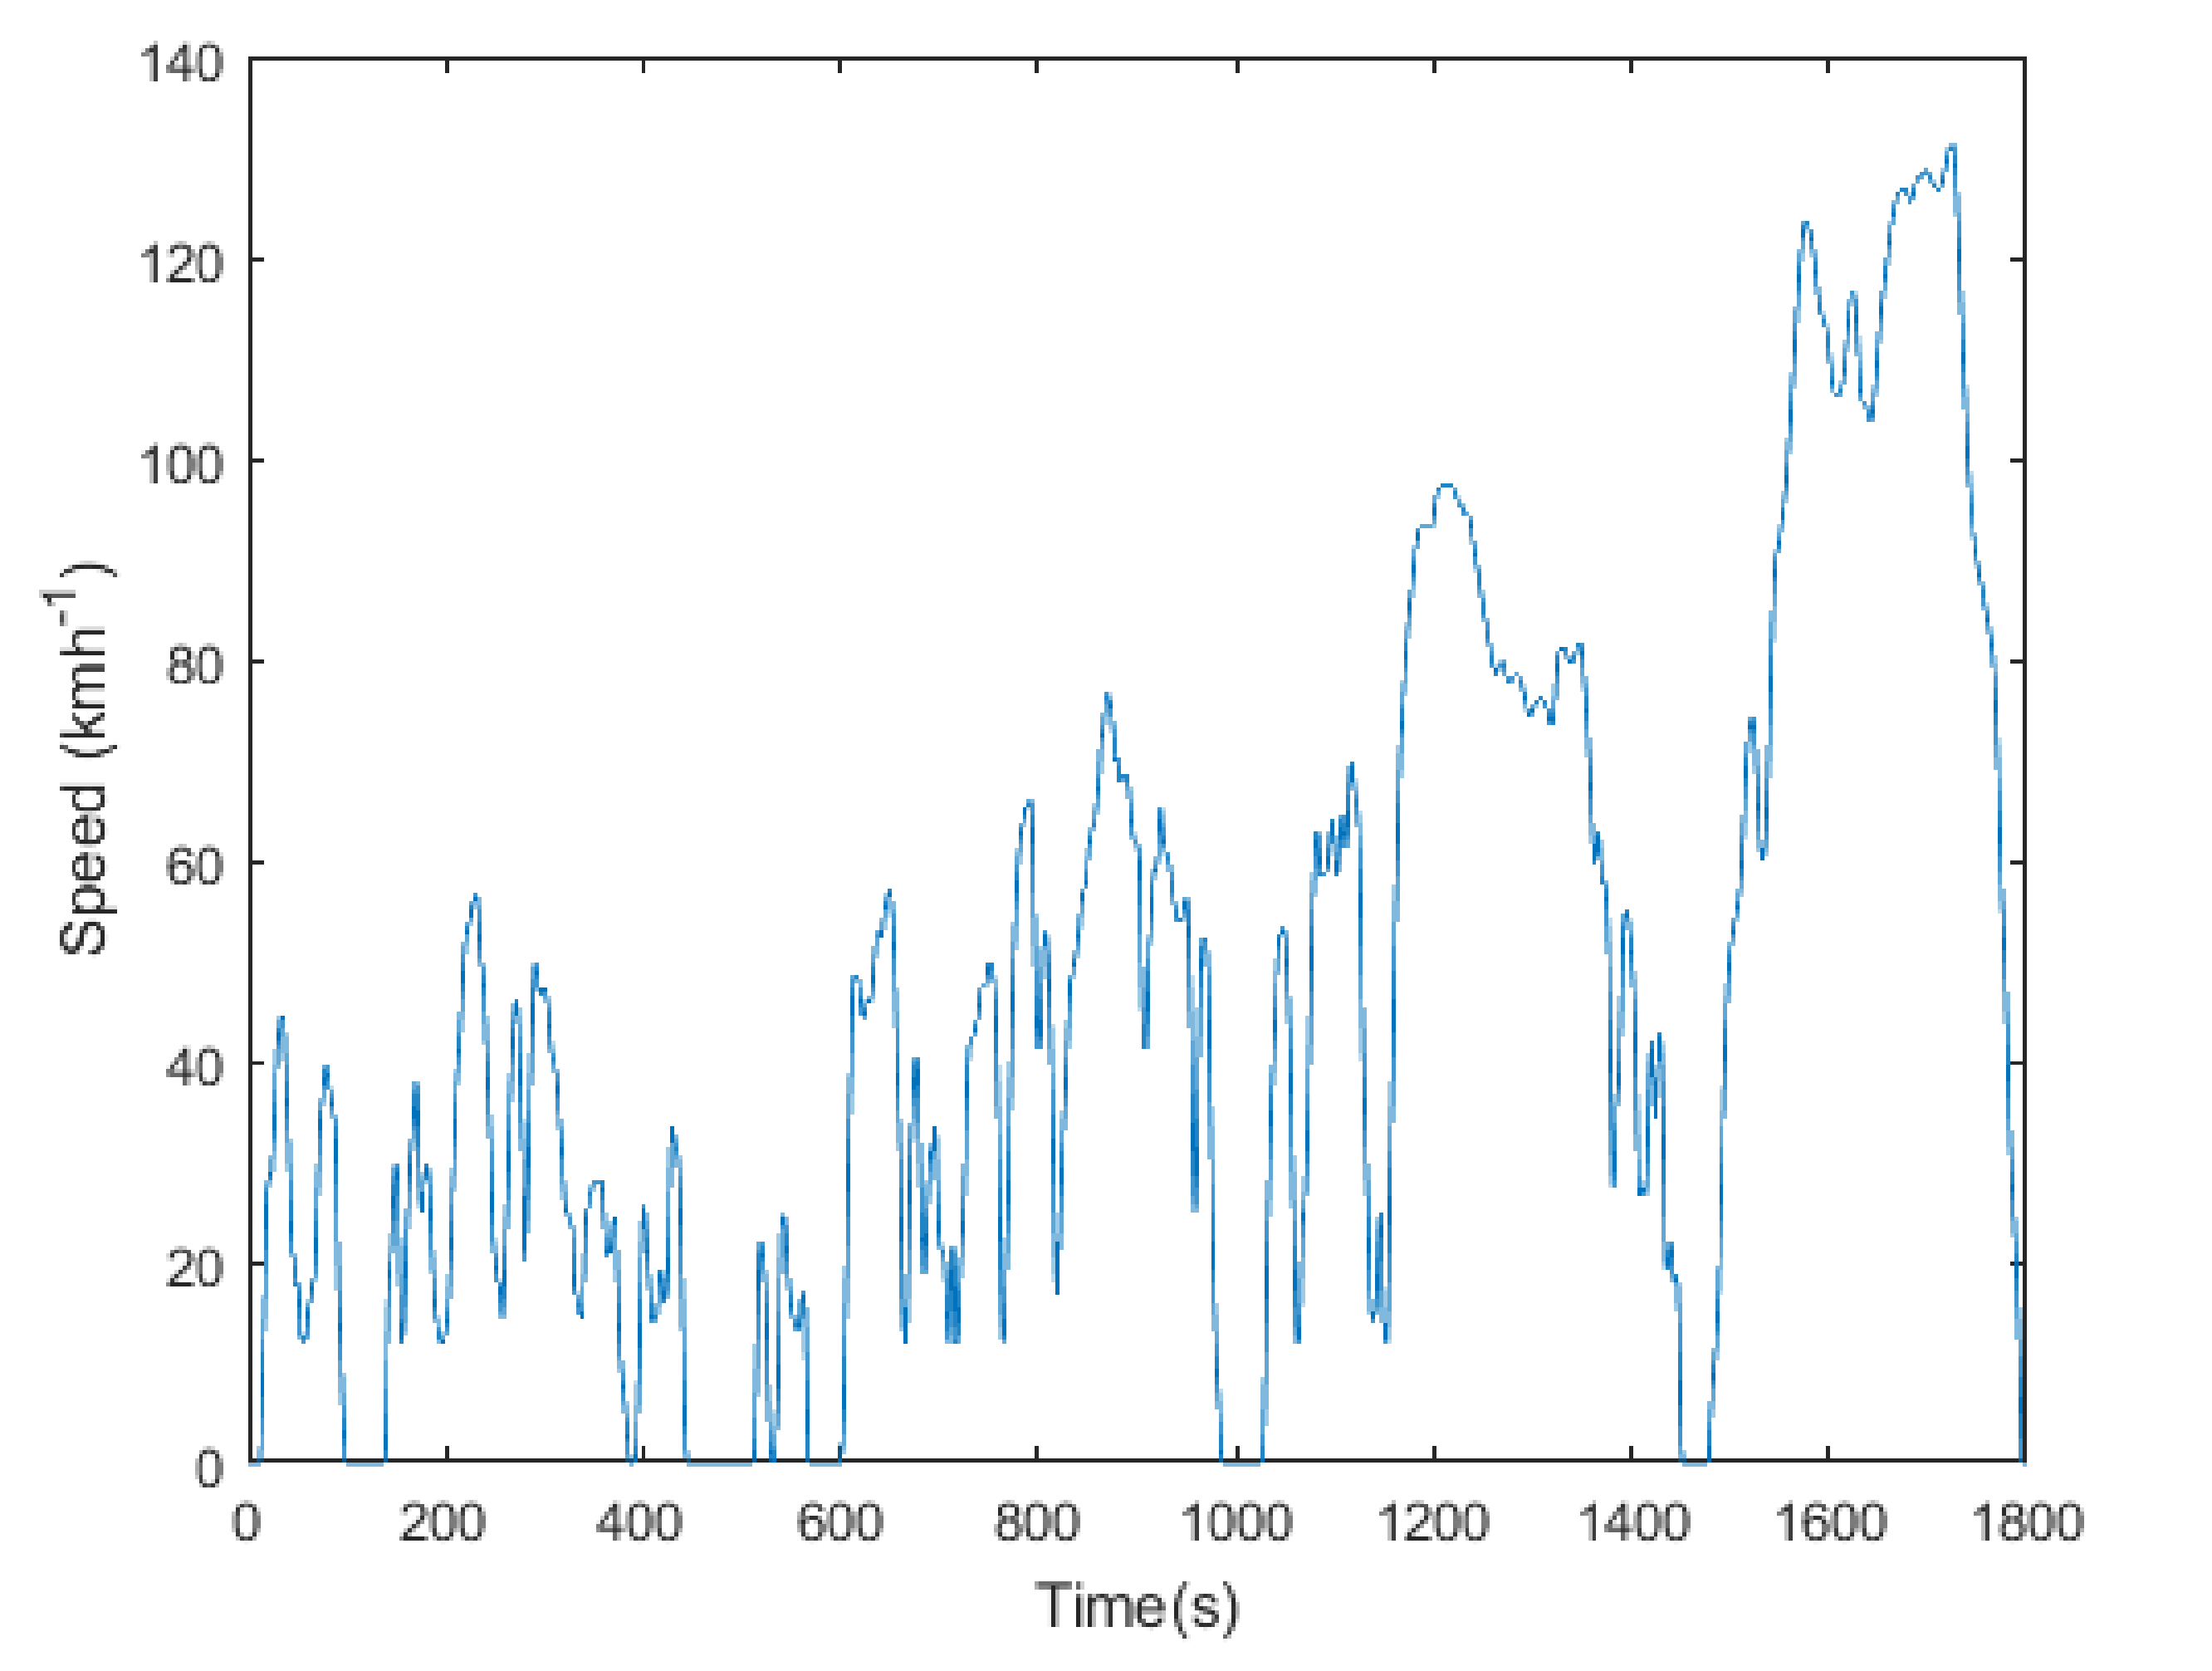
The objective of using DP is to produce a heating trajectory to control the interaction between the heat pump and the battery to balance vehicle performance with cabin comfort during the World harmonised Light Vehicle Test Procedure (WLTP). The WLTP drive cycle has been selected for use in this research as it is the mandatory test to establish vehicle emission performance in Europe.
The balance between vehicle performance and cabin comfort will be achieved by minimising a cost metric, J. This process is described by Equation (11), where U ( k ) is the input vector, which describes the amount of heat delivered to the battery at the kth time step, as seen in Figure 1. U ( k ) 
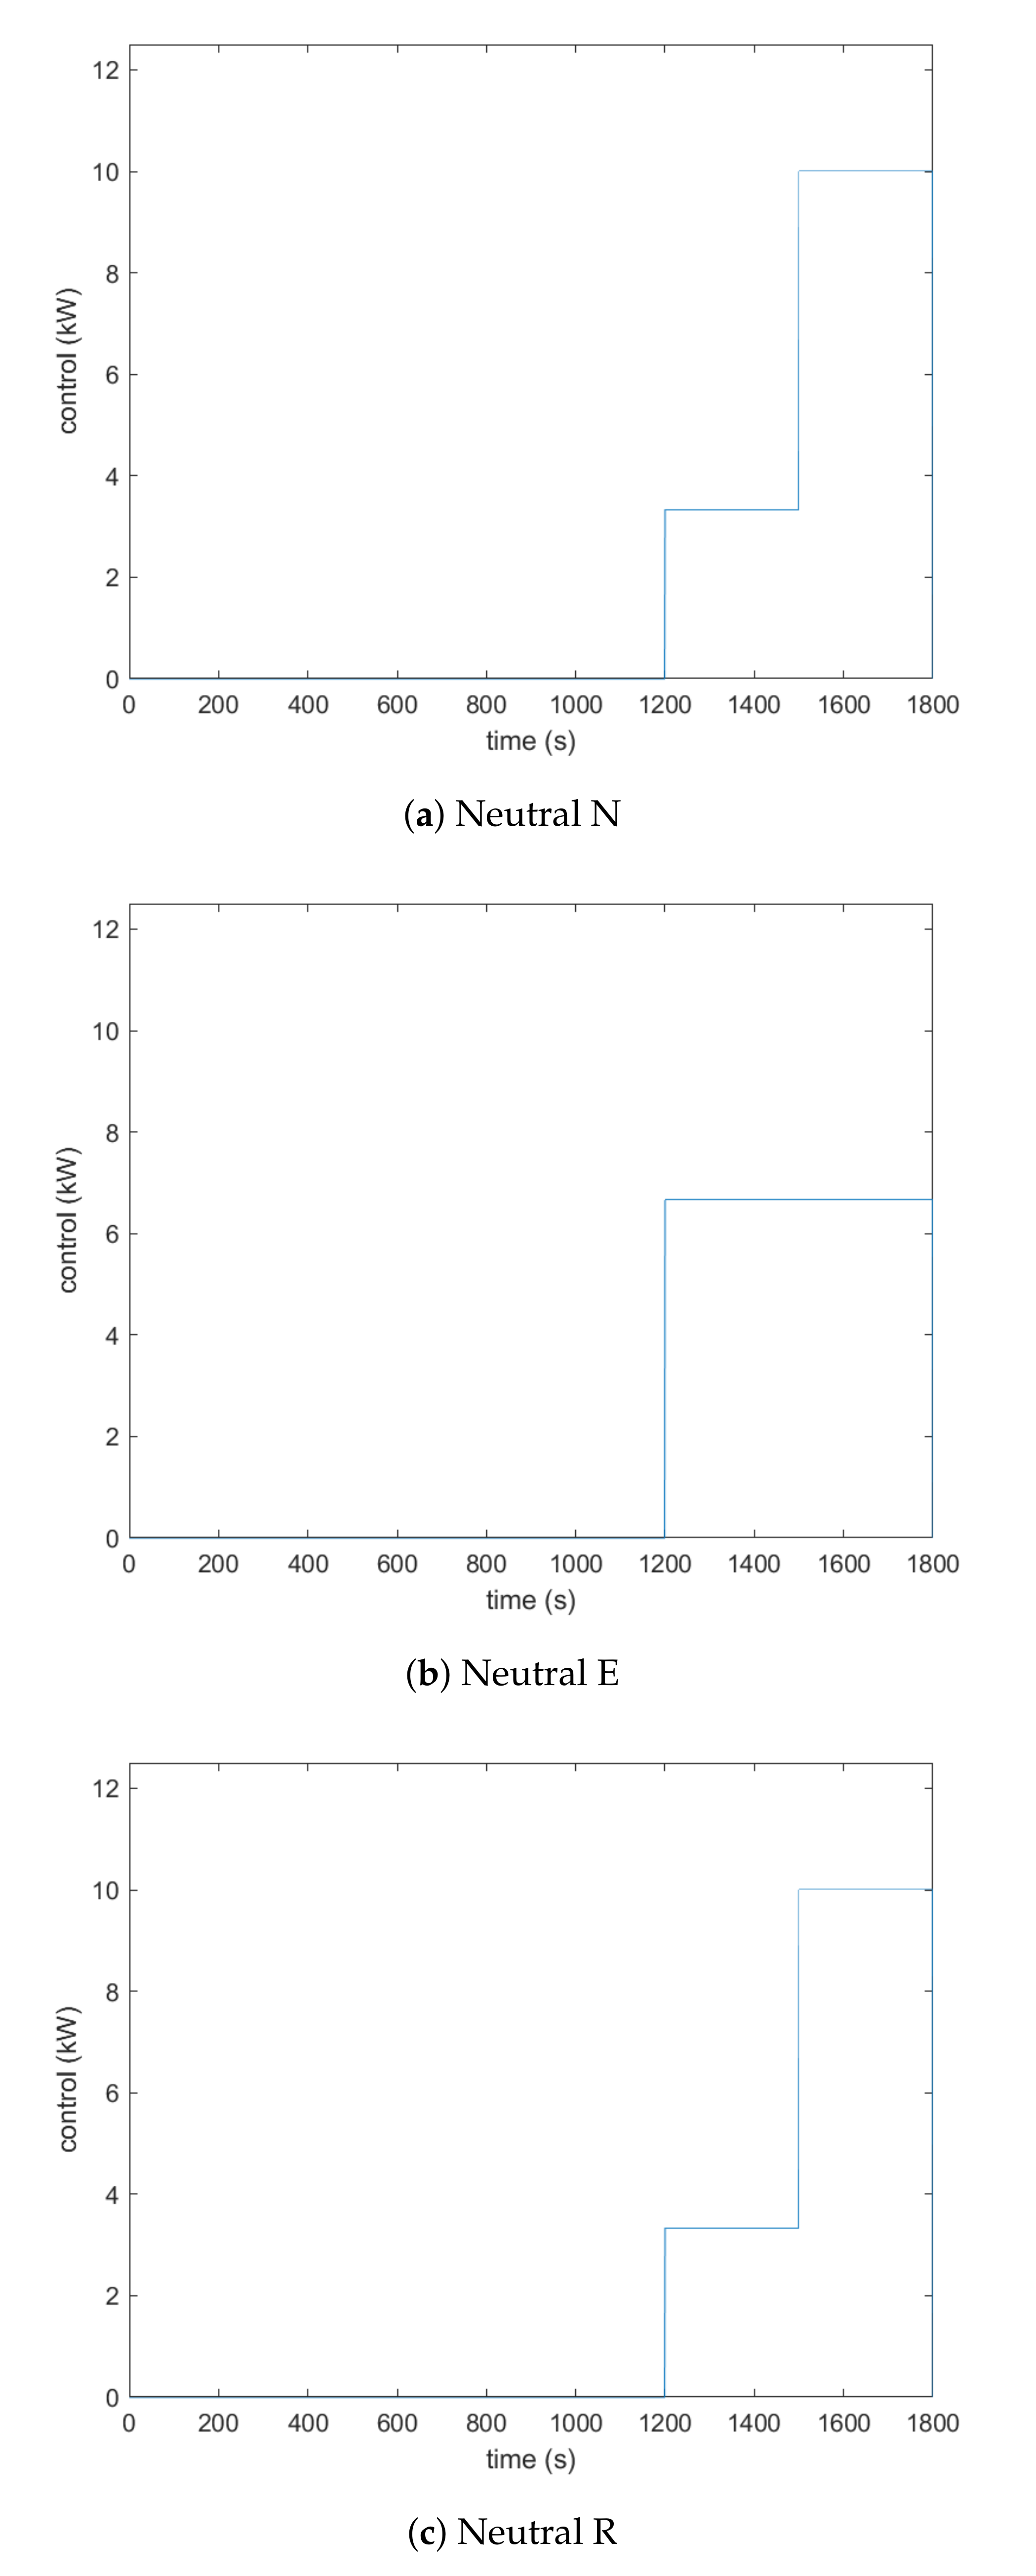
is discretised into four heating levels: none (0 kW), low ( 3.33 kW), medium ( 6.66 kW), high, or full (10 kW). The state variables, X s , for the problem are T c a b i n and T b a t t e r y , which represent the cabin and battery temperatures, respectively; this is also seen in Figure 1. These are discretised into 1 ° C and 2 ° C increments, respectively. The problem is also discretised into time steps of 300 s. This time step length was chosen since it is approximately the length of time of the shortest segment of WLTP cycle (which is used for this research). This ensures that the time resolution is high enough to identify the required battery heating quantity for each section of the chosen drive cycle.
J = F ( X ( t 0 ) , t 0 , X ( t e n d ) , t e n d ) + t 0 t e n d G ( X ( t ) , U ( k ) , t ) d t .
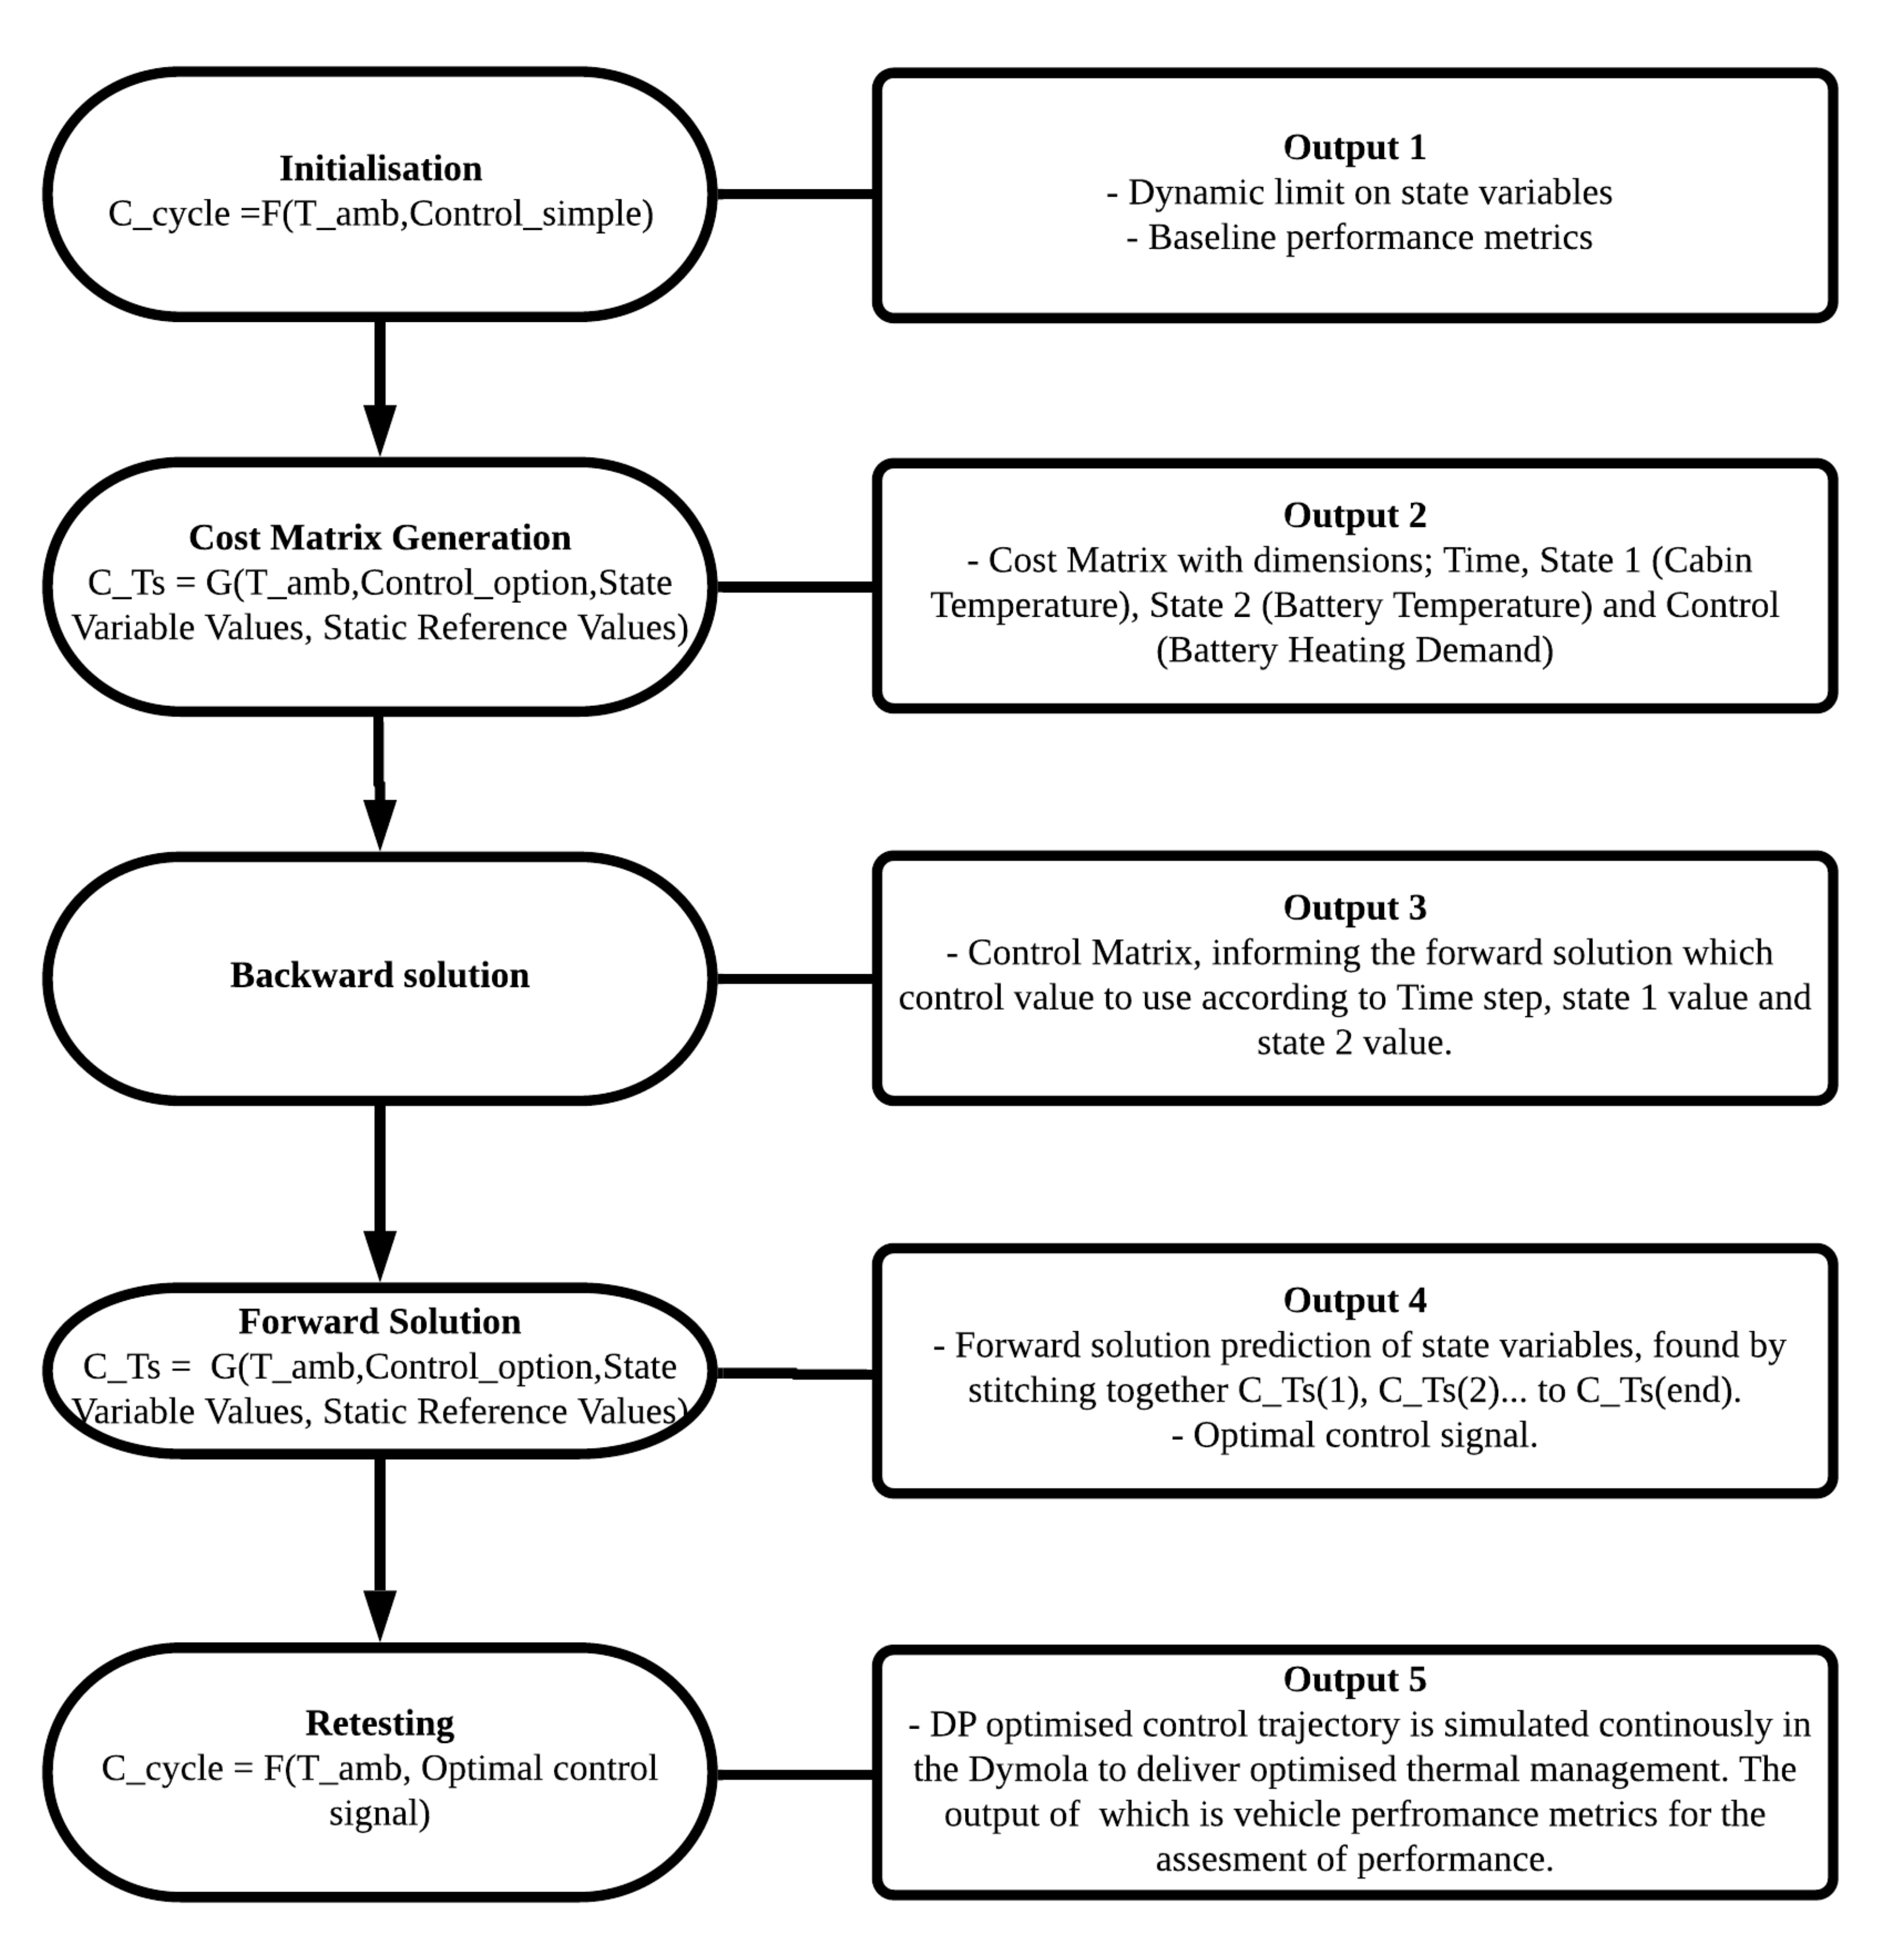
Other vehicle states (such as vehicle speed) which are not affected through the choice heating control will also vary through the drive cycle, and these are known as static parameters. In the first step of the implementation procedure, shown in Figure 12, a selection of vehicle parameters are recorded to be used as static parameters. These are vital for ensuring that the simulation can be reinitialised correctly at an arbitrary point during the drive cycle. The list of variables considered is:
  • Vehicle speed;
  • Motor temperature;
  • Thermal battery temperature;
  • Heater core temperature;
  • High temperature coolant temperature;
  • Chiller coolant temperature;
  • Condenser refrigerant temperature;
  • Evaporator refrigerant temperature;
  • Compressor speed;
  • Compressor controller variables;
  • PTC heat output;
  • Battery SOC.
While the control option will have no effect on the vehicle speed, it is likely to have an effect on some of the other parameters from this list. For example, should the battery heating be initiated late in the drive cycle, it may cause an increase in compressor speed, which would not be captured using the compressor speed as a static parameter. It may be argued then that these variables should be included as state variables. However, this approach would not be feasible since the computation effort would increase exponentially with the addition of each new state variable due to the “curse of dimensionality”. It is, therefore, assumed that, for items two to twelve on the list presented above, the variation in their value due to different battery heating requests is either insignificant or the variation caused is inconsequential to the cost function and cost matrix.

5.2. Cost Function

The cost function is defined to account for three factors critical to performance and comfort, which are represented using three vehicle metrics. The first metric is energy consumption which incentivises the minimisation of HVAC usage. The second is depth of discharge (DOD) which correlates directly to remaining range and is separable from energy consumption due to the subtleties of the impacts of low temperature on battery performance [32]. For example, it is possible to spend extra energy on heating the battery at the start of the drive cycle, resulting in higher battery temperatures and a higher final SOC. In this case, the energy efficiency would be reduced, but the vehicle range increased [32]. Finally, comfort is represented with the third metric, which is paramount to the user experience of electric vehicles. These three attributes correspond to objectives j 1 , j 2 , and j 3 , which are defined by:
j 1 ( k ) = t s t a r t ( k ) t e n d ( k ) V o c v × I ( t ) d t ,
j 2 ( k ) = S O C t s t a r t ( k ) S O C ( t e n d ( k ) ) ,
j 3 ( K ) = t s t a r t ( K ) t e n d ( K ) 22 T c a b i n ( t ) d t .
Here, V o c v is the open circuit voltage, which is used instead of terminal voltage to include cell internal losses; I ( t ) is the battery current; t s t a r t ( k ) and t e n d ( k ) are the start and end times of the kth time step; S O C is the battery state of charge; and T c a b i n is the measured cabin temperature, with 22 ° C being the cabin target temperature. The individual objectives are combined in the following way to define the cost J ( k ) , which represents the cost at the kth time step of the solution.
J ( k ) = i = 1 i = 3 w i j i n i ( k ) .
Here, w i are weighting factors used to control the desired balance between battery performance and comfort; a full definition and explanation of these factors is given in Section 6.1. n i are the normalisation factors which are defined using Equation (16). For this normalisation, the vehicle is operated in a baseline configuration, in which the battery is not heated, and generates cost metrics j i b a s e l i n e . Hence, for the purpose of the dynamic optimisation, improvements in cost correspond to improvements over the no heating strategy.
1 = n i j i b a s e l i n e .

5.3. Implementation

In this section, the procedure to implement the DP solution is described. The method for implementing the DP approach is described in the following steps.
  • Step 1. DP search boundary generation through the evaluation of the model under cases: firstly with full battery heating (10 kW requested at the start of the cycle) and no battery heating. These two cases are also used to generate static parameters for the problem and used for comparison in Section 6.1.
  • Step 2. Cost matrix generation. Here, the cost is found at every 300 s and at every feasible state (discretised cabin and battery temperature) and for every control option. The cost matrix describes the consequence of using every control at every point in the problem and, hence, can be used to find a control sequence which minimises cost.
  • Step 3. Backwards solution. Here, the open source algorithm works backwards through the cost matrix and finds the control option which minimises the cost at every point in the state space. The output of this is a control lookup table which is used in the forward solution to identify which control option to use at each time step.
  • Step 4. Forward solution. The problem is simulated iteratively (each time step reinitialised and simulated separately); after each time step, the vehicle’s location in state space is considered, and the control matrix from the backward solution is used to find the control that should be used. The output from this step is the optimised control trajectory.
  • Step 5. Validate found solution in Dymola. The found control strategy from Step 4 is imported in Dymola and the problem is simulated continuously (without re-initialisation). The output of this step is the final vehicle metrics which can be used to assess progress.
The work flow implemented when using the open source toolbox is visualised in Figure 12. Here, C_ c y c l e is the cost found from simulating the entire cycle, where the inputs into the Dymola model are the ambient temperature and a fixed control strategy, either full battery heating (10 kW) or no battery heating. C_ T s is the cost associated with the simulation of the time step T s within the drive cycle. Here, the inputs to the Dymola mode are the ambient temperature, the required simulation start time, the control option for that time step, the values of the state variables, and the values of the static variables, which are found using profiles generated in output 1.
To produce the cost matrix, the problem needs to be discretised; hence, the control trajectory for the electric battery heating has been discretised into four levels: none (0 kW), low ( 3.33 kW), medium ( 6.66 kW), high, or full (10 kW). This extra discretisation beyond the binary approach, which would be 0 kW or 10 kW, provides extra control over the heating strategy. X s are the state variables, T c a b i n and T b a t t e r y , which are discretised into 1 ° C and 2 ° C increments, respectively. The problem is also discretised into time steps of 300 s. This time step length was chosen since it is approximately the length of time of the shortest segment of WLTP cycle (which is used for this research). This ensures that the time resolution is high enough to identify the required battery heating quantity for each section of the chosen drive cycle.

6. Results

6.1. Initial Testing

Table 7 shows the weighting splits between each of the components of interest which make up the cost function. These weightings are retrospectively applied to the cost matrix between steps 2 and 3 of the DP process described in Section 5. Table 7 has been created to control the balance between range and comfort when considering how to optimally heat the electric battery. Neutral refers to a case where the priorities are treated equally, with the intention of finding a solution towards the mid point in available range and comfort. There are then weighting groups which skew the priority to either the cabin or the battery; in these cases, the prioritised component carries two-thirds of the weighting, which is twice as much weight as that given to the un-prioritised component. The intention here is to find solutions which improve cabin heating or battery performance, while still taking the other into account, hence not finding the simple heating solutions which are expected to represent the extreme. Within each group, there is also a split in battery priority which is denoted by Neutral, Energy, and Range for each column of Table 8. Within the results, the specific weightings used will be referred to as “Neutral N”, “Neutral E”, “Neutral R”, “Battery N”, and so on, as shown in Table 7. With the battery objectives split into two components, energy and DOD, there may be an advantage to be had in changing the weighting between them. This is explored in the results with the best weighing mix identified for each weighting group (Neutral, Cabin, and Battery).

6.2. Simulation Set Up

The model developed in Dymola is used to for Step 1 of the process discussed in Section 5.3. In completing this step, a .exe file is generated, which is used within MATLAB (R2018a, MathWorks, Natick, MA, USA) to complete steps 2 to 4 of the process. The solution is then imported into Dymola again, where it is implemented, and the improvement can be measured. This simulation setup is visualised in Figure 13.
For the drive cycle shown in Figure 13b, the WLTP drive cycle is selected as shown in Figure 14. The WLTP cycle is chosen as it is currently the official cycle for measuring fuel consumption and electric vehicle range.
The results from the implementation of the method described in Section 2 and Section 5 are presented in Section 6.3 and Section 6.4. Section 6.3 demonstrates and implementation of the dynamic programming method for the 9 priority weightings described in Table 7. In this section, the individual solutions will be presented and analysed in more detail. In Section 6.4, the weightings in Table 7 will be used to investigate the sensitivity of the method to variations in the balance of the cost function at two additional ambient temperatures without the analysis into individual solutions produced. The results will be used to provide recommendations of which weighting split to use at each temperature to maximise performance.

6.3. DP Demonstration

Here, the DP method is performed on the model described using the WLTP drive cycle, seen in Figure 14, at 7 ° C. This combination of drive cycle and ambient temperature selection represents the low temperature testing procedure in Europe [51]. The resulting optimal trajectories can be seen in Figure 15 and Figure 16. These generated optimal battery heating trajectories were implemented in the Dymola model as described in the final stage of Figure 12. The resulting vehicle performance metrics corresponding to the optimised heating trajectories can be seen in Table 8. Table 8 also shows results for two simple heating strategies, full heating and no heating. In the full heating strategy, the battery receives the full 10 kW of heat from the start of the cycle, and battery heating is ceased when the battery reaches its target temperature of 20 ° C. In the no battery heating scenario, the battery receives no heat through the drive cycle. It should be noted that the full battery heating strategy uses less energy than the no heating strategy. While battery heating uses some additional energy at the start of the cycle, this is recuperated by an increase in battery efficiency at the end of the cycle, leading to the energy and range improvements seen. However, the full battery heating also leads to a higher mean discomfort, defined by the cost metric j 3 in Equation (14). This shows that heating the battery, while improving the vehicle’s performance, reduces the thermal comfort experienced by the occupants of the cabin.
Figure 15 and Figure 16 show that all the optimal heating strategies begin heating the battery at 1200 s. This is a chance result of the optimisation process. It shows that, under any balance of cost metrics, 1200 s is the optimal time to heat the battery during the WLTP drive cycle at 7 ° C. It is likely that this is the case as it allows enough time for the cabin to reach temperature, thereby having minimal impact on the comfort metric, while still being early enough in the cycle to improve battery performance before the high speed section at the end of the cycle. This is a “sweet spot” that exists due to he length and design of the WLTP cycle and the ambient temperature. Different drive cycles at different ambient temperatures may have different “sweet spots”.
In Table 8, it can be seen that the vehicle performance metrics for the optimised heating trajectories fall between the values corresponding to the full heating and no heating control strategies. This indicates that the method has been successful as a balance has been reached between range and comfort. For example, considering the results corresponding to the “Neutral N” weighting mix, the range has improved by 8 % compared to the no battery heating strategy but is not as good as the full battery heating strategy. Conversely the comfort has improved by 4 % compared to the full battery heating strategy but is not as good as the no heating strategy.
Table 8 shows results corresponding to all nine weightings presented in Table 7, and the sub-weighting which gives the best results considering the intention of the weighting is identified in bold. “Neutral E” is selected as the best Neutral weighting as it improves energy consumption and range in comparison to “Neutral N” and “Neutral R”, while only have a small impact on Discomfort. For prioritising, the cabin “Cabin N” has been selected, which significantly improves range compared to “Cabin E”, while having a very small increase in discomfort. However, if this additional range is not required, then using the No Heating simple strategy would be the best strategy to use as it promotes maximum comfort. Finally, when the battery is prioritised, “Battery R” is selected as the best weighting mixture as it maximises range, while still improving comfort in comparison to the Full Heating strategy. However, here, it should also be mentioned that, should 126.7 km not cover the required range for a days duty cycle, then it may be best to use the Full Heating strategy at the expense of some additional discomfort.
Figure 17 shows the cabin and battery temperature profiles for the simple heating strategies and the optimised heating trajectory according to the “Cabin N” weighting in Table 7. The benefits of the DP method can be better seen through Figure 17. The decision to heat the battery, which will increase its temperature and therefore effective capacity, extending the vehicles range, is delayed until the end of the cycle, as seen in Figure 16a. Delaying the heating event has the effect of increasing cabin comfort in the early part of the cycle from the increased heating capacity resulting from not heating the battery. This is an important change, as it is likely to give a greater feeling of comfort at the start of the cycle which can be more important than final cabin temperature in terms of thermal sensation and perceived comfort [52]. The DP optimised profile also activates battery heating shortly before the high speed section of the WLTP cycle. It is likely that this decision arises because the battery performance will have a greater impact when the vehicle is at higher speed and drawing more current since losses governed by I 2 R ohmic heating. This is an important point to make as it is possible the battery heating may not be required if a drive cycle does not contain a high speed section.
Figure 17a shows a reduction in cabin temperature when using the DP derived solution in comparison to both the simple heating strategies at the end of the drive cycle. This will have an impact on the the cabin discomfort metric j 3 , defined in Equation (14), although the majority of the benefit in comparison to the the Full Heating strategy is achieved before 1200 s. The severity of the cabin temperature reduction at the end of the cycle may indicate a potential area of improvement for method refinement, which is discussed more full in Section 7, but stems from the exclusion of the heater core temperature as a state variable, leading to a reduced accuracy cost matrix.
Table 8 clearly demonstrates the advantage of using an optimised battery heating trajectory in balancing range with cabin comfort. Taking “Cabin N” as an example, the range has increased by 6 % in comparison to the no heating strategy, while the comfort has improved by 6 % (measured using the distance to target temperature) compared to the full heating strategy. With implementation, this would offer the ability for the user to select an option to increase the vehicles range without minimising the cabin comfort.

6.4. Sensitivity Analysis

The DP method is repeated using the full set of weightings presented in Table 7 for ambient temperatures 15 ° C and 0 ° C. Table 9 and Table 10 show the results of the DP application at ambient temperatures 15 ° C and 0 ° C respectively. This temperature range is chosen as it covers the expected cold temperature range of Europe in January [53]. This is done to understand how the results and sensitivity of the method vary at different temperatures. As with the results corresponding to 7 ° C, the results identified in bold signify to best compromise and heating trajectory which would most likely be implemented. Here, it can be seen that, at 15 ° C, the window in range is greatest; this arises since 15 ° C creates the greatest window in battery temperature operating range and, therefore, the greatest window in battery performance. Likewise, the window generated at 0 ° C is the smallest, reflecting the smaller battery temperature operating window. While the window of operation at 15 ° C is bigger than that at 0 ° C, it is not as great as the window of operation at 7 ° C. Compared to 7 ° C, at 15 ° C, the battery requires more energy to heat it to a beneficial temperature, so the window in range is not as large.
It may be noticed that the range does not improve through the ambient temperatures, which might be suspect since the increase in ambient temperature would be expected to improve battery performance and reduce HVAC consumption. At 15 ° C, the maximum range is 123.8 km, and, at 7 ° C 127.1 km is achievable, but, at 0 ° C, only 124.8 km is available. The cause of this is the heat pumps ability to extract heat from ambient depending on ambient temperature. At 15 ° C, the heat pump is unable to extract heat from ambient, and this reduces the amount of work that the heat pump is able to do. At 0 ° C, ambient is hot enough for thermal extraction, leading to an increase in compressor load. For example, using the Neutral N weighting the heat pump consumes 0.883 kWh of electrical energy at 15 ° C, and this increases to 1.2 kWh of electrical energy at 0 ° C. The reward for this extra consumption in electrical energy is the increase in cabin comfort which arises from greater heat pump performance. This can be evidenced by a 15 % increase in heat delivered to the cabin during the first minute of the cycle when comparing the full battery heating strategies at the two ambient temperatures. This can be seen in Figure 18. The cost of increasing the power consumption of the compressor is a reduction in potential range of the vehicle. This may be adjusted by focusing on the control of the compressor demand, or by controlling the heat flow to the cabin; however, this work is focused on maximising cabin comfort, while balancing range using optimised battery heating.
In summary, it has been shown that there is the opportunity to control the balance between cabin comfort and battery performance by dynamically heating the battery. Using the found trajectories, it is possible to make recommendations as to when during a drive cycle the battery should be heated, and by how much. This information is summarised in Table 11.

6.5. Online Implementation.

One of the identified limitations of the dynamic programming is that solutions are specific to the scenario which they are generated for. In this respect, none of the control strategies identified in Figure 15 and Figure 16 can be implemented as a “cover all" solution. To address this, an intelligent controller should be built that is able to combine solutions found through DP into a solution which is applicable for a specific day’s driving duty.
The first step in producing this controller is to develop an artificial intelligence (AI) pattern recognition tool which can identify and compare a real-world driving pattern with standard/pre-defined duty cycles for which there exists DP solutions. The second step of this controller will then identify which weighting factor is needed to meet the vehicles duty cycle. For example, should the duty cycle require 120 km of range at 7 ° C, then the controller would look to use “Neutral E” optimised DP solutions in accordance with Table 8. In making this choice, the controller has ensured the vehicle will meet the range requirement while maximising the thermal comfort for the occupants. Finally, DP solutions stored within a repository will be combined according to the results of the AI pattern recognition tool and the vehicles operating priority to deliver the optimum battery heating strategy for the duty cycle. This process is summarised by the following three steps.
  • AI pattern recognition tool.
  • Intelligent decision maker to identify which weighting should be used to achieve the required range while maximising cabin comfort.
  • DP solution repository combination into implemented control.
This process represents a strategy for building a controller, allowing this theoretical work to become implementable on physical vehicles.

7. Discussion

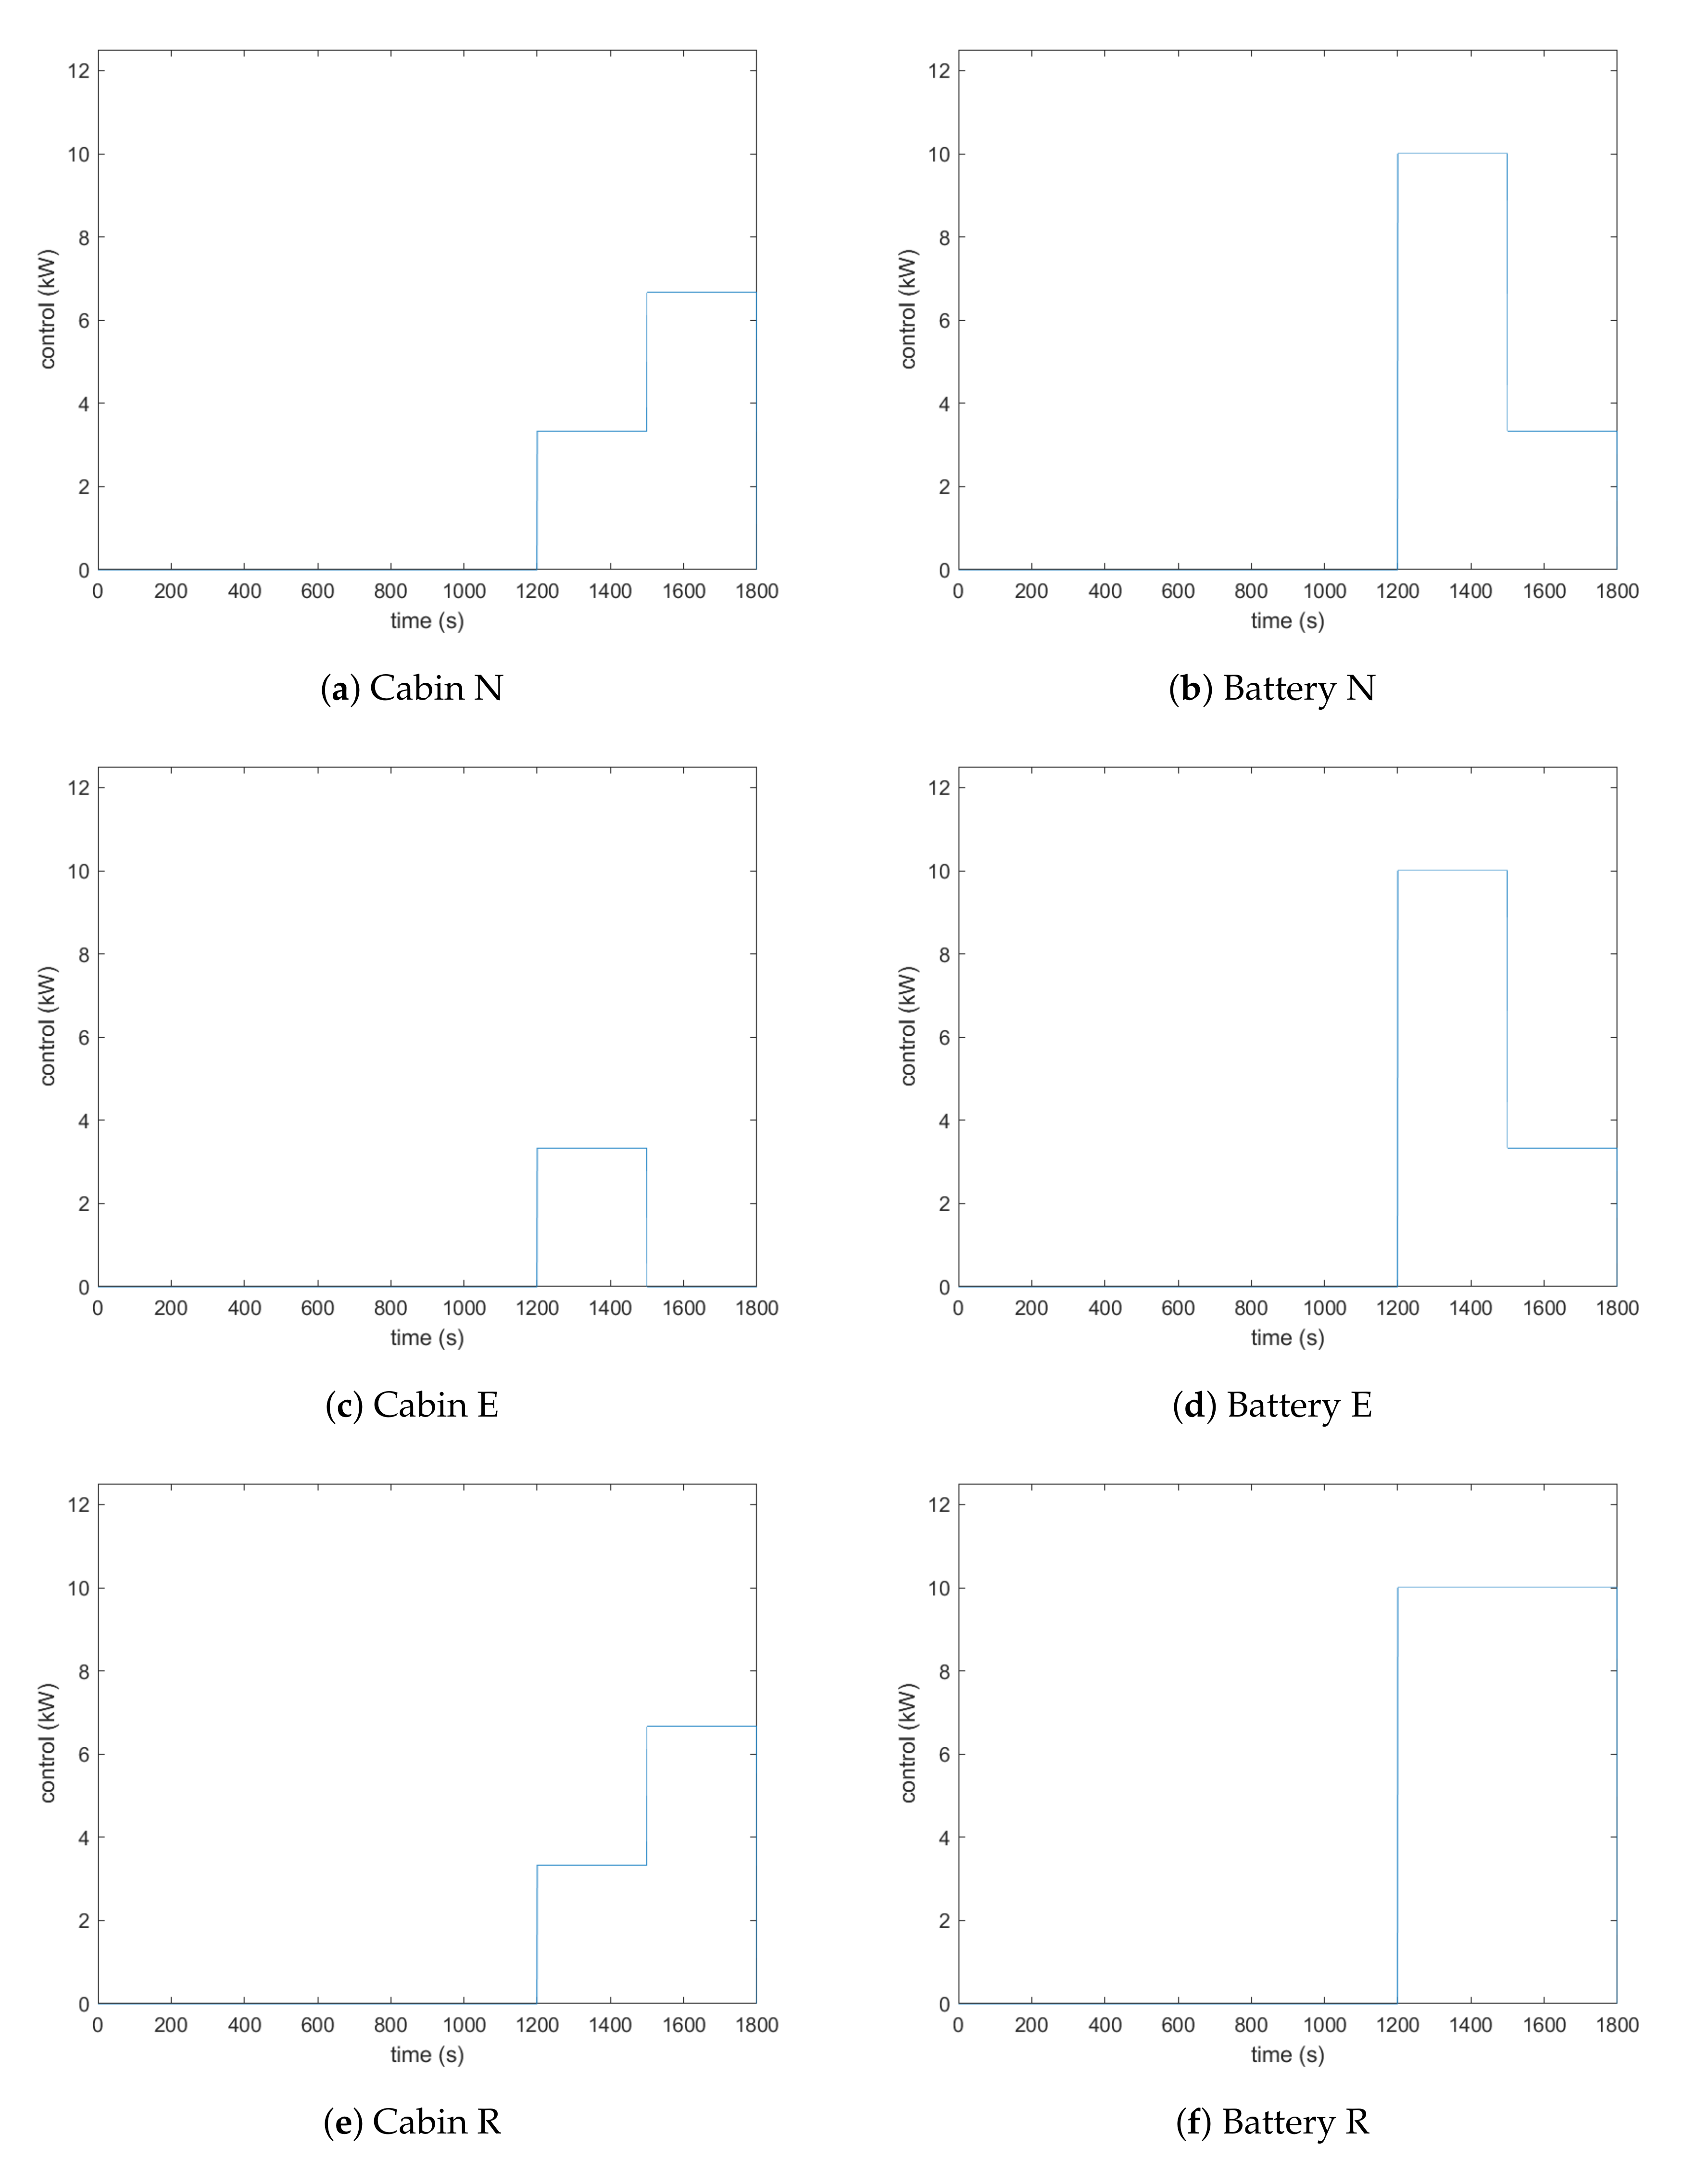
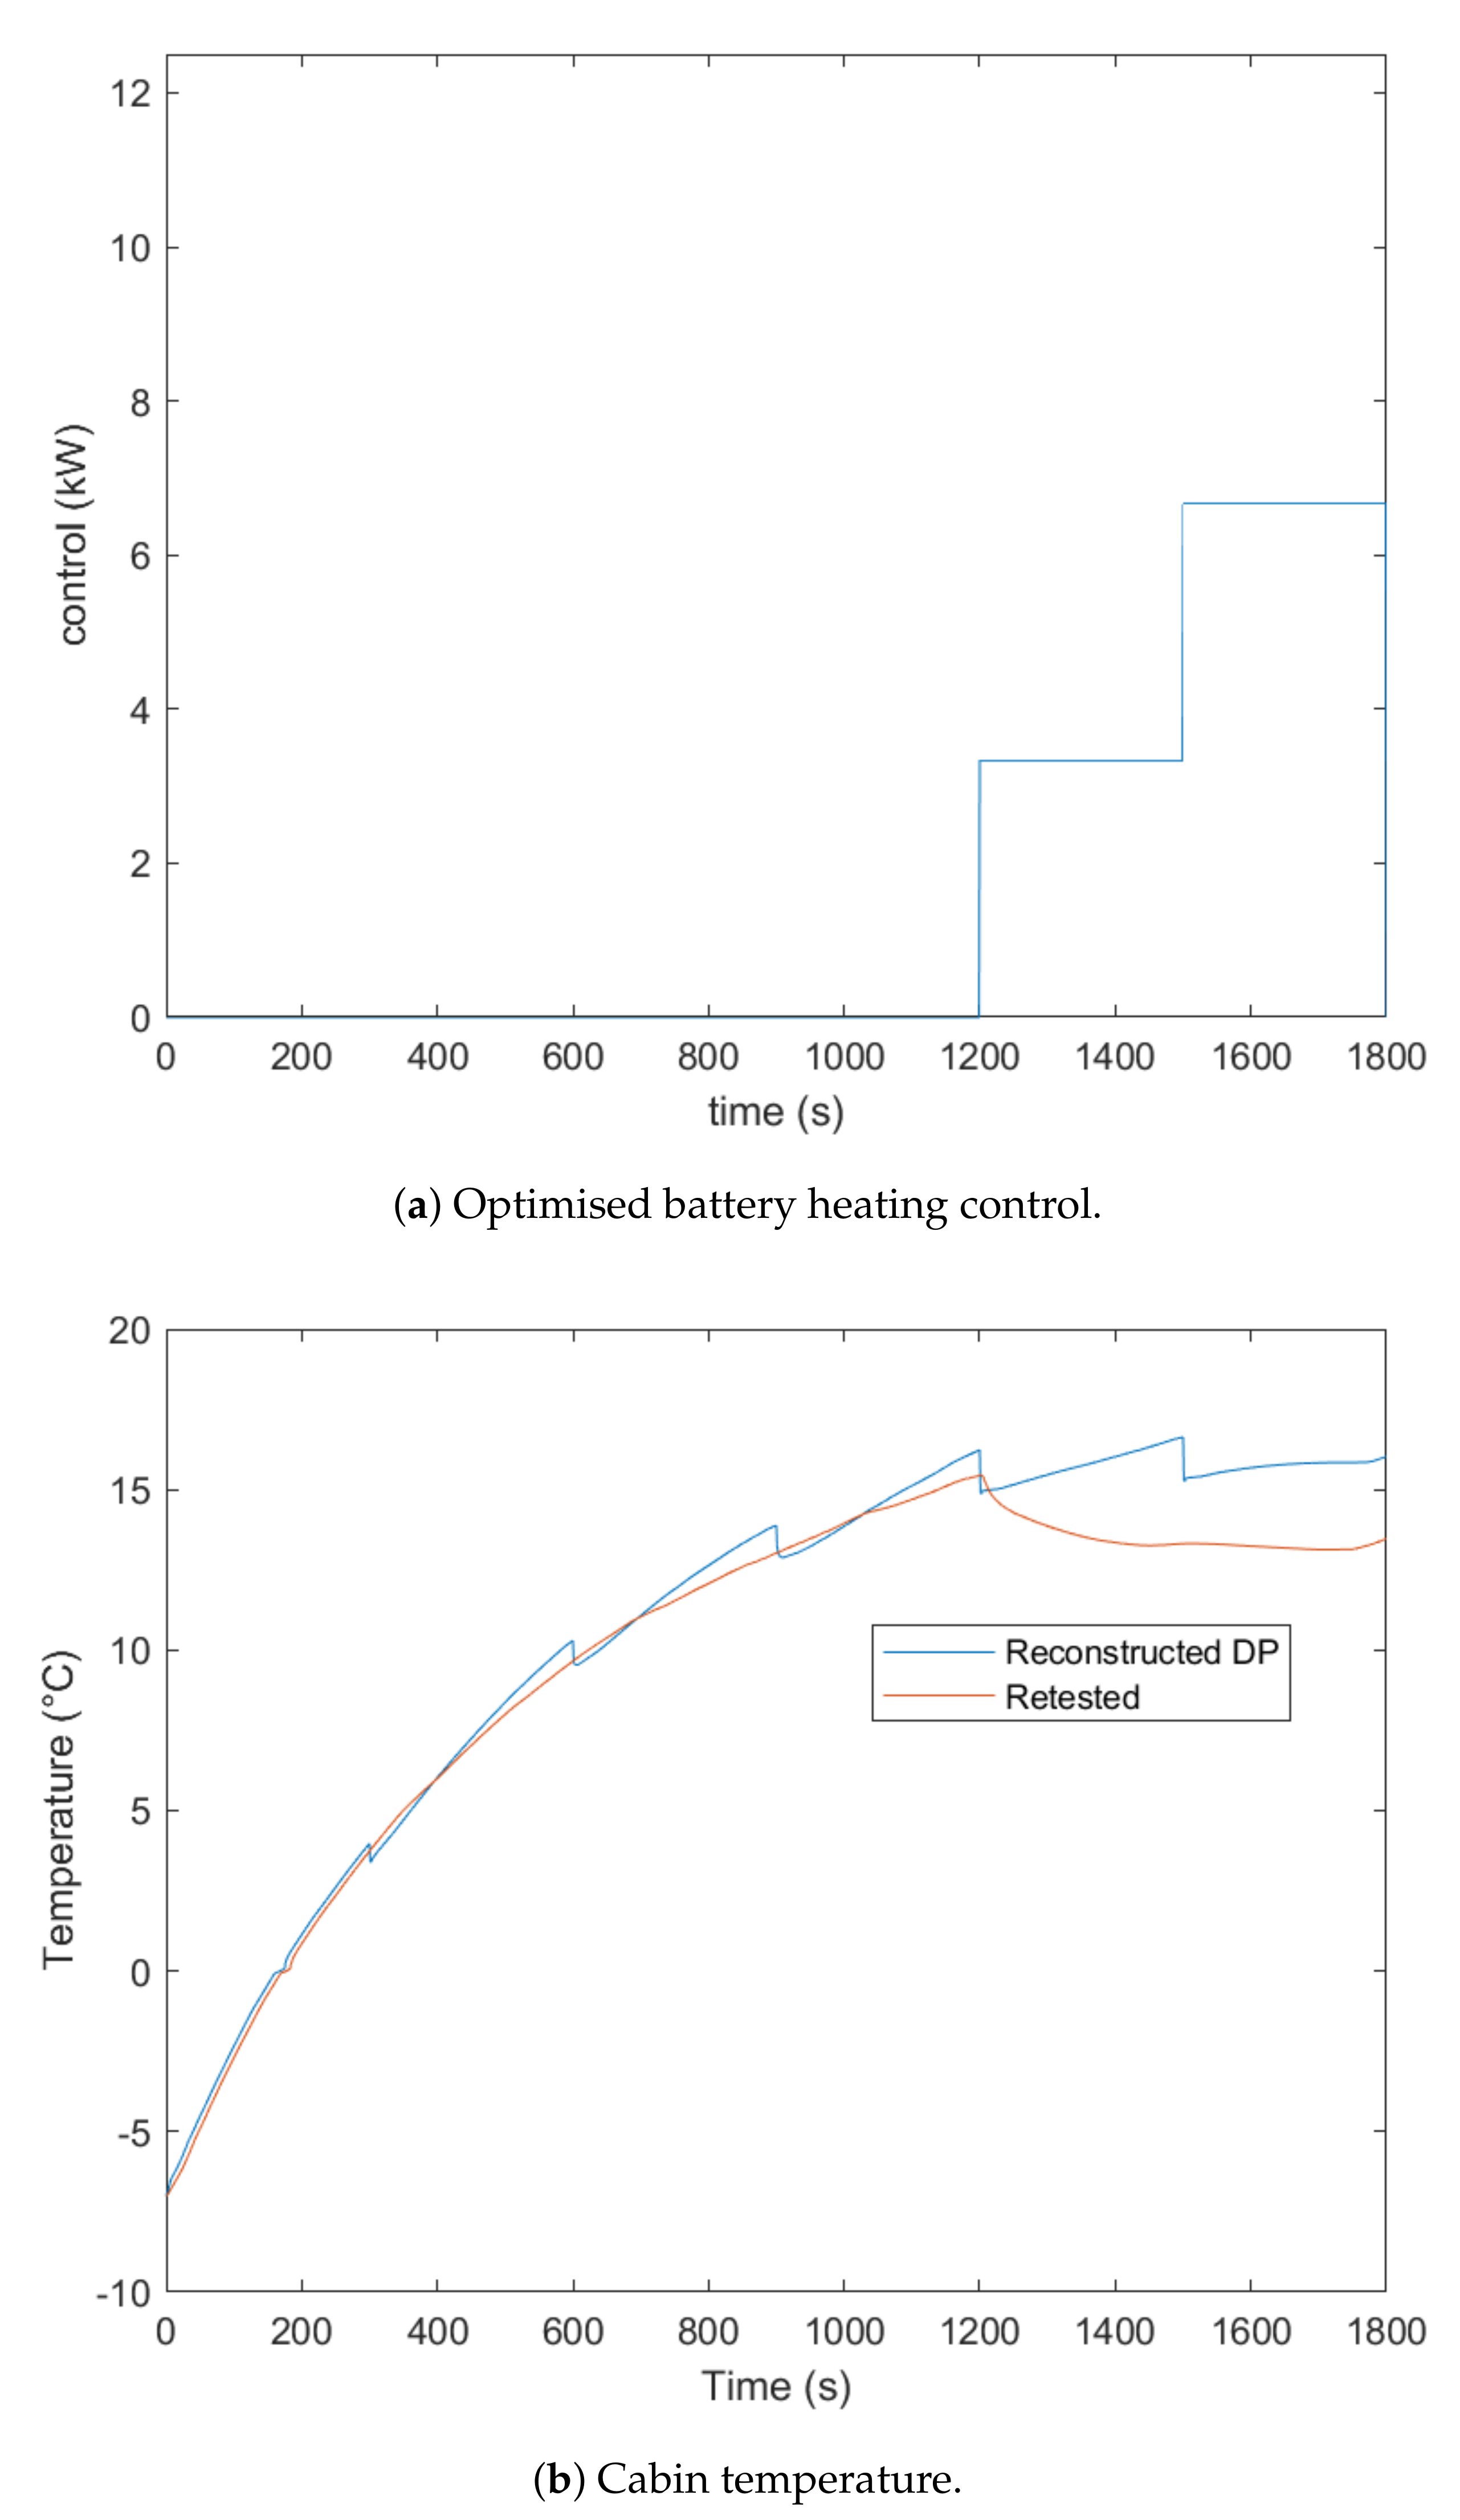
Figure 19a shows the optimised battery heating control generated which prioritising the battery and using a neutral split of battery objectives (“Cabin N”). Here, it can be seen that all of the heating events happen at the end of the cycle. In Figure 17a, is was seen that this strategy had an adverse impact on cabin temperature. Figure 19b shows two cabin temperature profiles, the one resulting from the DP-based thermal management optimisation process and one resulting from the implementation of the DP solution into the Dymola model. Here, it can be seen that the during the DP process the algorithm predicted that the cabin would be less affected by the late activation of battery heating. In this section, the discrepancy between the two profiles is investigated.
The optimisation results were derived from the algorithm performing the simulation in consecutive piece-wise sections. Having performed the backward solution, the algorithm consecutively simulates each time step, evaluating the value of the state variables at the end of each simulation, and using this information to decide the control value for the next step. This corresponds to the 4 steps of Figure 12. This piece-wise simulation approach, generated through the forward solution, is reconstructed into a single trajectory and presented as the reconstructed profile in Figure 19b. Once the solution is found, it is simulated in full in Dymola to check for agreement with the reconstruction, and this is denoted as the re-simulated profile.
Figure 19b distinctly shows that the algorithm predicts a more comfortable cabin temperature experience than the one generated through the implementation of the optimised control generated. Considering Figure 19a,b partially explains why this divergence occurs. During the heating phase at 1200 s, the retested cabin temperature begins to deviate from the reconstructed cabin temperature. This implies that, during the reconstruction, the DP algorithm is operating under the assumption that there is more heat availability than their actually is. This can be explained when considering the assumption made about the heater core temperature explained in 
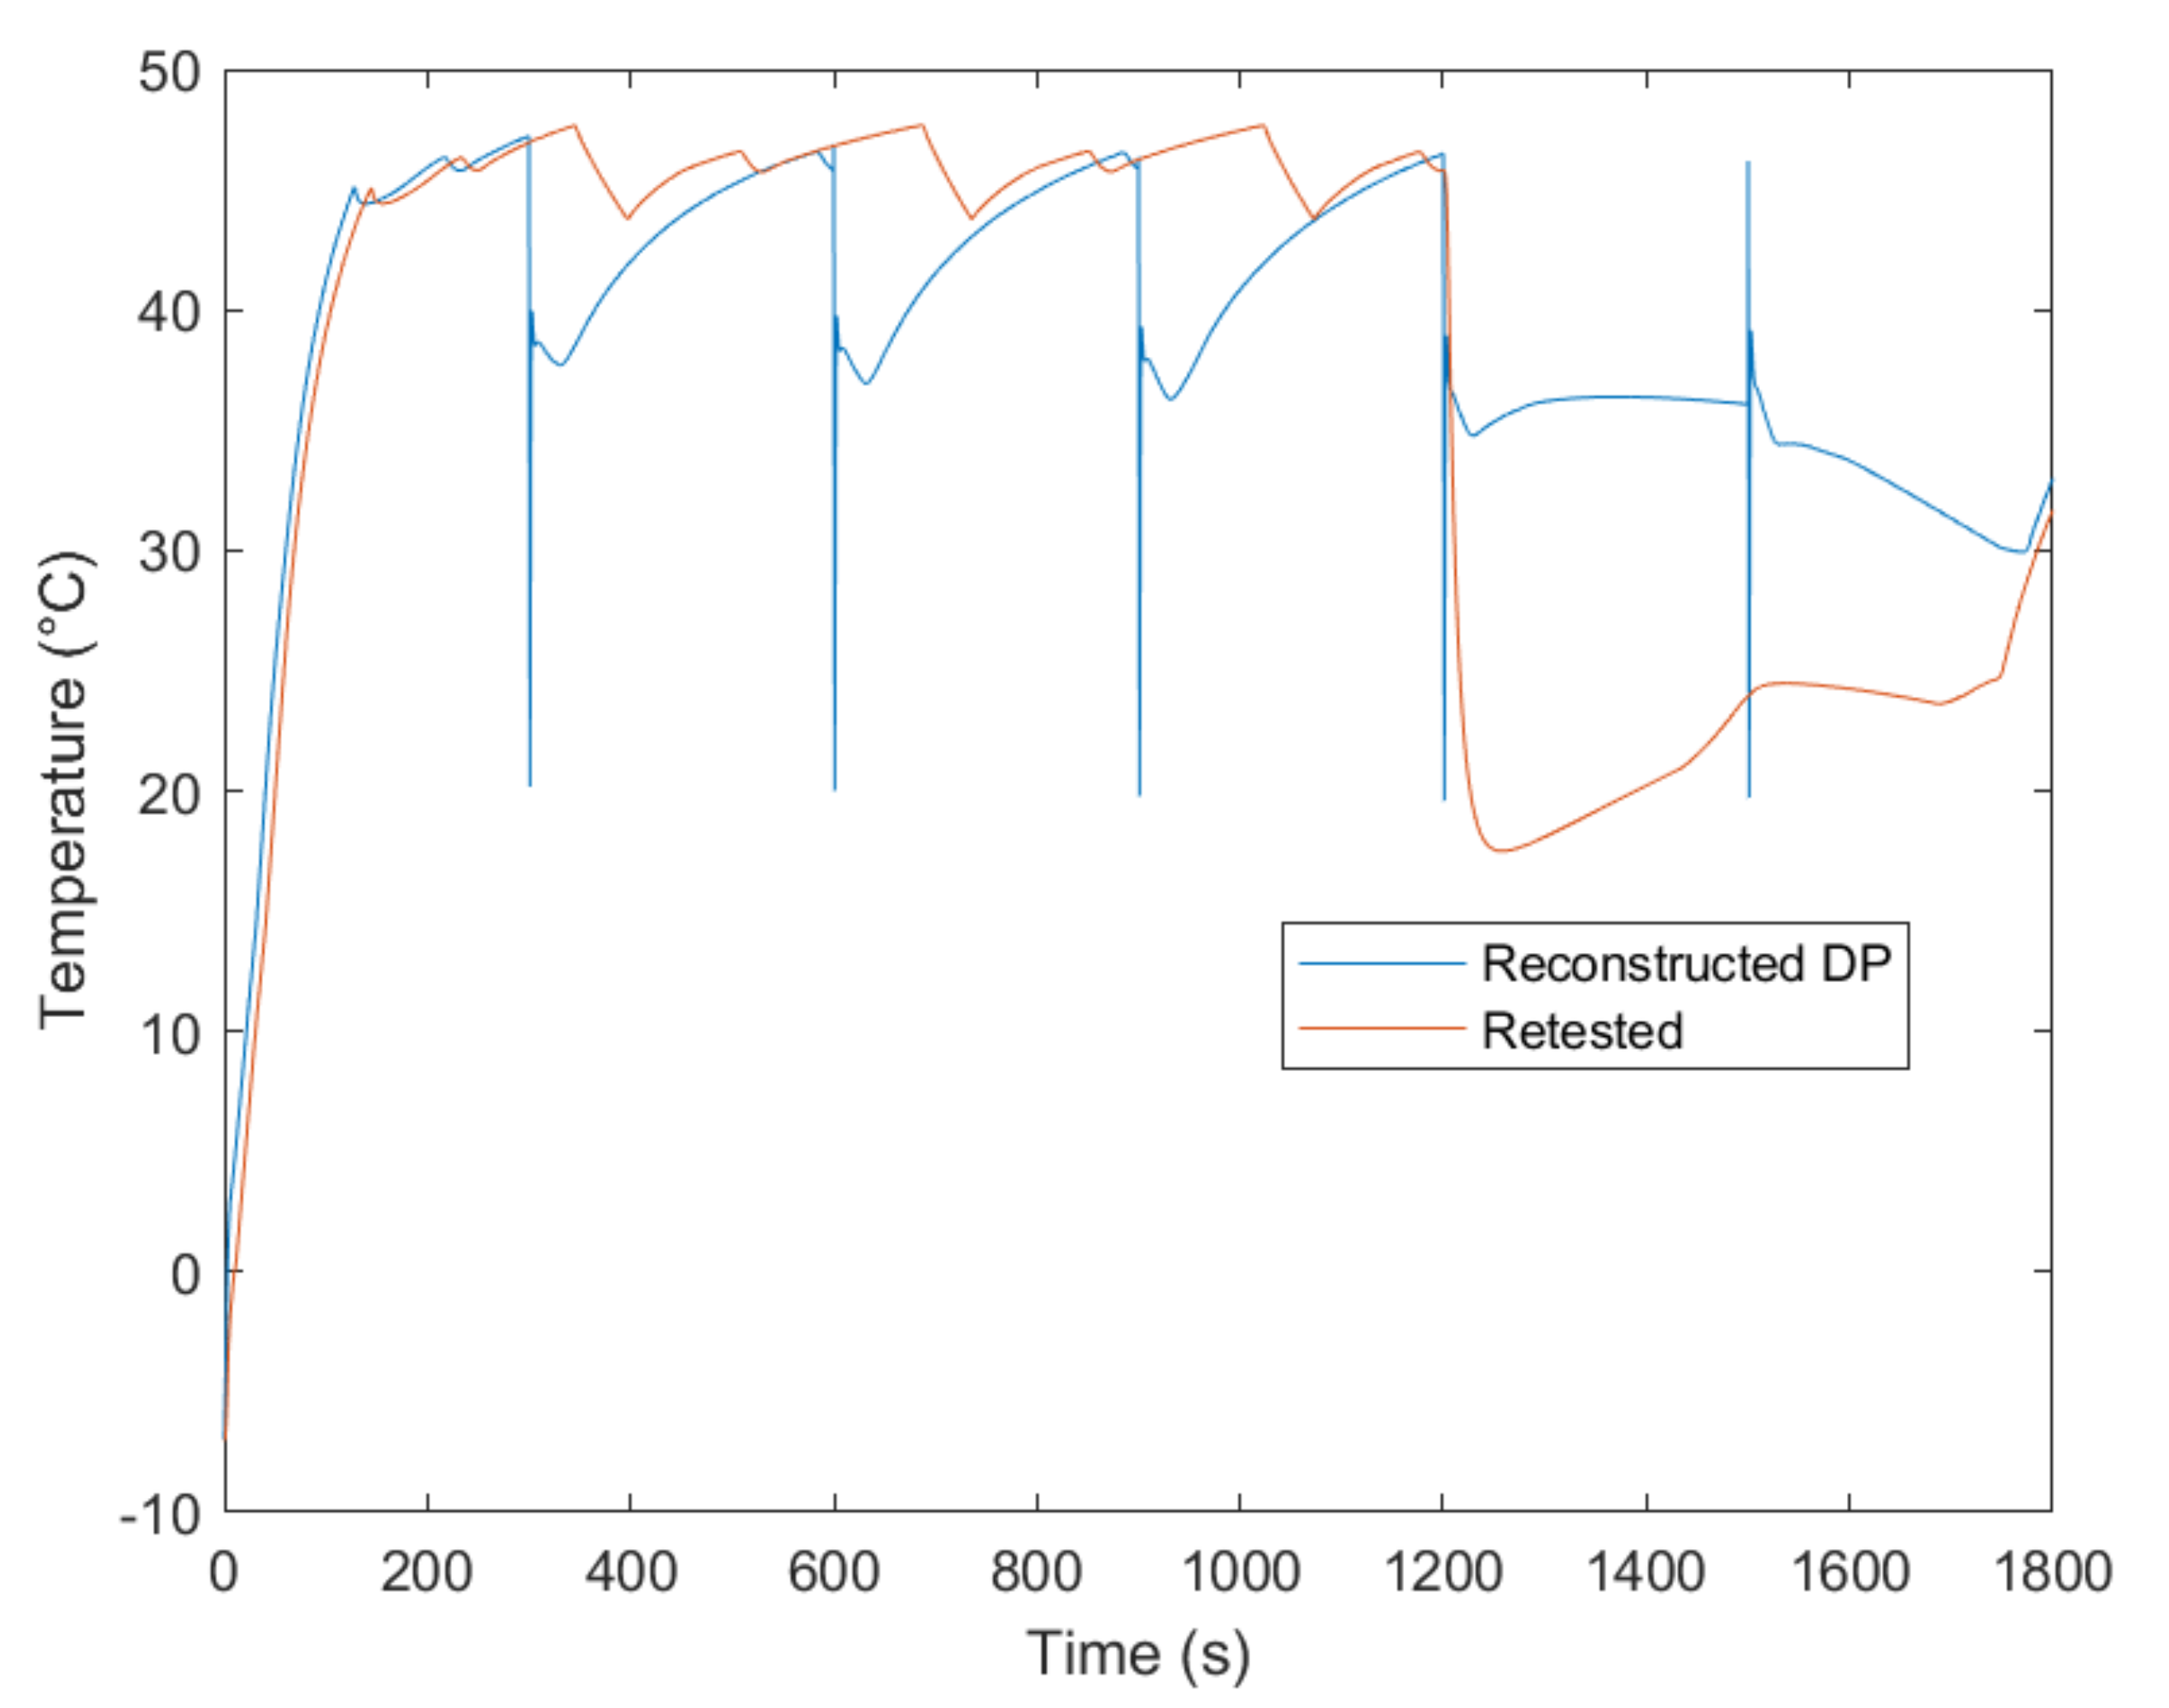
Section 5.1. The reconstructed heater core temperature profile is shown in Figure 20. The heater core is located between the high temperature circuit and the cabin in Figure 1, and it converts heat from the high temperature circuit into heated air for the cabin; therefore, its temperature significantly impacts heat delivered to the cabin.
Figure 20 shows that the reconstructed heater core temperature is able to recover instantaneously after the battery heating performed at 1200 s. This means the heater core starts at a higher temperature during the next time step at 1500 s, while the re-simulated heater core temperature remains low as the battery heating continues. This happens because its initialisation value is controlled by the static parameter trajectory (Section 5.1) which is not adapted due to the previous time steps control value. However, it can be seen from the re-simulated trajectory that the heater core temperature is not able to instantly recover after the heating event; therefore, the cabin temperature does not rise as quickly as expected. The DP algorithm will understand the over predicted heater core temperature as an abundance of heat available to the cabin. The algorithm assumes that heat can be delivered to the battery at little cost to the cabin comfort due to the high heater core temperature; however, this is not the case, and the cabin temperature suffers.
The solution to this is to include the heater core temperature as a state variable. Therefore, after a heating event when the heater core temperature is lowered, the cost matrix will be able to predict the cost of starting at this reduced heater core temperature, which may discourage the use of battery heating under some circumstances. The inclusion of heater core temperature as a state variable will also improve the accuracy of the reconstructed cabin temperature when predicting the consequences of implementing the optimised battery heating control strategy. However, the inclusion of the heater core as a state variable adds to the “curse of dimensionality” when using dynamic programming. As an example, if 8 values of heater core temperature are to be used (for example), then the simulation time required to complete cost matrix would increase by a factor of 8. This could make the computational cost prohibitively long.

8. Conclusions and Further Work

A dynamic optimisation was performed to find the optimal dynamic heating strategy for a battery electric vehicle. It was demonstrated to be able to successfully find a balance between range and comfort in Section 6.3. The result of this optimisation was a 6.2 % increase in range compared to no battery heating and 5.5 % increase in thermal comfort compared to full battery heating, at an ambient temperature of 7 ° C.
In Section 6.4, a sensitivity analysis was performed at different ambient temperatures. This resulted in a recommendation for the best heating strategies to use dependant on ambient temperature and desired priority. Finally, there was a recommendation of when, and by how much, to heat the during a drive cycle depending on different priorities and ambient temperatures, shown in Table 11.
The heating optimisation method shown in this work is not compatible with direct use in a real world use cases. Exploring a wide spectrum of driving scenarios with this method can provide the data required to optimise heating strategies off-line. The results can be then utilised as a control benchmark to develop an intelligent heating control strategy suitable for real-time application.
The next step to be performed in this work is to refine the method by including the heater core temperature as a state variable, as described in Section 7. Upon the success of this refinement, the method should be expanded to incorporate more drive cycles and an intelligent scenario recognition control, which will automated the choice of the ideal control strategy. This will represents steps in the direction of real world implementation.
  • Develop intelligent controller to recognise driving condition and deploy appropriate control.
  • Include heater core as a state variable to improve performance of DP procedure.
  • Improved state limitation recognition for more computationally efficient DP cost matrix construction.
Although the examples used in this study have focused on the low temperature use case, the same issue is present at high temperatures. Here, the motivation is to reduce the battery temperature to prevent ageing and ensure safety. Battery cooling reduces the cooling capacity available for the cabin, so the method demonstrated here could be reapplied to create dynamic battery cooling trajectories, which balance battery ageing against cabin thermal comfort.
Using this method could increase the acceptance of EV as manufacturers will be able to improve range at low ambient temperatures, while still maintaining high cabin comfort, when extended range is not required. This will allow the vehicle to self regulate and self optimise according to individual journeys and requirements.

Author Contributions

J.J. was responsible for the conceptualisation, methodology, validation and final analysis. Software assistance was provided by A.P. and Claytex, supervision and assistance in writing and editing was provided by T.Q.D., W.D.W. and A.M. All authors have read and agreed to the published version of the manuscript.

Funding

This research was funded by EPSRC, grant reference number [EP/M507593], and Jaguar Land Rover.

Acknowledgments

The research contained within this manuscript would not have been possible without the funding of EPSRC, Jaguar Land Rover, and Catapult. The modelling used for this research was supported by Claytex Ltd.

Conflicts of Interest

The authors declare no conflict of interest.

References

  1. Meyer, N.; Whittal, I.; Christenson, M.; Loiselle-Lapointe, A. The impact of the driving cycle and climate on electrical consumption and range of fully electric passengers vehicles. In Proceedings of the EVS, Los Angeles, CA, USA, 6–9 May 2012; Volume 26. [Google Scholar]
  2. Reyes, J.R.M.D.; Parsons, R.V.; Hoemsen, R. Winter happens: The effect of ambient temperature on the travel range of electric vehicles. IEEE Trans. Veh. Technol. 2016, 65, 4016–4022. [Google Scholar] [CrossRef]
  3. Meyer, J.; Lustbader, J.A.; Rugh, J.P.; Titov, E.V.; Agathocleous, N.; Vespa, A. Range Extension Opportunities While Heating a Battery Electric Vehicle; Technical Report; National Renewable Energy Lab. (NREL): Golden, CO, USA, 2018. [Google Scholar]
  4. Ahn, J.H.; Kang, H.; Lee, H.S.; Jung, H.W.; Baek, C.; Kim, Y. Heating performance characteristics of a dual source heat pump using air and waste heat in electric vehicles. Appl. Energy 2014, 119, 1–9. [Google Scholar] [CrossRef]
  5. Steiner, A.; Mladek, A. Reducing the energy consumption for comfort and thermal conditioning in EVs. In Proceedings of the 2017 Twelfth International Conference on Ecological Vehicles and Renewable Energies (EVER), Monte Carlo, Monaco, 11–13 April 2017; pp. 1–4. [Google Scholar]
  6. Leighton, D. Combined Fluid Loop Thermal Management for Electric Drive Vehicle Range Improvement. SAE Int. J. Passeng. Cars Mech. Syst. 2015, 8. [Google Scholar] [CrossRef] [Green Version]
  7. Chowdhury, S.; Leitzel, L.; Zima, M.; Santacesaria, M.; Titov, G.; Lustbader, J.; Rugh, J.; Winkler, J.; Khawaja, A.; Govindarajalu, M. Total Thermal Management of Battery Electric Vehicles (BEVs); Technical Report; MAHLE: Lockport, NY, USA, 2018. [Google Scholar]
  8. Jeffs, J.; McGordon, A.; Picarelli, A.; Robinson, S.; Tripathy, Y.; Widanage, W. Complex Heat Pump Operational Mode Identification and Comparison for Use in Electric Vehicles. Energies 2018, 11, 2000. [Google Scholar] [CrossRef] [Green Version]
  9. Jeffs, J.; McGordon, A.; Widanage, W.D.; Robinson, S.; Picarelli, A. Use of a Thermal Battery with a Heat Pump for Low Temperature Electric Vehicle Operation. In Proceedings of the 2017 IEEE Vehicle Power and Propulsion Conference (VPPC), Belfort, France, 11–14 December 2017; pp. 1–5. [Google Scholar] [CrossRef] [Green Version]
  10. Thermal Management for Hybrid Systems and Electric Drives: Efficiency And Comfort for Electric Vehicles. Available online: https://www.bosch-mobility-solutions.com/en/products-and-services/passenger-cars-and-light-commercial-vehicles/powertrain-systems/thermal-management-for-hybrid-systems-and-electric-drives/ (accessed on 14 November 2020).
  11. Enthaler, A.; Weustenfeld, T.; Gauterin, F.; Köhler, J. Thermal management consumption and its effect on remaining range estimation of electric vehicles. In Proceedings of the 2014 International Conference on Connected Vehicles and Expo (ICCVE), Vienna, Austria, 3–7 November 2014; pp. 170–177. [Google Scholar]
  12. Tesla Model S P100D. 2017. Available online: https://ev-database.uk/car/1075/Tesla-Model-S-P100D (accessed on 12 May 2018).
  13. Zhang, L.; Fan, W.; Wang, Z.; Li, W.; Sauer, D.U. Battery heating for lithium-ion batteries based on multi-stage alternative currents. J. Energy Storage 2020, 32, 101885. [Google Scholar] [CrossRef]
  14. She, C.; Wang, Z.; Sun, F.; Liu, P.; Zhang, L. Battery aging assessment for real-world electric buses based on incremental capacity analysis and radial basis function neural network. IEEE Trans. Ind. Inform. 2019, 16, 3345–3354. [Google Scholar] [CrossRef]
  15. Zhang, S.; Xu, K.; Jow, T. Low temperature performance of graphite electrode in Li-ion cells. Electrochim. Acta 2002, 48, 241–246. [Google Scholar] [CrossRef]
  16. Zhang, S.; Xu, K.; Jow, T. The low temperature performance of Li-ion batteries. J. Power Sources 2003, 115, 137–140. [Google Scholar] [CrossRef]
  17. Jansen, A.N.; Dees, D.W.; Abraham, D.P.; Amine, K.; Henriksen, G.L. Low-temperature study of lithium-ion cells using a LiySn micro-reference electrode. J. Power Sources 2007, 174, 373–379. [Google Scholar] [CrossRef]
  18. Abraham, D.; Heaton, J.; Kang, S.H.; Dees, D.; Jansen, A. Investigating the low-temperature impedance increase of lithium-ion cells. J. Electrochem. Soc. 2008, 155, A41–A47. [Google Scholar] [CrossRef]
  19. Nagasubramanian, G. Electrical characteristics of 18650 Li-ion cells at low temperatures. J. Appl. Electrochem. 2001, 31, 99–104. [Google Scholar] [CrossRef]
  20. Ji, Y.; Zhang, Y.; Wang, C.Y. Li-ion cell operation at low temperatures. J. Electrochem. Soc. 2013, 160, A636–A649. [Google Scholar] [CrossRef]
  21. Jaguemont, J.; Boulon, L.; Dubé, Y.; Poudrier, D. Low temperature discharge cycle tests for a lithium ion cell. In Proceedings of the 2014 IEEE Vehicle Power and Propulsion Conference (VPPC), Coimbra, Portugal, 27–30 October 2014; pp. 1–6. [Google Scholar]
  22. Panosonic. Lithium Ion NCR18650BF. 2017. Available online: https://www.batteryspace.com/prod-specs/NCR18650B.pdf (accessed on 14 November 2020).
  23. Remmlinger, J.; Tippmann, S.; Buchholz, M.; Dietmayer, K. Low-temperature charging of lithium-ion cells Part II: Model reduction and application. J. Power Sources 2014, 254, 268–276. [Google Scholar] [CrossRef]
  24. Saxena, S.; Le Floch, C.; MacDonald, J.; Moura, S. Quantifying EV battery end-of-life through analysis of travel needs with vehicle powertrain models. J. Power Sources 2015, 282, 265–276. [Google Scholar] [CrossRef] [Green Version]
  25. Lee, D.Y.; Cho, C.W.; Won, J.P.; Park, Y.C.; Lee, M.Y. Performance characteristics of mobile heat pump for a large passenger electric vehicle. Appl. Therm. Eng. 2013, 50, 660–669. [Google Scholar] [CrossRef]
  26. Eddahech, A.; Briat, O.; Vinassa, J.M. Performance comparison of four lithium–ion battery technologies under calendar aging. Energy 2015, 84, 542–550. [Google Scholar] [CrossRef]
  27. Kim, N.; Cha, S.; Peng, H. Optimal control of hybrid electric vehicles based on Pontryagin’s minimum principle. IEEE Trans. Control Syst. Technol. 2010, 19, 1279–1287. [Google Scholar]
  28. Sciarretta, A.; Guzzella, L. Control of hybrid electric vehicles. IEEE Control Syst. Mag. 2007, 27, 60–70. [Google Scholar]
  29. Wang, R.; Lukic, S.M. Dynamic programming technique in hybrid electric vehicle optimization. In Proceedings of the 2012 IEEE International Electric Vehicle Conference, Greenville, SC, USA, 4–8 March 2012; pp. 1–8. [Google Scholar]
  30. Cook, J.A.; Sun, J.; Buckland, J.H.; Kolmanovsky, I.V.; Peng, H.; Grizzle, J.W. Automotive powertrain control—A survey. Asian J. Control 2006, 8, 237–260. [Google Scholar] [CrossRef] [Green Version]
  31. Kim, K.; Kim, S.; Kim, M. Experimental studies on the heating performance of the PTC heater and heat pump combined system in fuel cells and electric vehicles. Int. J. Autom. Technol. 2012, 13, 971–977. [Google Scholar] [CrossRef]
  32. Jeffs, J.; McGordon, A.; Picarelli, A.; Robinson, S.; Widanage, W.D. System level heat pump model for investigations into thermal management of electric vehicles at low temperatures. In Proceedings of the 13th International Modelica Conference, Regensburg, Germany, 4–6 March 2019; Linköping University Electronic Press: Regensburg, Germany, 2019. Number 157. [Google Scholar]
  33. Tripathy, Y.; McGordon, A.; Low, C. A New Consideration for Validating Battery Performance at Low Ambient Temperatures. Energies 2018, 11, 2439. [Google Scholar] [CrossRef] [Green Version]
  34. Jaguemont, J.; Boulon, L.; Dubé, Y. Characterization and Modeling of a Hybrid-Electric-Vehicle Lithium-Ion Battery Pack at Low Temperatures. IEEE Trans. Veh. Technol. 2016, 65, 1–14. [Google Scholar] [CrossRef] [Green Version]
  35. Ruan, H.; Jiang, J.; Sun, B.; Wu, N.; Shi, W.; Zhang, Y. Stepwise segmented charging technique for lithium-ion battery to induce thermal management by low-temperature internal heating. In Proceedings of the 2014 IEEE Conference and Expo Transportation Electrification Asia-Pacific (ITEC Asia-Pacific), Beijing, China, 31 August–3 September 2014; pp. 1–6. [Google Scholar]
  36. Bergman, T.L.; Incropera, F.P.; DeWitt, D.P.; Lavine, A.S. Fundamentals of Heat and Mass Transfer; John Wiley & Sons: Hoboken, NJ, USA, 2011. [Google Scholar]
  37. Tripathy, Y.; McGordon, A.; Barai, A. Improving Accessible Capacity Tracking at Low Ambient Temperatures for Range Estimation of Battery Electric Vehicles. Energies 2020, 13, 2021. [Google Scholar] [CrossRef] [Green Version]
  38. Barai, A.; Uddin, K.; Widanalage, W.; McGordon, A.; Jennings, P. The effect of average cycling current on total energy of lithium-ion batteries for electric vehicles. J. Power Sources 2016, 303, 81–85. [Google Scholar] [CrossRef]
  39. Tripathy, Y.; McGordon, A.; Marco, J.; Gama-Valdez, M. State-of-Charge estimation algorithms and their implications on cells in parallel. In Proceedings of the 2014 IEEE International Electric Vehicle Conference (IEVC), Florence, Italy, 17–19 December 2014; pp. 1–6. [Google Scholar]
  40. Picarelli, A.; Avila, V.; Robinson, S. Thermal Management Strategies for Integrated Hybrid Vehicle Subsystems. Available online: https://digital-library.theiet.org/content/conferences/10.1049/cp.2016.0975 (accessed on 12 November 2020).
  41. Suck, G.; Spengler, C. Solutions for the Thermal Management of Electrically Driven Vehicles. ATZ Worldw. 2014, 116, 4–9. [Google Scholar] [CrossRef]
  42. Ukrainczyk, N.; Kurajica, S.; Šipušić, J. Thermophysical comparison of five commercial paraffin waxes as latent heat storage materials. Chem. Biochem. Eng. Q. 2010, 24, 129–137. [Google Scholar]
  43. Taylor, R.A.; Chung, C.Y.; Morrison, K.; Hawkes, E.R. Analysis and Testing of a Portable Thermal Battery. J. Therm. Sci. Eng. Appl. 2014, 6, 031004. [Google Scholar] [CrossRef]
  44. Electric Vehicle Comparison. 2020. Available online: https://ev-database.uk/ (accessed on 10 April 2020).
  45. Green, M. Extreme Temperatures Affect Electric Vehicle Driving Range, AAA Says. Available online: http://newsroom.aaa.com/2014/03/ (accessed on 15 September 2016).
  46. Sinoquet, D.; Rousseau, G.; Milhau, Y. Design optimization and optimal control for hybrid vehicles. Optim. Eng. 2011, 12, 199–213. [Google Scholar] [CrossRef] [Green Version]
  47. Skugor, B.; Ranogajec, V.; Deur, J. On smoothing HEV/EREV supervisory control action using an extended ECMS approach. In Proceedings of the IEEE 2013 World Electric Vehicle Symposium and Exhibition (EVS27), Barcelona, Spain, 17–20 November 2013; pp. 1–10. [Google Scholar]
  48. Hofman, T.; Steinbuch, M.; Van Druten, R.; Serrarens, A. Rule-based energy management strategies for hybrid vehicles. Int. J. Electr. Hybrid Veh. 2007, 1, 71–94. [Google Scholar] [CrossRef]
  49. Shojaei, S.; McGordon, A.; Robinson, S.; Marco, J. Improving the Performance Attributes of Plug-in Hybrid Electric Vehicles in Hot Climates through Key-Off Battery Cooling. Energies 2017, 10, 2058. [Google Scholar] [CrossRef] [Green Version]
  50. Pérez, L.V.; Bossio, G.R.; Moitre, D.; García, G.O. Optimization of power management in an hybrid electric vehicle using dynamic programming. Math. Comput. Simul. 2006, 73, 244–254. [Google Scholar] [CrossRef]
  51. Suarez-Bertoa, R.; Astorga, C. Impact of cold temperature on Euro 6 passenger car emissions. Environ. Pollut. 2018, 234, 318–329. [Google Scholar] [CrossRef] [PubMed]
  52. Chen, K.H.; Bozeman, J.; Wang, M.; Ghosh, D.; Wolfe, E.; Chowdhury, S. Energy Efficiency Impact of Localized Cooling/Heating for Electric Vehicle. SAE Int. J. Passeng. Cars-Mech. Syst. 2015, 7, 2. [Google Scholar]
  53. Average January Temperatures for Cities in Europe. 2019. Available online: https://www.currentresults.com/Weather/Europe/Cities/temperature-january.php#c (accessed on 24 January 2019).
Figure 1. Schematic depiction of heat pump architecture with interactions highlighted. X(1), X(2), and U refer to the state variables and control vector of the optimisation described in Section 5.
Energies 13 05980 g001
Figure 2. The uppermost level of the heat pump, where thermal connections across the vehicle are made and controlled. In the centre is the middle layer of the heat pump, which contains the physical models of the coolant and refrigeration circuits.
Energies 13 05980 g002
Figure 3. The middle level of the model contains the coolant circuits and the refrigeration loop and is used to control coolant flow between them.
Energies 13 05980 g003
Figure 4. The coolant loop used for high temperature components, i.e., cabin and battery heating, positive thermal coefficient (PTC) input, heat battery input, and rejecting heat to ambient for air conditioning operation.
Energies 13 05980 g004
Figure 5. The chiller circuit is used for thermal exchange and extraction, i.e., extracting from the motor and inverter, the gearbox and driveline, ambient, heat battery. There is also the capability to cool the cabin and electric battery, if needed.
Energies 13 05980 g005
Figure 6. The refrigeration cycle is physically modelled. At this level, the speed of the compressor is controlled either by the demand from the heat pump controller, or a PID which stops the system pressure getting too high.
Energies 13 05980 g006
Figure 7. A flow chart showing how the compressor is controlled.
Energies 13 05980 g007
Figure 8. Electric first order resistor-capacitor (RC) model for the battery, scaled by number of cells in series using parameter nS_cells, seen in the top right.
Energies 13 05980 g008
Figure 9. Thermal model of the battery with heat exchanges between ambient through a resistor to an exterior metal plate, and to the thermal management system through heat port seen at the top of the figure.
Energies 13 05980 g009
Figure 10. Here, the cabin model is shown both how it appears in Dymola, and a reduced block representation of its architecture.
Energies 13 05980 g010
Figure 11. Battery model capacity prediction compared to results extracted from the following sources: Nagasubramanian [19], Zhang [16], Ji [20], Jaguemont [21], and Panasonic [22] (manufacturer).
Energies 13 05980 g011
Figure 12. Diagram describing the work flow required to find optimal battery heating control.
Energies 13 05980 g012
Figure 13. Simulation set up, with model generated in Dymola shown in (a) and its incorporation into the dynamic programming (DP) set up shown in (b).
Energies 13 05980 g013
Figure 14. World harmonised Light Duty Test Procedure.
Energies 13 05980 g014
Figure 15. The optimal battery heating strategies generated according to the 3 weightings designed to produce a neutral balance between the battery and cabin at 7 ° C.
Energies 13 05980 g015
Figure 16. The optimal battery heating strategies generated according to the 6 weightings designed to produce a strategy which favours the cabin or the battery at 7 ° C.
Energies 13 05980 g016
Figure 17. Battery and temperatures using baseline strategies compared to optimised heating trajectory at an ambient temperature of 7 ° C. Circle markers indicate the location in time of each decision step. The solid line represents the no heating strategy, dashed line represents the full heating strategy, and the dotted line represents the optimised heating strategy. Blue lines indicate component temperatures, while the red lines indicate the heat delivered to the battery.
Energies 13 05980 g017
Figure 18. Heat delivered to the cabin in the first 60 s of the drive cycle at 15 ° C and 0 ° C both using the full battery heating strategy.
Energies 13 05980 g018
Figure 19. Battery heating control and cabin temperature resulting from optimisation using “Cabin N” weighting.
Energies 13 05980 g019
Figure 20. Heater core temperature during forward solution (labelled Reconstructed DP) and model implementation (labelled Retested).
Energies 13 05980 g020
Table 1. Parameters relating to the vehicle model used for this research. * The thermal connection is to be dynamically controlled as a result of the research.
Vehicle ParameterValue
Vehicle typeElectric SUV
Mass2500 kg
DriveFour wheel drive
Front and rear motors
Torque350 Nm per motor
Power170 kW per motor
Battery size48 kWh
Heat pump sourcesAmbient
Motor
Thermal Storage
Cabin Exhaust
Heat pump sinksCabin
Battery *
Cabin heating request10 kW
Battery heating request10 kW *
Table 2. Parameters relating to the operation of the heat pump.
Heat Pump ParameterValue
Compressor Power2.5 kW
PTC Power4 kW
Thermal Storage maximum Power20 kW
Thermal Storage Capacity4 kWh
Heat extraction from Ambient≈1 kW
Heat extraction from Motor≈1 kW
Table 3. Effective capacity factor ( C e f f ) of the battery as a function of temperature for a 0.1 C discharge. Data provided by Tripathy et al. [39].
Battery Temperature (°C) C eff
−200.780
−100.842
00.918
251.000
Table 4. Thermal properties of paraffin 70–75 are given [42].
PropertyValue
Melting Point ( T m e l t i n g ) 75 ° C
Specific Heat (Solid)2.06 kJ kg 1 K 1
Specific Heat (Liquid)2.34 kJ kg 1 K 1
Specific Heat (Average, C p )2.2 kJ kg 1 K 1
Latent Heat ( C l )169 kJ kg 1
Mass density (solid)917 kg m 3
Mass density (Liquid)822 kg m 3
Conductivity0.21 W m 1 K 1
Table 5. Representative examples of the efficiency of real world vehicles collected from Reference [44].
VehicleEfficiency (Wh/km)
Audi e-tron244
Jaguar I-Pace228
Byton M-Byte241
Tesla Cybertruck269
Mercedes EQC222
Tesla Model X216
Table 6. Here, the efficiency, range, and comfort are demonstrated with the heat pump switched off and the PTC capacity increased to 6.5 kW, accounting for the reduction in compressor power consumption.
Ambient Temperature ( ° C)Range (km)
−15119
−5126
5133
15170
23201
Table 7. The weighting factors used when optimisation priority is either neutral, battery weighted, or cabin weighted.
Battery Priority
General PriorityNeutral
50% Energy Consumption
50% Range
Energy
75% Energy Consumption
25% Range
Range
25% Energy Consumption
75% Range
Neutral
50% Battery
50% Cabin
Neutral N
( w 1 = 1/4, w 2 = 1/4,
w 3 = 1/2)
Neutral E
( w 1 = 3/8, w 2 = 1/8,
w 3 = 1/2)
Neutral R
( w 1 = 1/8, w 2 = 3/8,
w 3 = 1/2)
Battery
66% Battery
33% Cabin
Battery N
( w 1 = 1/3, w 2 = 1/3,
w 3 = 1/3)
Battery E
( w 1 = 3/6, w 2 = 1/6,
w 3 = 1/3)
Battery R
( w 1 = 1/6, w 2 = 3/6,
w 3 = 1/3)
Cabin
33% Battery
66% Cabin
Cabin N
( w 1 = 1/6, w 2 = 1/6,
w 3 = 2/3)
Cabin E
( w 1 = 3/12, w 2 = 1/12,
w 3 = 2/3)
Cabin R
( w 1 = 1/12, w 2 = 3/12,
w 3 = 2/3)
Table 8. Vehicle metrics corresponding to solutions from sensitivity testing performed at 7 ° C. Here bold text indicates the most preferable outcome in the authors opinion.
Metrics
Weighing
Mix
Energy Consumption
(Wh/km)
Vehicle Range
(km)
Mean Cabin Temperature
(°C)
No Heating405.8111.111.2
Full Heating373.8127.19.0
Neutral N404.3117.19.7
Neutral E401.7118.09.5
Neutral R404.3117.19.7
Cabin N405.5116.59.8
Cabin E408.8112.19.9
Cabin R405.5116.59.8
Battery N402.2117.99.3
Battery E402.2117.99.3
Battery R403.2117.79.3
Table 9. Vehicle metrics corresponding to solutions from sensitivity testing performed at 15 ° C. Here bold text indicates the most preferable outcome in the authors opinion.
Metrics
Weighting
Mix
Energy Consumption
(Wh/km)
Vehicle Range
(km)
Mean Cabin Temperature
(°C)
Neutral N383.9123.82.9
Neutral E383.9123.82.9
Neutral C389.6122.03.1
Cabin N383.9123.82.9
Cabin E396.8119.63.5
Cabin C386.4123.03.1
Battery N387.8122.53.2
Battery E383.9123.82.9
Battery R389.6122.03.1
Table 10. Vehicle metrics corresponding to solutions from sensitivity testing performed at 0 ° C. Here bold text indicates the most preferable outcome in the authors opinion.
Metrics
Weighting
Mix
Energy Consumption
(Wh/km)
Vehicle Range
(km)
Mean Cabin Temperature
(°C)
Neutral N384.2123.714.4
Neutral E383.8123.814.4
Neutral C383.3124.014.4
Cabin N380.8124.814.5
Cabin E382.9123.914.7
Cabin C380.7124.814.5
Battery N389.0122.113.7
Battery E383.8123.814.4
Battery R389.1122.113.7
Table 11. Recommendation of when to heat the battery during a drive cycle under different conditions, and by how much. Here, Start, Middle, and End refer to the first, second, and third 600 s of the drive cycle; and None, Low, Medium, and High refer to the discretisation levels of U ( k ) described in Section 5.1.
Cycle Timing
PriorityTemperatureStartMiddleEnd
−15HighMediumNone
Neutral−7NoneNoneMedium
0LowNoneMedium
−15MediumNoneMedium
Comfort−7NoneNoneLow
0NoneNoneMedium
−15HighMediumNone
Battery−7NoneNoneHigh
0LowNoneMedium
Publisher’s Note: MDPI stays neutral with regard to jurisdictional claims in published maps and institutional affiliations.

