Article

Methodology for Quantifying the Energy Saving Potentials Combining Building Retrofitting, Solar Thermal Energy and Geothermal Resources

by
Silvia Soutullo
1,*,
Emanuela Giancola
1,
María Nuria Sánchez
1,
José Antonio Ferrer
1,
David García
2,
María José Súarez
2,
Jesús Ignacio Prieto
3,
Elena Antuña-Yudego
4,
Juan Luís Carús
4,
Miguel Ángel Fernández
4 and
María Romero
5
1
Department of Energy, CIEMAT, 28040 Madrid, Spain
2
Department of Energy, University of Oviedo, 33203 Gijón, Spain
3
Department of Physics, University of Oviedo, 33203 Gijón, Spain
4
Division of Information and Technology, TSK, 33203 Gijón, Spain
5
Department of Projects and R&D, GEOTER, 28703 San Sebastian de los Reyes, Spain
*
Author to whom correspondence should be addressed.
Energies 2020, 13(22), 5970; https://doi.org/10.3390/en13225970
Submission received: 9 October 2020 / Revised: 4 November 2020 / Accepted: 12 November 2020 / Published: 16 November 2020

Abstract

:
New technological, societal and legislative developments are necessary to support transitions to low-carbon energy systems. The building sector is responsible for almost 36% of the global final energy and 40% of CO2 emissions, so this sector has high potential to contribute to the expansion of positive energy districts. With this aim, a new digital Geographic Information System (GIS) platform has been developed to quantify the energy savings obtained through the implementation of refurbishment measures in residential buildings, including solar thermal collectors and geothermal technologies and assuming the postal district as the representative unit for the territory. Solar resources have been estimated from recently updated solar irradiation maps, whereas geothermal resources have been estimated from geological maps. Urbanistic data have been estimated from official cadastre databases. For representative buildings, the annual energy demand and savings are obtained and compared with reference buildings, both for heating and cooling. The GIS platform provides information on average results for each postal district, as well as estimates for buildings with particular parameters. The methodology has been applied to the Asturian region, an area of about 10,600 km2 on the Cantabrian coast of Spain, with complex orography and scattered population, qualified as a region in energy transition. High rehabilitation potentials have been achieved for buildings constructed before the implementation of the Spanish Technical Building Code of 2006, being higher for isolated houses than for collective buildings. Some examples of results are introduced in specific localities of different climatic zones.

1. Introduction

The energy transformation towards a more efficient and less polluting system represents a global problem that must be addressed by all sectors of society. National, regional and local governments must work together involving all the stakeholders, public and private. The Intergovernmental Panel on Climate Change (IPCC) highlighted in its 2018 report [1] the strong impact produced by global warming and called for urgent actions. To reduce the high contribution of energy sector on greenhouse gas emissions (two thirds of the total), the IPCC has promoted an immediate increase in renewable energy use and energy efficiency.
The goal of achieving massive decarbonisation and reducing the rise in global temperatures to well below 2 °C [2] can be achieved safely, reliably and affordably by using sustainable technologies. The analysis develops by the International Renewable Energy Agency (IRENA) [3] shows that the combination of renewable technologies, energy efficiency and increased electrification could achieve 90% of the necessary reductions in energy-related emissions.
The generation of renewable energy depends on meteorological variables such as temperature, irradiation, precipitation or wind [4], being strongly influenced by the climatic trends of the coming years. The effects of climate change will have implications on the reliability and performance of the energy system [5,6]. This can affect the lifespan of energy infrastructure [7] and other factors within the value chain of the energy sector [8,9].
Due to the rapid population growth in cities and global climate change, energy consumption in buildings has increased in recent decades [10]. Cities in developed countries are thought to be the main worldwide energy consumers and the main source of pithy greenhouse gas emissions [11]. To tackle climate change [12] and fast urbanisation, challenges, adaptation and mitigation measures are required and play an important role in the essential transformation of urban areas. Energy potential, usage and capacity at district scale have turned into important factors to understand energy flows at this scale [13]. This knowledge can help to reduce most effectively the energy consumption and greenhouse gas emissions in the building sector [14]. Different urban models, methods and tools [15] help policymakers, governors and other stakeholders in urban design and planning, and promoting nearly zero energy buildings [16], but also in the cost-effective renovation of building stock. At the district level, urban energy use [17] has gained a prominent relevance in building refurbishment, being usually addressed by centralised interventions taking building synergies into consideration [18].
Multiple Geographic Information System (GIS) studies are related to urban energy analyses. Terés-Zubiaga et al. [19] developed a GIS-based methodology to identify optimal solutions at district scale, with balanced renewable energy supply and energy efficiency measures. The energy consumption and the renewable energy potential have also been assessed by Santoli et al. [20] at municipality scale. Other authors [21] evaluated affordable and sustainable urban electricity supply systems in cities, which have also been modelled and optimized in open source GIS platforms. Building Information Modelling (BIM) and GIS can be integrated in building environments to tackle multiple aspects such as urban governance, building energy management or construction projects [22]. A study developed by Marzouk et al. on this topic assessed the infrastructure requirements associated with the water consumption, the sewage capacity and the electrical supply for expanding cities [23]. Other authors integrated GIS into urban sustainability assessment systems, helping local governments to define land-use policies [24]. Krietemeyer et al. developed an interactive platform for spatiotemporal visualization of simulated building energy consumption to support climate adaptation strategies in variable energy scenarios [25].
In addition, energy consumption of the building stock has been assessed at the urban scale, identifying homogenous energy areas [26,27]. GIS technology has been applied in combination with statistical analysis to identify the variables that influence building energy consumption [28]. In addition, the effects of urban form [29] or climate change [30] on building demands have been evaluated. Praene et al. defined accurate climate zones to evaluate the thermal performance [31]. Garcia-Ballano et al. calculated energy savings in rehabilitated buildings after the improvement of the exterior building envelope [32]. In addition, the GIS techniques have been combined with multi-criteria decision-making tools to set up plus-energy buildings [33], and machine-learning technology has been combined with GIS to evaluate retrofit potential in buildings [34]. Finally, other studies evaluated the available renewable resources in the study area. Sarmiento et al. proposed a GIS model based on the use of satellite data to determine solar irradiation resources in a specific region of Argentina [35]. The energy potential of the biomass obtained from the urban greenery maintenance has been evaluated and has been considered as a low-range renewable resource [36]. More recently, a new GIS model has been developed to face heat waves by using pavement watering for urban cooling [37].
Moreover, these techniques have been used to obtain information about the boundary conditions of the urban environment. For example, Viana-Fonts et al. developed shadow cast profiles of buildings in urban areas from cadastral cartography and LiDAR altimetric data [38]. Liang et al. developed an interactive GIS tool for sky, tree and building view factor estimation from street view photographs [39].
To summarize, according to previous studies, the flexibility of GIS tools enables the performance of a wide variety of urban analysis.
In this context, this paper presents a new geographic information system platform developed to spatially analyse relevant urban features, such as building density and type, geothermal resources and solar potential production. Furthermore, potential energy savings on the existing building stock, considering all these factors, have been calculated. This platform relies upon GIS technology, is an initial approach to urban energy analysis and contributes to the reinforcement of European energy and climate policies oriented to a fundamental transformation of the energy system. Proposed cost-effective actions improve energy efficiency, promote centralised solutions based on low-carbon energy innovations and boost technologies to mitigate global warming. An initial case study has been applied to the Principality of Asturias, a region of more than 10,000 km2 on the northern coast of Spain, with complex orography and scattered population. This region is characterized by a temperate climate based on the Köppen Geiger classification, with mild temperatures registered in both winter and summer and abundant rainfall throughout the year. There are different climate zones depending on the precipitation patterns, ranging from oceanic (Cfb) to Mediterranean oceanic (Csb). These climatic conditions lead to high heating loads and low cooling loads. These actions, in terms of reducing the carbon cycle for ongoing energy transition processes, guarantee a sustainable socio-economic development of the area, and incentivise a municipality scale approach to the implementation of renewable energies through efficient district systems.

2. Materials and Methods
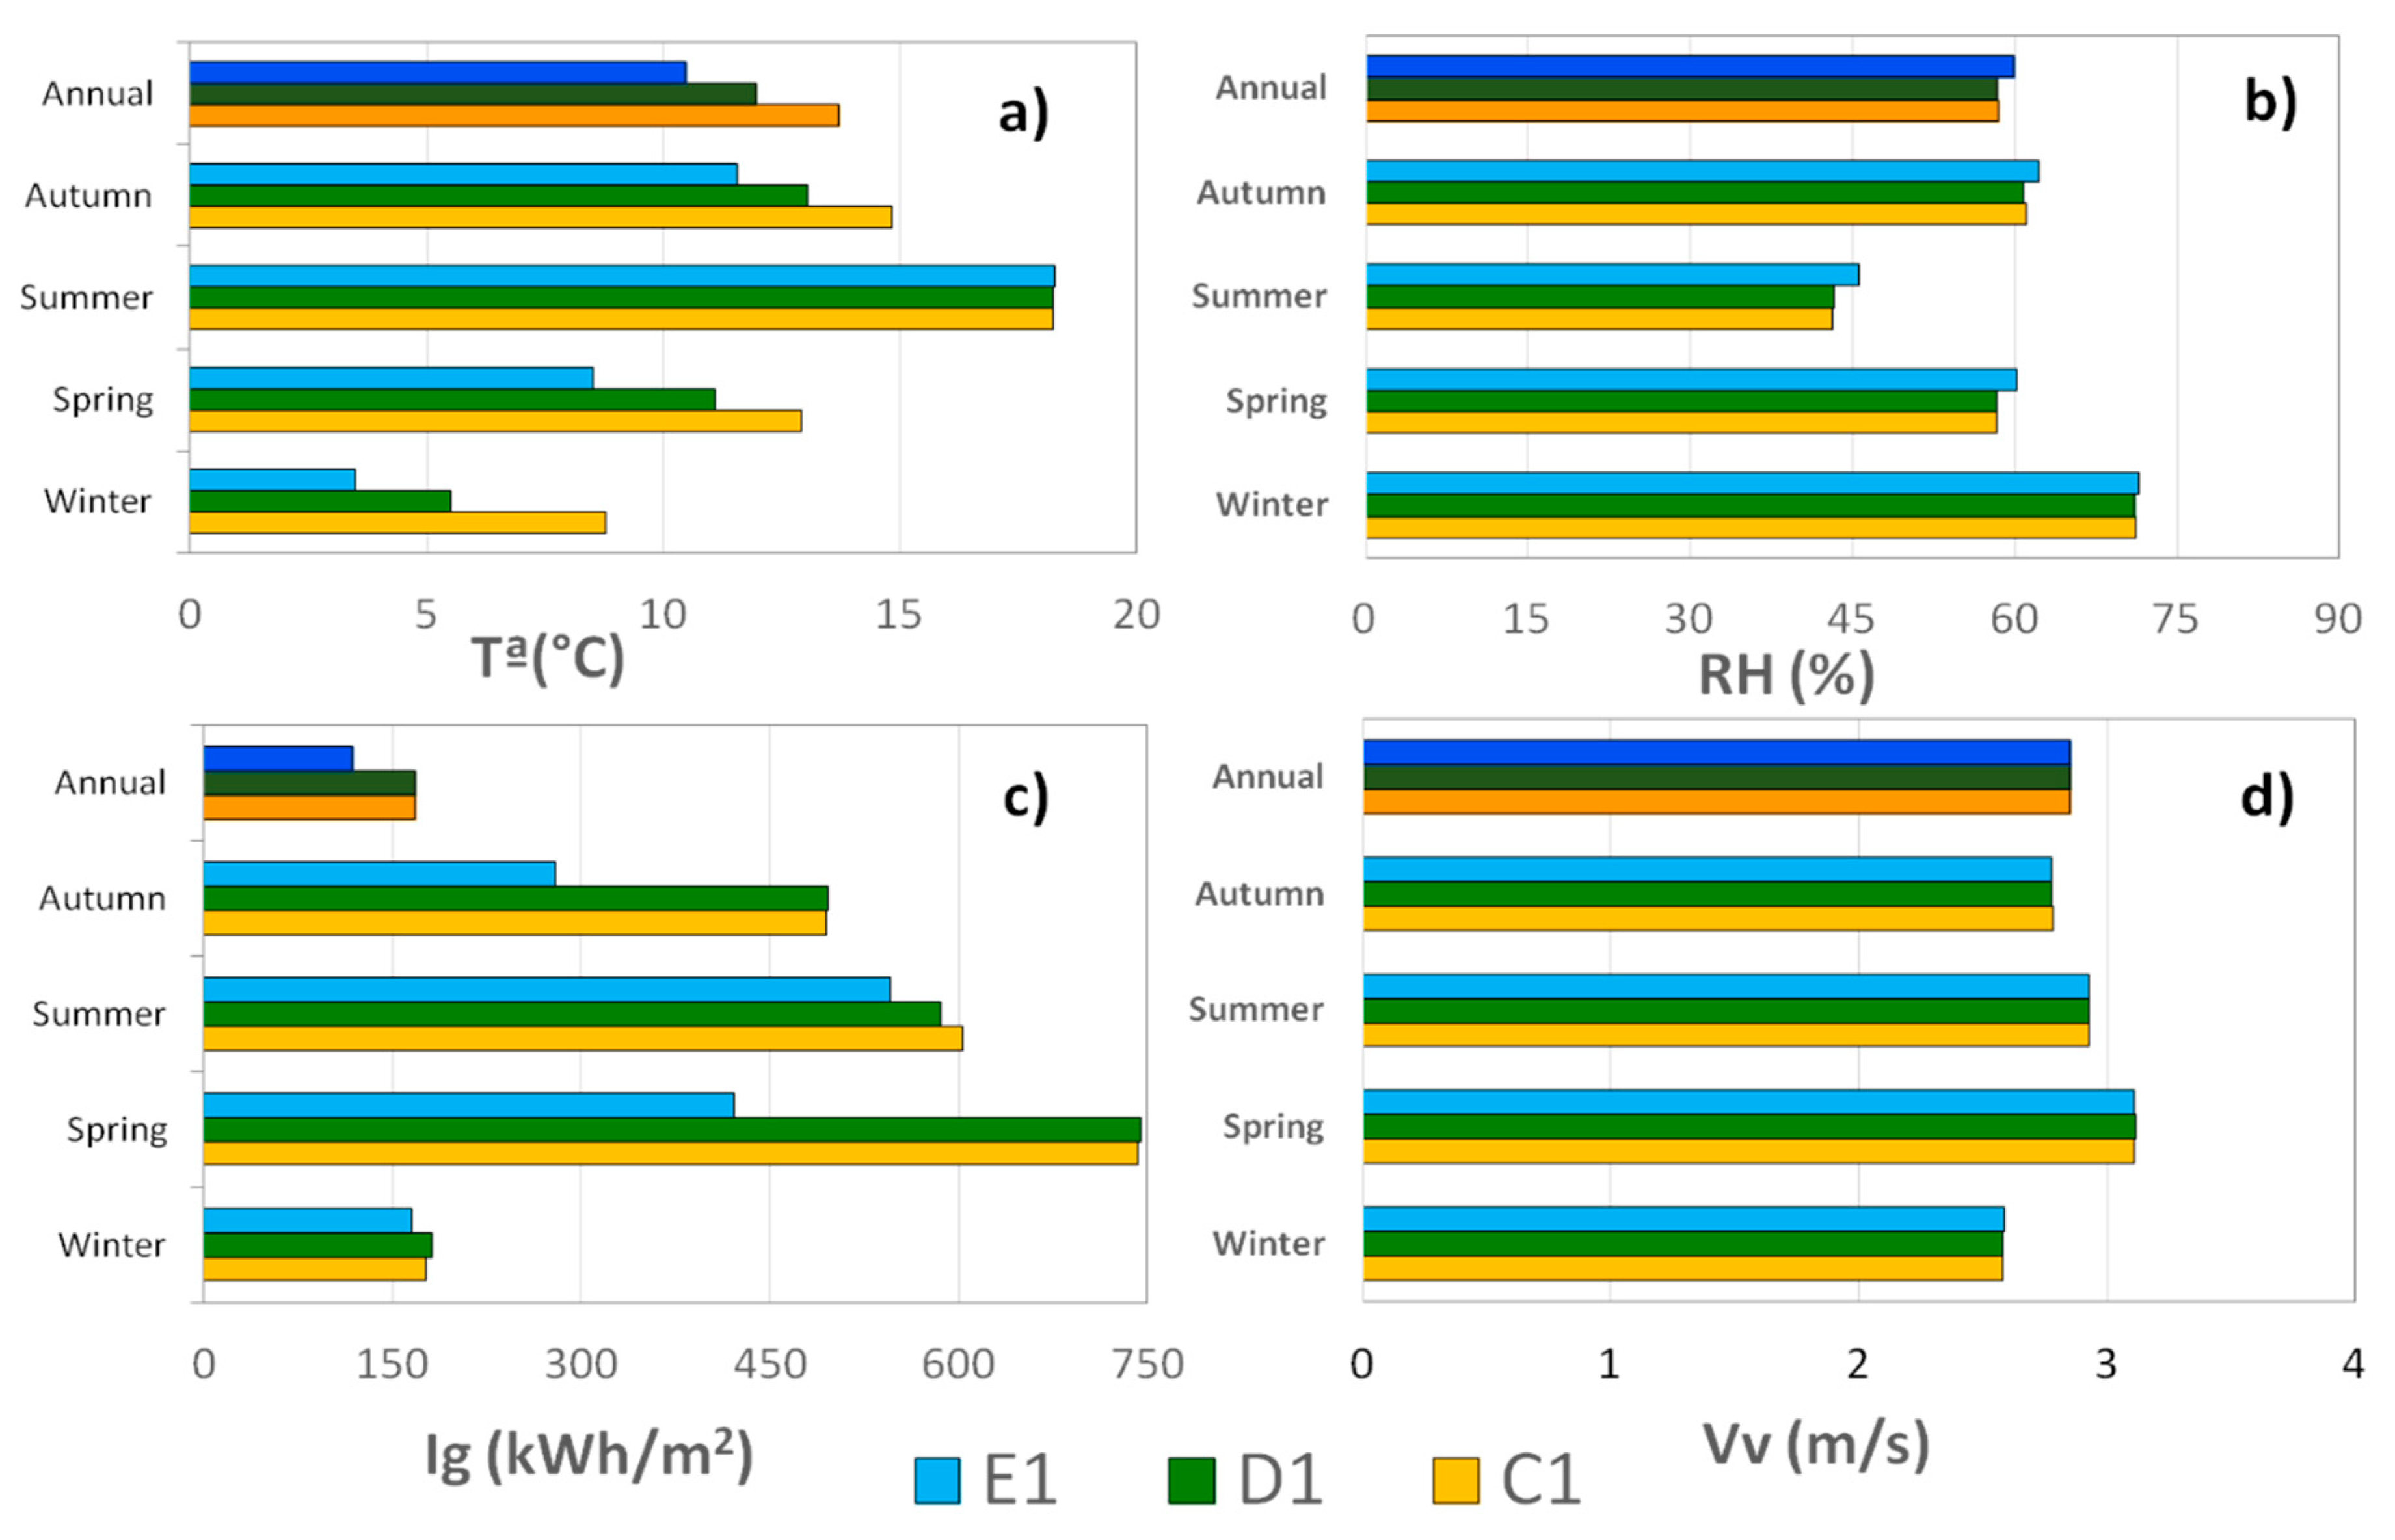
To cope with the increase in the energy consumption in buildings, several projects have been developed during recent decades with the aim of helping users, local administrations and stakeholders to make the better decisions to improve and optimize the energy efficiency of the building stock [40].
In this line, the Spanish research project RehabilitaGeoSol (RGS) [41] has developed a citizen-oriented platform (RGS platform) that suggests to the parties involved the energy savings obtained through the implementation of retrofit interventions, solar thermal panels and geothermal technologies in residential buildings.
A building expert should choose between several retrofitting actions, reconciling energy, environmental, legal and social factors to achieve a good compromise solution that meets the final needs of occupants. The search for a reasonable solution can be carried out through an energy analysis of the building and through the development of various situations predefined by a building-physics expert, mainly through simulations [42]. In addition, a second approach which incorporates decision aid techniques such as multi-criteria analysis [43], multi-objective optimization [44], generally combined with simulations to help reach a final decision [45], can be considered.
The methodology used to create the retrofit databases of the RGS project has been applied to the Principality of Asturias. Up to 800 postal districts have been analysed, showing the interest of combining building retrofitting with solar and geothermal strategies.
Annual and seasonal thermal loads for each refurbishment option proposed have been calculated in order to provide the input data to the platform. The final outputs are the energy-savings reached by the implementation of retrofit measures, solar thermal panels and geothermal technologies in residential buildings.

2.1. Solar Resource

In the case of the Asturian region, there have been solar maps available since 2009 [46], which provide monthly and annual average global solar irradiation on a horizontal surface. These maps were created using indirect estimations of irradiation from air temperatures [47] and GIS techniques, and have been recently updated taking climatic data from 2007 to 2017 into account. The spatial resolution of the original maps is 25 × 25 m, but they have been converted to postal district level using ArcGIS software for spatial integration. Figure 1 shows the variations of annual average irradiation in different postal districts. Similar maps were generated for maximum, mean and minimum values of air temperature.

2.2. Geothermal Resource
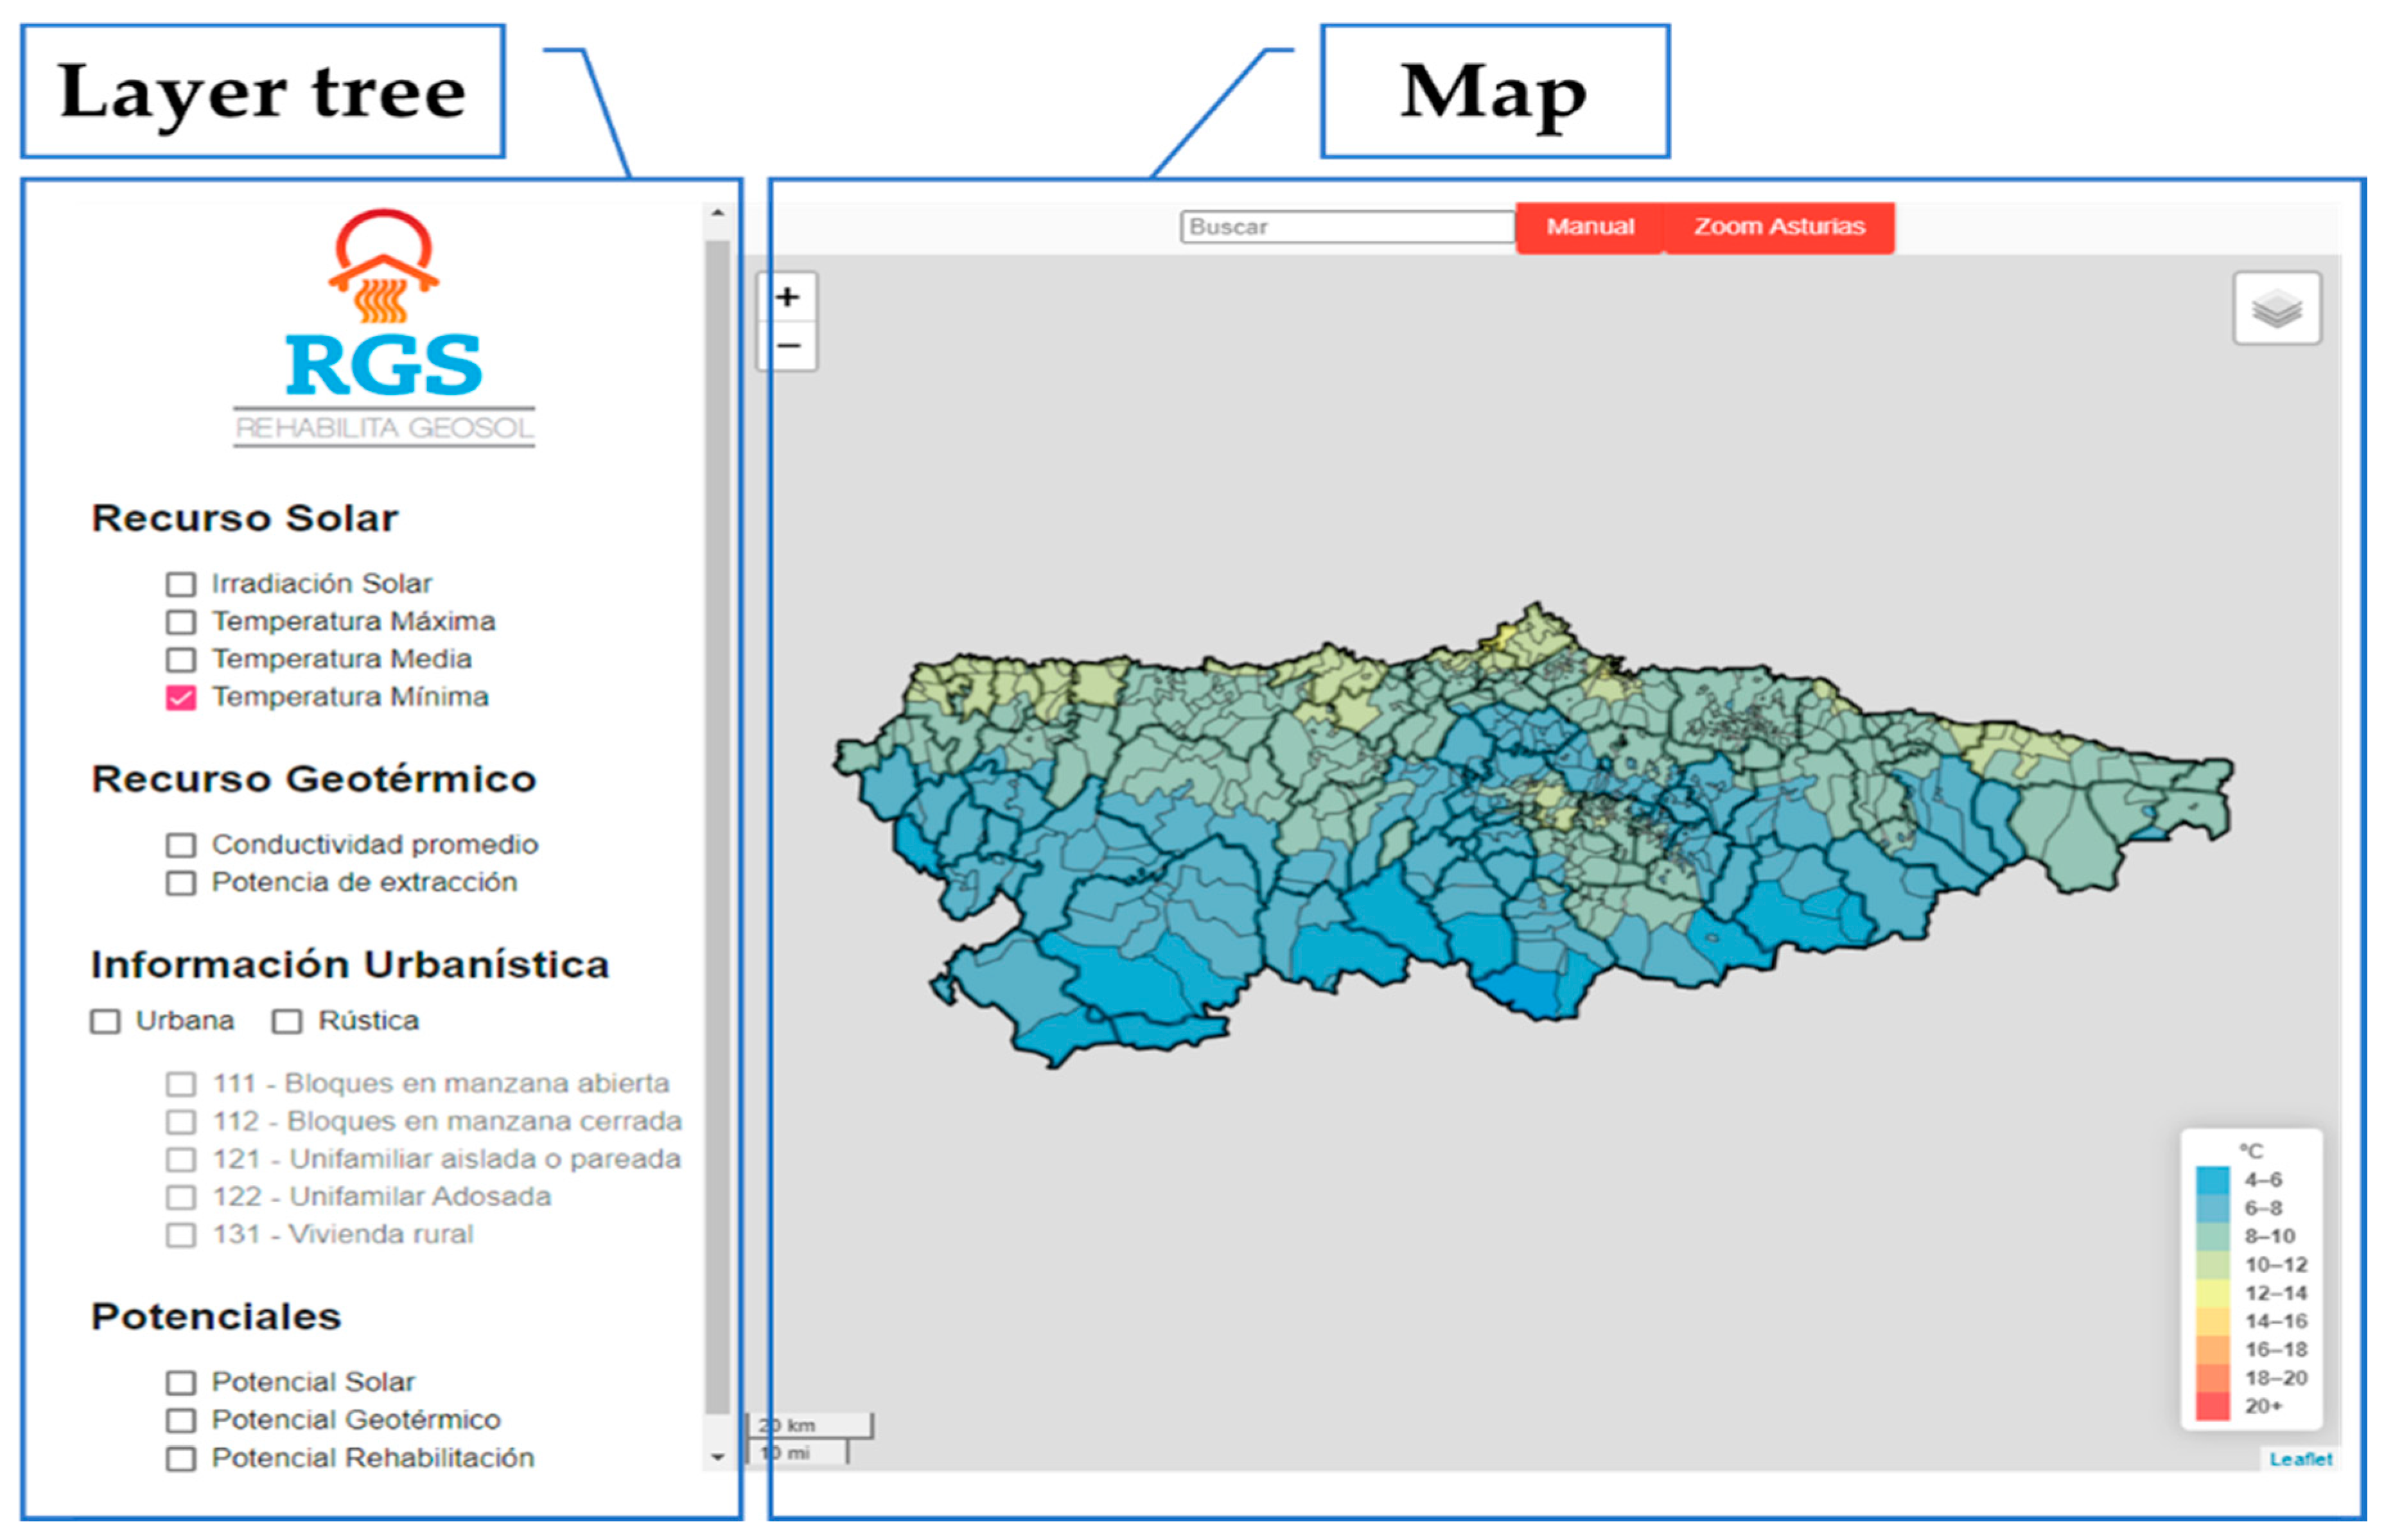
The geothermal resource is based on the National Geological Map (MAGNA), prepared by the Geological and Mining Institute of Spain (IGME) [48] between 1972 and 2003. This map consists of sheets that show geological data (geological sections, stratigraphic profiles, boreholes, etc.) with structural and hydrogeological diagrams of the national territory.
Each material is assigned some conductivity according to tabulated data by the Institute for the Diversification and Saving of Energy of Spain (IDAE) [49]. Table 1 shows some representative examples of rocks and minerals existing in the Principality of Asturias [48] and their main characteristics, among which different thermal conductivities stand out.
In addition, bibliographic data are contrasted with the Enhanced Geothermal Response Test, so that the basic properties of geothermal resources have been characterized for most materials in each postal district (Figure 2). In the north-western regions, there is a high concentration of zones with values of thermal conductivity above 3 W/(m·K). In the eastern regions, the highest concentration takes place for conductivities between 2 and 3 W/(m·K). In the lower central regions, most of the zones have thermal conductivities below 2.6 W/(m·K), while in the upper central regions, most of them oscillate between 2.2 and 3 W/m K. Despite these trends, there is a great variation in conductivities throughout the Principality of Asturias.

2.3. Urban Data

Official cadastre databases have been carefully handled and buildings in each postal district have been classified in the categories of Table 2. Notice that considered time periods correspond to different technical energy requirements for buildings in Spain, namely, the Spanish Basic Building Standard—NBE-CT-79 [50], the Spanish Technical Building Code—CTE [51], which entered into force at the end of 2007, and its amended version at the end of 2013.
Because of this classification, statistics have been obtained for each postal district, indicating the number of buildings of each category, which is the key information to evaluate the expected energy savings if retrofitting measures are applied.

2.4. Building Energy Demand

The necessary requirements to identify the most suitable refurbishment strategies to reduce the energy consumption of a building are local climates and constructive information [52]. In the first place, it is necessary to count on the availability of a representative climate data [53] of a locality. Second, it is necessary to know the characteristics of the existing building façades [54], shading devices, air ventilation [55], fenestration types and the user occupancy [56]. The study of the potential of climatic variables helps to identify the group of passive and active techniques that, when coupled, give the best result [57]. In addition to the above, the legal restrictions and the requirements of local legislation must be considered.
A dynamic simulation environment has been developed to calculate the building energy demands provided by this new digital platform [58]. This method requires an exhaustive definition of the building cases and the boundary conditions, the execution of a multi-parametric study and a pot-processing evaluation. The methodology applied is divided into three phases, as shown in Figure 3:
  • Development of building models.
  • Development of a dynamic simulation environment.
  • Post-processing evaluation and creation of building analysis modules.

2.4.1. Phase 1: Development of Building Models

The representativeness of the building stock has been selected through an input matrix that characterizes the residential building stock of the region. This information has been collected from the Spanish Technical Building Code [59], Institute for the Diversification and Saving of Energy of Spain [60], Cadastre, University of Oviedo or the Environmental Information System of the Principality of Asturias [61]. This inlet matrix is composed by the information related to the climate conditions, volume, constructive and operational characteristics.
Regarding the climate conditions, the region of Asturias is defined as temperate climate, characterized with two Köppen Geiger climatic zones: Cfb and Csb. Nevertheless, the Spanish regulation on energy savings in buildings developed a national climate classification based on seasonal severities [59]. This classification is performed as a combination of two seasonal indexes [62]: winter severity (identified by a letter) and summer severity (identified by a number). These seasonal indices are calculated as an equation that considers the influence of global solar radiation, heating degree-days and cooling degree-days [63]. Because of this climate classification, three normalized climate files are obtained for Asturias: C1, D1 and E1.
The main difference between the climate zones C1, D1 and E1 lies on the temperature and solar radiation values. The warmest zones are classified as C1 while the coldest zones are E1. Figure 4 shows the seasonal values of temperature (upper left), relative humidity (upper right), solar global radiation (lower left) and wind speed (lower right as well as the annual mean values (dark colours). Orange bars are shown for zone C1, green bars for zone D1 and blue bars for zone E1.
Monthly mean temperature ranges from 10.5 °C (zone E1) to 13.7 °C (zone C1). The highest deviations of temperature are registered in winter, being practically non-existent during the summer. Monthly mean solar global radiation ranges from 1413 kWh/m2 (zone E1) to 2007 kWh/m2 and 2017 kWh/m2 (zones D1 and C1, respectively). The highest values of solar global radiation are obtained for the climate zones C1 and D1, reaching greater deviations in spring and autumn and minimal in winter. The seasonal values of relative humidity and wind speed are quite similar for the three studied zones, with the maximum in spring and the minimum in winter. Monthly mean relative humidity ranges from 58.3% (zone D1) to 59.9% (zone E1). Finally, monthly mean wind speed ranges from 2.8 m/s (zone D1) to 2.9 m/s (zones C1 and E1).
As constructive characteristics, eight residential models that are representative of the Principality of Asturias have been selected based on the inlet dataset matrix. These models combine the type of houses with different configurations for the boundary conditions. Two types of residential houses have been modelled:
  • Single family houses: two-storey house with 100 m2 of floor area and a height between floors of 3 m (Case 1 and 2).
  • Blocks of houses: four (Case 3 and 4), seven (Case 5 and 6) and ten (Case 7 and 8) square-floor plants with 3 m height between floors.
Two configurations have been modelled to consider the boundary conditions: isolated houses (odd cases), with four façades in contact with the ambient conditions; and semi-detached houses (pair cases), with two façades in contact with the ambient conditions.
Four constructive characteristics have been defined based on the Spanish regulations: before 1979, 1979–2008, 2009–2013 and after 2014. Table 3 provides the limit values of the global heat transfer coefficients for the constructive elements of the building envelope.
Opaque elements (roof, walls, ground) and transparent elements (glass and frames) have been defined for each climate zone and each normative value. The glass elements are characterized by the heat transfer coefficient (Ulimit) and the solar heat gain coefficient (g).
In order to complete the building models, occupancy, lighting, equipment and air renovations gains are defined using the Spanish tools for the Energy Certification of Buildings as the reference database [64].
Two periods of thermal conditioning are established, summer (June–September) and winter (October–May), each one with its respective temperature set point. Two types of annual air renovation are modelled: infiltration and ventilation. The infiltration values are defined constant, depending on the type of house and the year of construction:
  • Regulations before 2008: 0.8 ren/h.
  • Regulations after 2008:
    Single-family house: 0.3 ren/h.
    Blocks of houses: 0.24 ren/h.
The ventilation rates depend on the occupation:
  • No occupancy: 0.2 ren/h.
  • Occupancy: 1.2 ren/h.

2.4.2. Phase 2: Development of a Dynamic Simulation Environment

A dynamic simulation environment has been developed to calculate the energy demands of the building cases. This environment consists on the coupling between the dynamic simulation program TRNSYS [65] and the parameterization program GenOpt [66]. The combination of these programs automates the execution of the simulation batteries; generating successive building models for each studied option. TRNSYS has been used as the engine of the simulation environment. GenOpt identifies the studied variables of the building cases and runs a series of simulations, modifying only one of them. The outputs provided by this environment are heating, cooling and annual loads and have been used to feed the building analysis tools of the online platform.
A multi-parametric analysis has been done by modifying some studied variables of the eight representative building cases.
  • Climate zones: C1, D1 and E1.
  • Year of construction: before 1979, 1979–2008, 2008–2013 and after 2014.
  • Type of window: before 1979, 1979–2008, 2008–2013 and after 2014.
  • Number of plants for blocks: 4, 7 and 10.
  • Surface area for blocks: 200, 400 and 800 m2.
  • Percentage of shading received on windows for the main façades during summer: 0, 25, 50, 75 and 100%.

2.4.3. Phase 3: Post-Processing and Creation of the Building Analysis Matrices

A post-processing evaluation of the output variables provided by the simulation batteries has been done with the program Matlab to create the databases that feed the online building modules. Heating, cooling and annual loads have been assessed to calculate the retrofitting potentials reached by each building configuration. These potentials are calculated with respect to the minimum value of the annual thermal demand, which corresponds to the normative values after 2014.
Two different analysis building modules have been developed. The first module provides the maximum retrofitting potential reached in each postal district of the Principality of Asturias. The second module provides a customized retrofitting potential for each building configuration defined by the user. Once the two databases have been created, they are represented in the GIS-based web application viewer through the Rehabilitation Potential tabs.

2.5. Solar Savings

The expected energy savings caused by a domestic solar water heating (SWH) system have been estimated by means of the f-Chart method [67], considering that each single house or flat is provided with a 2 m2 flat solar collector tilted 25° towards the South. The behaviour of the collector has been modelled assuming a typical performance in accordance with the following characteristic line:
η = 0.78 4 T e T a m b I g ,
where η is the collector efficiency, T e is the fluid temperature at the inlet of the collector, T a m b is the ambient temperature and I g is the global solar irradiance on the collector surface.
To calculate the demand in each home, a daily consumption of 120 L of domestic hot water at 60 °C has been considered.
The cold water temperature of the supply network is corrected for each postal district based on the altitude difference with the province capital, as proposed by the Spanish Technical Building Code:
T r = T r C 0.005 ( A A C ) ,
where T r is the water temperature in the supply network of the postal district, T r C is the water temperature in the supply network of the province capital, A is the average altitude of the postal district and A C is the altitude of the province capital.
For the climatic variables, the annual average values of irradiation and air temperatures in the postal district have been used. The annual averages of irradiation on inclined collectors are calculated from the values on a horizontal surface using the following approximation, which is justified by series of measurements at the Oviedo- State Meteorological Agency of Spain (AEMET) meteorological station:
G ( 0 , 25 ° ) 1.2 G ( 0 ) .
where G ( 0 , 25 ° ) is the global solar irradiation on a surface tilted 25° towards the South, and G ( 0 ) is the value on a horizontal surface.
The mass flow rate of 0.028 kg/s is assumed for the fluid circulating through the collector, while the installation is completed with an accumulator with a capacity of 150 litres and an internal heat exchanger with an efficiency of 90%.

2.6. Geothermal Savings

The geological data under Section 2.1 are used to estimate the savings derived from the geothermal resource, for a 100 m2 rehabilitated single-family building, based on the building typologies and the following input variables:
  • Building construction year.
  • Floor surface area.
  • Current fuel.
  • Age of the current heating equipment.
The length of the required geothermal ground-heat exchanger is calculated as a previous step to perform a study of energy savings, CO2 emissions and economic advantages compared to the current heating system, by means of the Equation (4) [49]:
L = Q · COP 1 COP · ( R P + R S · F ) T L T M I N
where L is the length of the vertical exchanger, Q is the heating power of the building, COP is the equipment efficiency (Coefficient Of Performance), RP is the thermal resistance per unit length of the buried exchanger pipe, RS is the thermal resistance per unit length of the ground, F is the utilization factor, TL is the ground temperature and TMIN is the minimum temperature.
The energy demand per surface unit of each building has been calculated keeping in mind the envelope thermal characteristics and the building typology, supported by data from the project itself. The proposed system, based on heat pump technology, is powered by geothermal energy and auxiliary electrical energy. Assuming a typical heat pump COP of 4.9, necessary electrical energy and free geothermal energy obtained from the subsoil are calculated for each building.
Geothermal systems are compared with conventional natural gas or gas oil systems in terms of CO2 emissions. It takes the different performances into account according to the age of the current heating equipment and CO2 emissions factors [68] (Table 4). For the final emissions calculation, these factors are multiplied by the energy consumed.
The geothermal system is also compared in terms of energy costs. It considers the average cost in EUR per kWh of electricity [69], gas oil [70] and natural gas [69], which is also multiplied by the energy consumed (Table 4).
In this way, the results of energy, emissions and cost savings are achieved for different buildings under input parameters.

3. Results

A digital platform has been developed to collect all the results obtained in relation to the different energy resources studied as well as to the multi-parametric analysis of the energy performance of buildings. The main purpose of this platform is to provide end-users with the results of the energy savings assembled potential according to the interaction of the different technologies and available energy resources. This platform has been built upon GIS technologies and it is composed of two core modules which have been designed taking user-friendly requirements and an interactive visualization into account. The first module is the viewer, which is intended to provide information about the maximum potential of the energy savings achieved for building renovation in the Principality of Asturias. On the other hand, the second module of the platform makes it possible to obtain a rehabilitation potential for each customized building model evaluated. In this module, users can modify the input building conditions, adjusting them to their particular characteristics. The input variables that can be modified in a personalized way are: local climate zone, type of building, year of construction, number of floors, floor area, type of windows and percentage of summer shading on the north, south, east and west façade individually. The outputs values provided by this second module are the percentage of annual heating, cooling and total retrofitting potentials.
Figure 5 shows the main screen of the viewer module that is seen when entering the platform. Two different spaces can be visualized: a map on the right side and a space reserved for a Layer Tree on the left one. The information is shown depicted on a map of the Principality of Asturias, which is divided into postal districts. To plot the information, an enabling/disabling system is used, which can be found in the Layer Tree. When any of these layers is enabled, the associated information is depicted according to a colour scale, affecting every single postal district separately. Additional information can be obtained when the cursor is hovered over each of them.
Within the different subsets of information layers belonging to the Layer Tree, a specific group called “Potentials” can be found. The different layers that make the aforementioned group provide access to the second module of the platform, the case study simulation module. This module can be accessed in the same way as the additional information pop-ups that appear in the viewer when hovering the cursor over each postal code. Once inside, there is a series of drop-down menus that allow the selection of discrete values for the definition of the specific case to be simulated. The outputs of each simulation are displayed to the user by means of numerical results or graphical representations after the selection of the relevant data.
The technologies employed in the development of the platform are open-source libraries like Leaflet, Angular and Highcharts. For the time being, the platform is only available in Spanish.

3.1. Solar Thermal Potential

Potential savings in domestic SWH consumption have been computed according to Section 2.5 for every postal district and represented in Figure 6. Under the assumed conditions, solar savings over 30%, which is the minimum required by the Spanish regulation for a single family house, are observed for most of the region. The software also provides the possibility of varying the number and type of collectors, as well as considering factors of loss due to orientation, tilt and shading.
Although the climatic variation within Asturias is covered with the three climatic zones, C1, D1 and E1, the new platform allows the evaluation of the general performance of solar installations, showing relevant differences in the same climatic zone. Table 5 shows the potential energy savings during a year, the annual mean efficiency of the installation for different postal districts and the yearly CO2 savings, assuming a gas boiler as auxiliary energy source.
It is observed that the annual efficiency is almost constant in all climatic zones studied, while the energy savings can have great variation, particularly in zones C1 and D1. In the case of zone C1, the solar energy savings vary from 29.6% in Coaña 33710 to 51.3% in Soto del Barco 33125. A similar scenario is obtained for the D1 climatic zone, where the solar savings range from 26.8% in Coaña 33716 to 57.4% in Cudillero 33156, which are also the minimum and maximum in all the analysed area. Similar results can be observed in other cases.

3.2. Geothermal Potential

The digital platform allows the calculation of the geothermal potential for each building, mainly based on the building location and the thermal conductivity of the soil. Additional input parameters for each case are: year of construction, surface area, current fuel and age of the boiler. Based on these variables, the tool determines the power extraction rate, the necessary length of the geothermal exchanger and the economic and environmental savings that the geothermal system would have in comparison to a conventional energy system.

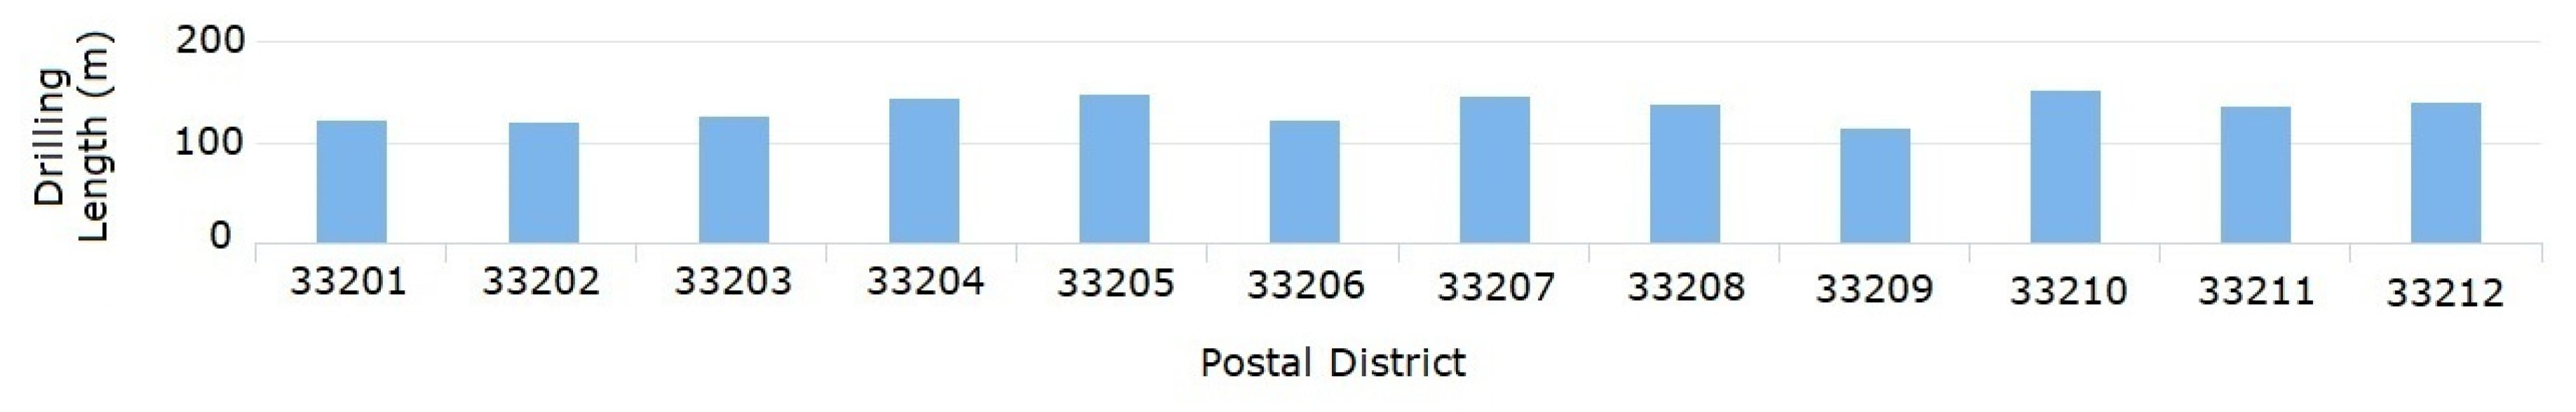
3.2.1. Geothermal Exchanger Length Depending on the Thermal Conductivity and Year of Construction

It is considered that the total heating demand is covered by geothermal heat pump. Based on this, the necessary drilling length is calculated in each case. The data of thermal conductivity in different regions are essential in order to know the drilling depth needed. There is a great impact of conductivity in these drilling meters needed to meet the energy requirements. Carrying out optimal sizing of the geothermal exchanger is essential, because geothermal drilling costs represent a high percentage of the initial investment.
As an example of the high influence of thermal conductivity on the length of the geothermal exchanger, a comparison of the same type of building is made in three locations: Gijón, Oviedo and Cangas del Narcea [48]. The type of building chosen is 100 m2 and year of construction 1980–2008. The different lengths of exchanger are shown in the following figures for the locations of Gijón (Figure 7), Oviedo (Figure 8) and Cangas del Narcea (Figure 9), respectively.
Keeping all other variables equal, in the postal district 33817 in Cangas del Narcea (Figure 9), 103 drilling meters are needed while in the postal district 33815, 140 m are needed. As both postal districts are in the same location, there is an increase of 35.92% affecting the cost of geothermal drilling. The larger the floor area, the more substantial the differences will be in the same locations.
The year of construction also affects geothermal sizing, as the building demand is different. In a building with a 100 m2 floor plant placed in the postal district 33191 of Oviedo (Figure 8), other parameters being equal, 140 drilling meters are needed in the year of construction 1800–1979 whereas in the year of construction 2014–2016 only 97 m are needed. It is clear that building regulations have made it possible to reduce the rates of thermal demand. In this case, this is 44.33% more favourable, which undoubtedly has an impact on investment in the geothermal system.

3.2.2. Energy and CO2 Emission Analysis

The heat pump is sized from the input data to cover all the heating building demands. It works throughout the year and the temperature of soil remains constant regardless of the outside conditions. The energy savings produced after replacing the current conventional heating system [58,59,60] by the geothermal heat pump system are analysed for the three previous locations. Three cases with different input values have been analysed:
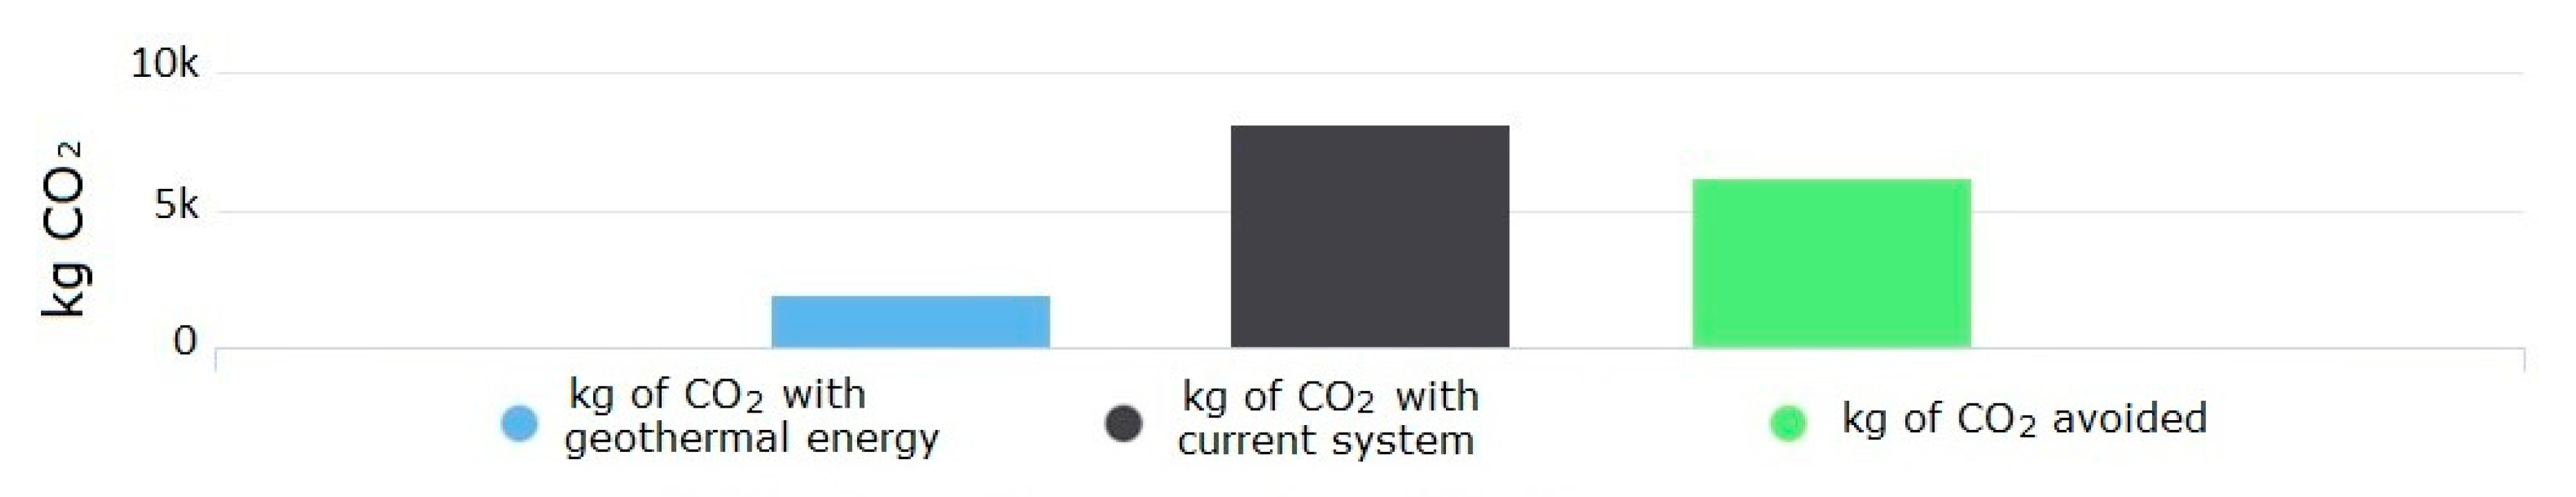
  • Case 1 (Figure 10): 100 m2 building in Gijón (postal district 33697) constructed between 2009 and 2013, replacing a gas boiler with less than 15 years old. The geothermal system provides the total thermal energy required. In this case, it is a total of 29,334 kWh, of which 5987 kWh of electricity are consumed by the heat pump and 23,351 thermal kWh are obtained from the land, thus being free (79.59% of the total energy). The current gas boiler emits 8215 kg of CO2 annually, while the proposed geothermal system would emit 1980 kg of CO2. This represents an environmental saving of 6230 kg of CO2.
  • Case 2 (Figure 11): 200 m2 building in Oviedo (postal district 33191) built between 1980 and 2008, replacing a gas boiler that is less than 15 years old. In this case, 36,079 thermal kWh are obtained free of charge from the land, which represents an economic saving of about EUR 1446. There are environmental savings of 9630 kg of CO2 annually.
  • Case 3 (Figure 12): 400 m2 building in Cangas del Narcea (postal district 33815) built between 1800 and 1979, replacing a gas oil boiler that is more than 15 years old. Due to the age of the building and the larger floor area, the savings are higher than in cases 1 and 2. A total of 111,788 kWh are obtained free of charge per year and 47,990 kg of CO2 are saved annually compared to the conventional system.
The implementation of the geothermal system in cases 1 and 2 would avoid the emission of about 75% of CO2 emissions, while in case 3 it is almost 84%. These data make the geothermal heating system a renewable system with special environmental interest, more accentuated in large and old buildings. In economic terms, cases 1 and 2 mean a saving of between EUR 1000 and 1500. In the case of buildings with old systems and high energy consumption, there are greater savings. In the case 3, there is about EUR 12,000 in annual savings compared to the previous gas oil system. Profitability analysis can be carried out, comparing drilling and heat pump systems versus the conventional system. In this case, with a 12 kW heat pump, it is estimated that the return on investment period is 6–7 years with an Internal Rate of Return (IRR) of around 17–18%. From an economic point of view, geothermal energy provides greater profitability than solar thermal energy, because the energy demand for SWH applications is relatively low in residential buildings, even meeting the requirements of regulations to reduce energy consumption and CO2 emissions.

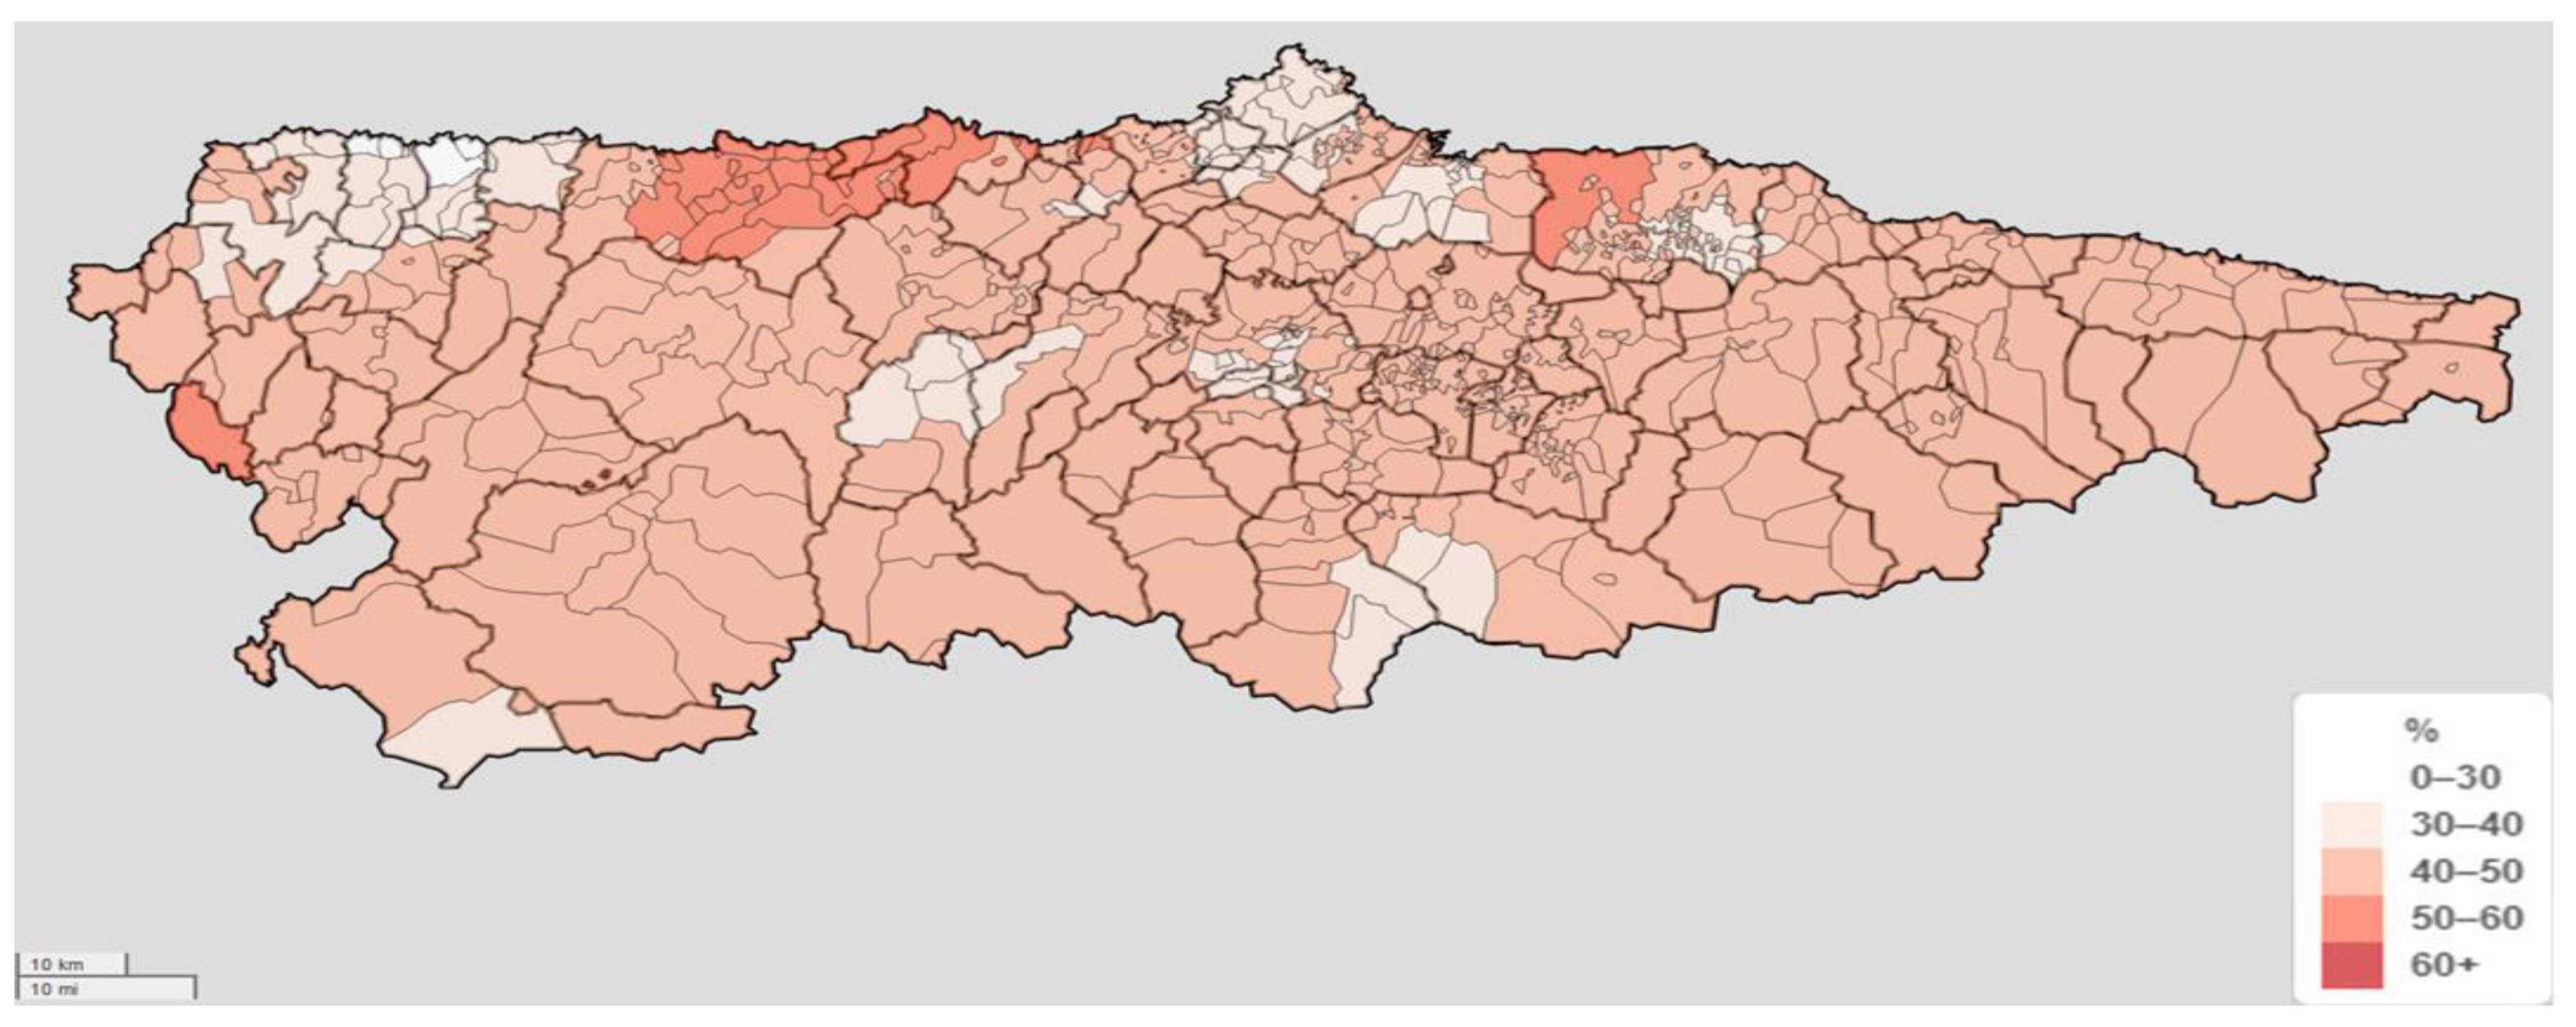
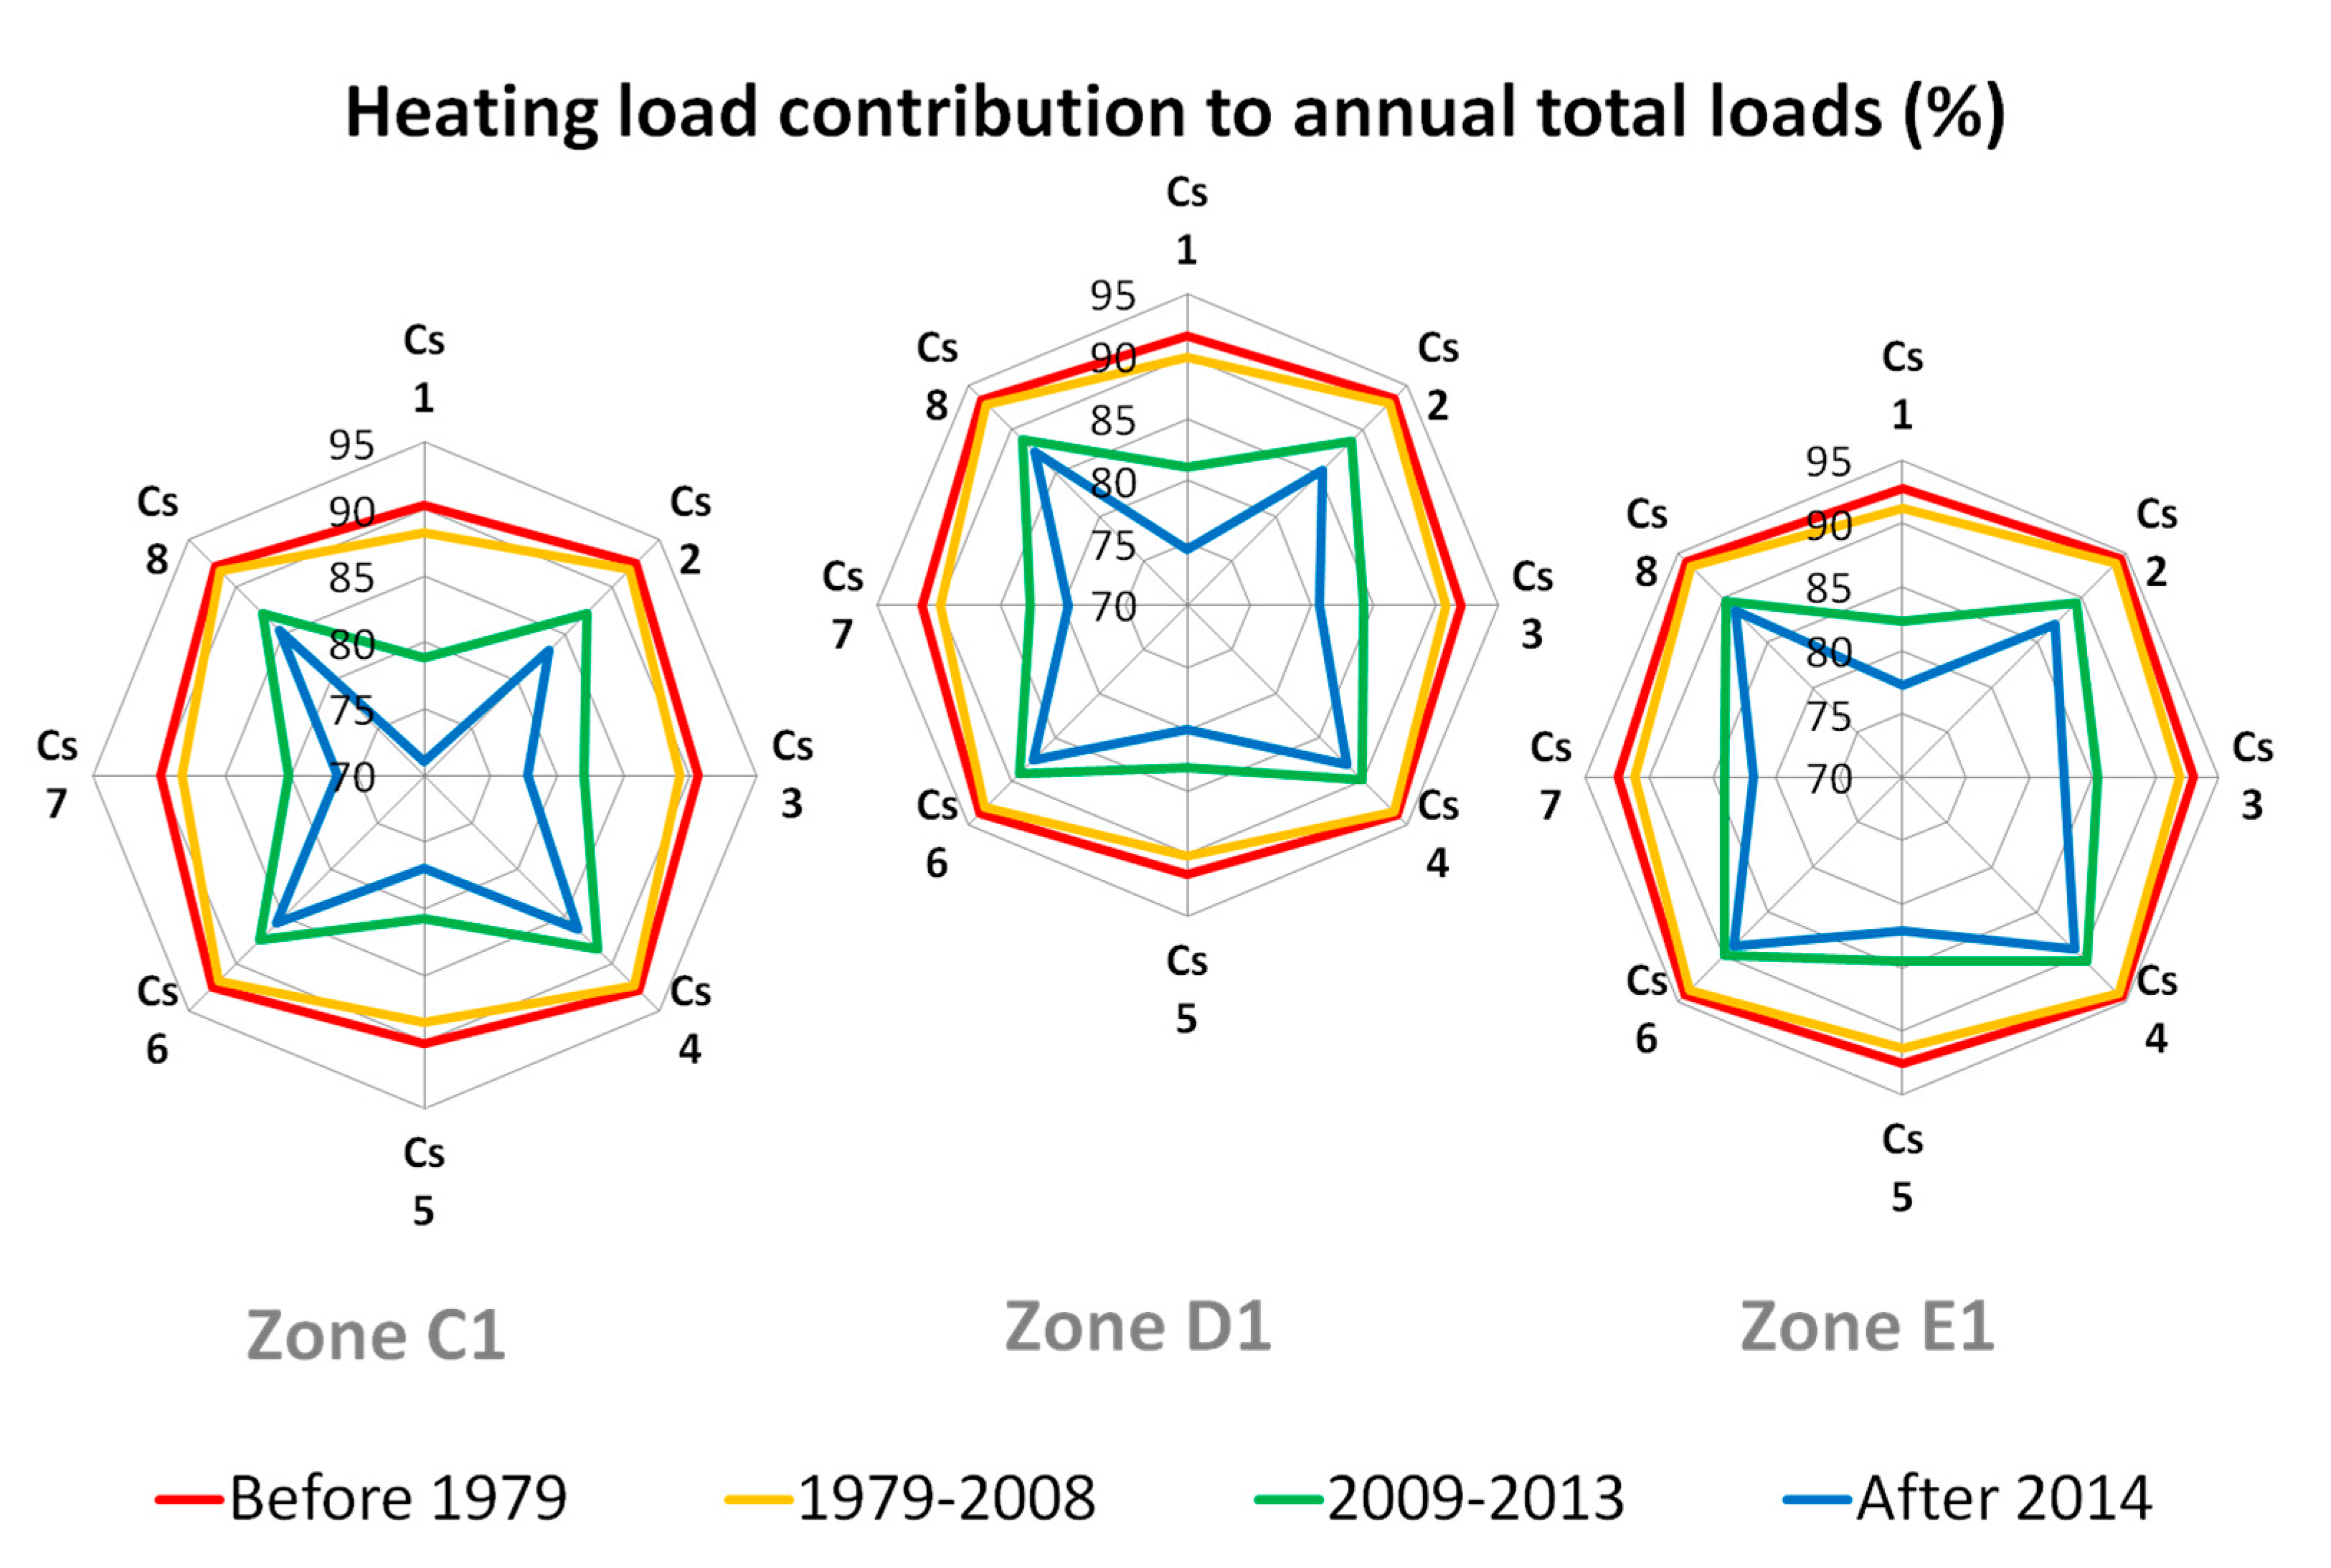
3.3. Retrofitting Potential

The mild climatic conditions registered in all regions of the Principality of Asturias have led to high percentages of heating demands in comparison with the cooling demands throughout the year. The annual heat contribution ranges, both for single-family houses and for blocks, between 71 and 93% for isolated configurations and between 83 and 95% for semi-detached configurations. The range of variability is due to climate conditions and the year of construction of the building. Figure 13 shows the heating load contribution to the annual total loads reached by the eight representative building cases (Cs1–Cs8) for the climate zones C1, D1 and E1 and for the four Spanish construction regulations. In this figure, the floor area considered for blocks is 400 m2.
The heating load contributions are higher for normative regulations before 2008 and lower for normative regulations after 2008, with different percentages depending on the climate zone.
  • For Spanish construction regulations before 2008 (red and orange lines):
    Zone C1: 88 to 93%.
    Zone D1: 90 to 94%.
    Zone E1: 91 to 95%.
  • For Spanish construction regulations after 2008 (green and blue lines):
    Zone C1: 71 to 88%.
    Zone D1: 74 to 90%.
    Zone E1: 77 to 91%.
These percentages are obtained for single-family houses with 100 m2 of floor area and blocks with 400 m2 of floor area. In the case of blocks, the heating contributions to the annual thermal loads with floor areas of 200 m2 are slightly lower while the heating contributions are slightly higher for floor areas of 800 m2.
Two retrofitting potentials have been calculated superimposing the statistical study of the building stock of Asturias with the building thermal loads obtained by the simulation models. Module 1 represents the maximum retrofitting potential achieved in each studied zone of Asturias while module 2 represents the potential achieved by a specific building defined by the user.

3.3.1. Module 1: Maximum Retrofitting Potential

Module 1 represents the maximum retrofitting potential achieved in all the regions of the Principality of Asturias (Figure 14). These potentials, obtained with respect to the normative requirements after 2014, depend on climate conditions and the year of construction of the building. Analysing all the regions, the highest retrofitting potentials are reached in the western area of Asturias. This is due to the high percentage of single-family houses constructed before 2008, giving rise to buildings with poor energy requirements.
With regard to the building typology, higher retrofitting percentages are achieved in single-family houses in comparison with blocks. Isolated configurations obtained higher energy potentials than semi-detached houses. There is a huge number of residential houses constructed with old construction regulations (before 2008), reaching the highest percentages of retrofitting potential.
For isolated configurations, the highest energy savings are obtained for C1 climate conditions while the lowest potentials are obtained for E1 climate conditions. For semi-detached configurations and normative requirements before 2008, the three studied climate zones reach similar energy saving potentials. For semi-detached configurations and normative requirements after 2008, the highest potentials are reached for zones C1 while the lowest potentials are reached for zones E1.

3.3.2. Module 2: Customize Retrofitting Potential

Module 2 supplies an estimation of customized retrofitting potentials based on the inlet variables defined by users. The use of module 2 has a great potential to quantify the energy savings achieved with the refurbishment of customized residential houses in specific regions. These potentials are obtained with respect to the minimal case that corresponds to one of the representative buildings modelled with the normative requirements after 2014.
As an example of use, 48 cases have been calculated for three municipalities of the Principality of Asturias (one for each climate zone): Gijon (zone C1), Oviedo (zone D1) and Cangas del Narcea (zone E1), as can be seen in Figure 15. Total annual retrofitting potentials are obtained for each location using module 2.
The 48 cases analyzed in the three selected cities are summarized in Table 6 and cover:
  • Two types of residential house: single-family and four-storey block. These typologies are the most usual in these regions.
  • Two configurations for the boundary conditions: isolated and semi-detached.
  • Four Spanish regulations to fix the construction requirements: before 1979, 1979–2008, 2009–2013 and after 2014.
  • Three percentages of summer shadings over the main façades: 100, 50 and 0%. These percentages vary at the same time in all the façades.
The retrofitting potentials obtained for the 48 cases proposed in Gijon, Oviedo and Cangas del Narcea are shown in Figure 16, Figure 17 and Figure 18, respectively. The x-axis represents the retrofitting potential while the y-axis represents the four Spanish regulations and the three summer shadings. For each construction regulation, there are a group of three summer shadings over the windows: 100% (S 100%) 50% (S 50%) and 0% (S 0%). To calculate the potential savings reached for each studied option, the constructive regulation defined after 2014 for buildings with summer shading factor of 100% over the external façades has been selected as a reference case. For this reason, all the cases 10 give a null value of retrofitting potential.
For isolated configurations, the deviation between the climate zones is very similar, being slightly higher when comparing Gijon and Oviedo. For semi-detached configurations, two tendencies have been obtained. If the construction requirements are softer (regulations before 2008), higher deviations are reached when comparing Oviedo and Cangas del Narcea. If the building energy requirements are stricter (regulations after 2008), slightly higher deviations are obtained when comparing Gijon and Oviedo.
As it can be seen in these figures, the annual retrofitting potentials reached in the three municipalities are quite similar.
In these three cities, the highest retrofitting potentials are achieved when there is no summer shading over the windows of the external façades, decreasing as the percentage of shading increases.
Higher retrofitting potentials are obtained for single-family houses in comparison with four-storey blocks, especially when the construction requirements are softer (before 2008). In both types of houses, higher potentials are achieved for isolated configurations, being more remarkable for construction regulations before 2008.

4. Discussion and Conclusions

One of the results obtained in the RehabilitaGeoSol project is the creation of a GIS platform developed to quantify the energy-savings obtained through the implementation of retrofit measures, solar thermal panels and geothermal technologies in residential buildings placed in the Principality of Asturias. This platform is composed of two different modules. Module 1 calculates, for each district of Asturias, the maximum energy-saving potential. Module 2 makes it possible to obtain a personalized potential based on the input characteristic of the platform.
The new developed GIS platform based on the interaction of different technologies and available resources is a step forward in the field of built environment towards smart energy communities, supporting the low carbon energy transition. The obtained results point to great energy mitigation potential, justifying the need for public authorities to develop policies aimed at reducing the energy demand of buildings, especially the heating loads. The generated maps could be helpful for retrofitting considerations for existing housing stock in the Principality of Asturias, a key action that is completed in combination with the use of solar thermal energy and geothermal resources towards sustainable development. These policies are aligned with current construction trends of reducing the energy use during the lifecycle of buildings and the promotion of the low carbon circular economy. Not only environmental but also economical reasons promote building retrofitting vs. demolition and new construction [71].
These building adaptation practices will also help address climate change, optimal use of energy resources, greenhouse emissions and secure energy supply in the coming years, by gradually implementing Net Zero Energy Buildings and Positive Energy Districts.
The RGS platform results show the high retrofitting potential for the oldest Spanish regulations (before 2006). Eight building models (Case 1–Case 8) have been developed with the dynamic simulation program TRNSYS to characterize the energy performance of residential buildings for three climatic zones (C1, D1, and E1), four Spanish construction regulations and different percentages of summer shading on the windows. The potential is higher in houses than in blocks, being more remarkable in single or isolated building configurations. In the case of blocks, the retrofitting potential is higher for four-storey plants in comparison with seven and ten-storey plans. If the surface area of blocks is higher, the energy-savings obtained are lower. The highest energy-saving potential is reached in warmer climates (zones C1), while the lowest is reached in colder zones (zones E1). Analysing the influence of external shadings on facades, this platform obtains higher impact on buildings constructed according to stricter regulations and in single-family structures vs. blocks. Regarding climate impact, the annual thermal load increases in colder climates due to the higher heating requirements. On the contrary, the impact of shading is greater in warmer climates where the cooling demands are higher.
Local authorities and other stakeholders have to consider the retrofit potential as well as the solar and geothermal resources to establish the priority areas of intervention. The expected energy savings caused by the solar domestic hot water system have been computed by means of the f-chart method assuming that each single house or flat is provided with a 2 m2 flat solar collector tilted 25° towards the South. Results show that almost all the territory has solar savings over 30%, which is the minimum required by the Spanish regulations for a single-family house. The new tool allows evaluation of the general performance of solar installations, showing relevant differences in the same climate zone. The annual efficiency is almost constant in all climate zones studied; the energy savings show great variation, particularly in zones C1 and D1. In the case of zone C1, the solar energy savings vary from 29.6% to 51.3%. A similar scenario is obtained for the D1 climate zone, where the solar savings range from 26.8% to 57.4%. South-West postal districts of the Principality of Asturias present high values of the annual average of daily global solar irradiation on horizontal surfaces as well as high retrofitting potential. However, the highest values of thermal conductivity are located in north-west and east postal districts. These geological data obtained are used to calculate the length of the required geothermal ground-heat exchanger. Energy demand per surface of each building has been calculated considering the thermal envelope characteristics and the building typology. The proposed system, based on heat pump technology, is powered by geothermal energy and an input of electrical energy. The geothermal system is compared with conventional natural gas or gas oil systems in terms of CO2 emissions. A comparison of the high influence of thermal conductivity on the length of the geothermal exchanger, for the same type of building, is made in three climatic zones (C1, D1, E1).
On the one hand, the influence of thermal conductivity on the length of the exchanger can be appreciated, requiring fewer drilling meters for higher conductivities. Furthermore, it can be seen that within the same location the hydrogeology is different, requiring different lengths of exchanger for each particular case. On the other hand, the factors that most influence energy and environmental savings are the improvement of the building envelope and the replacement of the conventional heating system by the geothermal one. Greater benefits are obtained for old buildings with large surfaces, with insulation or with old heating systems based on gas oil boilers. This has a direct effect on the initial investment and subsequent amortization.
The implementation of both renewable technologies in residential buildings reduces the CO2 emissions to the atmosphere, with the geothermal pumps being more profitable than the solar thermal panels due to the percentage of annual thermal load cover by each technology.
It should be noted that this accessible GIS platform provides both the solar and geothermal sectors with relevant information on these renewable resources in the areas of possible implementation, solving one of the major obstacles in the implementation of low enthalpy geothermal energy and solar thermal energy in urbanized areas. Therefore, the exploitation of this GIS platform by different public and private organizations is forecast. Regarding the public entities, the platform is mainly destined to be of use to environmental government areas of the Principality of Asturias, as well as to local authorities, helping them with decision-making in the matter of energy efficiency strategies and setting priorities for programs linked to rehabilitation plans and energy actions. On the other hand, the possibility of commercialization to private companies is focused mainly on the technical or engineering sector. These companies could find, in this platform, valuable information about the areas to which they could direct their main efforts to promote their activity.

Author Contributions

Conceptualization, J.I.P. and J.A.F.; methodology, S.S., E.G., M.N.S., D.G. and M.J.S.; software, J.L.C. and M.Á.F.; renewable modelling, M.R. and D.G.; building modelling, S.S., E.G. and M.N.S.; renewable analysis, M.R., D.G. and M.J.S.; building analysis, E.G., M.N.S. and S.S.; writing—original draft preparation, S.S., E.G., M.N.S., D.G. and M.J.S.; writing—review and editing, M.R., E.A.-Y., S.S., E.G., M.N.S., J.A.F., D.G., J.I.P. and M.J.S. All authors have read and agreed to the published version of the manuscript.

Funding

This research has been developed in the framework of the REHABILITAGEOSOL (RTC-2016-5004-3) project. It is a multidisciplinary R&D program supported by the Spanish Ministry of Science and Innovation and co-financed by European Regional Development Funds (ERDF).

Acknowledgments

The authors would like to acknowledge the support given by the rest of the members and institutions participating in the REHABILITAGEOSOL (RTC-2016-5004-3) project. The computational work has been carried out using the computer facilities of the Extremadura Center for Advanced Technologies (CETA-CIEMAT).

Conflicts of Interest

The authors declare no conflict of interest.

References

  1. IPCC. Global Warming of 1.5 °C. An IPCC Special Report on the Impacts of Global Warming of 1.5 °C above Pre-Industrial Levels and Related Global Greenhouse Gas Emission Pathways, in the Context of Strengthening the Global Response to the Threat of Climate Change, Sustainable Development, and Efforts to Eradicate Poverty; Masson-Delmotte, V., Zhai, P., Pörtner, H.-O., Roberts, D., Skea, J., Shukla, P.R., Pirani, A., Moufouma-Okia, W., Péan, C., Pidcock, R., et al., Eds.; IPCC: Geneva, Switzerland, 2018. [Google Scholar]
  2. Solauna, K.; Cerdá, E. Climate change impacts on renewable energy generation. A review of quantitative projections. Renew. Sustain. Energy Rev. 2019, 116, 109415. [Google Scholar] [CrossRef]
  3. IRENA. Climate Change and Renewable Energy: National policies and the role of communities, cities and regions. In Report to the G20 Climate Sustainability Working Group (CASE WG); International Renewable Energy Agency: Abu Dhabi, UAE, 2019. [Google Scholar]
  4. Contreras-Lisperguer, R.; de Cuba, K. The Potential Impact of Climate Change on the Energy Sector in the Caribbean Region; Organization of American States: Washington, DC, USA, 2008. [Google Scholar]
  5. Cronin, J.; Anandarajah, G.; Dessens, O. Climate change impacts on the energy system: A review of trends and gaps. Clim. Chang. 2018, 151, 79–93. [Google Scholar] [CrossRef] [PubMed] [Green Version]
  6. Arent, D.J.; Tol, R.S.J.; Faust, E.; Hella, J.P.; Kumar, S.; Strzepek, K.M.; Tóth, F.L.; Yan, D.; Abdulla, A.; Kheshgi, H.; et al. Chapter 10 Key Economic Sectors and Services. In Climate Change 2014 Impacts, Adaptation and Vulnerability: Part A: Global and Sectoral Aspects; Cambridge University Press: Cambridge, UK, 2010; pp. 659–708. [Google Scholar]
  7. Ebinger, J.; Vergara, W. Climate Impacts on Energy Systems: Key Issues for Energy Sector Adaptation; The International Bank for Reconstruction and Development/The World Bank: Washington, DC, USA, 2011. [Google Scholar]
  8. Johnston, P.C. Climate Risk and Adaptation in the Electric Power Sector; Asian Development Bank: Manila, Philippines, 2012. [Google Scholar]
  9. Schaeffer, R.; Szklo, A.S.; de Lucena, A.F.P.; Borba, B.S.M.C.; Nogueira, L.P.P.; Fleming, F.P.; Troccoli, A.; Harrison, M.; Boulahya, M.S. Energy sector vulnerability to climate change: A review. Energy 2012, 38, 1–12. [Google Scholar] [CrossRef]
  10. Sánchez, M.N.; Soutullo, S.; Olmedo, R.; Bravo, D.; Castaño, S.; Jiménez, M.J. An experimental methodology to assess the climate impact on the energy performance of buildings: A ten-year evaluation in temperate and cold desert areas. Appl. Energy 2020, 264, 114730. [Google Scholar] [CrossRef]
  11. Cao, X.; Dai, X.; Liu, J. Building energy-consumption status worldwide and the state-of-the-art technologies for zero-energy buildings during the past decade. Energy Build. 2016, 128, 198–213. [Google Scholar] [CrossRef]
  12. Soutullo, S.; Giancola, E.; Jiménez, M.J.; Ferrer, J.A.; Sánchez, M.N. How Climate Trends Impact on the Thermal Performance of a Typical Residential Building in Madrid. Energies 2020, 13, 237. [Google Scholar] [CrossRef] [Green Version]
  13. European Energy Research Alliance. EERA JPSC MAPPING: Positive Energy Districts (PEDs) and Neighbourhoods. Available online: https://www.eera-set.eu/eera-joint-programmes-jps/list-of-jps/smart-cities/mapping-positive-energy-districts-neighbourhoods/ (accessed on 30 September 2020).
  14. Temporary Working Group of the European Strategic Energy Technology (SET)-Plan on Action 3.2 “Smart Cities and Communities”. Implementation Plan, Europe to become a Global Role Model in Integrated, Innovative Solutions for the Planning, Deployment, and Replication of Positive Energy Districts. Available online: https://setis.ec.europa.eu/system/files/setplan_smartcities_implementationplan.pdf (accessed on 30 September 2020).
  15. Li, C. GIS for Urban Energy Analysis. Compr. Geogr. Inf. Syst. 2018, 187–195. [Google Scholar] [CrossRef]
  16. Cabeza, L.F.; Chàfer, M. Technological options and strategies towards zero energy buildings contributing to climate change mitigation: A systematic review. Energy Build. 2020, 219, 110009. [Google Scholar] [CrossRef]
  17. Abbasabadi, N.; Ashayeri, M. Urban energy use modeling methods and tools: A review and an outlook. Build. Environ. 2019, 161, 106270. [Google Scholar] [CrossRef]
  18. Soutullo, S.; Giancola, E.; Heras, M.R. Dynamic energy assessment to analyze different refurbishment strategies of existing dwellings placed in Madrid. Energy 2018, 152, 1011–1023. [Google Scholar] [CrossRef]
  19. Terés-Zubiaga, J.; Bolliger, R.; Almeida, M.G.; Barbosa, R.; Rose, J.M.; Thomsen, K.E.; Montero, E.; Briones-Llorente, R. Cost-effective building renovation at district 1 level combining energy efficiency & renewable. Methodology assessment proposed in IEA-Annex 75 and a demonstration case study. Energy Build. 2020, 224, 110280. [Google Scholar]
  20. de Santoli, L.; Mancini, F.; Garcia, D.A. A GIS-based model to assess electric energy consumptions and usable renewable energy potential in Lazio region at municipality scale. Sustain. Cities Soc. 2019, 46, 101413. [Google Scholar] [CrossRef] [Green Version]
  21. Alhamwi, A.; Medjroubi, W.; Vogt, T.; Agert, C. FlexiGIS: An open source GIS-based platform for the optimisation of flexibility options in urban energy systems. In Proceedings of the CUE2018-Applied Energy Symposium and Forum 2018: Low Carbon Cities and Urban Energy Systems, Shanghai, China, 5–7 June 2018. [Google Scholar]
  22. Wang, H.; Pan, Y.; Luo, X. Integration of BIM and GIS in sustainable built environment: A review and bibliometric analysis. Autom. Constr. 2019, 103, 41–52. [Google Scholar] [CrossRef]
  23. Marzouk, M.; Othman, A. Planning utility infrastructure requirements for smart cities using the integration between BIM and GIS. Sustain. Cities Soc. 2020, 57, 102120. [Google Scholar] [CrossRef]
  24. Pedro, J.; Silva, C.; Duarte Pinheiro, M. Integrating GIS spatial dimension into BREEAM communities sustainability assessment to support urban planning policies, Lisbon case study. Land Use Policy 2019, 83, 424–434. [Google Scholar] [CrossRef]
  25. Krietemeyer, B.; El Kontar, R. A method for integrating an UBEM with GIS for spatiotemporal visualization and analysis. In Proceedings of the 10th Annual Symposium on Simulation for Architecture and Urban Design Conference SimAUD 2019, Atlanta, GA, USA, 7–9 April 2019; Simulation Series. Volume 51, pp. 87–94. [Google Scholar]
  26. Gaspari, J.; De Giglio, M.; Antonini, E.; Vodola, V. A GIS-Based Methodology for Speedy Energy Efficiency Mapping: A Case Study in Bologna. Energies 2020, 13, 2230. [Google Scholar] [CrossRef]
  27. Li, C.; Song, Y.; Kaza, N.; Burghardt, R. Explaining Spatial Variations in Residential Energy Usage Intensity in Chicago: The Role of Urban Form and Geomorphometry. J. Plan. Educ. Res. 2019, 1–15. [Google Scholar] [CrossRef]
  28. Torabi Moghadam, S.; Toniolo, J.; Mutani, G.; Lombardi, P. A GIS-statistical approach for assessing built environment energy use at urban scale. Sustain. Cities Soc. 2018, 37, 70–84. [Google Scholar] [CrossRef]
  29. Ahn, Y.; Sohn, D.W. The effect of neighbourhood-level urban form on residential building energy use: A GIS-based model using building energy benchmarking data in Seattle. Energy Build. 2019, 196, 124–133. [Google Scholar] [CrossRef]
  30. Zheng, Y.; Weng, Q. Modeling the effect of climate change on building energy demand in Los Angeles county by using a GIS-based high spatial- and temporal resolution approach. Energy 2020, 176, 641–655. [Google Scholar] [CrossRef]
  31. Praene, J.P.; Malet-Damour, B.; Radanielina, M.H.; Fontaine, L.; Rivière, G. GIS-based approach to identify climatic zoning: A hierarchical clustering on principal component analysis. Build. Environ. 2019, 164, 106330. [Google Scholar] [CrossRef] [Green Version]
  32. García-Ballano, C.J.; Ruiz-Varona, A.; Casas-Villarreal, L. Parametric-based and automatized GIS application to calculate energy savings of the building envelope in rehabilitated nearly zero energy buildings (nZEB). Case study of Zaragoza, Spain. Energy Build. 2020, 215. [Google Scholar] [CrossRef]
  33. Mokhtara, C.; Negrou, B.; Settou, N.; Gouareh, A.; Settou, B. Pathways to plus-energy buildings in Algeria: Design optimization method based on GIS and multi-criteria decision-making. Energy Proc. 2019, 162, 171–180. [Google Scholar] [CrossRef]
  34. Re Cecconi, F.; Moretti, N.; Tagliabue, L.C. Application of artificial neutral network and geographic information system to evaluate retrofit potential in public school buildings. Renew. Sustain. Energy Rev. 2019, 110, 266–277. [Google Scholar] [CrossRef] [Green Version]
  35. Sarmiento, N.; Belmonte, S.; Dellicompagni, P.; Franco, J.; Escalante, K.; Sarmiento, J. A solar irradiation GIS as decision support tool for the Province of Salta, Argentina. Renew. Energy 2018, 132, 68–80. [Google Scholar] [CrossRef] [Green Version]
  36. Ferla, G.; Caputo, P.; Colaninno, N.; Morello, E. Urban greenery management and energy planning: A GIS-based potential evaluation of pruning by-products for energy application for the city of Milan. Renew. Energy 2020, 160, 185–195. [Google Scholar] [CrossRef]
  37. Hendel, M.; Bobée, C.; Karam, G.; Parison, S.; Berthe, A.; Bordin, P. Developing a GIS tool for emergency urban cooling in case of heat-waves. Urban Clim. 2020, 33, 100646. [Google Scholar] [CrossRef]
  38. Viana-Fons, J.D.; Gonzálvez-Maciá, J.; Payá, J. Development and validation in a 2D-GIS environment of a 3D shadow cast vector-based model on arbitrarily orientated and tilted surfaces. Energy Build. 2020, 224, 110258. [Google Scholar] [CrossRef]
  39. Liang, J.; Gong, J.; Zhang, J.; Li, Y.; Wu, D.; Zhang, G. GSV2SVF-an interactive GIS tool for sky, tree and building view factor estimation from street view photographs. Build. Environ. 2020, 168, 106475. [Google Scholar] [CrossRef]
  40. Soutullo, S.; Giancola, E.; Franco, J.M.; Boton, M.; Ferrer, J.A.; Heras, M.R. New simulation platform for the rehabilitation of residential building in Madrid. Energy Proc. 2017, 122, 817–822. [Google Scholar] [CrossRef]
  41. RehabilitaGeoSol Project Website. Available online: http://projects.ciemat.es/web/rehabilitageosol/inicio (accessed on 30 September 2020).
  42. Harish, V.S.K.V.; Kumar, A. A review on modeling and simulation of buildings energy systems. Renew. Sustain. Energy Rev. 2016, 56, 1272–1292. [Google Scholar] [CrossRef]
  43. Ascione, F.; Bianco, N.; Mauro, G.M.; Napolitano, D.F.; Vanoli, G.P. A Multi-Criteria Approach to Achieve Constrained Cost-Optimal Energy Retrofits of Buildings by Mitigating Climate Change and Urban Overheating. Climate 2018, 6, 37. [Google Scholar] [CrossRef] [Green Version]
  44. Hashempour, N.; Taherkhani, R.; Mahdikhani, M. Energy performance optimization of existing buildings: A literature review. Sustain. Cities Soc. 2020, 54, 101967. [Google Scholar] [CrossRef]
  45. Castro, S.S.; López, M.J.S.; Menéndez, D.G.; Marigorta, E.B. Decision matrix methodology for retrofitting techniques of existing buildings. J. Clean. Product. 2019, 240, 118153. [Google Scholar] [CrossRef]
  46. Prieto, J.I.; Martínez-García, J.C.; García, D.; Santoro, R.; Rodríguez, A. Mapa Solar de Asturias; Empresas Acuerdo Consorcio PSE-ARFRISOL: Gijón, Spain, 2009. [Google Scholar]
  47. Prieto, J.I.; Martínez-García, J.C.; García, D. Correlation between global solar irradiation and air temperature in Asturias, Spain. Sol. Energy 2009, 83, 1076–1085. [Google Scholar] [CrossRef]
  48. Instituto Geológico y Minero de España (IGME). Mapa Hidrogeológico de España y Mapa Geológico de España (MAGNA 50). Sheets 10–15, 25–32, 49–56, 74–80, 99–103. 1972–2003. Available online: http://info.igme.es/cartografiadigital/geologica/Magna50.aspx (accessed on 30 September 2020).
  49. Asociación Técnica Española de Climatización y Refrigeración (ATECYR). Guía Técnica: Diseño de Sistemas de Intercambio Geotérmico de Circuito Cerrado; Instituto para la Diversificación y Ahorro de la Energía (IDAE), Ministry of Industry, Energy and Tourism, Spanish Government: Madrid, Spain, 2012; ISBN 978-84-96680-60-9.
  50. Spanish Government. Norma Básica de la Edificación “NBE-CT-79” Sobre Condiciones Térmicas de los Edificios; Royal Decree 2429/1979 1979, BOE-A-1979-24866; Spanish Government: Madrid, Spain, 1979.
  51. Spanish Government. Código Técnico de la Edificación; Royal Decree 314/2006 2006, BOE-A-2006-5515; Spanish Government: Madrid, Spain, 2006.
  52. Soutullo, S.; Sánchez, M.N.; Enríquez, R.; Olmedo, R.; Jiménez, M.J. Bioclimatic vs conventional building: Experimental quantification of the thermal improvements. Energy Proc. 2017, 122, 823–828. [Google Scholar] [CrossRef]
  53. Soutullo, S.; Sánchez, M.N.; Enríquez, R.; Jiménez, M.J.; Heras, M.R. Empirical estimation of the climatic representativeness in two different areas: Desert and Mediterranean climates. Energy Proc. 2017, 122, 829–834. [Google Scholar] [CrossRef]
  54. Sánchez, M.N.; Giancola, E.; Blanco, E.; Soutullo, S.; Suárez, M.J. Experimental Validation of a Numerical Model of a Ventilated Façade with Horizontal and Vertical Open Joints. Energies 2020, 13, 146. [Google Scholar] [CrossRef] [Green Version]
  55. Salcido, J.C.; Raheem, A.A.; Isaa, R.A. From simulation to monitoring: Evaluating the potential of mixed-mode ventilation (MMV) systems for integrating natural ventilation in office buildings through a comprehensive literature review. Energy Build. 2016, 127, 1008–1018. [Google Scholar] [CrossRef]
  56. Díaz, J.A.; Jiménez, M.J. Experimental assessment of room occupancy patterns in an office building. Comparison of different approaches based on CO2 concentrations and computer power consumption. Appl. Energy 2017, 199, 121–141. [Google Scholar] [CrossRef]
  57. Tejero-González, A.; Andrés-Chicote, M.; García-Ibáñez, P.; Velasco-Gómez, E.; Rey-Martínez, F.J. Assessing the applicability of passive cooling and heating techniques through climate factors: An overview. Renew. Sustain. Energy Rev. 2016, 65, 727–742. [Google Scholar] [CrossRef] [Green Version]
  58. Giancola, E.; Sánchez, M.N.; Ferrer, J.A.; López, H.; Soutullo, S. New Platform to Quantify the Energy-Saving Potential in Existing Residential Buildings in a Northern Spanish Region. In Proceedings of the 35th International Conference PLEA 2020: Sustainable Architecture and Urban Design Planning Post Carbon Cities, A Coruña, Spain, 1–3 September 2020. [Google Scholar]
  59. Spanish Building Code Webpage. Available online: https://www.codigotecnico.org/index.php/menu-ahorro-energia.html (accessed on 30 September 2020).
  60. Carrera, A.; Sisó, L.; Herena, A.; Valle, M.; Casanova, M.; González, D. Evaluación del Potencial de Climatización con Energía Solar Térmica en Edificios; Estudio Técnico PER 2011–2020; Instituto para la Diversificación y Ahorro de la Energí (IDAE): Madrid, Spain, 2011. [Google Scholar]
  61. Environmental Information System of the Principality of Asturias Webpage. Available online: https://www.asturias.es/portal/site/medioambiente/menuitem.4691a4f57147e2c2553cbf10a6108a0c/?vgnextoid=eaddffae3867b210VgnVCM10000097030a0aRCRD&i18n.http.lang=en (accessed on 30 September 2020).
  62. Peci Lopez, F.; de Adana Santiago, M.R. Sensitivity study of an opaque ventilated façade in the winter season in different climate zones in Spain. Renew. Energy 2015, 75, 524–533. [Google Scholar] [CrossRef]
  63. Verichev, K.; Carpio, M. Climatic zoning for building construction in a temperate climate of Chile. Sustain. Cities Soc. 2018, 40, 352–364. [Google Scholar] [CrossRef]
  64. Spanish Energy Certification of Buildings Webpage. Available online: https://energia.gob.es/desarrollo/EficienciaEnergetica/CertificacionEnergetica/DocumentosReconocidos/Paginas/documentosreconocidos.aspx (accessed on 30 September 2020).
  65. TRNSYS Webpage. Available online: http://www.trnsys.com/ (accessed on 30 September 2020).
  66. GENOPT Webpage. Available online: https://simulationresearch.lbl.gov/GO/ (accessed on 30 September 2020).
  67. Klein, S.A.; Beckman, W.A.; Duffie, J.A. A Design Procedure for Solar Heating Systems. Sol. Energy 1976, 18, 113–127. [Google Scholar] [CrossRef]
  68. Ministerio de Industria, Energía y Turismo y Ministerio de Fomento. Documento Reconocido del Reglamento de Instalaciones Térmicas en los Edificios (RITE). Factores de Emisión de CO2 y Coeficientes de Paso a Energía Primaria de Diferentes Fuentes de Energía Final Consumidas en el Sector de Edificios en España; Spanish Goverment: Madrid, Spain, 2016.
  69. Eurostat 2018 Webpage. Available online: https://ec.europa.eu/eurostat/data/database (accessed on 30 September 2020).
  70. Instituto para la Diversificación y Ahorro de la Energía (IDAE). Informe de Precios Energéticos: Combustibles y Carburantes; Ministry for Ecological Transition, Spanish Goverment: Madrid, Spain, 2018.
  71. Rodríguez, A.; Martínez, M.D.; González, A.; Ferreira, P.; Marrero, M. Building rehabilitation versus demolition and new construction: Economic and environmental assessment. Environ. Impact Assess. Rev. 2017, 66, 115–126. [Google Scholar] [CrossRef]
Figure 1. Average of daily global irradiation on a horizontal surface in Asturias.
Energies 13 05970 g001
Figure 2. Average thermal conductivity in postal districts of the Principality of Asturias.
Energies 13 05970 g002
Figure 3. Methodology to develop building analysis modules for the online RGS platform.
Energies 13 05970 g003
Figure 4. (a) Seasonal values of temperature, (b) relative humidity, (c) solar global radiation and (d) wind speed for the climate zones C1 (orange bars), D1 (green bars) and E1 (blue bars). Annual values are shown with dark colours.
Energies 13 05970 g004
Figure 5. Screenshot of the platform where two areas can be distinguished: layer tree and map.
Energies 13 05970 g005
Figure 6. Potential savings in domestic hot water energy consumption.
Energies 13 05970 g006
Figure 7. 100 m2 building in Gijón. Drilling length required for each postal district.
Energies 13 05970 g007
Figure 8. 100 m2 building in Oviedo. Drilling length required for each postal district.
Energies 13 05970 g008
Figure 9. 100 m2 building in Cangas del Narcea. Drilling length required for each postal district.
Energies 13 05970 g009
Figure 10. Building case 1. Environmental savings in kg of CO2 per year.
Energies 13 05970 g010
Figure 11. Building case 2. Environmental savings in kg of CO2 per year.
Energies 13 05970 g011
Figure 12. Building case 3. Environmental savings in kg of CO2 per year.
Energies 13 05970 g012
Figure 13. Heating load contribution to the annual total loads achieved by the eight representative building cases for the three climate zones and for the four Spanish construction regulations.
Energies 13 05970 g013
Figure 14. Maximum retrofitting potential shown by module 1.
Energies 13 05970 g014
Figure 15. Three selected municipalities (Gijon, Oviedo and Cangas del Narcea) to assess the customized retrofitting potential with module 2.
Energies 13 05970 g015
Figure 16. Annual retrofitting potential with respect to normative requirements after 2014 achieved in Gijon for the 48 cases proposed. Single-family houses and a four-storey block with an area of 400 m2 are assessed for isolated configuration and semi-detached configurations.
Energies 13 05970 g016
Figure 17. Annual retrofitting potential with respect to normative requirements after 2014 achieved in Oviedo for the 48 cases proposed. Single-family houses and a four-storey block with an area of 400 m2 are assessed for isolated configuration and semi-detached configurations.
Energies 13 05970 g017
Figure 18. Annual retrofitting potential with respect to normative requirements after 2014 achieved in Cangas del Narcea for the 48 cases proposed. Single-family houses and a four-storey block with an area of 400 m2 are assessed for isolated configuration and semi-detached configurations.
Energies 13 05970 g018
Table 1. Thermal characteristics of representative materials in Asturias.
Type of RockMinimum Thermal Conductivity
W/(m·K)
Average Thermal Conductivity
W/(m·K)
Maximum Thermal Conductivity
W/(m·K)
Volumetric Specific Heat. Capacity
MJ/(m3/K)
Basalt1.31.72.32.3–2.6
Granite2.13.44.12.1–3.0
Gneiss1.92.94.01.8–2.4
Limestone2.52.84.02.1–2.4
Table 2. Categories used for the classification of buildings in each postal district.
Year of BuiltNo. of FloorsSurface (m2)Typology
Before 19791–2<150Isolated single-family home
1979–20083–5150–300Single-family homes in closed block
2009–20136–8300–600Apartment building in open block
After 2014>8>600Apartment building in closed block
Table 3. Limit values of the overall heat transfer coefficients U (W/m2K) for the building envelopes in the climatic zones.
Climate ZoneConstructive ElementsUlimit
Before 1979
Ulimit
1979–2008
Ulimit
2009–2013
Ulimit
After 2014
C1Roof2.171.200.410.23
External Wall2.381.600.730.29
Ground1.001.000.730.29
Internal Wall2.251.620.730.73
Glazing (g)5.73 (0.82)3.25 (0.76)1.54 (0.65)0.97 (0.61)
D1Frame5.74.02.22.2
Roof2.171.200.380.22
External Wall2.381.600.660.27
Ground1.001.000.660.27
Internal Wall2.251.620.660.27
Glazing (g)5.73 (0.82)3.25 (0.76)1.54 (0.65)0.97 (0.61)
Frame5.74.02.22.2
E1Roof2.171.200.350.19
External Wall2.381.600.570.25
Ground1.001.000.570.25
Internal Wall2.251.620.570.25
Glazing (g)5.73 (0.82)3.25 (0.76)1.54 (0.65)0.97 (0.61)
Frame5.74.02.22.2
Table 4. CO2 Emissions factors by power source.
Power SourceCO2 Emissions Factors
(kg CO2/kWh)
Cost—Taxes Included
(€/kWh)
Conventional electricity0.3310.2383
Gas Oil0.3110.0727
Natural gas0.2520.0665
Table 5. Examples of variations of annual installation efficiency, solar and CO2 savings for different climate zones and postal districts.
Climatic ZoneMunicipalityPostal DistrictSolar Savings (%)Efficiency (%)CO2 Savings
(kg CO2/Year)
C1Gijón3320836.645.2234.3
Avilés3340134.645.0222.2
Soto del Barco3312551.346.9328.3
Coaña3371029.643.2197.3
D1Oviedo3300639.646.7260.6
Castrillón3345748.747.1313.7
Cudillero3315657.447.5371.3
Coaña3371626.842.3172.5
E1Cangas del Narcea3380049.848.7338.1
Grado3382640.148.6277.0
Aller3367638.150.3275.7
Table 6. Studied with module 2 for the selected places: Gijon, Oviedo and Cangas del Narcea.
Type of HouseBoundary ConditionsNormative100%t
Summer Shading
50%t
Summer Shading
0%t
Summer Shading
Single-familyIsolatedBefore 1979Case 1Case 2Case 3
1979–2008Case 4Case 5Case 6
2009–2013Case 7Case 8Case 9
After 2014Case 10Case 11Case 12
Semi-detachedBefore 1979Case 13Case 14Case 15
1979–2008Case 16Case 17Case 18
2009–2013Case 19Case 20Case 21
After 2014Case 22Case 23Case 24
Four-storey block
(400 m2)
IsolatedBefore 1979Case 25Case 26Case 27
1979–2008Case 28Case 29Case 30
2009–2013Case 31Case 32Case 33
After 2014Case 34Case 35Case 36
Semi-detachedBefore 1979Case 37Case 38Case 39
1979–2008Case 40Case 41Case 42
2009–2013Case 43Case 44Case 45
After 2014Case 46Case 47Case 48
Publisher’s Note: MDPI stays neutral with regard to jurisdictional claims in published maps and institutional affiliations.

