Article

Optimal Detection and Identification of DC Series Arc in Power Distribution System on Shipboards

1
Physics and Engineering Division, National Forensic Service, Busan 50612, Korea
2
Hangzhou Guozhou Power Technology Co., Ltd., Hangzhou 310015, China
3
Department of Electrical and Electronics Engineering, Korea Maritime and Ocean University, Busan 49112, Korea
*
Author to whom correspondence should be addressed.
Energies 2020, 13(22), 5973; https://doi.org/10.3390/en13225973
Submission received: 28 October 2020 / Revised: 10 November 2020 / Accepted: 12 November 2020 / Published: 16 November 2020
(This article belongs to the Special Issue Power Conditioning and Power Protection for Electronic Systems)

Abstract

:
In this paper, a series arc was simulated under resistive load and motor load, which are mainly used in small ships, and the arc signal was analyzed using discrete wavelet transform. After calculating the correlation coefficient between the single arc pulse and the wavelet, Biorthogonal (bior) 3.1 was selected as the optimal mother wavelet, and the signal was analyzed using multiresolution analysis. From the results, arc signals were distributed in the detail components D2, D3, D4 and D5, corresponding to a frequency range of 19.5–312.5 kHz, with the optimal arc signal extracted based on these values. In addition, in order to distinguish between arc and normal conditions, signal energy was analyzed. By applying the magnitude and signal energy analysis method, the DC series arc generated in the power distribution system of a shipboard was identified.

1. Introduction

As reported by the Korea National Fire Data System, more than 500 cases of ship fires have occurred over the past five years. In 2019, about 33% of ship fires were caused by electrical faults, causing enormous financial losses and human injuries. Figure 1 shows occurrence rates of electrical fires between 2017 and 2019, and it can be seen that about 50% of electrical fires were caused by poor connections, partial disconnection and degraded or compressed insulation, all of which can be attributed to the series arc. In addition, more than 80% of these electrical fires occurred in the power distribution system of old shipboards docking at the port, as a result of the absence of crew members. Therefore, it was difficult to put out the fires immediately, and it was easy for fires to spread to other ships nearby, causing serious economic losses. For this reason, measures should be taken to prevent electrical fires on old small ships [1,2].
There is a lot of interest in the detection and analysis of DC series arcs for fire prevention. In particular, research is being actively conducted focusing on aircraft, houses and solar power facilities, but there is not enough research regarding the application to shipboards. In order to prevent electrical fire accidents caused by series arcs, much research is being actively conducted based on the Underwriters Laboratories (UL) 1699 and the International Electrotechnical Commission (IEC) 62606 [3,4,5,6,7]. To detect an AC series arc, the change of peak current was measured in the 1990s [8,9] and, afterward, various electrical parameters, such as the crest factor and the average value, were used to improve the accuracy of arc detection [10,11,12]. The most important feature for AC arc detection is a shoulder in the current waveform [13]. Compared with AC systems, however, DC arcs have no zero crossing points and shoulder. Therefore, it is not an easy task to distinguish a DC arc fault from normal conditions using existing AC arc fault detection techniques [14,15]. To detect a DC series arc, several studies, such as current entropy [16,17], electromagnetic radiation [18,19] and frequency spectrum [20], were conducted. The intrinsic behavior of the arc signal was analyzed by current entropy to distinguish between an arc fault and a normal condition [16]. This method has a lower sampling frequency and a short time to detect arc faults, but it is easy to influence an arc signal by a noise signal depending on the surrounding environment [17]. When an arc fault occurs, it is accompanied by electromagnetic radiation, light and noise. Recently, one of these, the magnitude of the electromagnetic radiation signal, was actively analyzed to identify the DC series arc. This method has an advantage for noncontact arc detection, but it is limited because it can only detect an arc fault at specific locations where a sensor is installed [18,19]. Besides, the arc current signals have various time-frequency characteristics depending on the different loads. The sum of optimal frequency spectrum was calculated based on fast Fourier transform (FFT) to differentiate an arc fault from a normal condition [20]. When the sum of spectrum values in the specific frequency range was over a specific value, arc faults were identified. This method identifies arc faults simply, but it may be unreliable depending on the load types because the specific frequency range and spectrum value may depend on the loads. For this reason, various methods for detection of DC series arcs are being studied to distinguish arc faults from normal conditions, and most of them involve complex and expensive devices [21,22]. In Korea, however, it is not practical to apply complex and expensive devices to old shipboards to prevent electrical fires caused by series arcs on shipboards.
Therefore, in this paper, a study was conducted to prevent fires caused by DC series arcs in the power distribution system of shipboards. The optimal method for detection and identification of DC series arcs was proposed for power distribution systems on shipboards. A resistive load and motor load were used to simulate the power distribution system of old shipboards. The arc signal was analyzed by discrete wavelet transform (DWT) and multiresolution analysis (MRA) to confirm the optimal frequency band for arc detection. In addition, a method to compare arc signal energy with noise signal energy was proposed to distinguish between arc signals and noise signal.

2. Arc Fault Characteristics and Fire Cases

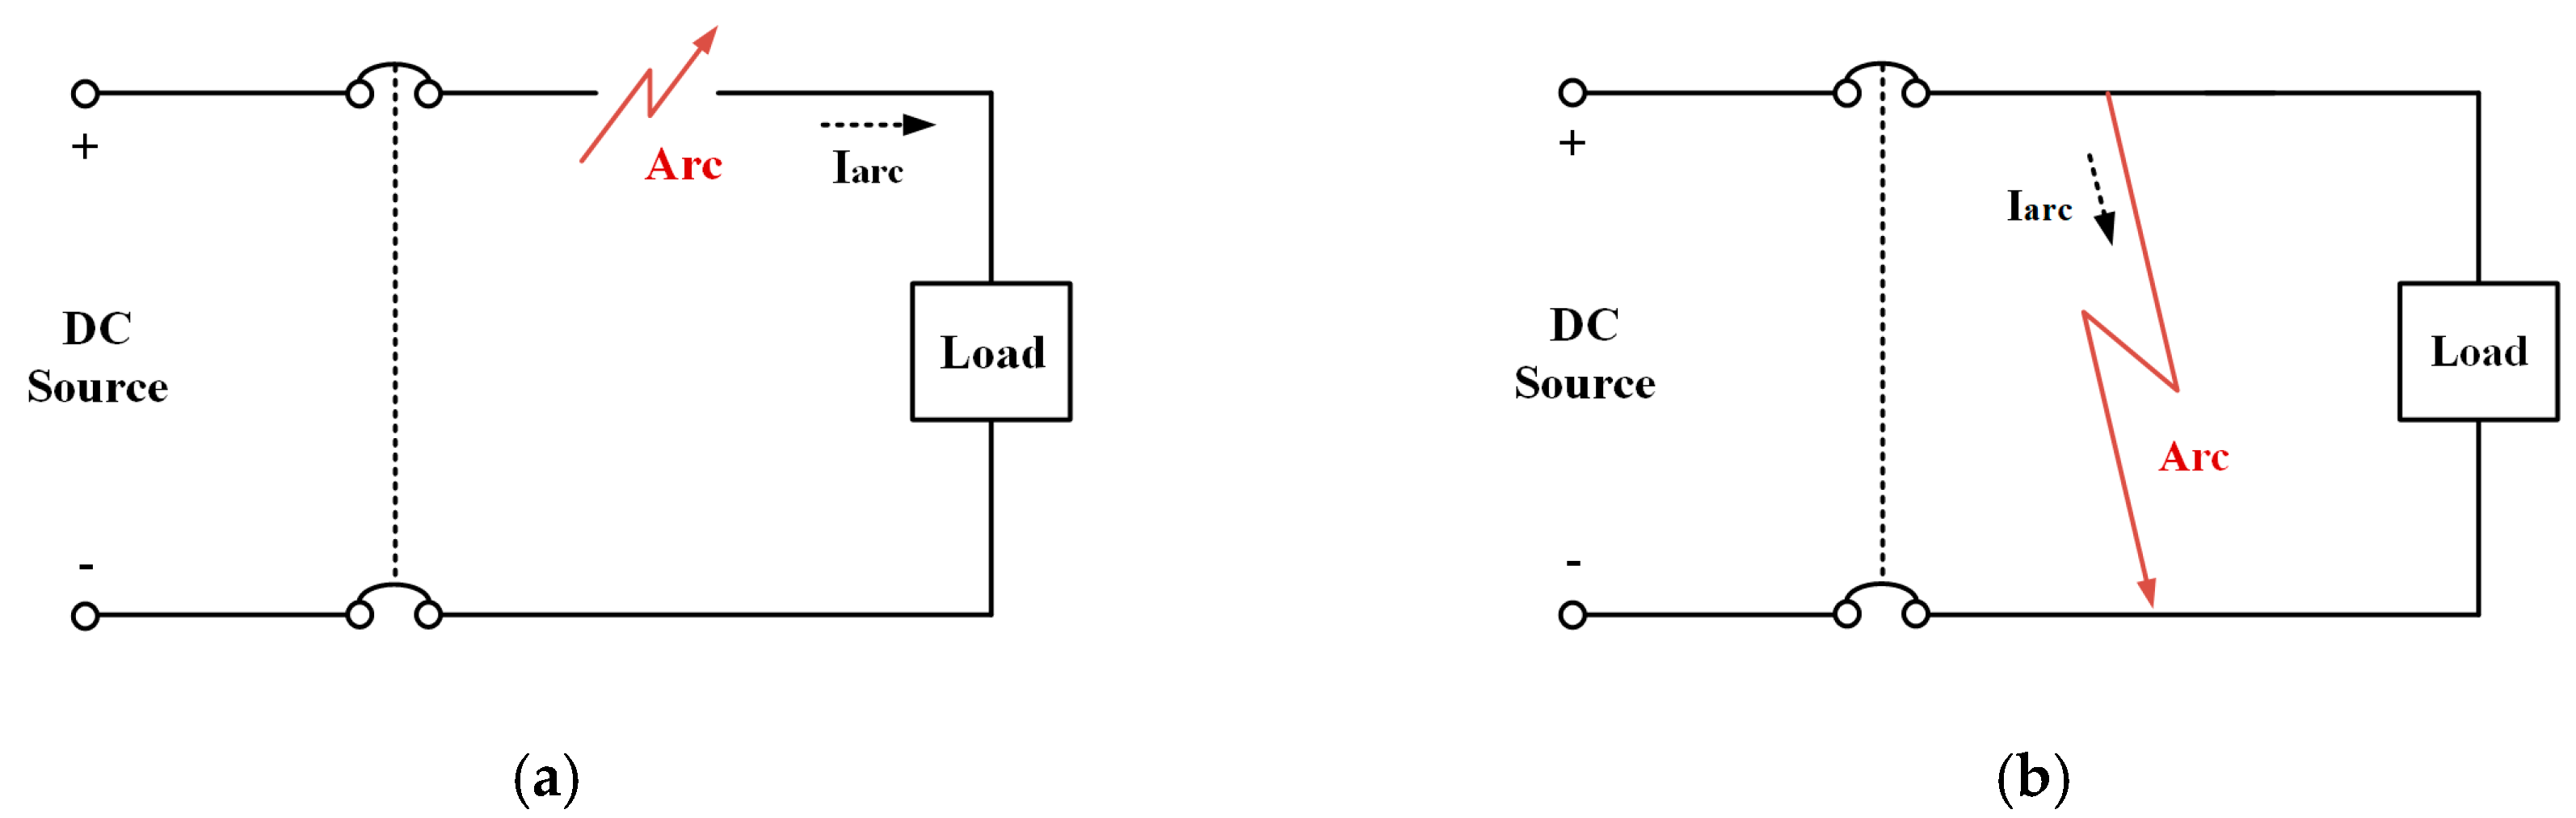
2.1. Series Arc and Its Characteristics

Arc is defined as a luminous discharge of electricity across an insulating medium, usually accompanied by the partial volatilization of the electrodes [6,7,23]. Due to the current flow in the circuit and the high temperature, arc is one of the main causes of electrical fires. There are two types of arc, depending on the fault current path, as shown in Figure 2, namely series arc and parallel arc [24,25,26,27]. Parallel arcs occur in a short circuit and generate an arc current with high energy. On the other hand, series arcs occur at the connection in series with the load. The arc current is limited by the load and the arc impedance, which has a relatively lower energy. Therefore, conventional circuit breakers and fuses cannot operate to protect the distribution line. For this reason, it is more difficult to detect series arcs than parallel arcs.
Series arcs under AC voltage is well studied, whereas little research has been carried out to study that under DC voltage. Figure 3 represents the typical current signal of the series arc under AC and DC 24 V. Under AC voltage, the arc extinguishes near the zero-crossing point due to insufficient voltage for sustaining the discharge. After the voltage recovers, the arc ignites again. Therefore, there is a shoulder in every half-cycle of the current signal. Rising edges are also present just after the shoulders, which is one of the main characteristics of the AC series arc. However, as shown in Figure 3b, only irregular, high-frequency components can be seen on the current waveform of the DC series arc.

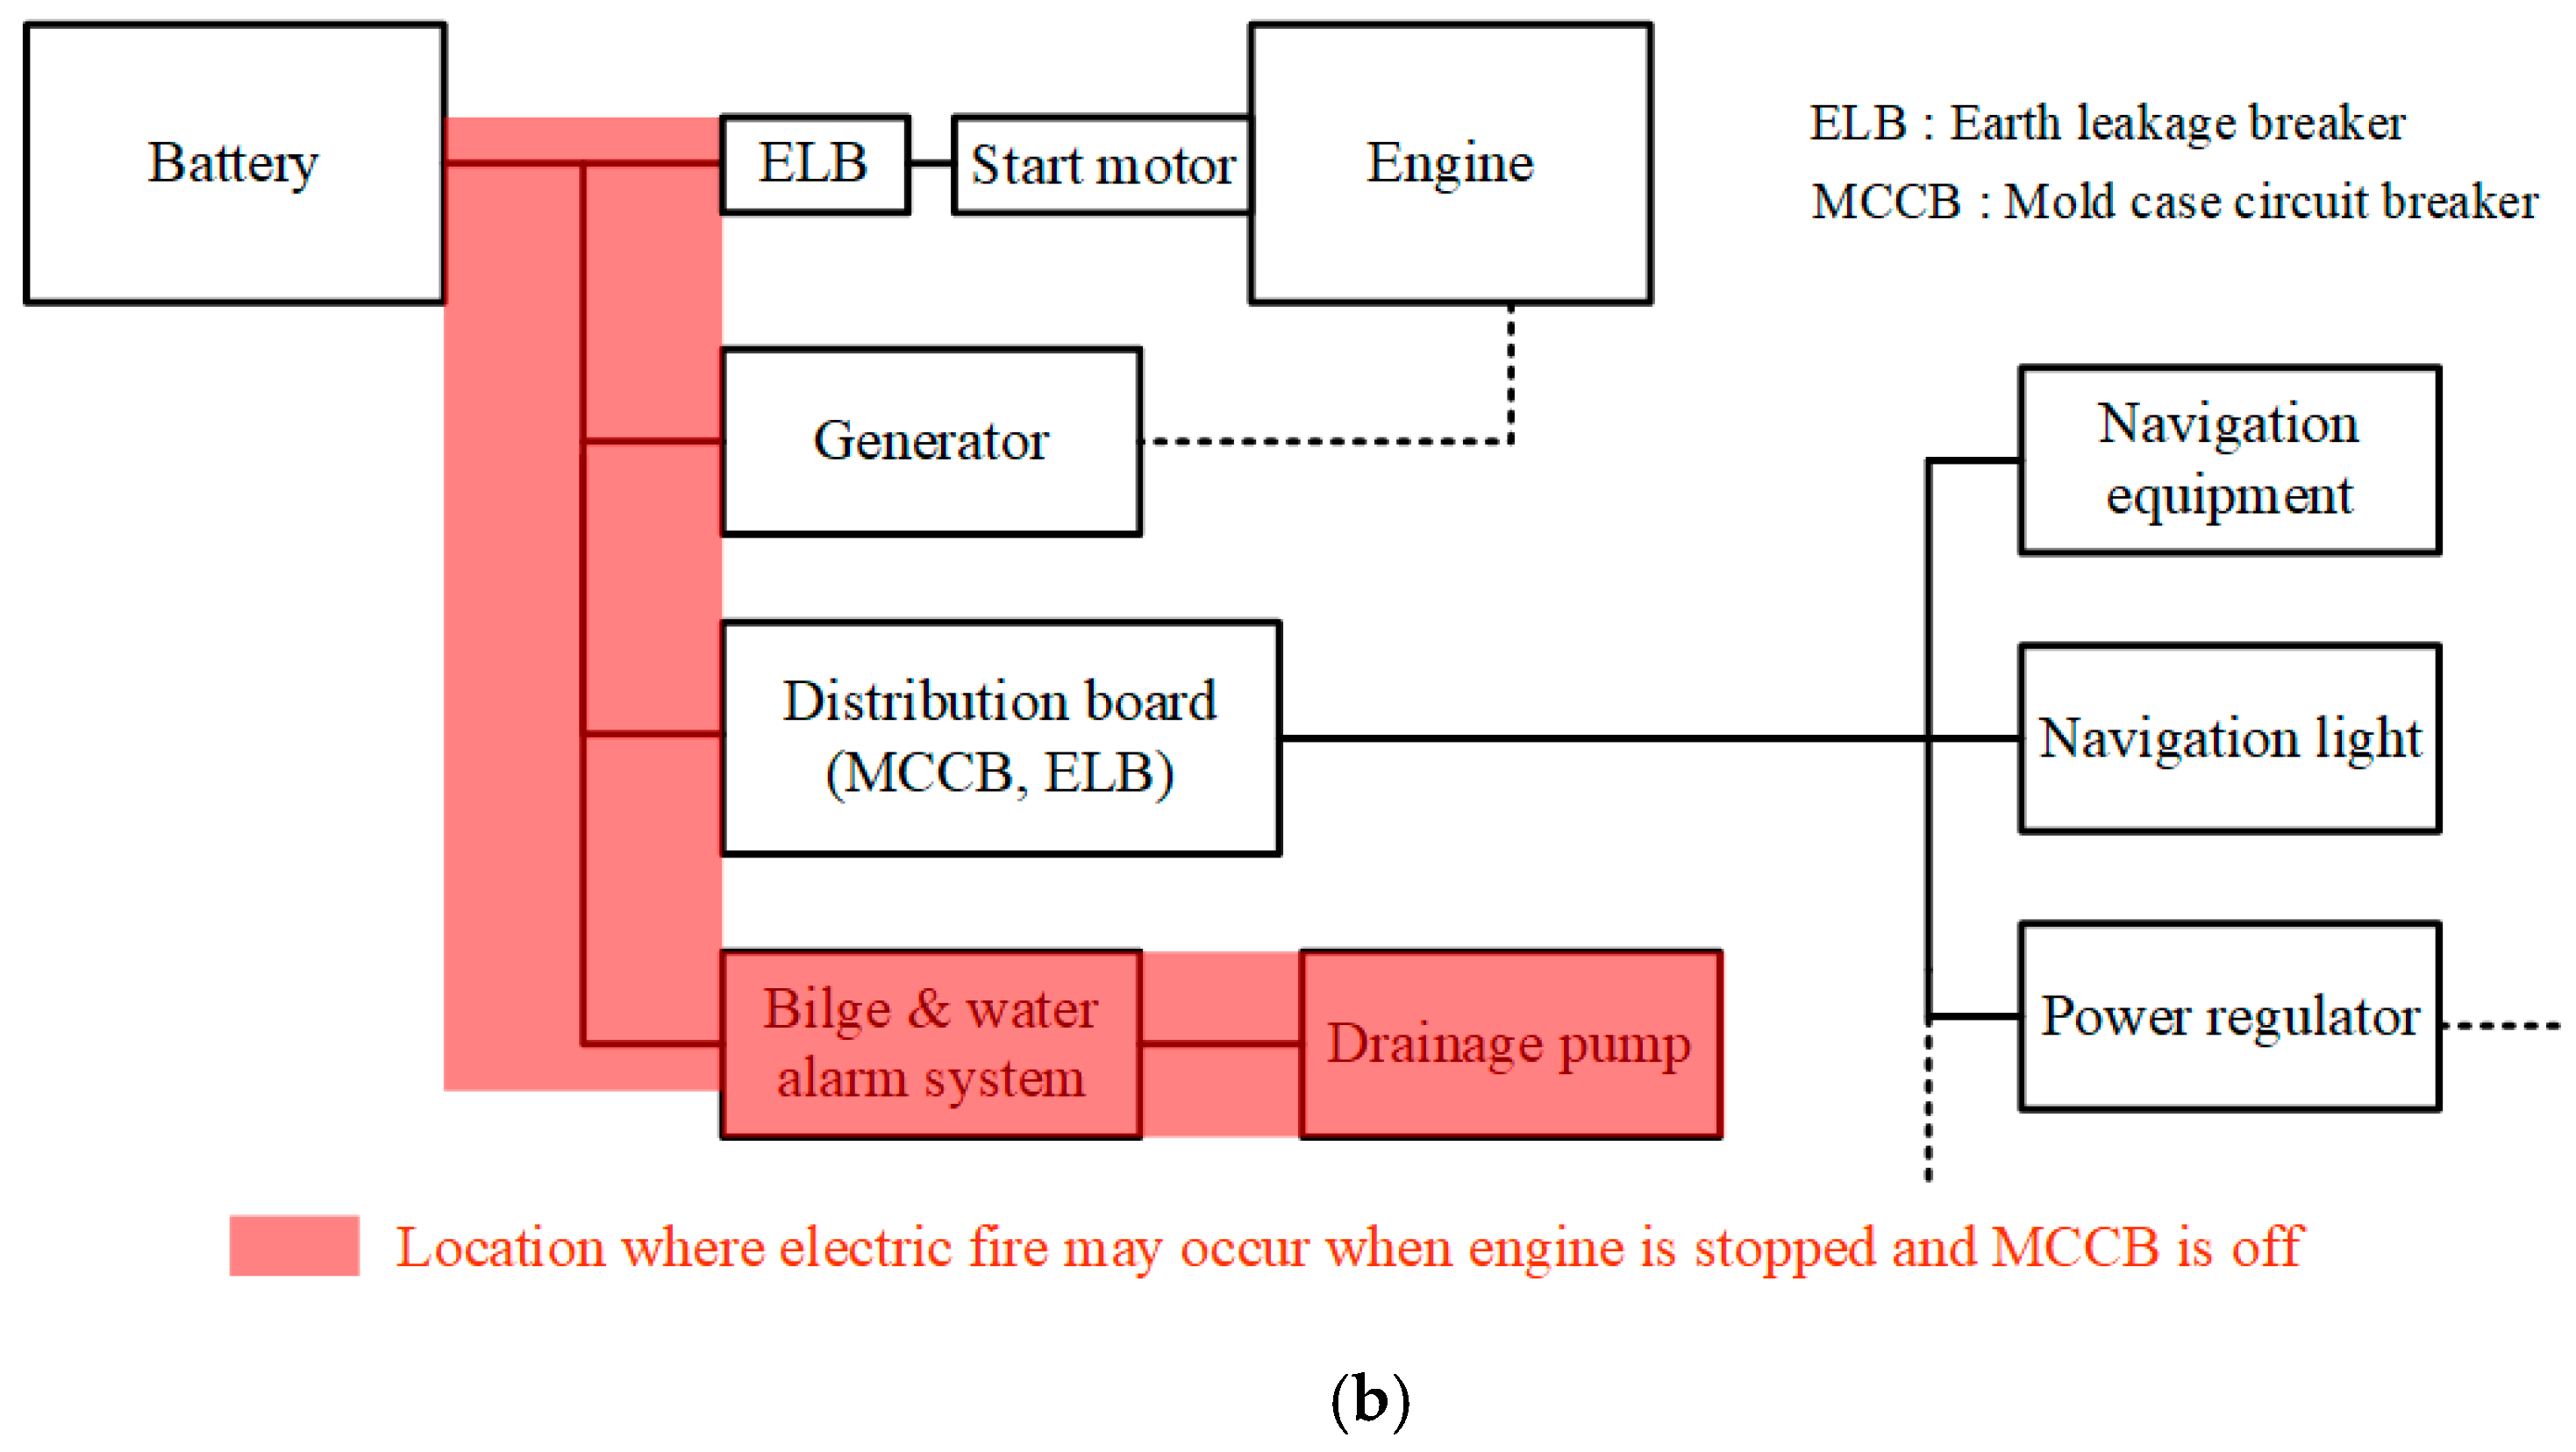
2.2. Fire Cases on Shipboards

In Korea, the old shipboards are more vulnerable to fire accidents because the regular inspection of shipboards is performed once every five years. The fire accidents occur in power distribution systems that have arc faults while the old shipboards are in operation. Fire accidents can also occur at a location connected to a battery because the engine shuts off, but the battery still supplies a DC power source while the shipboards are at anchor. The crew can take action to extinguish the fire at an early stage when the shipboards are in operation, but a serious fire accident can occur due to the absence of the crew when the shipboards are at anchor. Figure 4 shows the photograph and diagram of the power distribution system on shipboards. In general, a battery is used as the power supply to operate the engine. The engine runs to charge the battery and to power the navigation system, lighting system, power regulator and other equipment. In addition, the bilge and water alarm system installed in series with the battery generates an alarm at all the times and operates automatically with a drain pump to prevent the ship from sinking. When the shipboards are in operation, all of the components in the power distribution system are vulnerable to electrical fires caused by series arcs. However, since the crew is on duty and there are fire alarms, the fires can be put out immediately. On the other hand, when the shipboards are at anchor with the engine stopped, the alarm system and drainage pump that connect in series with the battery are exposed to arc risk, which, in consequence, causes electrical fires.
Figure 5 shows two cases of DC series arcs occurring in the power distribution system on old shipboards, which were investigated by the National Forensic Service. It was confirmed that these fire accidents occurred because of the combustibles adjacent to the arc hot spot. It was also shown that the series arc faults in the power distribution system occurred as a result of the partial disconnection between the cords and the loose connection between the cord and the terminal.

3. Wavelet Transform and Multiresolution Analysis

In previous studies, DC series arcs were only analyzed in the frequency domain by fast Fourier transform. In this paper, wavelet transform (WT) was used to analyze the current signal of DC series arcs in the time and frequency domains simultaneously. The Fourier transform analyzes a signal by decomposing the signal into a family of complex sinusoids. In WT, a given signal is decomposed using the mother wavelet, by which the signal can be represented by the dilated and translated versions of a selected mother wavelet. Typical mother wavelets include Coiflet (coif), Daubechies (db), Symlet (sym) and Biorthogonal (bior) wavelets. The family of dilated and translated wavelets are given by
Ψ a , b = 1 a · Ψ ( t b a )
where Ψ ( t )   is the mother wavelet, a and b   are the scale factor and shift factor, respectively. a is used to modify the amplitude and duration of the prototype mother wavelet, by which the energies of the dilated wavelets are the same. b   is used to translate the modified mother wavelet in the time domain [28,29]. A mother wavelet with different values of   a and b is shown in Figure 6a, and Figure 6b is the corresponding modified wavelet presented in the frequency domain. It can be seen from Figure 6 that when a wavelet has a smaller value of a , its amplitude is higher, time duration is shorter, frequency bandwidth is wider and central frequency is higher. On the other hand, when a wavelet has a larger value of a , its amplitude is lower, time duration is longer, frequency bandwidth is narrower and central frequency is lower. As a result, a given signal in the time domain can be analyzed by decomposing it using a mother wavelet in both the time and frequency domains simultaneously.
Discrete wavelet transform based on multiresolution analysis was used to analyze the arc current signal [30,31,32,33,34]. In MRA, the given signal is decomposed by the mother wavelet into a specific level N with the corresponding low-pass filter (LPF) and high-pass filter (HPF). The signals passing the LPF generate a detail (D) component and those passing the HPF generate an approximation (A) component. By application of MRA, the input signal can be represented by the detail coefficients at each level (D1, D2, ···, Dn) and the approximation coefficients at the highest level (An) [35,36,37]. Figure 7 shows an example of multiresolution analysis resolving the signals into three layers. The downsampling of signals was performed by an HPF and an LPF, appearing as a detail coefficient and an approximation coefficient. The approximation component (A1) was resolved into the detail coefficient (D2) and approximation coefficient (A2) using downsampling through the filter to the next layer. The downsampling of the approximation coefficient (A2) was then performed at the next layer, with the process continuing up to the maximum decomposition level [35,36,37,38,39,40,41].

4. Experiment and Results

4.1. Experimental Setup

Figure 8 demonstrates the experimental setup. An arc generator and a load were connected in series with the 24 V DC mains. The arc generator was designed according to UL 1699 and IEC 62606 [6,7]. The electrodes consisted of carbon-copper wire that is specified in UL 1699 and cord-cord wire that causes fire accidents on shipboards. The starter motor used in shipboard power distribution systems and a resistive load were used. The current signal of the series arc was detected using a high-frequency current transformer (HFCT) (Pearson Electronics Inc., Palo Alto, CA, USA). The frequency range of the HFCT is 1–20 MHz. A digital storage oscilloscope (DSO) (YOKOGAWA, DL9140, Tokyo, Japan) and a data acquisition (DAQ) unit (National Instrument, USB-5133, Austin, TX, USA) were used for signal acquisition. The sampling rate and bandwidth of the DSO were 5 GS/s and 1 GHz. The sampling rate and bandwidth of the DAQ were 100 MS/s and 50 MHz, respectively.

4.2. DC Series Arc Analysis and Identification

4.2.1. Selection of the Optimal Mother Wavelet

For a mother wavelet, the phase and frequency should keep a linear relationship so that the time delay due to frequency is constant, to ensure that the arc signal is not distorted during decomposition or overlapping after signal reconstruction [42,43]. For evaluating the similarity between the arc signal pulse and the mother, the correlation coefficient γ is used, which is defined as
γ   = i = 1 N 1 [ X ( i ) X ¯ ] [ Y ( i ) Y ¯ ] i = 1 N 1 [ X ( i ) X ¯ ] 2 · i = 1 N 1 [ Y ( i ) Y ¯ ] 2
where X ( i ) is the single arc pulse and X ¯ is its mean value and Y ( i ) is the wavelet function and Y ¯ is the average value. The value of γ is between 0 and 1. A larger γ value means a greater similarity between the arc pulse and mother wavelet. Thus, the optimal wavelet should have the maximum correlation coefficient with the DC arc signal. It can be seen from the definition above, the single arc pulse and the wavelet should have the same length for calculating the correlation coefficient. However, since arc signals are commonly captured with a high sampling rate and the wavelet has a relatively short length, it is hard to ensure the same length for the two signals. Therefore, the following normalization procedures before calculating the correlation coefficient are necessary [44].
  • Set the maximum magnitudes of the arc signal X ( i ) and the mother wavelet function Y ( i ) to 1 by dividing the peak value;
  • Count the lengths of the arc signal and the mother wavelet, assuming the values to be j and k , respectively;
  • Resample the mother wavelet with a time interval of j / k , by which the two signals have the same length;
  • Detect the times of X ( i ) and Y ( i ) at their maximum points and shift Y ( i ) according to the time difference so that the maximum points are at the same time.
The result of the correlation coefficient calculation between the arc current pulse in the resistive load with a cord-cord fault and the mother wavelet is shown in Figure 9. The bior 3.1 wavelet exhibited the highest similarity with the arc current pulse. Further analysis of the arc current pulses in other loads with different faults is shown in Table 1. The optimal mother wavelet for analyzing the arc current pulse at different loads with different faults was consistently bior 3.1. Therefore, the bior 3.1 wavelet was selected as the optimal mother wavelet for analyzing the DC series arc in this work.

4.2.2. Arc Signal Decomposition

After the selection of the optimal mother wavelet, a frequency band of the arc current signal was analyzed by applying discrete wavelet transform using MRA. The sampling rate of the data acquisition unit was set at 1.25 MS/s, and the highest frequency of the detected current signal was 625 kHz. The corresponding frequency bands of each component are listed in Table 2, which verifies that the MRA interprets the decomposed components into a series of independent frequency bands by applying the downsampling method. In Table 2, components D1–D8 and A8 are shown as the final results of the MRA analysis, whereas A1–A7 are the intermediate processes.
Figure 10 shows the decomposition of the signal using multiresolution analysis and mother wavelet bior 3.1. The current signals were measured under both normal and arc conditions, such as cord-cord and carbon-copper. As seen in Figure 10, the top signal is the original arc current measured using a wideband current transformer, the bottom signals present the detail components D1 to D8 and the approximation component A8. Figure 10a shows the decomposition of current signals under normal conditions. The high-frequency noise signal was confirmed to appear in the detail components D6 to D8 and the approximation component A8. As seen in Figure 10b,c, the detail components D2 to D5 were related to the arc occurrence and could be used to identify the arc phenomenon. Based on these results, the detail components D2 to D5 were selected as the optimal frequency band to analyze the arc signal and were therefore used for signal reconstruction. Figure 11 shows the comparison of the normal and arc conditions after reconstruction using the detail components D2 to D5, thereby allowing identification of the arc fault.

4.2.3. Identification of DC Series Arc

The flowchart of the DC series arc identification is shown in Figure 12. The HFCT was used to detect the current of the power distribution system on shipboards. The signal was then decomposed by MRA and detail components D2–D5 were used for signal reconstruction. Two criteria were used to distinguish the arc condition and the normal condition, namely the signal magnitude and the signal energy. The signal energy of a given signal s(t) is defined as
Signal   energy = i = 1 K s ( t ) i 2
where K and i are the signal record length and a variable of length, respectively. Specifically, if the magnitude of the extracted signal ( I i ) is three times greater than the normal signal ( I o ), and the signal energy of the extracted signal ( E i ) is five times greater than the normal signal ( E o ), arc is considered to occur.
Figure 13 shows the power spectrum of the extracted signal. The signal energies of the normal and arc conditions in the cord-cord are 1.42 and 120.11, respectively, and 1.42 and 8.80 in the carbon-copper, respectively. Therefore, the signal energy can be used to distinguish the normal and arc conditions.

5. Conclusions

DC series arc is one of the main causes of electrical fires in the power distribution system of a shipboard, however, there is no effective method for detecting and identifying the arc on shipboards. In this paper, an experiment setup was configured to simulate a DC series arc on shipboards, which mainly consisted of an arc generator, resistive load and motor load. The arc current signal was detected by a HFCT and was analyzed by DWT. The correlation coefficient between single arc pulses and wavelets was calculated and compared, by which the optimal mother wavelet bior 3.1 was selected. By decomposing the arc signal using MRA, it was verified that the detail components D2–D5 were related to arc occurrence, and they were therefore used for signal reconstruction. In addition, a DC arc identification method was proposed based on the signal magnitude and the signal energy, by which arc occurrence could be predicted. The results from this paper are expected to be applied in the power distribution system of a shipboard to avoid potential electrical fires. Compared with other existing methods, the arc identification proposed in this paper has optimal frequency components to detect arc faults and specific values for the signal magnitude and the signal energy to identify arc conditions and normal conditions on a shipboard. However, the proposed method was verified under a restricted condition and it is therefore necessary to verify its performance for arc detection by applying it to various types of shipboards. Future work will pay attention to the development of a DC series arc detector for shipboards, which is composed of an HFCT and a microcontrol unit embedded in the proposed method.

Author Contributions

H.-K.J. and G.W. conceived and designed the experiments and algorithm; H.-K.J. performed the experiments; H.-K.J. and G.-S.K. analyzed the data; G.-S.K. was the supervisor of this work and provided the insight and technical expertise to improve the quality of this paper; H.-K.J. and G.W. wrote the paper. All authors have read and agreed to the published version of the manuscript.

Funding

This research was funded by the Technology Innovation Program (No. 20010965, Development of Electronic Current Voltage Transformer and Spacer based on eco-friendly solid insulation) funded by the Ministry of Trade, Industry and Energy (MOTIE) and the Korea Evaluation Institute of Industrial Technology (KEIT) of the Republic of Korea.

Conflicts of Interest

The authors declare no conflict of interest.

Abbreviations and Notations

AbbreviationsMeaningsNotationsMeanings
AApproximationdbDaubechies
ACAlternating CurrentbiorBiorthogonal
DDetailcoifCoiflet
DAQData AcquisitionsymSymlet
DCDirect Current Ψ ( t ) mother wavelet
DWTDiscrete Wavelet Transform a scale factor
DSODigital Storage Oscilloscope b shift factor
FFTFast Fourier Transform γ correlation coefficient
HFCTHigh Frequency Current Transformer X ( i ) arc signal
HPFHigh-Pass Filter Y ( i ) mother wavelet function
LPFLow-Pass Filter j length of arc signal
MRAMultiresolution Analysis k length of mother wavelet
ULUnderwriters Laboratories
WTWavelet Transform

References

  1. National Fire Data System. Available online: http://www.nfds.go.kr/ (accessed on 10 October 2020).
  2. Korean Maritime Safety Tribunal. Available online: https://www.kmst.go.kr/kmst/statistics/annualReport/selectAnnualReportList.do#a (accessed on 2 September 2020).
  3. John, J.S. Condition for series arcing phenomena in PVC Wiring. IEEE Trans. Compon. Packag. Manuf. 2007, 30, 532–537. [Google Scholar] [CrossRef]
  4. George, D.G.; Gary, W.S. The arc-fault circuit interrupter: An emerging product. IEEE Trans. Ind. Appl. 1998, 34, 928–933. [Google Scholar] [CrossRef]
  5. Moon, W.S.; Kim, J.C.; Jo, A.; Bang, S.B.; Koh, W.S. Ignition characteristics of residential series arc faults in 220-V HIV wires. IEEE Trans. Ind. Appl. 2015, 51, 2054–2059. [Google Scholar] [CrossRef]
  6. Underwriters Laboratories. UL 1699 Standard for Arc-Fault Circuit-Interrupters, 3rd ed.; UL: Northbrook, IL, USA, 2017. [Google Scholar]
  7. International Electrotechnical Commission. IEC 62606 General Requirements for Arc Fault Detection Devices. 2017. Available online: https://webstore.iec.ch/publication/59947 (accessed on 10 October 2020).
  8. Sultan, A.F.; Swift, G.W.; Fedirchuk, D.J. Detecting arcing downed-wires using fault current flicker and half-cycle asymmetry. IEEE Trans. Power Deliv. 1994, 9, 461–470. [Google Scholar] [CrossRef]
  9. Jiang, J.; Wen, Z.; Zhao, M.; Bie, Y.; Li, C.; Tan, M.; Zhang, C. Series arc detection and complex load recognition based on principal component analysis and support vector machine. IEEE Access. 2019, 7, 47221–47229. [Google Scholar] [CrossRef]
  10. Lezama, J.; Schweitzer, P.; Weber, S.; Tisserand, E.; Joycux, P. Arc fault detection based on temporal analysis. IEEE 60th Holm Conf. Elect. Contacts 2014, 1–5. [Google Scholar] [CrossRef]
  11. Lezama, J.; Schweitzer, P.; Tisserand, E.; Humberta, J.-B.; Webera, S.; Joyeux, P. An embedded system for AC series arc detection by inter-period correlations of current. Electr. Power Syst. Res. 2015, 129, 227–234. [Google Scholar] [CrossRef]
  12. Zhang, S.; Zhang, F.; Liu, P.; Han, Z. Identification of low voltage AC series arc faults by using Kalman filtering algorithm. Elektron. Elektrotech. 2014, 20, 51–56. [Google Scholar] [CrossRef] [Green Version]
  13. Sedighizadeh, M.; Rezazadeh, A.; Elkalashy, N. Approaches in high impedance fault detection a chronological review. Adv. Electr. Comput. Eng. 2010, 10, 114–128. [Google Scholar] [CrossRef]
  14. Wang, S.; Wu, C.; Wang, Y. Detection of arc fault on low voltage power circuits in time and frequency domain approach. Int. J. Circuits Syst. Signal Process. 2012, 6, 324–331. [Google Scholar]
  15. Yao, X.; Herrera, L.; Yue, L.; Cai, H. Experimental study of series DC arc in distribution systems. IEEE Energy Convers. Congr. Expo. (ECCE) 2018, 3713–3718. [Google Scholar] [CrossRef]
  16. Georgijevic, N.L.; Jankovic, M.V.; Srdic, S.; Radakovic, Z. The detection of series arc fault in photovoltaic systems based on the arc current entropy. IEEE Trans. Power Electron. 2016, 31, 5917–5930. [Google Scholar] [CrossRef]
  17. Le, V.; Yao, X.; Miller, C.; Tsao, B.H. Series DC Arc Fault Detection Based on Ensemble Machine Learning. IEEE Trans. Power Electron. 2020, 35, 7826–7839. [Google Scholar] [CrossRef]
  18. Xiong, Q.; Ji, S.; Zhu, L.; Zhong, L.; Liu, Y. A novel DC arc fault detection method based on electromagnetic radiation signal. IEEE Trans. Plasma Sci. 2017, 45, 472–478. [Google Scholar] [CrossRef]
  19. Xiong, Q.; Ji, S.; Liu, X.; Li, X.; Zhu, L.; Feng, X.; Gattozzi, A.L.; Hebner, R.E. Electromagnetic radiation characteristics of series DC arc fault and its determining factors. IEEE Trans. Plasma Sci. 2018, 46, 4028–4036. [Google Scholar] [CrossRef]
  20. Fitrianto, M.I.; Wahjono, E.; Anggriawan, D.O.; Prasetyono, E.; Mubarok, R.H.; Tjahjono, A. Identification and Protection of Series DC Arc Fault for Photovoltaic Systems Based on Fast Fourier Transform. Int. Electron. Symp. (IES) 2019. [Google Scholar] [CrossRef]
  21. Wang, Y.; Zhang, F.; Zhang, S. A new methodology for identifying arc fault by sparse representation and neural network. IEEE Trans. Instrum. Meas. 2018, 67, 1–12. [Google Scholar] [CrossRef]
  22. Ji, H.K.; Wang, G.; Kim, W.H.; Kil, G.S. Optimal Design of a Band Pass Filter and an Algorithm for Series Arc Detection. Energies 2018, 11, 992. [Google Scholar] [CrossRef] [Green Version]
  23. Yang, K.; Zhang, R.; Yang, J.; Liu, C.; Chen, S.; Zhang, F. A novel arc gault detector for early detection of electrical fires. Sensor 2016, 16, 500. [Google Scholar] [CrossRef]
  24. Carlos, E.R. Arc Fault Detection and Discrimination Methods. In Proceedings of the IEEE Holm Conference on Electrical Contacts, Pittsburgh, PA, USA, 16–19 September 2007; pp. 115–122. [Google Scholar]
  25. Lin, Y.H.; Liu, C.W.M.; Chen, C.S. A new PMU-based fault detection/location technique for transmission lines with consideration of arcing fault discrimination-part I: Theory and algorithms. IEEE Trans. Power Deliv. 2006, 19, 1587–1593. [Google Scholar] [CrossRef]
  26. Naidu, M.; Thomas, J.S.; Suresh, G. Arc fault detection scheme for 42-V automotive DC networks using current shunt. IEEE Trans. Power Electron. 2006, 21, 633–639. [Google Scholar] [CrossRef]
  27. George, D.G.; Kon, W.; Robert, F.D. More about Arc-Fault Circuit interrupter. IEEE Trans. Ind. Appl. 2004, 40, 1006–1011. [Google Scholar] [CrossRef]
  28. Zhang, H.; B1ackburn, T.R.; Phung, B.T.; Sen, D. A Novel Wavelet Transform Technique for On-line Partial Discharge Measurements Part I: WT De-noising Algorithm. IEEE Trans. Dielectr. Electr. Insul. 2007, 14, 3–14. [Google Scholar] [CrossRef]
  29. Satish, L.; Nazneen, B. Wavelet-based Denoising of Partial Discharge Signals Buried in Excessive Noise and Interference. IEEE Trans. Dielectr. Electr. Insul. 2003, 10, 354–367. [Google Scholar] [CrossRef] [Green Version]
  30. Wang, G.M.; Kim, S.J.; Kil, G.S.; Kim, S.W. Optimization of wavelet and thresholding for partial discharge detection under HVDC. IEEE Trans. Dielectr. Electr. Insul. 2017, 24, 200–208. [Google Scholar] [CrossRef]
  31. Moula, B.; Mekhaldil, A.; Teguar, M.; Haddad, A. Characteristics of discharge on non-uniformly polluted glass surface using a wavelet transform approach. IEEE Trans. Dielectr. Electr. Insul. 2013, 20, 1457–1466. [Google Scholar] [CrossRef]
  32. Ucar, F.; Alcin, O.F.; Dandil, B.; Ata, F. Power quality event detection using a fast extreme learning machine. Energies 2018, 11, 145. [Google Scholar] [CrossRef] [Green Version]
  33. Antonino-Daviu, J.; Riera-Guasp, M.; Roger-Folch, J.; Martinez-Jimenez, F.; Peris, A. Application and optimization of the discrete wavelet transform for the detection of broken rotor bars in induction machines. Appl. Comput. Harmon. Anal. 2006, 21, 268–279. [Google Scholar] [CrossRef] [Green Version]
  34. Hernandez, J.C.; Antonino-Daviu, J.; Martinez-Jimenez, F.; Peris, A. Comparison of different wavelet families for broken bar detection in induction motors. In Proceedings of the 2015 IEEE International Conference on Industrial Technology (ICIT), Seville, Spain, 17–19 March 2015; pp. 3220–3225. [Google Scholar] [CrossRef]
  35. Chang, H.H.; Linh, N.W. Statistical feature extraction for fault locations in nonintrusive fault detection of low voltage distribution systems. Energies 2017, 10, 611. [Google Scholar] [CrossRef] [Green Version]
  36. Xu, Z.; Tang, J.; Sun, C. Application of complex wavelet transform to suppress white noise in GIS UHF PD Signals. IEEE Trans. Power Deliv. 2007, 22, 1498–1504. [Google Scholar] [CrossRef]
  37. Wang, G.M.; Kil, G.S.; Ji, H.K.; Lee, J.H. Disturbance elimination for partial discharge detection in the spacer of gas-insulated switchgears. Energies 2017, 10, 1762. [Google Scholar] [CrossRef] [Green Version]
  38. Chang, C.S.; Jin, J.; Chang, C.; Hoshino, T.; Hanai, M.; Kobayashi, N. Separation of corona using wavelet packet transform and neural network for detection of partial discharge in gas-insulated substations. IEEE Trans. Power Deliv. 2005, 20, 1363–1369. [Google Scholar] [CrossRef]
  39. Ji, H.K.; Cho, Y.J.; Wang, G.; Hwang, S.C.; Kil, G.S. Extraction of Series Arc Signals Based on Wavelet Transform in an Indoor Wiring System. Trans. Electr. Electron. Mater. 2017, 18, 221–224. [Google Scholar] [CrossRef]
  40. Imoru, O.; Bhaskar, M.A.; Jimoh, A.A.-G.; Hamam, Y. Diagnosis of stator shorted-turn faults in induction machines using discrete wavelet transform. Afr. J. Sci. Technol. Innov. Dev. 2017, 9, 349–355. [Google Scholar] [CrossRef]
  41. Gritli, Y.; Lee, S.B.; Filippetti, F.; Zarri, L. Advanced diagnosis of outer cage damage in doublesquirrel-cage induction motors under time-varying conditions based on wavelet analysis. IEEE Trans. Ind. Appl. 2014, 50, 1791–1800. [Google Scholar] [CrossRef]
  42. Ma, X.; Zhou, C.; Kemp, I.J. Interpretation of Wavelet Analysis and Its Application in Partial Discharge Detection. IEEE Trans. Dielectr. Electr. Insul. 2002, 9, 446–457. [Google Scholar] [CrossRef] [Green Version]
  43. Cunha, C.F.; Carvalho, A.T.; Lima, A.C. A New Wavelet Selection Method for Partial Discharge Denoising. Electric Power Syst. Res. 2015, 125, 184–196. [Google Scholar] [CrossRef]
  44. Jian, L.; Tianyan, J.; Stanislaw, G.; Changkui, C. Scale Dependent Wavelet Selection for De-noising of Partial Discharge Detection. IEEE Trans. Dielectr. Electr. Insul. 2011, 17, 1705–1714. [Google Scholar] [CrossRef]
Figure 1. Occurrence rates of electrical fire causes in Korea (2017~2019).
Energies 13 05973 g001
Figure 2. Types of arc faults. (a) series arc; (b) parallel arc.
Energies 13 05973 g002
Figure 3. Typical current signal of series arc. (a) under AC voltage; (b) under DC voltage.
Energies 13 05973 g003aEnergies 13 05973 g003b
Figure 4. Power distribution system on shipboards. (a) photograph; (b) diagram.
Energies 13 05973 g004aEnergies 13 05973 g004b
Figure 5. Fire accidents caused by DC series arcs on shipboards. (a) case 1; (b) case 2.
Energies 13 05973 g005
Figure 6. Dilation and translation of a mother wavelet. (a) time domain; (b) frequency domain.
Energies 13 05973 g006
Figure 7. Decomposition of a signal into three levels using multiresolution analysis.
Energies 13 05973 g007
Figure 8. Experimental setup. (a) circuit; (b) photograph.
Energies 13 05973 g008aEnergies 13 05973 g008b
Figure 9. Correlation coefficient calculation. (a) arc current pulse in the resistive load with a cord-cord fault; (b) result of optimal mother wavelet selection.
Energies 13 05973 g009
Figure 10. Decomposition of the current signal. (a) normal status; (b) arc status (cord-cord); (c) arc status (carbon-copper).
Energies 13 05973 g010aEnergies 13 05973 g010b
Figure 11. Extraction of the arc signal. (a) cord-cord; (b) carbon-copper.
Energies 13 05973 g011
Figure 12. Flowchart of DC series arc identification.
Energies 13 05973 g012
Figure 13. Power spectrum of the extracted signal. (a) cord-cord; (b) carbon-copper.
Energies 13 05973 g013aEnergies 13 05973 g013b
Table 1. Results of optimal mother wavelet selection.
LoadSeries Arc FaultOptimal Mother WaveletCorrelation Valve
Resistive loadCord-cordbior 3.10.491
Carbon-copperbior 3.10.313
MotorCord-cordbior 3.10.436
Carbon-copperbior 3.10.402
Table 2. Frequency bands of components at each level.
LevelFrequency (kHz)
Approximation (A)Detail (D)
10–312.5312.5–625
20–156.25156.25–312.5
30–78.12578.125–156.25
40–39.062539.0625–78.125
50–19.5312519.53125–39.0625
60–9.7656259.765625–19.53125
70–4.88281254.8828125–9.765625
80–2.441406252.44140625–4.8828125
Publisher’s Note: MDPI stays neutral with regard to jurisdictional claims in published maps and institutional affiliations.

