Abstract
This paper describes Smiling Earth, a mobile app to increase citizens’ awareness about their own carbon footprint, by integrating energy and transport-related data. The main aim of our work is to explore the ways in which Information and Communication Technologies could help raise awareness and educate and motivate citizens about their actions and their consequences on the environment. Smiling Earth provides feedback to users by visualising data about their daily activities with the aim to motivate citizens to change their behaviour to reduce their CO2 emissions by adopting a healthier lifestyle. The value of the Smiling Earth for individuals, cities and communities is discussed. The feedback from an expert evaluation and how Smiling Earth could contribute to Positive Energy Districts are also discussed.
1. Introduction
The success of a smart and sustainable city development needs integrated solutions on energy, transport, service and governance, with the full involvement of multiple stakeholders, governments, enterprises and citizens. Recent research has focussed on a number of different technological solutions, such as sensors and Internet of Things [1], data analytics and Machine Learning, to monitor and control various aspects of a city. However, motivation and engagement of one of the most important stakeholders, the citizen, are not always in focus, and when they are, they often focus on one aspect only, such as energy [2] or transport [3].
A large part of the responsibility for meeting the United Nations (UN) Sustainable Development Goals (SDG), reducing energy consumption and climate change mitigation, has been taken on by municipalities. Policies and strategies are defined often at the national, European or global levels. In Europe, the Covenant of Mayors (CoM) initiative, which includes several cities, aims to identify how European policy could be enacted at the local authorities’ level. They have made commitments to, for example, reduce their Carbon Dioxide (CO2) emissions or transition to cleaner forms of energies, and set targets for them [4]. While this is a step to enacting policies, it is still a challenge to make individual citizens aware of their responsibilities for mitigating climate change.
A large part of greenhouse gas emissions which contribute to climate change come from transportation, electricity and heating. Households have multiple opportunities to reduce their carbon footprint, including energy conservation behaviours, the use of more energy-efficient vehicles or the installation of insulation products. Statistics from Norway [5] show that on average, 50% of households’ incomes are spent on energy, transportation and housing. Transportation has been identified as one of the biggest contributors to CO2 emissions [3]. Better energy and transportation management can lead to savings, and in Norway, transport is one of the sectors where most cuts in CO2 emissions will be made in the near future [6].
The recent European focus on achieving Positive Energy Districts (PED) has increased the interest around energy efficiency, e.g., large European consortiums including private and public partners such as the EU H2020 +CityxChange (Positive Energy Exchange) project [7]. A PED is described in the European Strategic Energy Technology (SET-Plan) as “a district with annual net zero energy import, and net zero CO2 emissions working towards an annual local surplus production of renewable energy” [8]. The PED concept is closely intertwined with the built environment and aims to achieve PED through energy efficiency in buildings, flexible energy consumption within districts and through local or regional supply of renewable energy. The SET-Plan identifies a broad spectrum of stakeholders in the context of PED and recognises citizens as a significant actor. In particular, the role of citizens in the energy exchange and energy trading activities, as prosumers and not only as consumers, is a major step towards citizen participation in achieving a PED. However, it is not clear how individual citizens could relate to contributing to a PED or a Zero Emission Neighbourhood (ZEN) [9] as a part of their lifestyle and daily activities.
Communicating the reality of climate change and its consequences has been a challenge and researchers and public authorities have tried to address this in many ways. Some of these include disseminating information, perhaps through mass media, assuming that information will inspire citizens to make good choices, attempts to motivate people by fear and visions of potential catastrophe and scientific framing of issues and impacts of climate change [10]. Increased energy literacy appears to be a popular strategy, by using persuasive technologies, data and visualisation to inform and make the users aware of their behaviour and the consequent emissions [11,12,13]. Informing consumers about energy consumption, either as direct or indirect feedback through displays and other means, has been identified as a means of raising awareness and influencing behaviour [14]. Games and game mechanics have also been popular strategies to motivate citizens as well as to provide feedback to them. Several types of incentives have also been identified, which address individuals as well as social aspects, and economic incentives appear to be popular [2]. Some of the shortcomings of existing communication and persuasion approaches about climate change are the lack of identification and support for the ways in which individuals and society in general could take action to address climate change and reflect on their actions and their consequences [10,15]. Furthermore, it is important for individuals to be able to see how their behaviours relate to the bigger context of climate change and sustainability.
The main aim of our work is to explore how Information and Communication Technologies (ICT) could help raise awareness, educate and motivate citizens about their actions and how they could impact the environment. We believe that an increased awareness among citizens about their own carbon footprint could contribute to help achieve the central aim of the Paris Agreement, which is to keep a global temperature rise below 2 °C [16]. Furthermore, raising awareness among citizens and providing feedback about how they could contribute to climate change through their daily activities are an important part of achieving PED and ZEN, to ensure alignment of citizens’ behaviours and the current research activities within PED and ZEN, e.g., the Norwegian Research Centre on ZEN [9]. Thus, support towards changing citizens’ behaviours towards a lower daily carbon footprint could make a significant impact on the environment. More specifically, in our work, we have focused on affecting citizens’ behaviour to switch to less carbon-intensive modes of transport, such as electrical vehicles [17], walking or cycling, which would also contribute to their general well-being. We believe that this is a relevant step towards sustainable societies.
The Smiling Earth, a pervasive mobile app, is designed to visualise data about citizens’ activities and to motivate citizens to change their behaviour to reduce their CO2 emissions by adopting a healthier lifestyle. The app takes a broader perspective of CO2 emissions, bringing together the transport and energy sectors. In addition, citizens (the users of the app) are provided information and feedback about how their choices of daily activities (e.g., transportation modes) could affect the environment as well as their own health. Emphasis was given to closing the gap between science or information and specific actions citizens could take. The initial version of Smiling Earth was designed to support individuals, which was further enhanced to support the social or community aspects. The Smiling Earth app was developed within the EU H2020 project, DESENT (grant agreement No. 693443).
The paper discusses the value of the Smiling Earth for individuals, cities and communities, through raising awareness about one’s own carbon footprint and how citizens’ actions through their daily choices could mitigate climate change. The paper also presents a qualitative evaluation of the relevance of bringing together transport- and energy-related data and visualising it and discusses the value of Smiling Earth to stakeholders outside of the DESENT project, based on semi-formal interviews.
The rest of this paper is organised as follows: Section 2 describes the DESENT project, Section 3 provides an overview of related work, Section 4 describes the research method and the design and development process for Smiling Earth, Section 5 describes the Transtheoretical Model of Behaviour Change, Section 6 describes the Smiling Earth mobile app, Section 7 describes the evaluation method, Section 8 presents the results of the evaluation and discusses them, Section 9 discusses and reflects on the feedback from the evaluation and Section 10 concludes the paper.
2. DESENT Project
Smart City-related research often focuses on silos or specific application domains. Smart City solutions and applications that leverage on the integration of several domains such as transport, energy, service and governance, and engage multiple stakeholders, such as governments, citizens, private and public entities, are important. The European H2020 project, DESENT (grant agreement No. 693443), focuses on providing a smart decision support tool for urban energy and transport, by developing innovative approaches and by utilising new and emerging technologies [18]. The DESENT consortium includes a diverse set of partners consisting of universities, research institutes, municipalities and private companies from three European countries (Austria, The Netherlands and Norway). DESENT was designed to support smart decision-making for policy makers and personalised services for citizens.
One of the main aims of DESENT is to integrate transportation and energy data to motivate citizens to change their daily habits by making better climate-related decisions. Energy companies and electricity grid owners are a part of the project consortium, who could leverage on this data and take the initiative to motivate behaviour change of their current and potential customers. The bigger context of using energy and transportation data to affect citizens’ lives is shown in Figure 1.
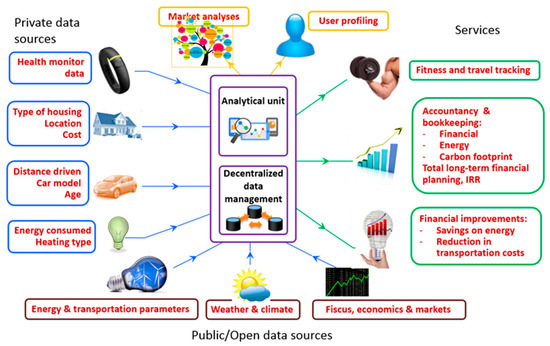
Figure 1.
DESENT Smart Energy and lifestyle vision.
3. Related Work
Environmental sustainability and the use of ICT for informing, educating and affecting the behaviour of citizens have been the focus of several researchers. A variety of applications to promote the reduction of CO2 through different activities have been developed, for example, EcoIsland is an application that promotes the reduction of CO2 for individuals and families and it uses individual psychological incentives, social incentives and learning-related features [2,19]. Ducky is another application that quantifies, visualises and communicates everyday activities of individuals and communities that relate to climate, with the aim of increasing knowledge and awareness among citizens about their CO2 emissions [13]. Both these examples focus on reducing energy consumption and use self-reporting as the means to capture users’ behaviours. An example of an application that supports greener transportation is a gamified, in-car interface for motivating eco-driving, where feedback and rewards are used to motivate drivers to adopt eco-driving patterns for reducing emissions [20].
Mobile technologies and mobile phone apps have been popular in drawing the attention of individuals and engaging individuals on climate-related issues [21]. Such pervasive technologies address issues related to sustainability and climate change by encouraging greener transportation. A mobile application designed for tracking green transportation choices, UbiGreen, tracks an individual’s transport options, such as walking or carpooling, and uses visual metaphors to provide feedback to the users [3]. In fact, metaphors are seen as a powerful means of communicating and providing feedback to the users, e.g., UbiGreen uses a metaphor from nature as the “wall paper”. Based on the user’s choices, the metaphor changes: one of the metaphors was a polar bear on an iceberg, where the iceberg increases in size if the individual makes greener transportation choices [22]. EcoIsland uses the metaphor of an island, whose water level rises if the users report activities that emit high levels of CO2.
Several studies have shown that gamification can also be an effective means of engaging with diverse stakeholders and to improve knowledge among citizens, changes in public policy and behavioural change [23]. MUV (which stands for Mobility Urban Values) is a gamified mobile app that focuses on urban mobility, which is developed to encourage people to adopt sustainable mobility modes in the awareness of their potential role as agents of urban livability [24,25]. TrafficO2 is another mobile info-mobility decision support system, designed to encourage commuters towards more sustainable kinds of mobility by offering tangible incentives for more responsible choices [24]. These applications reward users based on their daily transportation choices, e.g., TrafficO2 rewards users with O2 points.
Most applications seem to focus on household-related energy consumption or transportation choices, while only a few attempt to provide a more integrated overview of emissions. Ducky takes a broad approach of supporting an eco-friendly lifestyle, e.g., by taking into account what one eats. An example that takes a broad perspective of the lifestyle is the Carbon Footprint Mobile App prototype described in [26], which is designed to help users to manage and maintain their daily carbon footprint by measuring their daily CO2 emissions. The app acts as a self-tracking device and provides real-time data regarding an individual’s daily carbon emissions. The app’s design takes into account a user’s CO2 emissions related to clothing, food, household and transportation. The concept of betting is used to help users make a commitment to change their behaviours. While these applications provide data related to a user’s carbon footprint and some provide feedback on the impacts to the environment, e.g., through the visual metaphors, we did not find applications that made citizens aware of the relationship of their actions towards achieving the global sustainability goals. Furthermore, several applications focused on making users aware of their actions through the self-reported or captured data and did not support users’ estimate and plan to change their behaviour through informed sustainable choices.
4. Research Methods and Design Process
The overall research methodology that was used is the Design Science Research Method (DSRM) [17]. The context of our design or opportunity space has been the need to increase citizens’ awareness about their own carbon footprints by integrating energy- and transport-related data. The design and development process for Smiling Earth is illustrated in Figure 2. Leveraging on the access to an energy company, one of the partners in the consortium, we adopted a participatory design approach to design and develop the Smiling Earth pervasive mobile app. An agile iterative process and rapid prototyping, using the Proto.io tool, was followed to refine the concept and design of Smiling Earth, before it was developed. A series of formative evaluation workshops using the interactive prototype were conducted with energy experts, business and technical people from the energy company and a group of university students. The focus during the iterative design and formative evaluations was on usability and if the users understood the concepts. The design was improved based on the feedback from the studies. In the first phase of the development, Smiling Earth was focussed on affecting individuals’ behaviour only. The feedback from summative evaluations, conducted with a group of university students and project partners, indicated that the concept of Smiling Earth was easy to understand, that it increased their awareness of their own carbon footprint and they are likely to use the app. Details of these evaluations are reported in References [27,28].
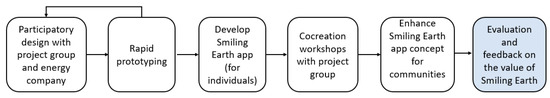
Figure 2.
Overall design and evaluation process. The shaded box indicates the evaluation results reported in this paper.
Feedback from the project partners also indicated that it was desirable if Smiling Earth could affect the collective behaviour of a community of people, perhaps by including gamification or other motivational features. To enhance Smiling Earth from a mobile app for individuals to one for a community, we engaged with the project partners in a series of gamification and co-creation workshops, to design the enhanced functionalities in the app. The participants of the co-creation workshops included energy companies, transport researchers and people from two European municipalities from Austria and The Netherlands. The co-creation workshops used a set of social gamification cards, developed in the EU My Neighbourhood project, to co-design services in the public sector [29]. These workshops identified specific user groups, what their motivations may be and how they may be motivated to change their behaviour.
Sketches of the user interface for the enhanced Smiling Earth, to support a community of users, were then evaluated by people outside of the DESENT project, to evaluate if and how Smiling Earth could contribute to achieving PED and ZEN, and to obtain feedback on the benefits of Smiling Earth beyond the DESENT project. The section on evaluation and results will provide a detailed description of the evaluation method and process.
5. Behaviour Change
Designing technologies for affecting the behaviour change of individuals and communities require an understanding of what a change in behaviour means and how a change may be detected. Addressing an individual’s attitude and their social norms are identified as important aspects of addressing behaviour change in the Theory of Planned Behaviour (TPB) by (Ajzen, 1991), as reported in References [30]. TPB and enhanced versions of this model have been used by researchers for affecting behaviour [31]. A comprehensive model for addressing the global environmental challenges and for modelling the behaviour of individuals was proposed by Kløckner, which is based on several existing theories [30]. Another popular model is the Transtheoretical Model (TTM), designed for individuals and intentional decision-making, and identifies six stages of changes an individual goes through [32]. It has been used in many health and behaviour change-related studies, e.g., to stop smoking [33]. It was developed through observations of behaviour in health/behaviour changes and recognises that individuals go through stages in changing their behaviour. Thus, this seemed an appropriate model to support changes in behaviour related to daily activities, which people have had for several years. Smiling Earth was designed as a smart decision-making tool for citizens and to affect behaviour change by taking action, and we have used TTM in our work.
The TTM model proposes six stages of behaviour change, where the first three stages propose that individuals contemplate on something before they take action, and eventually these actions become more regular and turn into a habit. The six stages of TTM are illustrated in Figure 3 and can be described as follows:
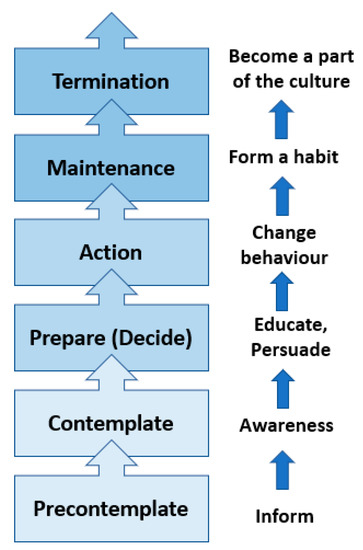
Figure 3.
The Transtheoretical Model (TTM) and the behaviour change process.
- Precontemplation: individuals may not consider changing their behaviour, which may be due to a lack of awareness of the consequences of their behaviour.
- Contemplation: individuals may intend to change their behaviour, but not immediately, and are more aware of the benefits of changing their behaviour.
- Preparation: individuals are intending to take action in the near future.
- Action: a change is observable, though individuals have to work hard to keep their new behaviour.
- Maintenance: keeping the new behaviour is easier, but individuals may be tempted to revert back to their previous behaviour.
- Termination: there is no more risk for individuals to revert back to their previous behaviour.
We have adopted TTM as the conceptual framework for our design to support behaviour change through Smiling Earth. The first phase is to inform users and raise their awareness and then to persuade them to decide to change their behaviour. Following this, users must be supported to take action and continue to take action until it becomes a habit or a practice. Finally, support them to take the desired actions until it becomes a part of their lives.
One of the advantages of using stage models such as TTM is that it is easier to design technologies with the intent to address one or more of the stages. By understanding behaviour changes as stages of changes, it helps to recognise if the technology (or the intervention) has the potential to affect the behaviour in any way, e.g., even if the desired end result has not been achieved, rather than concluding that it has no effect, an evaluation using the TTM could discover that the intervention had encouraged stage progression, if not actual behavioural change [34].
One of the weaknesses of this model with respect to the evolution of Smiling Earth to support communities of people is that TTM was designed to support individuals and does not take into account the social context and thus, for our further work, we will consider other models that are better suited for collective behaviour change.
6. Description of Smiling Earth
The main concepts that have influenced the design of Smiling Earth were CO2 emissions, environmental impact, health benefits and economic profit. The Graphical User Interface (GUI) for the main screen is designed to reflect these concepts and draw the user’s attention to CO2 emissions and its impact on the world we live in (see Figure 4.). We have used the earth as a metaphor, which appears in the centre of the screen. This metaphor is used to create an emotional attachment [22] and to show the impact of a high carbon footprint on the earth (global warning) which may be caused by the user’s actions.
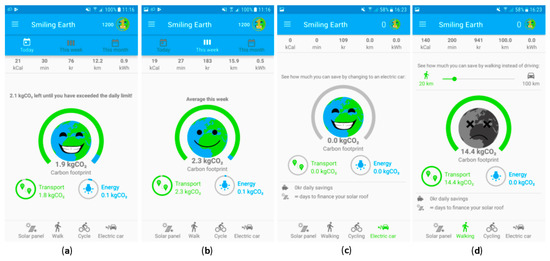
Figure 4.
Smiling Earth concept, Graphical User Interface (GUI) and the Earth metaphor. (a) shows a very happy earth due to low CO2 emissions; (b) shows a less happy face as the CO2 emissions increase; (c) shows a happy earth due to low CO2 emissions from an electrical vehicle and (d) shows a very miserable earth due to a high level of CO2 emissions.
Smiling Earth tracks a user’s movements using the Global Positioning System (GPS) and Google’s Activity Recognition Application Programming Interface API to determine if the user is walking, cycling or in a vehicle. Furthermore, the household energy consumption is determined by energy classification of buildings, which are available through the public records in Norway and Austria. Users can provide information related to their profile, such as the energy source(s) in their houses (which is at the household level), and the type(s) of vehicle(s) they own. These data are used to estimate a user’s daily energy consumption, and thus an estimation of their daily carbon footprint. The estimations are based on statistical data [35] and analyses conducted by SINTEF Energy and the DESENT partners. Since the main aim of Smiling Earth was to raise awareness and to support an individual to relate the impacts of their own activities to the 2 °C target, the focus was not on collecting real-time data.
The main screen for Smiling Earth shows the dashboard for the app, which is shown in Figure 4a–d. These screens show the estimates of daily values of CO2 emissions from domestic heating and transportation. The circular indicator provides information about the current value of CO2 emissions in kg of CO2. The daily value is indicated by the number in the circle. The circular progress bar for each circular indicator shows the estimated value relative to the maximum allowed level of emissions, aimed to motivate the users to keep their CO2 emissions below this maximum amount. The daily goal for the CO2 limit is 4 kg CO2 for the carbon footprint. The screenshots in Figure 4 show three possible states (out of five) for the earth metaphor: Figure 4a shows a very happy earth due to low emissions with respect to the maximum level, Figure 4b shows a happy face, although less happy than Figure 4a as the CO2 emissions are closer to the maximum than in Figure 4a,d shows a very miserable picture of the earth because of the high level of emissions, which is much greater than the maximum level.
The colours blue and green have been used in the Graphical User Interface (GUI): blue indicates estimated values that are related to housing (such as the household heating and electricity consumption) and green indicates estimated values which are related to transportation, such as walking, cycling or electrical vehicles (EVs).
Figure 4c,d show estimated values of CO2 emissions, based on the user’s selection of a transportation or heating mode. The symbols on the bottom of the screen are “estimation buttons”, from left to right, for solar panels, walking, cycling and an electrical vehicle. By selecting an “estimation button”, the relevant values will be shown. For example, in Figure 4c, the estimated value for CO2 emission by selecting an electrical vehicle is shown as 0.0 kg. Similarly, the estimated value for CO2 emission from walking while either sometimes driving a non-electrical vehicle or using conventional heating could lead to a higher CO2 emission, as shown in Figure 4d. The estimation capability is also used to support users to set short- or long-term goals, so that they could estimate how much they could reduce their carbon footprint, save (money) or burn calories over time. This is aimed to support users’ plan for a bigger transition over time, through their daily activities.
A menu on the top left of the screen shows the users their estimated CO2 emissions and other estimated values such as the amount of money they could save (in Norwegian krones) and calories burnt, over a period of time, e.g., a week, month or year. The visualisation of CO2 emissions for a week and for a month are shown in Figure 5. The red horizontal line marks the maximum limit of CO2 emissions, to encourage users to keep their total below that level. The blue and green colours indicate the emissions due to household actions or transportation actions, e.g., Figure 5a shows that 5 kg of CO2 out of the total of 8 kg were from household activities. Bar graphs are used to visualise the data for a week while the continuous graph shown in Figure 5b seemed a better visualisation of the data for a longer time period, such as a month or a year.
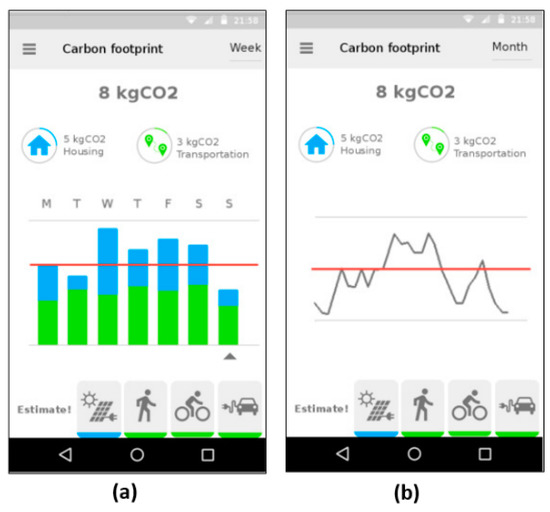
Figure 5.
Smiling Earth—CO2 emissions data visualisation. (a) shows CO2 for a week and (b) shows CO2 emissions for a month.
A detailed description of Smiling Earth is available from Reference [36]. The Smiling Earth is designed to run in the background on a mobile phone, and the sensors on the phone will detect a user’s movements to estimate the energy consumption from mobility. The app is designed to minimise the information that a user has to provide and utilises data that are openly available, e.g., in Norway, it is possible to access information about vehicles registered under the name of each person and in Austria, the age of a building provides the relevant information for estimating the energy consumption of the building.
Smiling Earth for Communities
Supporting a community of users was considered as an important element to motivate users to continue using the app and to achieve behaviour change, i.e., continue taking action to form new habits and making those a part of their daily lives, as illustrated in Figure 3. Thus, based on the input from the co-creation workshops with the project partners, the design of Smiling Earth was enhanced to support the social and community aspects. Some of the ideas that emerged from the co-creation workshops are described below:
- Motivate young people to start using Smiling Earth and continue using it, by making them feel a sense of belonging to the community. Users could be encouraged by recognising their use of the app by showing progression levels and by recognising frequent users as Heroes (within the (user) community)).
- Motivate older users to continue using Smiling Earth. The means of motivating older and younger users may be different. The sense of achievement and belonging may motivate older users. Hence, older users could be given a “gift” through the app, for walking rather than using the car, thus also promoting a healthier lifestyle.
- Motivate car owners to use their cars less by providing a visualisation of how they fare among other users in the community and visualising this. Users could also be motivated by rewarding them, for example with “Earth coins” or a digital or virtual currency that could be exchanged to perhaps a monetary value, a free bus ticket or a voucher, to get them onboard.
The design of the new features aimed to motivate all users while avoiding disappointing any users. The social game mechanic, Leaderboard, was incorporated to show users that were leading in many ways, e.g., one possibility could be based on the carbon footprint of the users while another possibility could be the number of Earth coins (analogous to points) earned by a user; see Figure 6. Users are able to give away some of their Earth coins to other users as a means of encouraging peers.
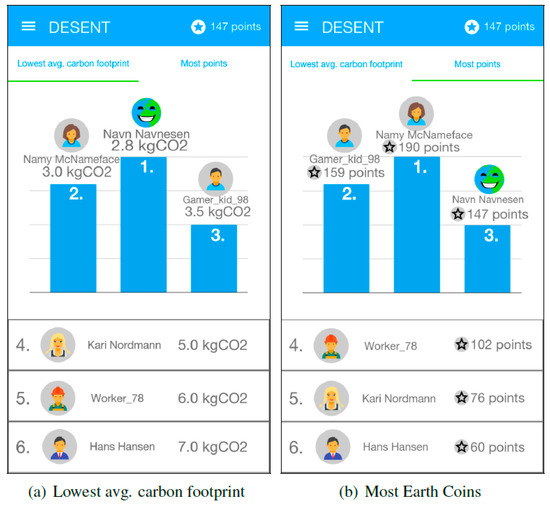
Figure 6.
Smiling Earth for Communities showing examples of different ways of showing Leaderboards; (a) shows a leaderboard for lowest CO2 emissions and (b) shows a leaderboard for earth coins collected.
Concepts such as Earth coins were introduced to encourage long-term goals and planning to achieve a goal over time that could lead to a bigger impact on the daily carbon footprint, such as investment in solar panels or an electrical vehicle. The concept of challenges was also supported so that users could set goals or challenges for themselves, or by a community leader, so that users could track their progress in the behaviour change. A detailed design of the gamified Smiling Earth for communities of users is available from Reference [37].
7. Evaluation
The agile design and development approach included several formative evaluations, consisting of the evaluation of the concept, user interface and usability of the app. A summative evaluation of Smiling Earth for individuals was conducted with several university students, using a questionnaire and follow-up interviews. The main feedback from those evaluations indicated that the concepts were interesting and motivating [27,28].
The results described in this paper focus on the value of Smiling Earth in an urban community context, for raising awareness among individuals and communities about their own carbon footprint. The Expert Evaluation Method [38] was adopted as comments, views and feedback from experts were important. Thus, the evaluation was conducted as a semi-structured interview. The interviews were conducted online, due to COVID-19 restrictions and the geographical distribution. The evaluation was done in two parts: the first part evaluated the value of Smiling Earth for affecting individuals and the second part evaluated a gamified version of Smiling Earth to affect the behaviour of a community or a group of people. A short presentation describing Smiling Earth, the main concepts and the user interface were shared among the participants prior to the interview. Each interview lasted between 1 and 2 h, depending on the discussions related to the open-ended questions.
As the institutions where the authors work are currently involved in two large research projects related to PED and ZEN, namely EU H2020 Positive City Exchange project [7] and Zero Emission Neighbourhoods [9], the experts for the evaluation were selected from the participants of these projects. Four experts participated in the evaluation: one is a researcher, responsible for working with the pilot neighbourhoods in the FME-ZEN project in Trondheim, the second works with citizen engagement in Trondheim Municipality, as a part of the +CityxChange project, the third is a researcher from University of Limerick working with citizen engagement, as a part of the +CityxChange project and the fourth is responsible for research projects in the Limerick City Council, Ireland. The two experts from Limerick were interviewed together as that was the best option to meet their availability.
The evaluations consisted of a short questionnaire as well as open ended questions, opening up for the free expression of the participants. The questionnaire had a set of statements and participants were asked to indicate to what degree they agreed with the statements. A Likert scale from 0 to 4 was used, where 4 indicated strong agreement and 0 indicated strong disagreement.
8. Results
This section presents the results of the evaluation. The first subsection addresses the evaluation of the Smiling Earth app for raising awareness among individual citizens and the second subsection presents the evaluation of a gamified Smiling Earth app for raising awareness of a community of citizens. The participants of the evaluations are referred to as P1, P2, P3 and P4 in the graphs shown in Figure 7 and Figure 8.
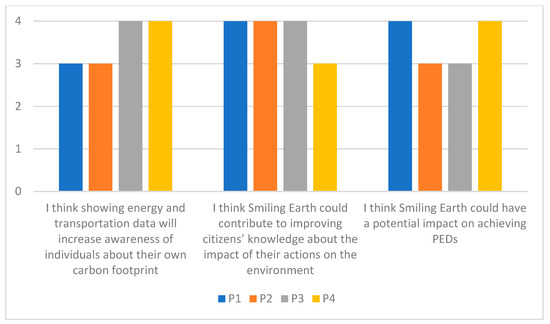
Figure 7.
Evaluation results—Smiling Earth for raising awareness among individual citizens.
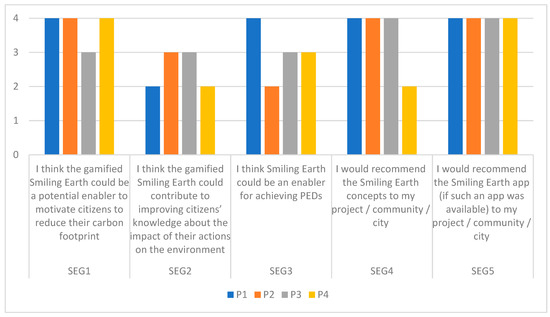
Figure 8.
Gamified Smiling Earth for raising awareness in communities.
8.1. Smiling Earth for Raising Awareness among Individual Citizens
The results for the short questionnaire are shown in Figure 7 where the three statements are shown on the horizontal axis and the Likert scale and the participants’ responses are shown on the vertical scale. The average scores for the statements were 3.5 and 3.75, indicating strong agreement to the statements by all 4 participants. All participants agreed to the relevance of integrating energy and transport data and the benefits of visualising this. The relationship between an individual’s carbon footprint and the current focus on PED is often not clear and this will be discussed in more detail in Section 9.
The semi-structured interview was based on three additional questions and the participants’ responses to these are summarised for each question.
“What do you expect as the potential benefit for your project/community/city?” It appears that a lot of the current focus in projects places the responsibility of climate change on the buildings and the energy sector and the municipalities, and not on individual citizens. This has been a challenge in projects to engage citizens in the pilot neighbourhoods and cities. The Smiling Earth app is seen as a means to help raise awareness among citizens as well as among other stakeholders, e.g., the education sector and the school system. The visualisation helps people relate to how they move around and the subsequent energy consumption. Relating these to daily activities could also serve as daily reminders, e.g., for parents, who perhaps have to drive their children to various activities, to save time. It raises awareness of an individual’s impact on the climate. It was noted that most citizens do not have a feeling about what energy is or what a unit of energy really is and Smiling Earth could help citizens relate to and understand what a unit of energy is and how that relates to individual energy consumption. It was also noted that it was good to have calories included as a part of the estimations related to daily choices.
“Who would have the most value from the app—individual citizen, Community, city? And what is the value?” The feedback on a citizen’s choice and personal behaviour provided by Smiling Earth can be of value for citizens. In particular, most plans by municipalities or at a higher level such as the Paris Agreement, do not integrate citizens. This is where Smiling Earth could help to breakdown climate change activities to the lowest level for citizens to relate to them. Smiling Earth could be of value for cities and neighbourhoods by identifying patterns of transportation by citizens. The data from the app could provide relevant data for city planning and transportation planning. Two participants noted that the benefit for the city or a community depends on the number of people using it. One participant noted that the benefit is really for the earth and everyone as anything that helps mitigate climate change is good for all.
Participants were asked for other general comments and suggestions. One participant noted that this app was perhaps not for the older generations, but for the more data-literate users. It was also noted that the next step would be to leverage on the data that is gathered through the app and to enhance it towards supporting a community of users around it.
8.2. Gamified Smiling Earth for Raising Awareness in Communities
This part of the evaluation consisted of five statements where the participants had to indicate their agreement using the Likert scale. The results are shown in Figure 8 where the five statements are shown on the horizontal axis and the Likert scale and the participants’ responses are shown on the vertical scale. The average scores for three of the five questions were between 3.5 and 4, indicating a strong agreement with the statements. The statement “I think the gamified Smiling Earth could contribute to improving citizens’ knowledge about the impact of their actions on the environment” has an average score of 2.5, indicating neither agreement nor disagreement. The feedback from two of the participants was that “gamifying itself would not make a difference”, and that it was not necessarily the citizens’ knowledge that could be improved, but their motivation. The statement “I think Smiling Earth could be an enabler for achieving PEDs” has an average score of 3, indicating agreement with the statement. However, this is the statement that has most variance among the responses. The discussions that followed noted that Smiling Earth is focused on individuals and the value of the app to PED could depend on how one defines a PED as well as other factors, which will be discussed in the Section 9. For the statement “I would recommend the Smiling Earth concepts to my project/community/city”, one of the participants, who worked in a city council, shared that he would not bring a concept to the citizens unless it was proven to work, as a premature introduction to citizens could have negative consequences.
9. Discussion
Smiling Earth integrates energy- and transport-related data to visualise an individual’s energy consumption during their daily activities. The visualisations and graphics were described as “easy and intuitive” and the earth metaphor was seen as potentially having a high impact among the users. It is seen as a means of reaching more people than through most of the current approaches. The feedback from the evaluations confirm that the Smiling Earth could play an important role in raising awareness among individuals to help them understand what energy is, what a unit of energy means and most importantly, to relate their energy consumption to the bigger picture of global climate change. One of the challenges in raising awareness among citizens is relating high-level goals such as the UN SGDs or the aims of the Paris Agreement to individuals’ actions, and to create a sense of responsibility at the citizen level. Furthermore, it is often difficult to understand the science-based facts and information, e.g., what a 2 °C temperature rise means. Increasing the knowledge and awareness among citizens is seen as a necessary step in achieving the global goals. Smiling Earth could be valuable in supporting this step for getting a broader range of stakeholders and citizens onboard and contributing to achieving the global sustainability goals. More importantly, it can play an important role in closing the science–action gap [10], to help citizens take appropriate action towards mitigating climate change.
While Smiling Earth was initially designed to support individuals, the value of it in engaging citizens and communities of citizens was identified by all the participants. Communities or a city as a collective of people could benefit enormously from using Smiling Earth if a great number of people use the app. One participant emphasised the value of users “networked as a community” through the app, engaging several users to reduce their carbon footprints and change their behaviours. The gamified Smiling Earth to support communities or groups of users was a step in this direction. The importance of the design of the gamification was raised in the discussions as gamification could sometimes lead to a counter effect or undesired behaviour. For example, game mechanics such as a competition among users could lead to undesired behaviour such as cheating and promote competition rather than collaboration. The challenges of designing good social game mechanics have been discussed in other projects, too [39]. Therefore, the choice of game mechanics to engage and motivate collective effort and collective behaviour change of a community of users, where individual users motivate, encourage and support other users to change their behaviour, are desired.
The possibility for users to be able to set goals or that challenges could be set for the users were seen as benefits, and it is important to set goals that are achievable for the users, so that they are motivated rather than disappointed. The importance of creating a feeling of self-efficacy, the ability to perform the necessary act [30], was highlighted.
Smiling Earth was not designed to take into account geographical boundaries, but to focus on CO2 emissions and citizens’ carbon footprints. Thus, discussions about how Smiling Earth could contribute to a PED or a ZEN highlighted interesting issues. The definition of a PED focusses on a geographical area or a district and energy use and consumption [8], and focusses less on CO2 emission. However, the participants of the evaluation believed that Smiling Earth will have an impact on PED. In fact, it could provide the “missing link” between a PED and an individual’s or citizens’ actions. One interesting issue was that some people lived and worked in two different geographical locations (districts, neighbourhoods or cities), and the different areas offer different possibilities for transportation or energy. Thus, people’s choices are often influenced or constrained by the choices available for them. For example, two of the participants lived in less urban areas and worked in the city, necessitating them to drive to work. So, although they may have a low carbon footprint from all their other activities (e.g., live in a passive house), their net carbon footprint may still be high, w.r.t to the daily goal for the CO2 limit, which is 4 kg CO2. The evaluation of Smiling Earth stimulated a number of interesting questions, such as could people have different climate change-related behaviours in different districts and what would this imply for districts and cities? An important revelation is that Smiling Earth can stimulate important discussions around people’s energy-related behaviours, thereby indirectly raising people’s awareness about climate change and their own actions. Furthermore, these discussions provided insights into the potential of Smiling Earth and how it could be adapted for specific needs of citizens, cities or geographical areas.
Another interesting point was how one would define a city in this context: “is a city an institution or a collection of people”? This is an important question when cities (or municipalities) consider the adoption of technologies such as Smiling Earth. Indeed, this is an important design consideration for designers of technologies and services to support citizen engagement towards climate change and sustainability.
10. Conclusions
This paper described Smiling Earth, a mobile app to increase citizens’ awareness about their own carbon footprint, by integrating energy- and transport-related data. The main aim of our work was to explore the ways in which ICT could help raise awareness and educate and motivate citizens about their actions and their consequences on the environment. Smiling Earth provides feedback to users by visualising data about their activities with the aim to motivate citizens to change their behaviour to reduce their CO2 emissions by adopting a healthier lifestyle.
The focus of this paper has been to validate the concept of Smiling Earth and to evaluate its value beyond the project it was developed in. Hence, the paper reported an expert evaluation, based on semi-structured interviews, to establish the potential value of Smiling Earth to individuals, cities and neighbourhoods. The feedback from the evaluations were positive and identified several benefits to citizens and communities of people. One of the most important values that was identified was that Smiling Earth could be the missing link between global or national sustainability goals and policies and the citizens. The evaluation also identified interesting discussion points such as how individuals’ behaviours relate to PED or specific geographical areas. Examining the role of technologies such as Smiling Earth from the different perspectives of an individual, a community or a city stimulated interesting discussions about what a city could be: is it an institution or a collective of people?
The evaluation increased our awareness about the different perspectives of the stakeholder groups and their expectations, providing a better insight and stimulating design ideas. This also helped us identify some of the weaknesses in the design of the statements used in the qualitative evaluations. Our future work will include the enhancement of Smiling Earth to motivate communities of users towards behaviour change. This will include further studies with a broader set of user groups, such as people of different age groups, people living in urban and rural areas, different transportation needs and mobility patterns.
Author Contributions
Conceptualisation of Smiling Earth, P.A. and I.P.; methodology, S.A.P., P.A. and I.P.; validation, S.A.P.; formal analysis, S.A.P. and I.P.; writing, S.A.P.; writing—reviewing and editing, I.P. All authors have read and agreed to the published version of the manuscript.
Funding
This research was funded mostly through the EU H2020 DESENT project, under grant agreement No. 693443, where SINTEF Energy, Norway, was the project partner. The first author is partly supported by FME-ZEN project, financed by the Norwegian Research Council, and the +CityxChange project, Grant agreement 824260.
Acknowledgments
This work has been conducted as a part of the EU H2020 DESENT project, under grant agreement No. 693443, where SINTEF Energy, Norway, was the project partner, represented by the 2nd and 3rd authors. The authors would like to thank the Masters’ students from NTNU, Norway, Celine Minh and Ragnhild Larsen for implementing Smiling Earth. The authors are also grateful for the participants of the evaluations reported in this paper: Daniela Baer, SINTEF Community (from the FME-ZEN project), Cole Matthew Grabinsky, Trondheim Municipality, Norway, Helena Fitzgerald, University of Limerick and Terence Connolly, Limerick City Council, Ireland. The latter three are also participants of the EU H2020 SCC +CityxChange project.
Conflicts of Interest
The authors declare no conflict of interest.
References
- Rahwan, T.; Michalak, T.; Elkind, E.; Faliszewiski, P. Constrained Coalition Formation. In Proceedings of the Twenty-Fifth AAAI Conference on Artificial Intelligence, San Francisco, CA, USA, 7–11 August 2011. [Google Scholar]
- Shiraishi, M.; Washio, Y.; Takayama, C.; Lehdonvirta, V.; Kimura, H.; Nakajima, T. Using individual, social and economic persuasion techniques to reduce CO2emissions in a family setting. In Proceedings of the 4th International Conference on Theory and Practice of Electronic Governance—ICEGOV ’10, Bogota, Colombia, 10–13 November 2009. [Google Scholar]
- Froehlich, J.; Dillahunt, T.; Klasnja, P.V.; Mankoff, J. UbiGreen: Investigating a mobile tool for tracking and supporting green transportation habits in CHI ’09. In Proceedings of the 27th International Conference on Human Factors in Computing Systems, Boston, MA, USA, 4–9 April 2009. [Google Scholar]
- Kona, A.; Bertoldi, P.; Kılkış, Ş. Covenant of Mayors: Local Energy Generation, Methodology, Policies and Good Practice Examples. Energies 2019, 12, 985. [Google Scholar] [CrossRef]
- Statistics Norway. Survey of Consumer Expenditure. 2012. Available online: https://www.ssb.no/en/inntekt-og-forbruk/statistikker/fbu (accessed on 26 June 2017).
- Granell, C.; Havlik, D.; Schade, S.; Sabeur, Z.; Delaney, C.; Pielorz, J.; Usländer, T.; Mazzetti, P.; Schleidt, K.; Kobernus, M.; et al. Future Internet technologies for environmental applications. Environ. Model. Softw. 2016, 78, 1–15. [Google Scholar] [CrossRef]
- +CityXChange. Positive City Exchange. Available online: http://cityxchange.eu/ (accessed on 19 May 2019).
- SET-Plan ACTION n.3.2 Implementation Plan. Available online: https://setis.ec.europa.eu/system/files/setplan_smartcities_implementationplan.pdf (accessed on 16 September 2016).
- FME-ZEN. Zero Emission Neighbourhoods Research Centre. Available online: https://fmezen.no/ (accessed on 29 September 2020).
- Moser, S.C.; Dilling, L. Communicating Climate Change: Closing the Science-Action Gap; Oxford University Press: London, UK, 2011; pp. 161–176. [Google Scholar]
- BeAware: Boosting Energy Awareness. Available online: http://www.energyawareness.eu/beaware/ (accessed on 26 June 2017).
- Brewer, R.S.; Lee, G.E.; Johnson, P.M. The Kukui Cup: A Dorm Energy Competition Focused on Sustainable Behavior Change and Energy Literacy. In Proceedings of the 44th Hawaii International Conference on System Sciences, Institute of Electrical and Electronics Engineers (IEEE), Kauai, HI, USA, 4–7 January 2011; pp. 1–10. [Google Scholar]
- Glogovac, B.; Simonsen, M.; Solberg, S.S.; Löfström, E. Ducky: An Online Engagement Platform for Climate Communication. In Proceedings of the 9th Nordic Conference CHI, Gothenburg, Sweden, 23–27 October 2016. [Google Scholar]
- Zangheri, P.; Serrenho, T.R.; Bertoldi, P. Energy Savings from Feedback Systems: A Meta-Studies’ Review. Energies 2019, 12, 3788. [Google Scholar] [CrossRef]
- Brynjarsdottir, H.; Håkansson, M.; Pierce, J.; Baumer, E.; Disalvo, C.; Sengers, P. Sustainably Unpersuaded. In Proceedings of the SIGCHI Conference on Human Factors in Computing Systems, Boston, MA, USA, 5–10 May 2012; pp. 947–956. [Google Scholar]
- United Nations Framework Convention on Climate Change UNFCCC. What Is the Paris Agreement? Available online: https://unfccc.int/process-and-meetings/the-paris-agreement/what-is-the-paris-agreement#:~:text=The%20Paris%20Agreement’s%20central%20aim,further%20to%201.5%20degrees%20Celsius (accessed on 29 September 2020).
- Hevner, A.R.; March, S.T.; Park, J.; Ram, S. Design Science in Information Systems Research. MIS Q. 2004, 28, 75. [Google Scholar] [CrossRef]
- DESENT. Smart Decision Support System for Urban Energy and Transportation. Available online: www.jpi-urbaneurope.eu/desent (accessed on 14 November 2019).
- Takayama, C.; Lehdonvirta, V.; Shiraishi, M.; Washio, Y.; Kimura, H.; Nakajima, T. ECOISLAND: A System for Persuading Users to Reduce CO2 Emissions. In Proceedings of the 2009 Software Technologies for Future Dependable Distributed Systems, Institute of Electrical and Electronics Engineers (IEEE), Tokyo, Japan, 17 March 2009; pp. 59–63. [Google Scholar]
- Inbar, O.; Seder, T. Driving the Scoreboard: Motivating Eco-Driving Through In-Car Gaming. In Proceedings of the CHI 2011, Vancover, BC, Canada, 7–12 May 2011. [Google Scholar]
- Sagawe, A.; Funk, B.; Niemeyer, P. Modeling the Intention to Use Carbon Footprint Apps. In Quality, IT and Business Operations; Springer Science and Business Media LLC: Berlin, Germany, 2016; pp. 139–150. [Google Scholar]
- Dillahunt, T.; Becker, G.; Mankoff, J.; Kraut, R.E. Motivating Environmentally Sustainable Behavior Changes with a Virtual Polar Bear. In Proceedings of the 6th International Conference on Pervasive Computing, Sydney, Australia, 19 May 2008. [Google Scholar]
- Rajanen, D.; Rajanen, M. Climate Change Gamification: A Literature Review. In Proceedings of the GamiFIN 2019 Conference, Levi, Finland, 8–10 April 2019. [Google Scholar]
- Caroleo, B.R.D.; Morelli, N.; Lissandrello, E.; Vesco, A.; Di Dio, S.; Mauro, S.; Dio, D. Measuring the Change Towards More Sustainable Mobility: MUV Impact Evaluation Approach. Systems 2019, 7, 30. [Google Scholar] [CrossRef]
- Di Dio, S.; Lissandrello, E.; Schillaci, D.; Caroelo, B.; Vesco, A.; D’Hespel, I. MUV: A Game to Encourage Sustainable Mobility Habits in Games and Learning Alliance. In Proceedings of the 7th International Conference GALA 2018, Palermo, Italy, 5–7 December 2018. [Google Scholar]
- Fazeli, S.M. Smart City: A Prototype for Carbon Footprint Mobile App. In Electrical Engineering; KTH: Stockholm, Sweden, 2014. [Google Scholar]
- Petersen, S.A.; Petersen, I.; Ahcin, P. Smiling Earth—Raising Citizens’ Awareness on Environmental Sustainability. In Business Intelligence; Springer Science and Business Media LLC: Berlin, Germany, 2020; pp. 45–57. [Google Scholar]
- Petersen, S.A.; Ahcin, P.; Petersen, I. Smiling Earth—Citizens’ Awareness on Environmental Sustainability Using Energy and Transport Data. In Public-Key Cryptography—PKC 2018; Springer Science and Business Media LLC: Berlin, Germany, 2019; pp. 459–465. [Google Scholar]
- Oliveira, M.; Petersen, S.A. Co-design of Neighbourhood Services Using Gamification Cards. In Proceedings of the Public-Key Cryptography–PKC 2018, Rio De Janeiro, Brazil, 25–29 March 2018. [Google Scholar]
- Klöckner, C.A. A comprehensive model of the psychology of environmental behaviour—A meta-analysis. Glob. Environ. Chang. 2013, 23, 1028–1038. [Google Scholar] [CrossRef]
- Barbarossa, C.; Beckmann, S.C.; De Pelsmacker, P.; Moons, I.; Gwozdz, W. A self-identity based model of electric car adoption intention: A cross-cultural comparative study. J. Environ. Psychol. 2015, 42, 149–160. [Google Scholar] [CrossRef]
- Prochaska, J.O.; Velicer, W.F. The Transtheoretical Model of Health Behavior Change. Am. J. Health Promot. 1997, 12, 38–48. [Google Scholar] [CrossRef] [PubMed]
- LaMorte, W.W. Behaviour Change Models—The Transtheoretical Model (Stages of Change). Available online: https://sphweb.bumc.bu.edu/otlt/mph-modules/sb/behavioralchangetheories/BehavioralChangeTheories6.html (accessed on 30 October 2020).
- Howell, R.A. Using the transtheoretical model of behavioural change to understand the processes through which climate change films might encourage mitigation action. Int. J. Sustain. Dev. 2014, 17, 137. [Google Scholar] [CrossRef]
- Statistics Norway. Emissions of Greenhouse Gases, 1990–2015, Final Figures. Available online: https://www.ssb.no/en/natur-og-miljo/statistikker/klimagassn/aar-endelige/2016-12-13?fane=tabell&sort=nummer&tabell=287212 (accessed on 28 June 2017).
- Minh, C. Mobile App: Integrated Financial, Energy and Transport Services; Norwegian University of Science and Technology: Trondheim, Norway, 2017; p. 123. [Google Scholar]
- Larsen, R. Gamified Mobile Application to Raise Awareness and Support Energy Efficient Behavior; Norwegian University of Science and Technology: Trondheim, Norway, 2018. [Google Scholar]
- Klas, C.-P. Expert Evaluation Methods, in User Studies for Digital Library Development; Dobreva, M., O’Dwyer, A., Feliciati, F., Eds.; Facet Publishing: Cambridge, UK, 2012; pp. 75–84. [Google Scholar]
- Oliveira, M.; Petersen, S.A. The Choice of Serious Games and Gamification, in Serious Games Development and Applications; Ma, M., Oliveira, M.F., Baalsrud Hauge, J., Eds.; Springer International Publishing: Cham, Switzerland, 2014. [Google Scholar]


Publisher’s Note: MDPI stays neutral with regard to jurisdictional claims in published maps and institutional affiliations. |
© 2020 by the authors. Licensee MDPI, Basel, Switzerland. This article is an open access article distributed under the terms and conditions of the Creative Commons Attribution (CC BY) license (http://creativecommons.org/licenses/by/4.0/).