Article

Determination of the Theoretical and Actual Working Volume of a Hydraulic Motor

Faculty of Mechanical Engineering, Gdansk University of Technology, 80-233 Gdansk, Poland
Energies 2020, 13(22), 5933; https://doi.org/10.3390/en13225933
Submission received: 9 October 2020 / Revised: 3 November 2020 / Accepted: 11 November 2020 / Published: 13 November 2020

Abstract

:
A new methodology of determination of the theoretical and actual working volume of a hydraulic motor based on the characteristics of the delivered flow rate into hydraulic motor vs. the rotational speed at a constant pressure drop in the working chambers is described in this paper. A new method of describing the delivered flow rate into a motor per one shaft revolution as a nonlinear function of the pressure drop in the motor working chamber is proposed. The influence of the flowmeter location in the measurement system on the result of the theoretical and actual working volume calculation is described. It is shown that, in order to assess the energy losses (volumetric and mechanical) in the motor, the actual working volume must be a polynomial function (third degree) of its pressure drop in the working chambers. The result of the experimental tests of the satellite hydraulic motor confirmed the validity of the proposed method. The result of the calculation of the theoretical working volume of the motor according to the proposed method was compared with the results of calculations according to known methods.

1. Introduction

A hydraulic motor is a principal component of a hydraulic system, and the steady-state behavior of this motor plays an important role in the overall performance of the hydraulic system. The knowledge of the basic characteristics of the motor, such as its volumetric losses efficiency and mechanical-pressure efficiency, is essential for both users and designers of a hydraulic system. So far, the so-called theoretical working volume qt has been used to assess the losses in the motor and its partial efficiency, that is:
(a)
the volumetric efficiency:
η v = q t · n q t · n + Q v
(b)
the hydraulic-mechanical efficiency:
η h m = 2 π · M q t · Δ p
where:
  • Qv—the volumetric losses in the motor;
  • n—rotational speed of the motor shaft;
  • M—load of the motor;
  • Δp—pressure drop measured in the motor ports.
The literature describing the method of determining the theoretical working volume of a displacement machine is relatively scarce. The first method of determining the theoretical working volume was described by Wilson (1950), Schlosser and Hilbrands in 1963 [1,2,3,4]. This method was improved and described by Toet in 1970 [5]. The same method, but supplemented, was described by Toet once again in 2019 [6]. Nevertheless, Balawender’s method from 1974 is commonly used in research and development centers. This method is described in detail in [7,8]. Nevertheless, it is Toet’s method from 1970 that is referred to or used in the other available literature [9,10,11,12]. Toet’s and Balawender’s methods are described in the next section.
The simplest of all the known methods of determining the theoretical working volume is presented in the ISO standard [13] (also described in the next section).
Another original method is proposed by Kim in [14]. Kim has attempted to calculate the theoretical working volume by a flow rate analysis for a single displacement chamber of the pump. This method becomes problematic to use when dealing with multiple working chambers, i.e., in real pumps or hydraulic motors. Therefore, this method will not be described in detail.
The value of qt is constant in the whole range of the motor operating parameters, that is, the speed n and the pressure drop Δp measured in the motor ports. In practice, the theoretical working volume qt is determined in a simplified way. The location of a flow meter (in the high-pressure line or in the low-pressure line of the motor) is not taken into account and it is assumed that the pressure drop Δp in a motor is equal to the pressure drop Δpi in the working mechanism of this motor. Hence, the influence of liquid compressibility is neglected, as is the pressure drop Δpich in the internal channels of the motor.
The theoretical working volume qt is not the same as the geometric working volume qg. The qt is obtained from experiment data (for Δp tending to zero), but qg is mainly obtained (or calculated) from drawing documentations of the motor. The mathematical formulas for describing the geometric working volume qg are different for various types of positive displacement machines [9,15]. In addition, these formulas are derived with some simplifications for some types of pumps and motors. For example, the simplifications result in an error of up to 3% for gear machines [7,15].
In addition, in the working mechanism of positive displacement machines, there are looseness and machining errors of the working mechanism components, assembly errors, changes in the machine temperature, etc. Furthermore, the pressure drop Δp in the hydraulic motor is mainly a result of its torque load. In effect, the working chambers are resiliently deformed. Thus, in a loaded motor, the geometric working volume qg is different from the actual working volume qr. Therefore, the geometric volume qg is not recommended for use to assess losses in positive displacement machines. It would be better to assume that the actual working volume qr assesses the volumetric and mechanical losses in a hydraulic motor. Then, qr should be expressed as a function of the pressure drop Δpi in the working chambers of the motor. Furthermore, the theoretical working volume qt and the geometric working volume qr should be determined taking into account the liquid compressibility. In addition to the precise determination of volumetric and mechanical losses with this approach, it is possible to more precisely assess the clearances of the components in the working mechanism of a hydraulic motor. Therefore, the development of a new methodology of determination of the theoretical working volume qt and the actual working volume qr of a hydraulic motor is appropriate and justified from the scientific and cognitive point of view. For this purpose, described in the following sections of the article are:
(a)
known methods to determine the theoretical working volume;
(b)
the proposed method of determining the theoretical qt and actual working volume qr (taking into account the effect of the flow meter position in the measurement system, the compressibility of liquid, and the pressure drop Δpich in the internal channel of a motor).
In this article the practical implementation of new methods is also presented. In order to confirm the correctness of the proposed new method of determining the qt and qr, experimental tests of a hydraulic satellite motor were carried out, described and compared with Toet’s and Balawender’s methods.

2. Known Method to Determine the Theoretical Working Volume

2.1. Flow Rate in Hydraulic Motor

Balawender and Toet have developed a practical method of determining the theoretical working volume qt of a hydraulic motor by using measurements of the liquid flow rate in the motor (Figure 1). According to them, making separate measurements for determining qt would unnecessarily extend the time of research and increase the costs [5,6,7].
According to Toet [6], the hydraulic motor input flow rate Q1 is the volume flow delivered to the inlet port calculated at the inlet pressure p1 and it uses the fluid temperature T1 at the inlet port. Furthermore, the volume flow Q1 through an averaging unit with a pressure difference Δp at an inlet temperature T1 and for a particular hydraulic oil is [6]:
Q 1 = Q g + Q u + Q C + Q L
where:
  • Qg—the positive displacement component:
Q g = q g ( Δ p = 0 , T 1 ) · ( 1 + K 1 · Δ p ) q g ( Δ p , T 1 ) · n
  • Qu—the liquid lifted in the gaps:
Q u = q u ( Δ p = 0 , T 1 ) · ( n + K 2 · Δ p )
  • qu—the liquid flow rate Qu per one revolution of the shaft at Δp = 0;
  • QC—the expansion/compression component (taken into account when the flow meter is located at the low-pressure side and the liquid is not aerated):
Q C = q g ( Δ p = 0 , T 1 ) · ( ρ o ρ 1 ) · n
ρ o ρ 1 = K 3 · Δ p K 4 · ( Δ p ) 2 + K 5 · ( Δ p ) 3
  • QL—leakage in the working mechanism gaps;
  • ρo—density at atmospheric pressure;
  • ρ—density of liquid at pressure p;
  • K1, K2, K3, K4, K5—constants.
According to Balawender, the flow rate in a hydraulic motor should be described by the following formulas [7,8]:
Q 1 = Q g + Q u + Q k + Q C , 1 + Q L i , 1 + Q L e , 1
Q 2 = Q g + Q u + Q k + Q C , 2 + Q L i , 2 + Q L e , 2
where [7,8]:
Q g = q g ( Δ p i = 0 , T 1 ) · ( 1 ± K 6 · Δ p i ) q g ( Δ p i , T 1 ) · ( 1 + 3 · α · Δ T ) · n
Q u = q u ( Δ p i = 0 , T 1 ) · ( 1 ± K 7 · Δ p i ) · n
  • Qk—the liquid flow rate caused by the cyclic elastic deformation of the working chambers [7,8]:
Q k = K 8 · Δ p i · q g ( Δ p 1 = 0 , T 1 ) q k ( Δ p i , T 1 ) · n
  • QC,1—the flow rate caused by liquid compressibility at the moment of the working chamber transition from the emptying cycle to the filling cycle [7,8]:
Q C , 1 = λ · Δ p i K s ( Δ p i ) · q g ( Δ p i > 0 , T 1 ) q c , 1 · n
  • QC,2—the flow rate caused by liquid compressibility at the moment of the working chamber transition from the filling cycle to the emptying cycle [7,8]:
Q C , 2 = ( 1 + λ ) · Δ p i K s ( Δ p i ) · q g ( Δ p i > 0 , T 1 ) q c , 2 · n
  • QLi,1 and QLi,2—the leakage from the high-pressure working chambers to the low-pressure working chambers (internal leakage) [7,8]:
Q L i , 1 + Q L i , 2 = Q L i
  • QLe,1 and QLe,2—the leakage from the working chambers on the outside of the motor (external leakage from the motor body by the third hose) and [7,8]:
Q L e , 1 + Q L e , 2 = Q L e
  • Δpi—the pressure drop in the motor working chambers;
  • α—the coefficient of linear expansion of materials of the motor working mechanism;
  • ΔT—the increase in the motor temperature;
  • K6, K7, K8—constants;
  • Ks—the isentropic secant modulus of liquid compressibility;
  • λ—the relative harmful volume.

2.2. Theoretical Working Volume from the Method Defined in ISO 8426

The method defined in ISO 8426 uses measurement of the flow rate Q1 at different speeds n at a constant pressure and a constant input fluid temperature. The theoretical working volume can be determined by [13]:
q t = Q 1 ( 2 ) Q 1 ( 1 ) n ( 2 ) n ( 1 )
The qt determined according to the above formula changes while measuring along multiple pressure differences. This makes the theoretical working volume calculation inaccurate.

2.3. Toet’s Method

After analysis of the partial derivative of the flow Q1 (expressed by the Formula (1)) after the speed n ( Q 1 n ), Toet concluded that the theoretical working volume qt of the motor should be described in the following form [6]:
q t = ( Q 1 n ) ( Δ p = 0 ,   T 1 ) = ( Q 1 n ) ( Δ p = 0 ,   T 1 ) = q g ( Δ p = 0 ,   T 1 ) + q u ( Δ p = 0 ,   T 1 )
where qu is the volume of liquid per one revolution of the shaft caused by the relative velocities between two surfaces of clearances in the working mechanism.
According to Toet [6]:
(a)
qt is independent of n and Δp;
(b)
besides q g ( Δ p = 0 ,   T 1 ) and q u ( Δ p = 0 ,   T 1 ) the other effects (not expressed by formulas) have influence on the leakage QL;
(c)
there is no way for separation of qg and qu;
(d)
if the volumetric efficiency is greater than 100% then only the qg was applied (omitting the qu);
(e)
for some types of positive displacement machines (screw pumps and motors), where qg is very precisely determinable and qu ≈ 0 is q g ( Δ p = 0 ,   T 1 ) qt (for the same of T1).
According to Toet, the flow rate Q in a hydraulic motor is described by the linear function [6]:
Q ( Δ p = c o n s t ) = A i · n + B i
where
A i = ( Q n ) ( Δ p = c o n s t )
and B is the leakage flow in the motor for Δp = 0. The characteristics of Q for different constant values of Δp are shown in Figure 2. However, the relationship
A = a · Δ p + q t
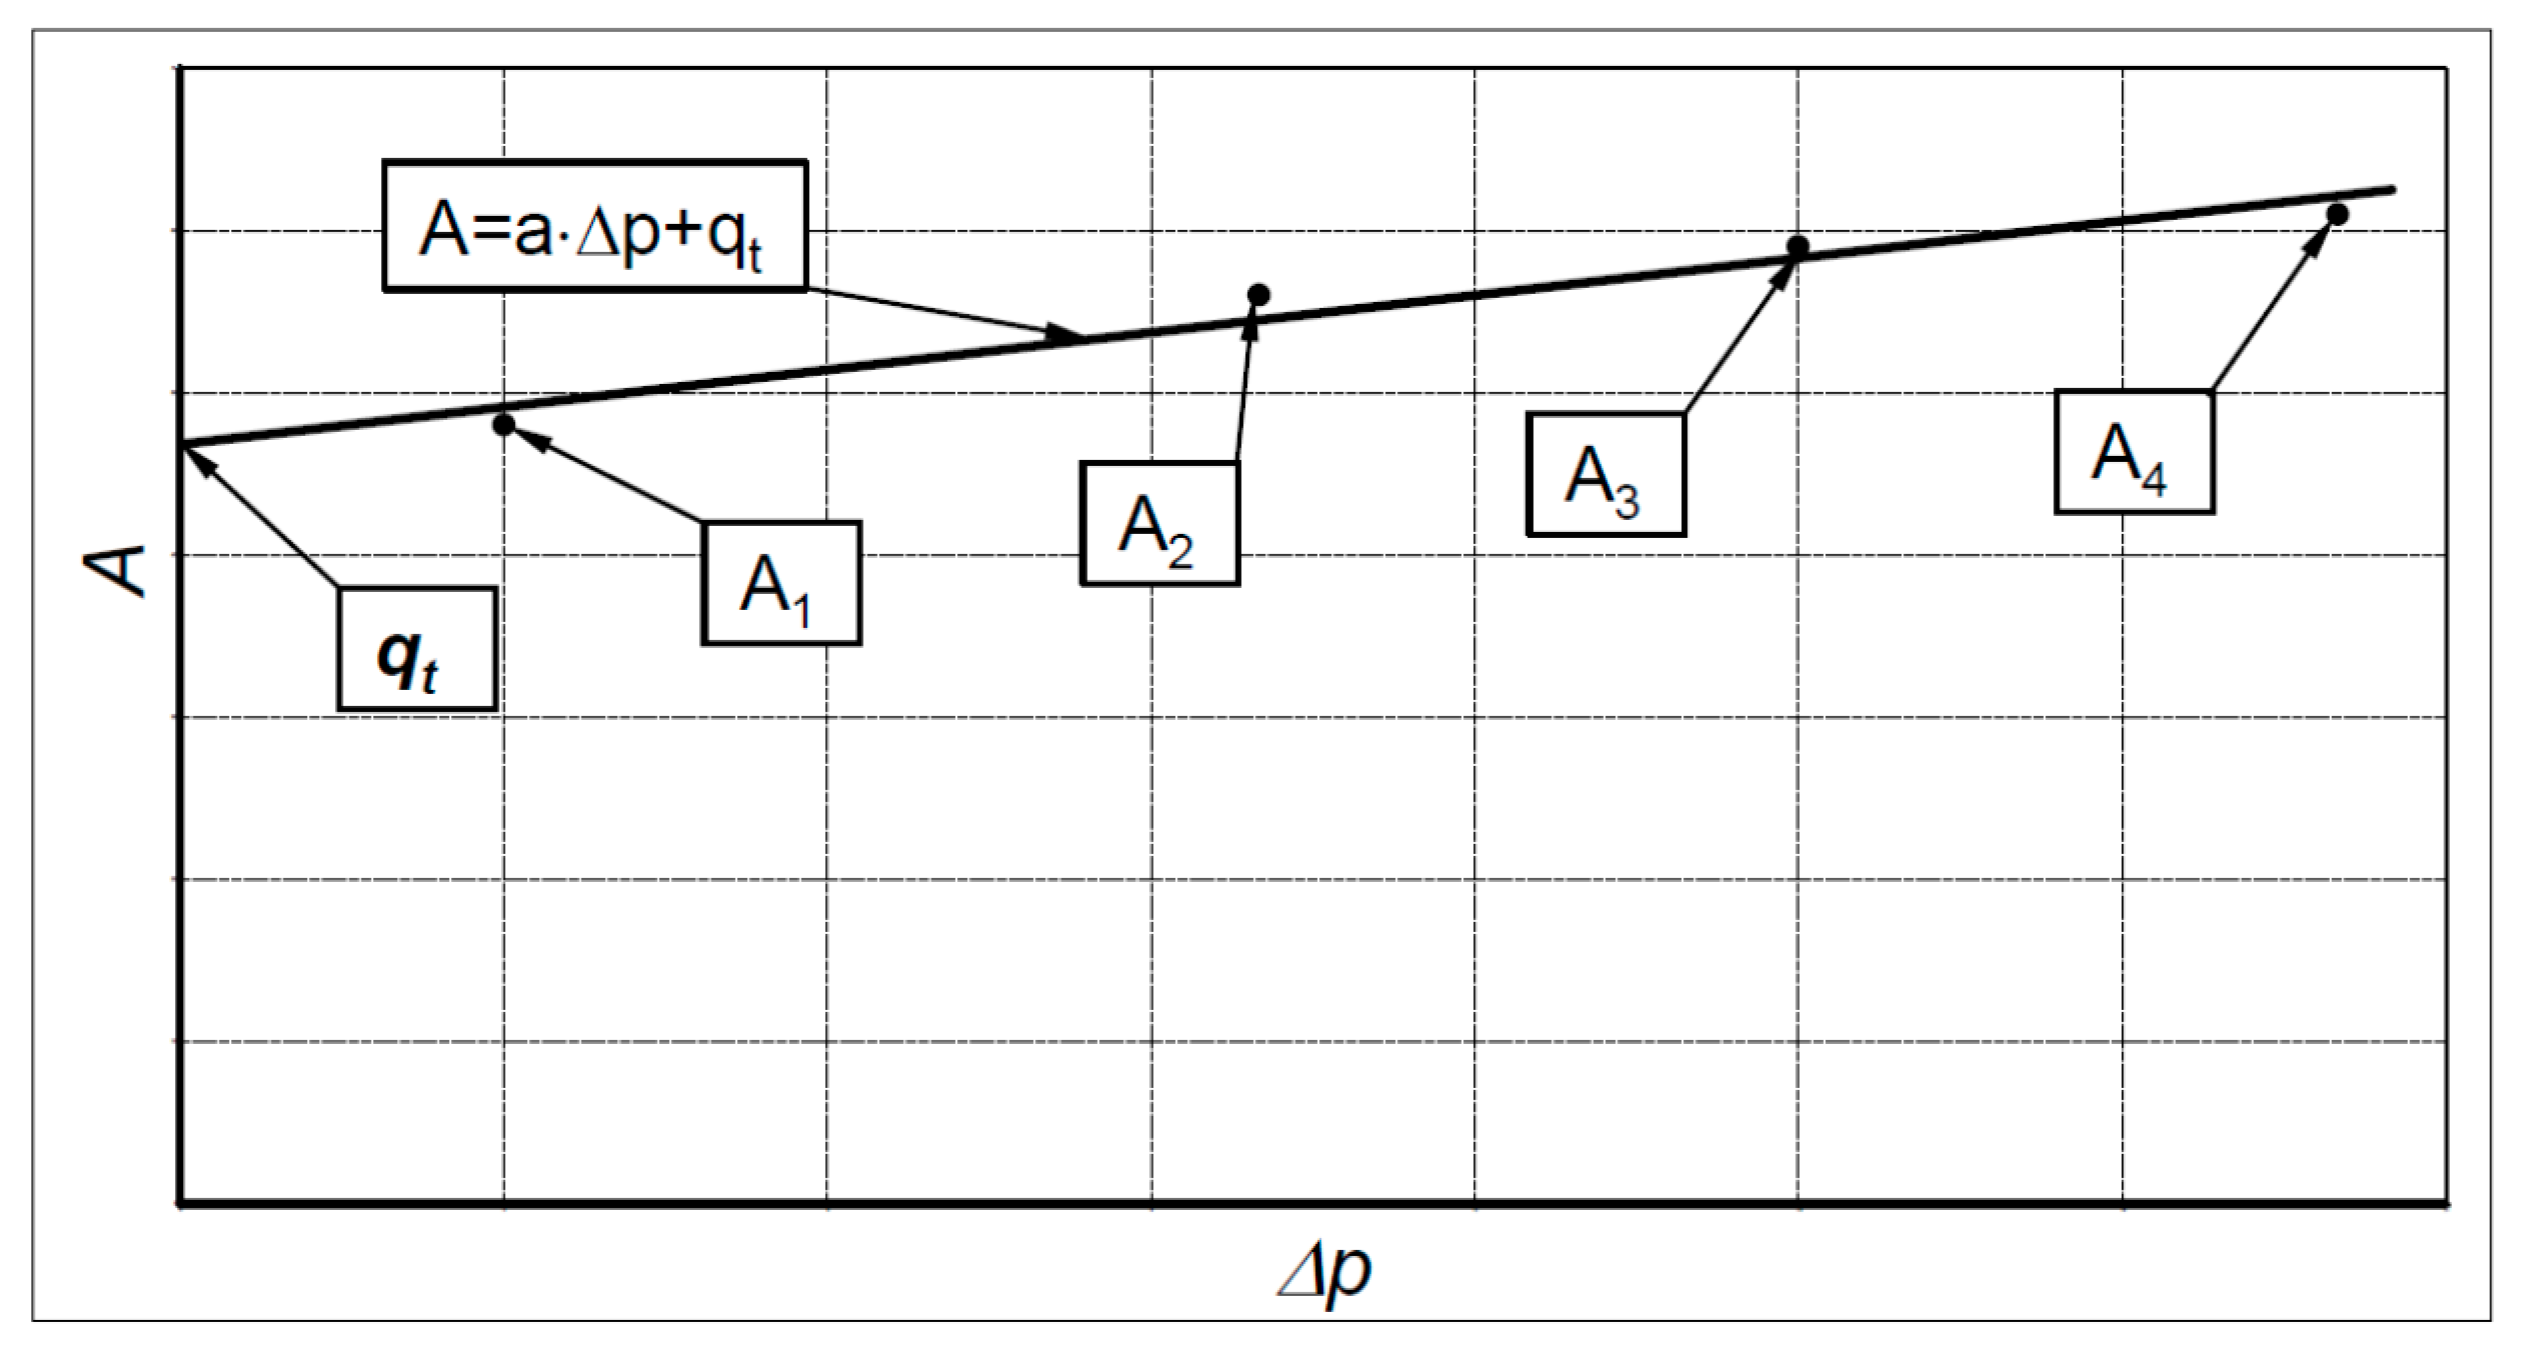
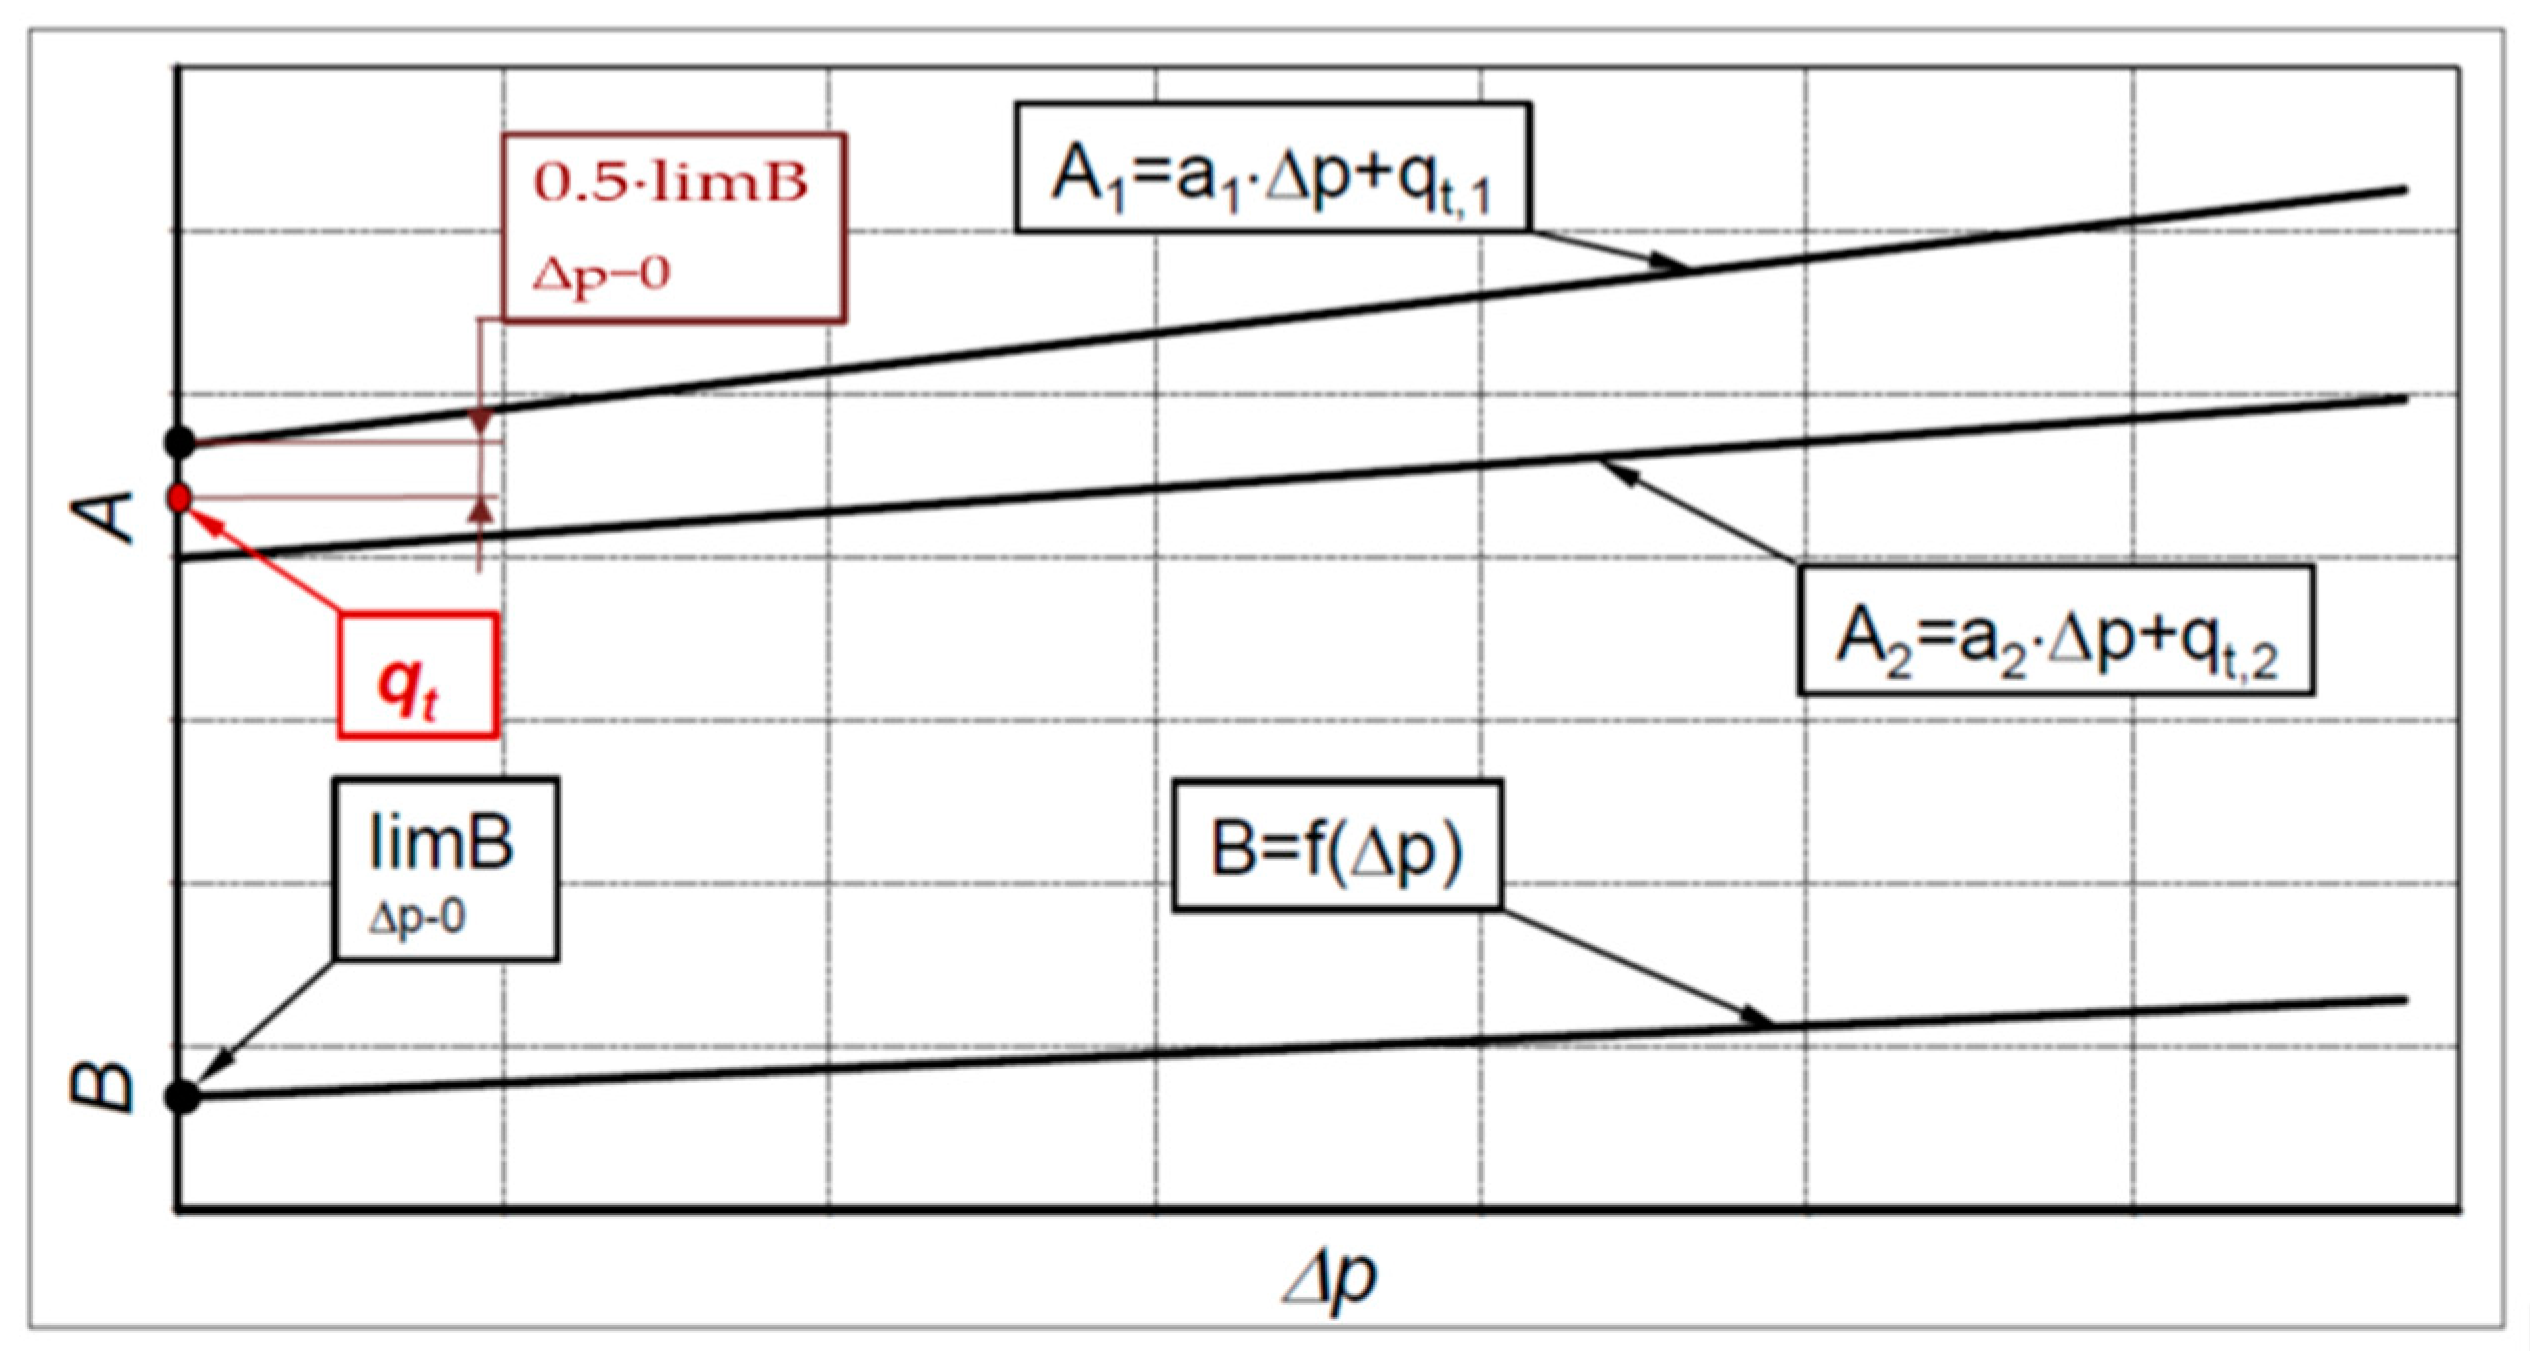
is determined from the values A1, A2, A3,…, An (Figure 3). Hence, qt is the theoretical working volume of the hydraulic motor supplied with oil at temperature T1 measured in the inflow port of the motor [6].
Furthermore, Toet claims that the linear relationship between A and Δp is recommended with the correlation coefficient of at least 0.9. Nonlinear fitting is recommended for smaller values of correlation coefficient [6].

2.4. Balawender’s Method

In 1974, Balawender noticed the shortcomings of Toet’s method and described them in [7]. Balawender’s notes are still valid, although they were omitted by Toet in [6]. Balawender claimed that the method indicated by Toet is inaccurate, because [7]:
  • The notation of the theoretical working volume given by Equation (16) is incorrect as it suggests a measurement at Δp = 0. In real conditions, the motor does not run at Δp = 0;
  • In fact, in order to determine the theoretical working volume qt the limit values of the working volume for the internal pressure drop Δpi going to zero should be taken into account;
  • The function Q n can be unspecified in the mathematical sense at Δp = 0 due to the unspecified displacements of the motor working mechanism elements;
  • The flow component caused by the compressibility of liquid was incorrectly interpreted.
Balawender concluded that the theoretical working volume qt of the motor should be described in the following form [7,8]:
q t = lim Δ p i 0 q g ( Δ p i ) + lim Δ p i 0 q u ( Δ p i )
Balawender, similarly to Toet, claims that:
(a)
qt is independent of n and Δp;
(b)
the temperature of liquid can have influence on qt,
(c)
there is no way for of qg and qu.
Furthermore, Balawender simplifies the problem by taking Δpi ≈ Δp. The linear relationship between A and Δp and between B and Δp is recommended (Figure 4) [7,8].
According to Balawender, the theoretical working volume is described as [7,8]:
q t , 1 = lim Δ p 0 A 1 ( Δ p ) 1 2 · lim Δ p 0 Q L e ( Δ p )
or
q t , 2 = lim Δ p 0 A 2 ( Δ p ) + 1 2 · lim Δ p 0 Q L e ( Δ p )
Finally, the theoretical working volume should be calculated as [7,8]:
q t , 1 = q t , 1 + q t , 2 2
Balawender recommends to test the motor in the following speed range:
n m a x 3 · n m i n
where the nmin is the minimum speed at which the motor can work stably. The limitation of the maximum speed results from the assumption Δpi ≈ Δp.

3. New Method of Determining the Theoretical and Actual Working Volume

3.1. The Flow Rate Caused by Liquid Lifting in Gaps

Both Toet and Balawender point to the component Qu of the flow rate. According to them Qu has an impact on the theoretical working volume qt. However, it should be noted that this does not apply to all displacement machines. For example, in the working mechanism of piston machines, the walls of the gaps move with a reciprocating movement. However, in satellite and gear machines, they move in a rotational movement. Thus, in piston machines the direction of flow Qu in the gap between the piston and the cylinder varies with the direction of the piston movement. In satellite machines, the satellite rotates and there is a flow from the low-pressure chamber into the high-pressure chamber on one side, and there is also a flow of the same value but in the opposite direction on the other side. Thus, the flow Qu should not occur in the overall balance [16]. Nevertheless, it is proposed to include the flow per one revolution of shaft qu in the theoretical working volume according to Formula (22).

3.2. The Actual Working Volume qr

During the tests on a prototype of an axial piston pump, Osiecki noted that the value of the mechanical-pressure efficiency exceeded 100% (with correct pressure and torque measurements). Obviously, he considered it absurd [17]. After an in-depth analysis of the pump structure, Osiecki showed that the pump was characterized by low stiffness of elements, especially the shaft. As a result, with increasing the load of the pump the working volume of the pump also increased. Thus, it can be seen that the adoption of the theoretical working volume qt can introduce a significant error in the evaluation of the losses in displacement machines. Therefore, it is necessary to take the actual working volume qr (as a function of pressure in working chambers) to calculate the losses in the machine.
Both Balawender and Toet in their considerations assumed that the geometric working volume qgp,T1) is a linear function of pressure (see Formulas (4) and (10)). This is a simplification, of course. It should be noted that the working chambers of displacement machines have a finite volume V. This volume can be described in the general form with three dimensions x, y, z (at p = 0):
V ( p = 0 ) = x · y · z
As a result of increasing the pressure (i.e., for p > 0) the values of these dimensions change by Δx, Δy and Δz, respectively, and the actual volume V(p) is a non-linear function of pressure:
V ( p ) = V ( p = 0 ) + f ( p 3 ) + f ( p 2 ) + f ( p ) Δ V ( p )
The above dependence can be referred to as a displacement machine, which is a hydraulic motor. It should be noted that the deformation values Δx, Δy and Δz can be positive or negative. For example, in gear hydraulic motors not equipped with an axial clearance compensation unit, the distance between the closing plates of the toothed gear increases with the increasing of Δpi, that is, Δz > 0. However, in such a motor with an axial clearance compensation unit, there may be a reduction in the clearance value, that is, Δz < 0. Another phenomenon is the cyclic elastic deformation of the gears cooperating with each other. This causes a cyclic change in the volume of the working chamber. Due to the same nature of the phenomenon, volumes qg and qk, described by Balawender with Formulas (10) and (12), are proposed to be presented by one mathematical formula with a structure such as (28):
q g ( Δ p i ) + q k ( Δ p i ) = q g ( Δ p i = 0 ) ± f ( Δ p i 3 ) ± f ( Δ p i 2 ) ± f ( Δ p i ) Δ q g ( Δ p i ) = q r
where qr is the actual working volume of a loaded motor. The value of qr can be determined experimentally, provided that the component flow rate QC caused by liquid compressibility is eliminated. This can be done by taking into account the influence of compressibility of the liquid on the flow rate measured by the flow meter.

3.3. The Effect of the Flow Meter Position in the Measurement System on the Actual Working Volume Value

In his method, Toet recommends the placing of a flow meter in the inlet line to a hydraulic motor. In this arrangement, the flow meter measures the total flow including external leakage. However, Toet has omitted the effect of outside leakage on the theoretical working volume.
However, for the case of placing the flow meter in the low-pressure line, Toet introduces the influence of the liquid compressibility on the flow rate, expressed by Formula (4). Therefore, it is only the influence of the liquid compressibility related to the geometric working volume qg. Thus, Toet neglects the influence of liquid compressibility on the leakage flow rate QL. This is a serious inaccuracy. Hence, according to Toet, for a flow meter located in the outflow line, the calculation of the theoretical working volume should be made according to the following formula:
Q ( p 1 ) = Q 2 + Q C
where Qc is expressed by Formula (4). Therefore, the theoretical working volume qt will be calculated with an error.
According to Balawender, the compressibility of the liquid has an effect on the value of the flow rate in a motor measured by a flow meter. Namely, the location of the flow meter in the measuring system is important. If the flow meter is located in a high-pressure line of the motor, then [7]:
Q ( p 1 ) Q 1
However, if the flow meter is located in the low-pressure line of the motor, then [7]:
Q ( p 1 ) = κ · Q 2
In the above equations, ĸ is the correction coefficient that removes the systematic error in measuring the flow rate caused by the liquid compressibility and its thermal expansion. The coefficient ĸ is a function of the liquid temperature, the content of air not dissolved in liquid (Xo) and the increase in the liquid pressure Δp. For oil and for Xo = 0.01 and t = 40 °C the coefficient is:
κ = 0.97 75 · 10 5 · Δ p
where Δp is expressed in [MPa].
In both cases, Balawender used an additional flow meter for measuring the external leakage (like in Figure 1).
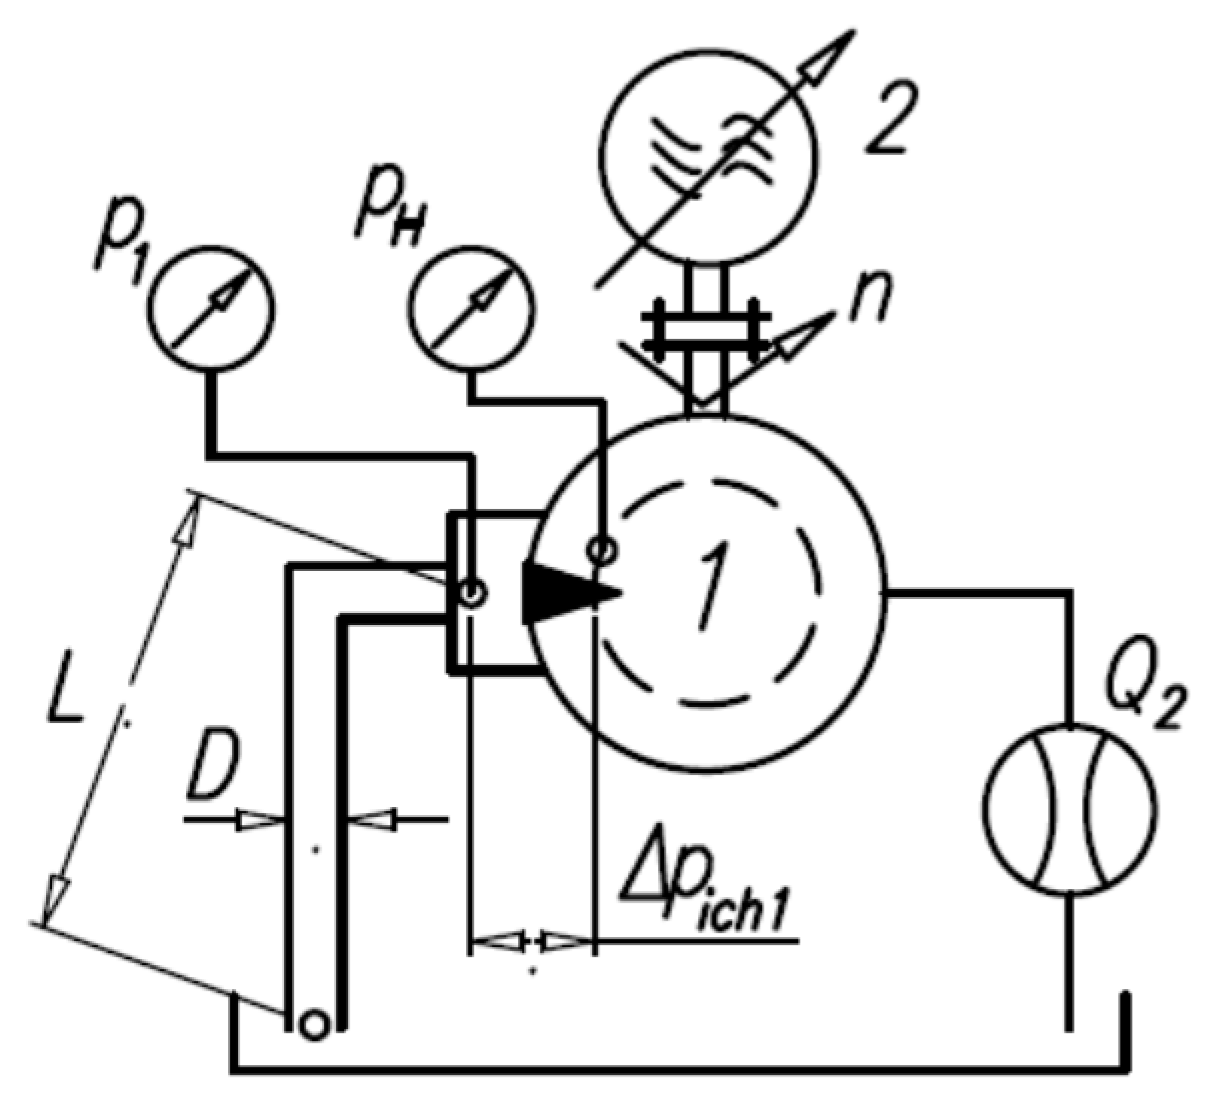
Therefore, in both Toet’s and Balawender’s methods, the effect of the flow meter location in the measuring system is simplified. In order to more accurately calculate the flow rate related to the pressure in the high-pressure working chamber, the following method is proposed. The flow meter located in the inlet line to the motor measures the flow rate Q1 of the liquid compressed to the pressure p1 (Figure 1). The working chamber filling process is from the chamber minimum volume Vmin to the chamber maximum volume Vmax. The pressure in this chamber is lower than the pressure p1 by the pressure drop Δpich1 in the internal inflow channel (Figure 5). Therefore, taking into consideration the compressibility of the liquid, the flow rate Q(pH) related to the pressure pH in the high-pressure working chamber will be:
Q ( p H ) = Q 1 + Δ Q 1
where ΔQ1 is an additional flow rate resulting from the expansion from pressure p1 to pressure pH. It is necessary to add, that in this case the calculated value of Q(pH) is the sum of the theoretical flow rate Qt in the motor and the internal QLi and external QLe leakages. Thus, this method of measurement does not allow calculating the actual working volume qr of the motor.
The flow meter located in the outflow line of the motor measures the flow rate Q2 of liquid decompressed from pressure pH to pressure p2 (Figure 1). Thus, the flow meter measures the following flow rate:
Q 2 = Q ( p H ) + Δ Q 2
where ΔQ2 is an additional flow rate caused by liquid decompression from pressure pH to pressure p2. It is necessary to add, that in this case the calculated value of Q(pH) is the sum of the theoretical flow rate Qt and the internal leakage QLi.
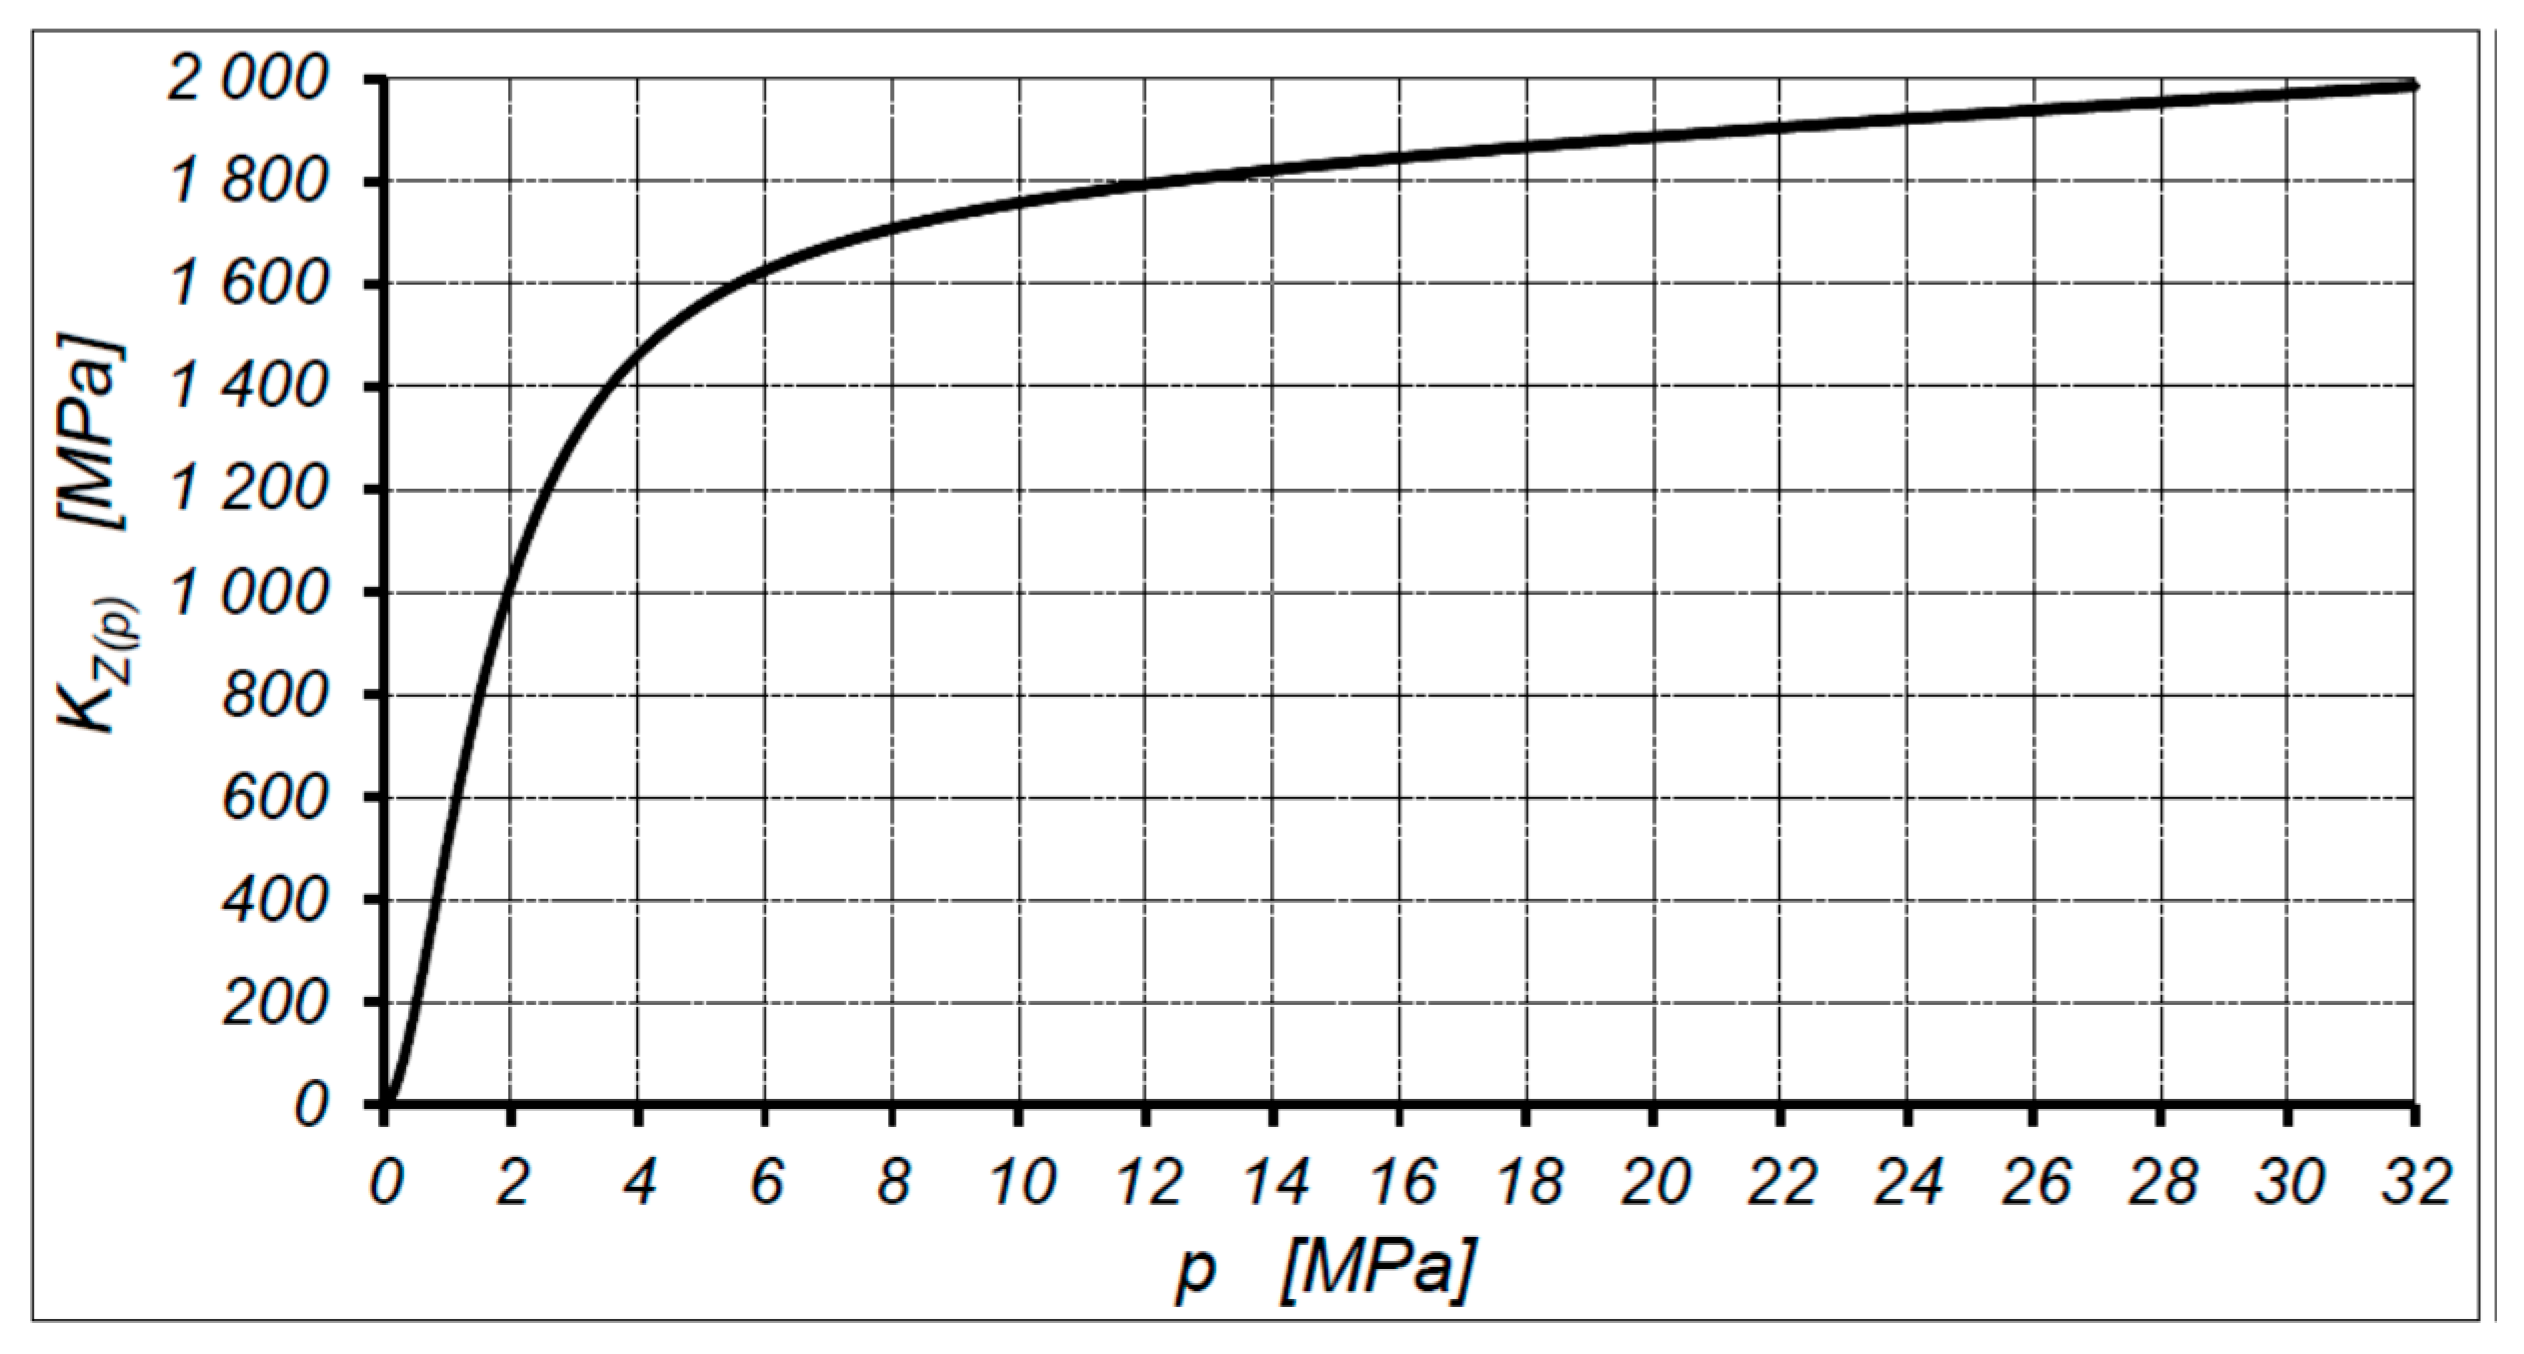
The value of Q(pH), calculated from Formula (34) or (35) should be taken for the correct calculation of the theoretical working volume qt. It is possible to calculate both ΔQ1 and ΔQ2 if the bulk modulus K of the liquid is known. In real conditions, the working fluid is somewhat aerated. Thus, the content of the non-dissolved air in the oil affects the bulk modulus K. The tangential isentropic bulk modulus KZ(p) is very well described by the Zaluski formula [18]:
K Z ( p ) = e ( p o p K ) · 1 + m · p p o K ( 1 m ) + X o 1 X o · ( p o p ) ( 1 n ) e ( p o p K ) K · 1 + m · p p o K ( 1 m m ) + X o n · p o · ( 1 X o ) · ( p o p ) ( 1 + n n )
where:
  • K—the bulk modulus of non-aerated oil at atmospheric pressure po;
  • Xo—the amount of non-dissolved air in the oil at atmospheric pressure po;
  • p—the absolute pressure;
  • n—the polytrophic exponent;
  • m—the coefficient of the influence of pressure p on the bulk modulus K.
It follows from the basic definition of the bulk modulus that the change in the volume ΔV(p2) of liquid from pressure po to p2 is:
Δ V ( p 2 ) = p o p 2 V o K Z ( p ) · p
where Vo is the initial volume. Similarly, the change of the volume ΔV(pH) of the liquid from pressure po to pressure pH in the filled working chamber will be:
Δ V ( p H ) = p o p H V o K Z ( p ) · p
From the practical point of view, the volume of the flow meter chamber can be assumed as the initial volume Vo. Thus, the volume of liquid measured by the flow meter at a pressure p2 and related to pressure po is:
Q o = Q 2 + Δ V ( p 2 ) Δ t
where Δt is the time of the flow meter chamber filling at the flow rate Q2. However, the flow rate related to the pressure pH is:
Q ( p H ) = Q o Δ V ( p H ) Δ t = Q 2 + Δ V ( p 2 ) Δ V ( p H ) Δ t
The values of Q(pH) calculated according to Formula (40) are required for determining the characteristics Q(pH) = f(Δpi). It is assumed that these characteristics are linear and therefore it is proposed to describe them with a linear equation, as in Formula (19).

3.4. Method of Pressure Drop Measurement in Motor Internal Channels

In a hydraulic motor with variable shaft rotation directions, the inflow and outflow internal channels have the same shape and dimensions. Thus, it is only necessary to measure the pressure drop Δpic1 in the inflow internal channel and the pressure drop Δpich in the motor, which are calculated according to the formula [16]:
Δ p i c h = 2 · Δ p i c h 1
where:
Δ p i c h 1 = p 1   p H
The idea of the measured system is shown in Figure 5. The tested hydraulic motor 1 works as a pump and is driven by an electric motor 2. The speed n of the electric motor 2 and machine 1 is set via a frequency converter. In this method, the measurement data acquisition system records:
(a)
the pressure p1 in the motor port;
(b)
the pressure pH in the motor working chamber;
(c)
the motor output flow rate Q2;
(d)
the rotational speed n of the motor shaft.
The pressure losses in the motor internal channels can be described by [16]:
Δ p i c h = C t · ρ · Q 2 2 + C l · ν · ρ · Q 2
where:
  • Ct—the constant of the turbulent flow component;
  • Cl—the constant of the laminar flow component;
  • ν—the kinematic viscosity;
  • ρ—the density of liquid.

3.5. Model of Flow Rate in Hydraulic Motor

Taking into account the liquid compressibility (the influence of the flow meter location in the measurement system) and the fact that the leakages in the motor and the deformation of the working chamber are determined by the pressure drop Δpi in the working chambers, the flow rate Q(pH) in the motor should be described by the following formula:
Q ( p H , Δ p i = c o n s t ) = A ( p H ) · n + B ( p H )

3.6. Practical Implementation of the Method

In order to determine the theoretical and actual working volume, it is necessary (step by step):
(a)
To measure the flow Q1 or Q2 at a constant inlet temperature T1 and a constant pressure drop Δp for several values of n (no less than five). The measurement has to be taken once again using at least five different pressure drops Δp;
(b)
To measure the pressure drop Δpich in the internal channel of the motor according to the method described in Section 3.4;
(c)
To calculate the pressure drop Δpi in the working chamber of the motor for data from item (a);
(d)
If the flow meter is located in the low-pressure line, the influence of the liquid compressibility should be taken into account and the flow rate Q(pH) corresponding the value of high-pressure pH in the working chamber should be calculated;
(e)
To plot the characteristics Q(pH) = f(n)Δpi=const and calculate the coefficients A in the Formula (17).

4. Results of Experimental Research

4.1. Tested Motor

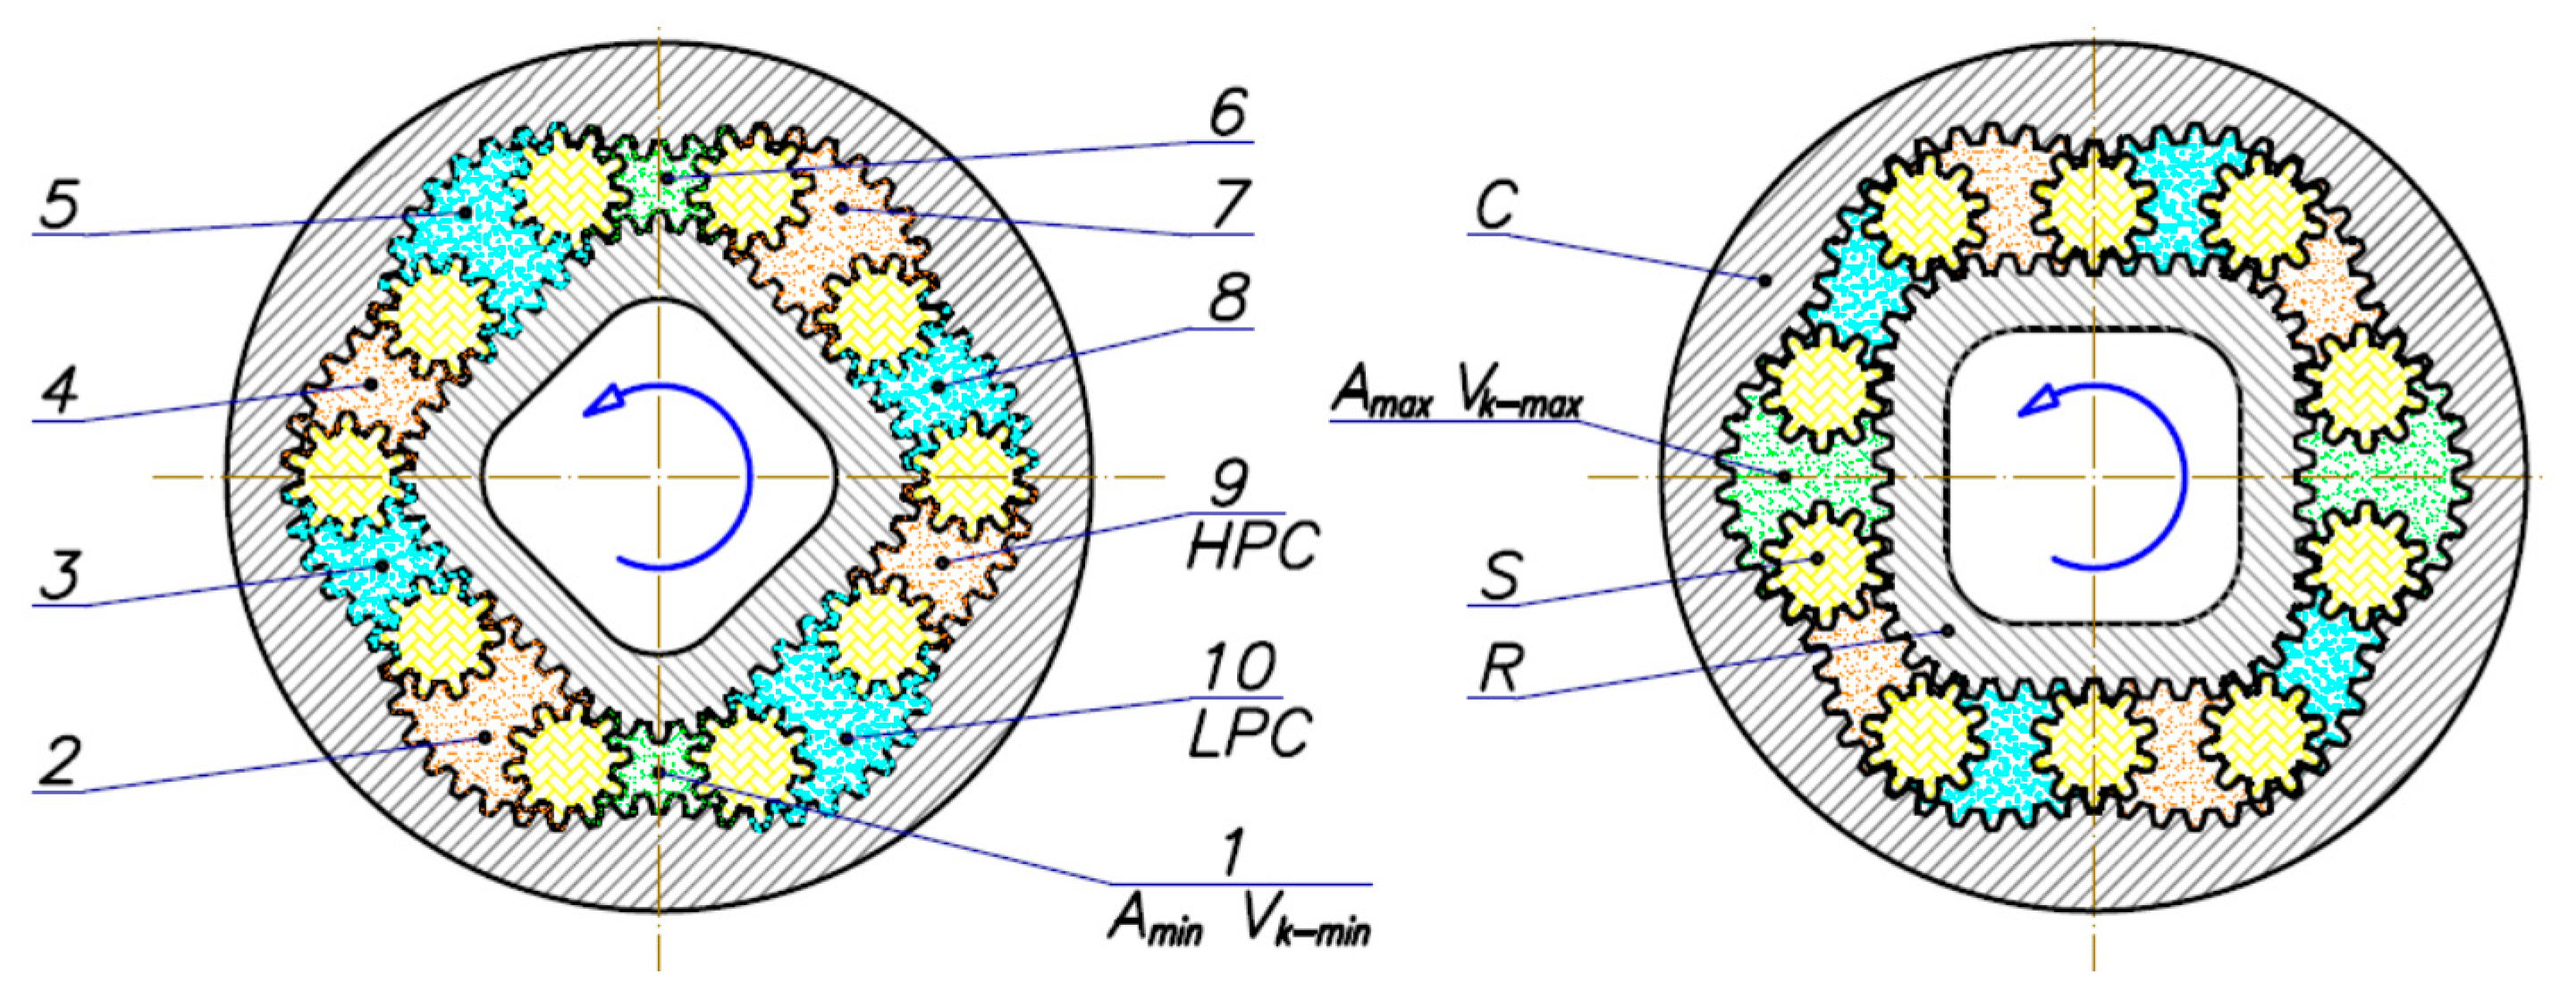
The general view and design of the prototype of hydraulics satellite motor (used in the experimental tests) is presented in Figure 6. The working mechanism of the satellite motor is presented in Figure 7. The revolving motion of rotor R is done by satellites S. The satellites S are in gear with the curvature C and the rotor R and, in the same, form the working chambers (numbers from 1 to 10 in Figure 7).
During rotation of the rotor R, the volume of working chamber increases from minimum Vk-min to maximum Vk-max (the chamber is filled and is called the high-pressure chamber HPC), and next the volume of the working chamber decreases from Vk-max to Vk-min and then the chamber is emptied (and is called a low-pressure chamber LPC).
In the presented satellite mechanism, 24 cycles of filling and emptying of the working chambers occur per one rotation of the shaft, that is n C · n R = 24 , where nR and nC are the number of humps of the rotor and the curvature, respectively [16].
The compensation plates (Figure 6—elements 6 and 7), which are also called distribution plates, distribute the liquid to the working chambers and limit the leak in the gaps on the satellites and rotor faces, i.e., the plates deform elastically and thus limit the axial clearance of the rotor and the satellites. It is assumed that a reduction in the clearance can affect the theoretical working volume.
The geometric working volume qg of the satellite mechanism is calculated according to the following formula [16]:
q g = n C · n R · H · ( A m a x A m i n )
The satellite motor used for the test had the following geometrical parameters (from CAD documentation):
  • the height of the working mechanism H = 25 mm;
  • the minimum area of the working chamber Amin = 26.11 mm2;
  • the maximum area of the working chamber Amax = 83.51 mm2.
  • Thus, the geometric working volume of the satellite mechanism was qg = 34.44 cm3/rev. Other motor parameters were:
  • the tooth module m = 0.75 mm;
  • the difference in the height of the satellites and the rotor in relations to the curvature was Δh = 5 μm.

4.2. The Test Stand and Measuring Apparatus

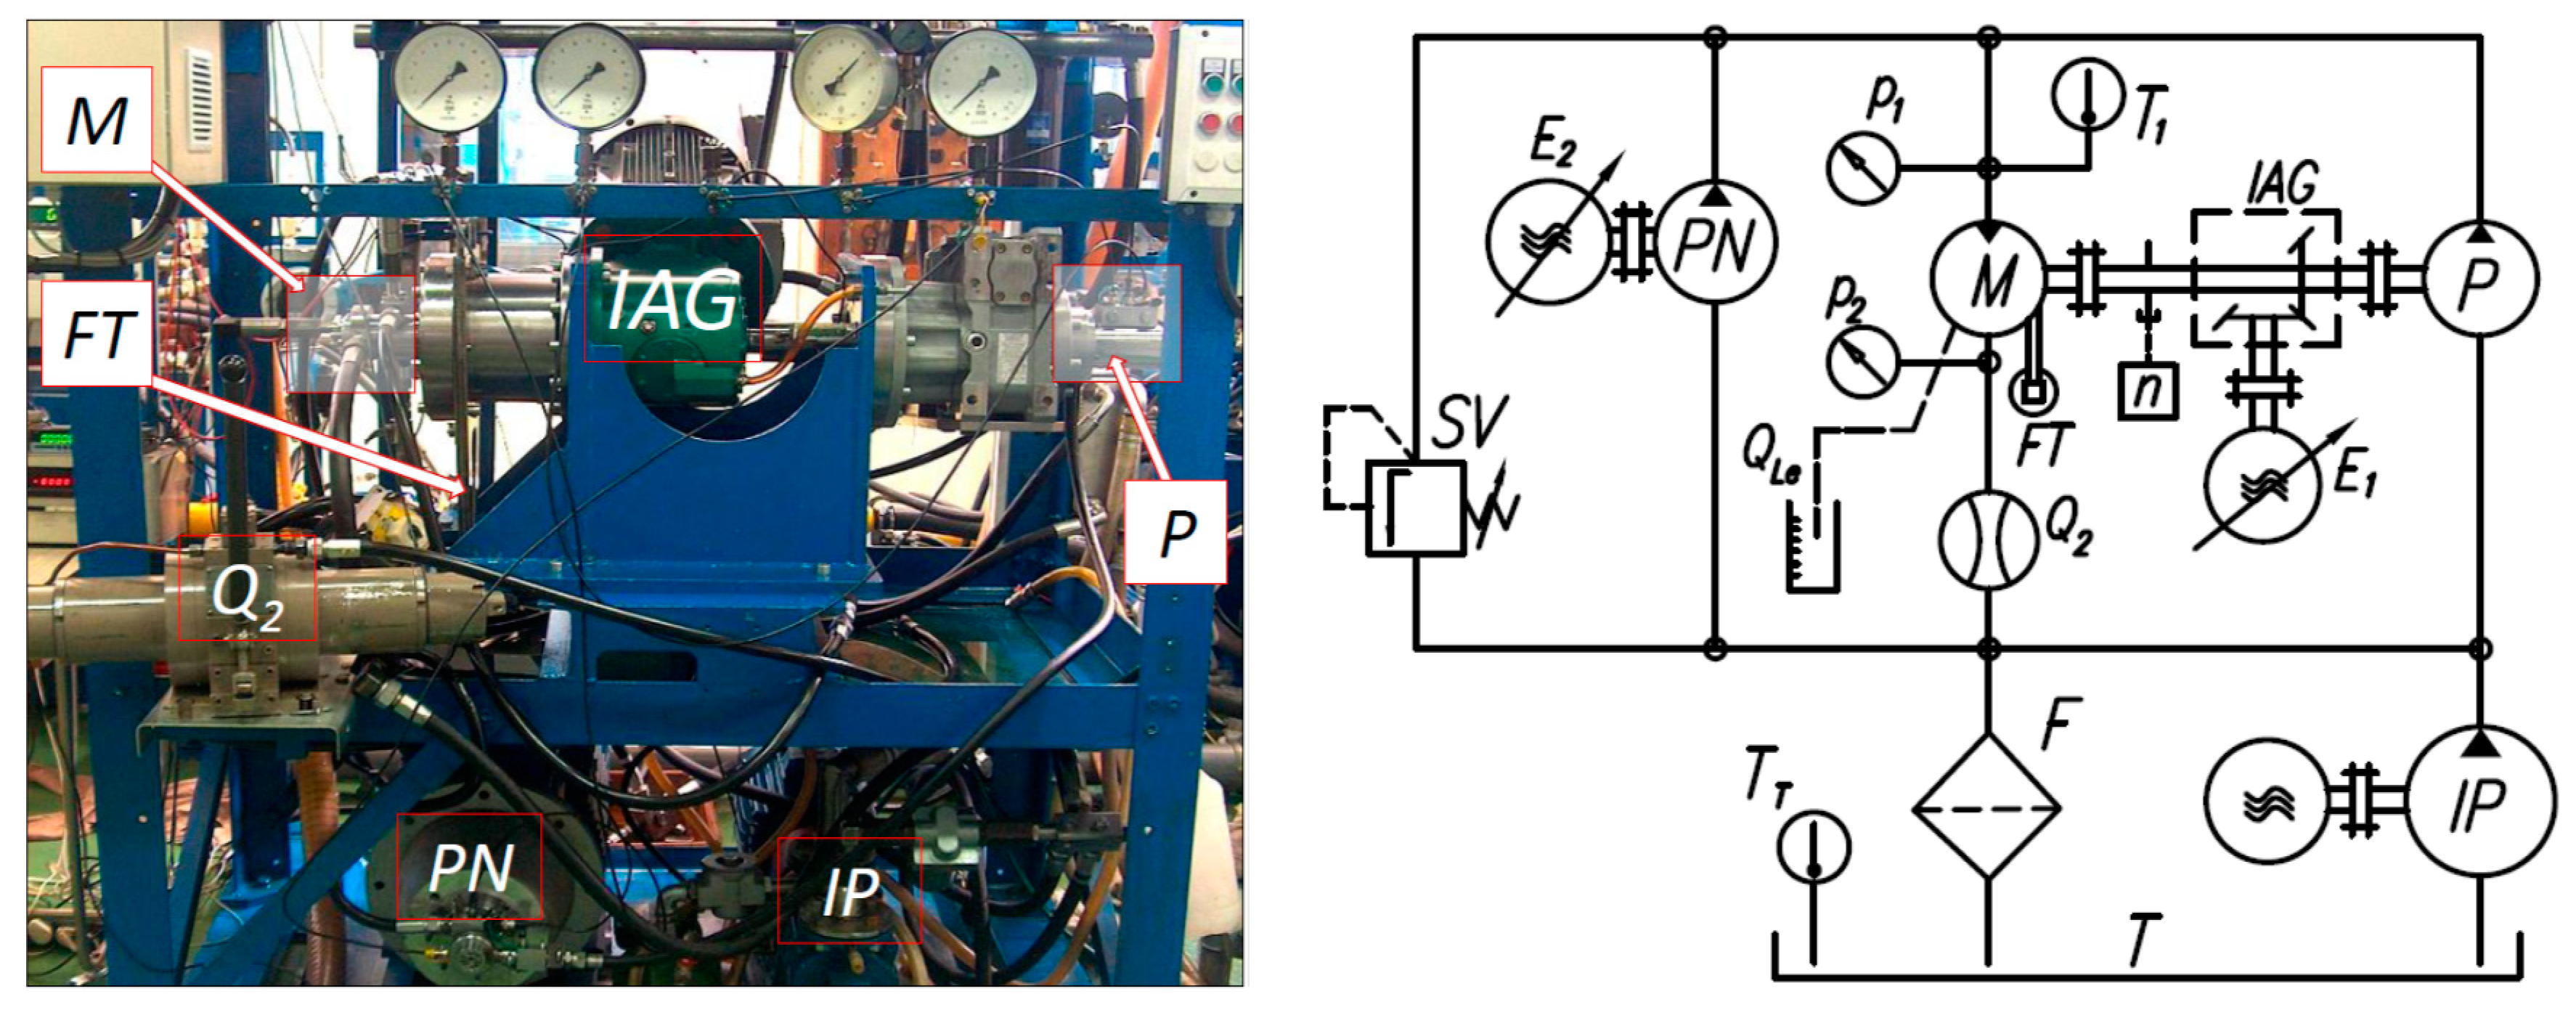
The general view of the test stand and the diagram of the measurement system of this test stand is shown in Figure 8. The test stand was set up with power recuperation.
During the test of the motor, the following parameters were measured:
  • pressure p1 in the inflow port (strain gauge pressure transducer, range 0–10 MPa and 0–40MPa, class 0.3);
  • pressure p2 in the outflow port (strain gauge pressure transducers, range 0–2.5 MPa, class 0.3);
  • flow rate Q2 (piston flowmeter, the flowmeter chamber volume 0.63 dm3, range 0–200 L/min, class 0.2, accuracy of reading 0.01 L/min, maximum measurement error 0.41 L/min);
  • torque M (strain gauge force transducer FT mounted on the arm 0.5 m (the arm attached to the motor body), range 0–100 N, class 0.1);
  • rotational speed of shaft n (inductive sensor, accuracy of measurement ±0.01 rpm);
  • temperature T1 of liquid in the inflow port of the motor (RTD temperature sensor, class A, max. measurement error 0.5 °C).
In order to determine the working volume of the motor from the experimental data with the smallest possible error, it was very important to maintain the setting of speed n, pressure drop Δp and liquid temperature T1 with the least possible deviation. Thus:
  • the rotational speed n was maintained with a deviation of ±0.1 rpm;
  • the pressure drop Δp was maintained with a deviation of ±0.05 MPa;
  • the temperature in inflow port T1 was maintained with a deviation of ±1.0 °C.
Due to the large chamber of the piston flowmeter (0.63 dm3), the shaft of the tested motor had to make about 18 rotations in order to obtain the flow rate measurement result. The piston flowmeter installed in the system measured the average value of the flow rate. This is a doubtless advantage. Furthermore, each recorded flow measurement result is the average of three measurements.

4.3. Working Liquid Parameters

The satellite motor was tested using the Total Azolla 46 oil with the temperature in the inflow port T1 = 43 °C (kinematic viscosity ν = 40 cSt, density ρ = 873 kg/m3). Knowledge of the characteristics of the tangential isentropic bulk modulus KZ(p) of mineral oil is required for the proper determination of theoretical and actual working volume of a hydraulic motor (Figure 9). These characteristics were set by Załuski according to Formula (46) for the following data [17]:
  • the bulk modulus of non-aerated oil at atmospheric pressure K = 1775 MPa;
  • the content in oil of non-dissolved air at atmospheric pressure Xo = 0.01;
  • the politrophic exponent n = 1.4;
  • the coefficient of the effect of pressure p on the bulk modulus m = 9.19;
  • the atmospheric pressure po = 0.1 MPa.
For oil in the test stand and for p > 2 MPa:
ρ o ρ 1 = 704.65 · 10 6 · Δ p + 726.32 · 10 8 · ( Δ p ) 2 818.59 · 10 10 · ( Δ p ) 3 826.5 · 10 5

4.4. Pressure Drop in Motor Internal Channels

Based on the results of the experimental research carried out according to the method described in Section 3.4, the pressure drop Δpich in the motor internal channels can be described by the following empirical formula (according to (43)):
Δ p i c h = 0.003224 · Q 2 + 0.02183 · Q
where Q is measured in [L/min] and Δpich in [MPa].

4.5. Motor Output Flow Rate Characteristics

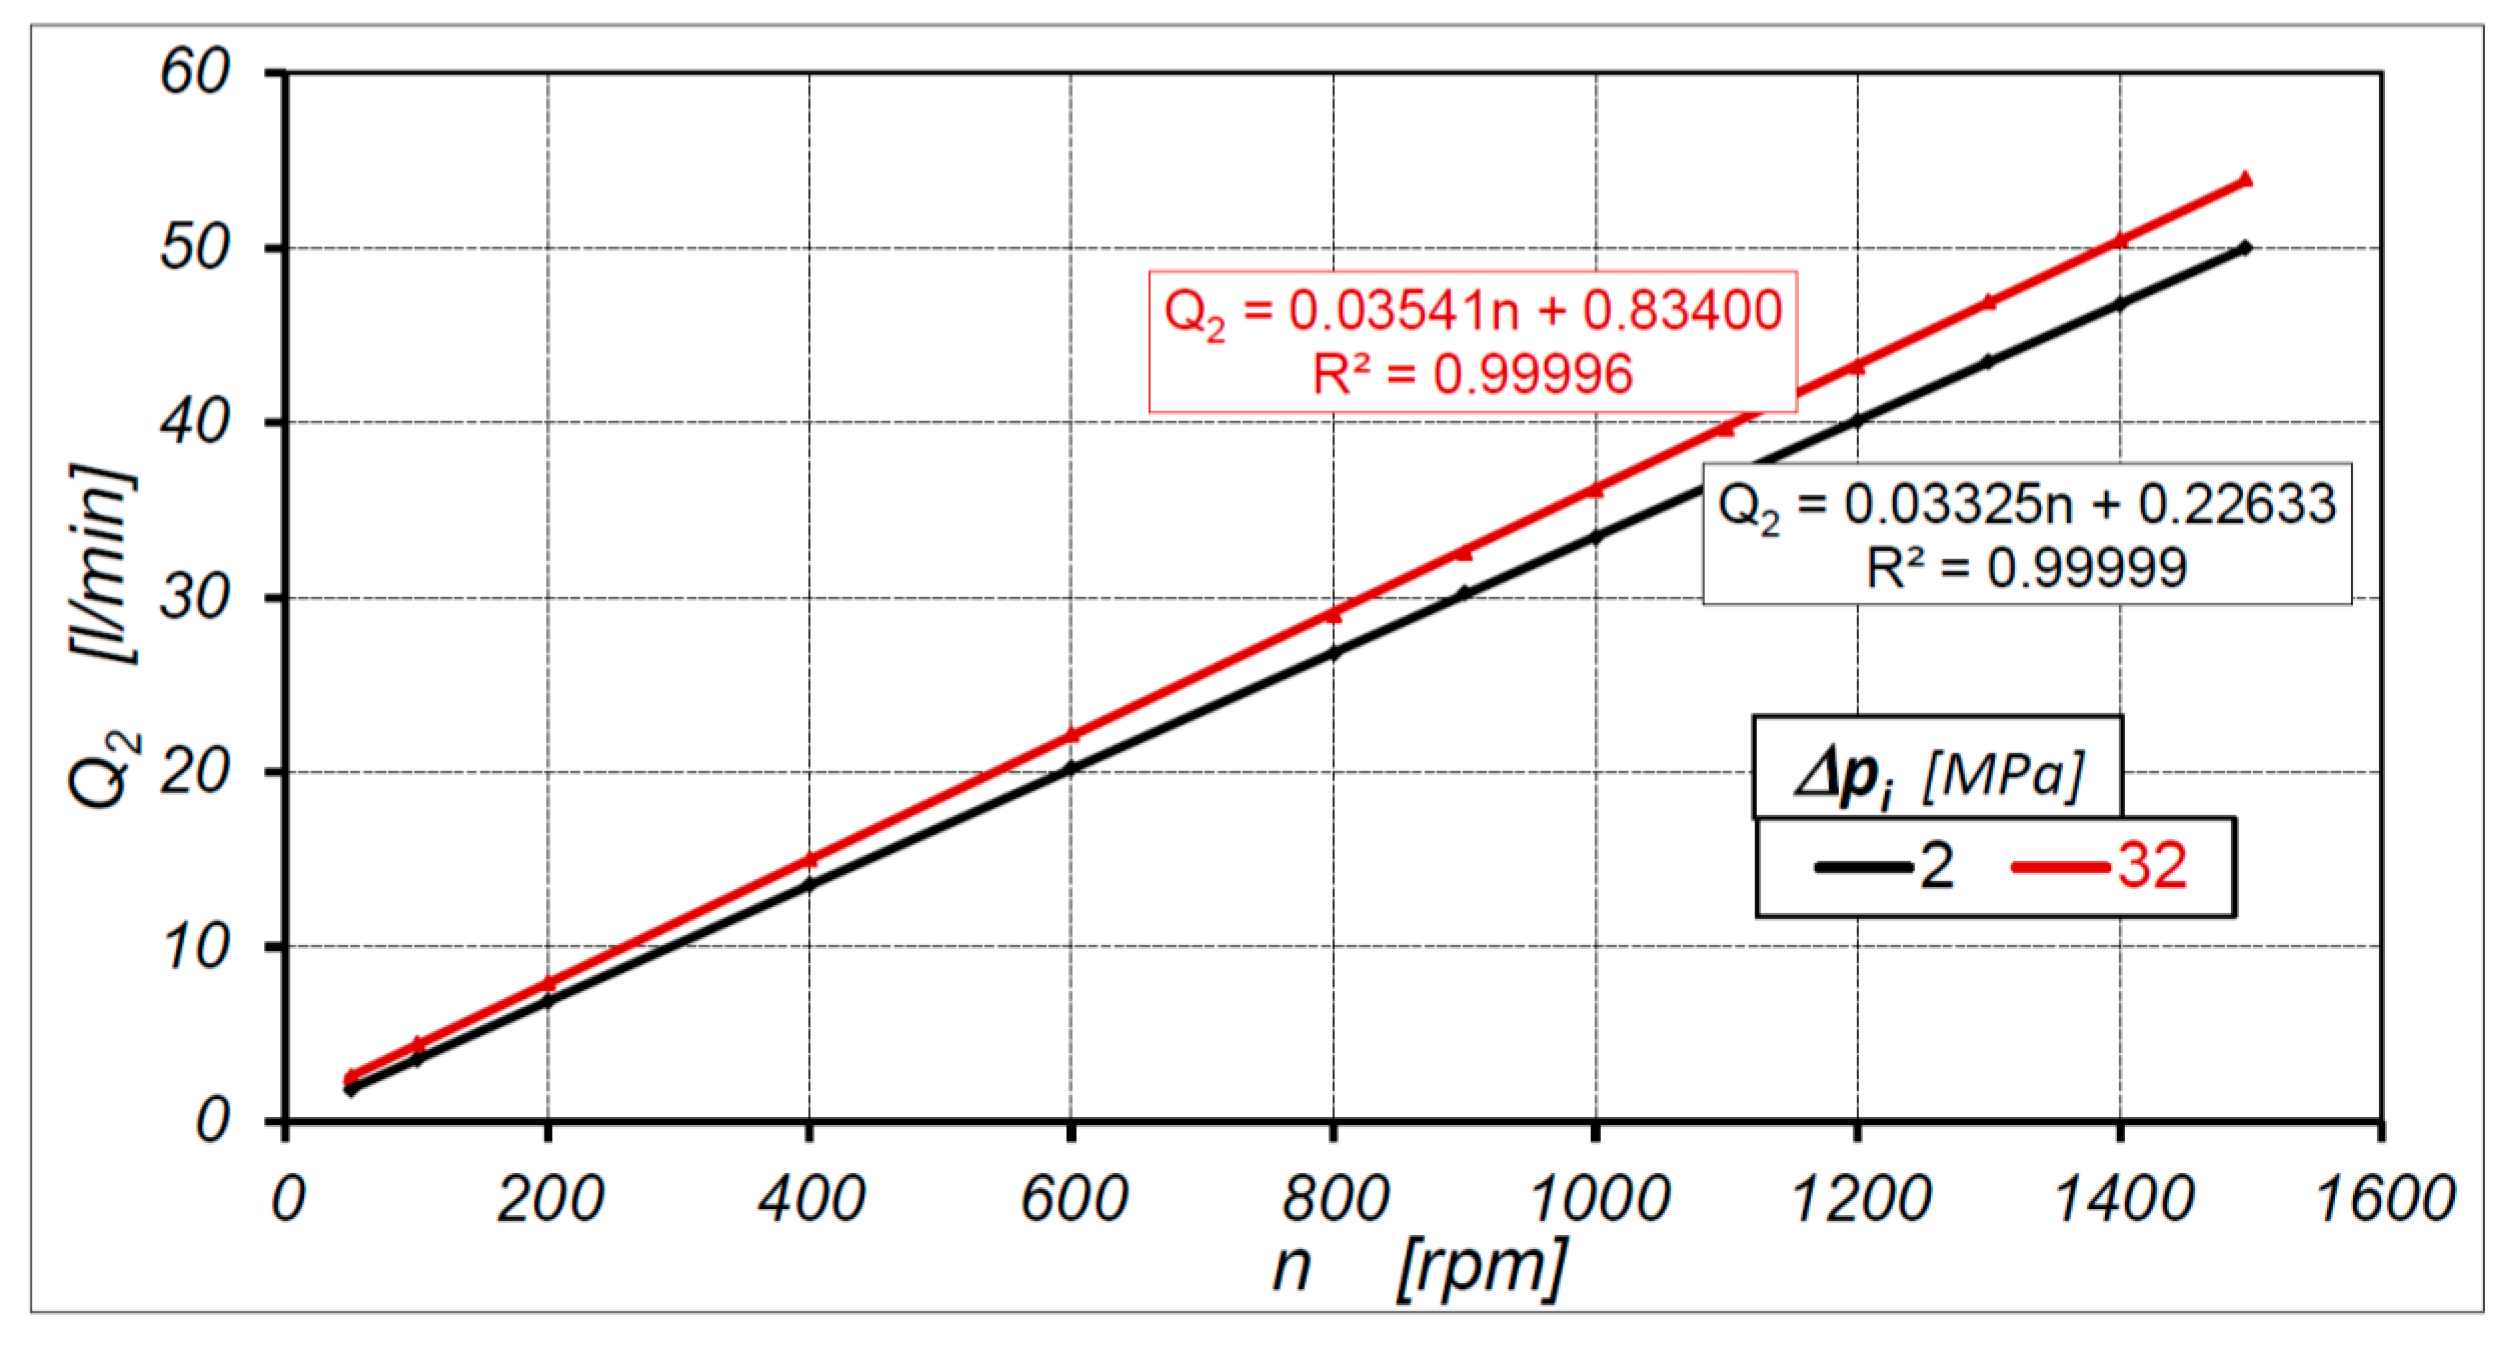
The experimental test of the satellite motor was carried out in the rotational speed range n = 50 –1500 rpm. The characteristics Q2 = f(n) at Δp = const. were determined in the entire speed range and in the speed range n = 50–150 rpm (Figure 10). In order to maintain the clarity of the graphs, the characteristics are shown only for two extreme pressure drops in the motor, that is, for Δp = 2 MPa and Δp = 32 MPa. The characteristics of Q2 = f(n) at other values of Δp are described by equations and are presented in the Appendix A in Table A1 and Table A2.
The characteristics of external leakage QLe in the tested motor are shown in Figure 11. It is the average value of leakages for the whole range of rotational speed n.
After taking into account the pressure drop Δpich in the internal channels of the motor, the characteristics of output flow rate Q2 take the form like in Figure 12 (for Δpi = 2 MPa and Δpi = 32 MPa). The influence of liquid compressibility was omitted. The characteristics for other Δpi, omitting the liquid compressibility, are described by equations and presented in the Appendix A in Table A3.
The results of the flow rate measurements Q2 (Figure 10) were corrected for the difference resulting from the compression of the oil to the supply pressure p1—according to Formula (40) (Toet’s method) and Formula (42) (Balawender’s method). The characteristics presented in Figure 13 were obtained as a result. The characteristics of Q(p1) for other Δp are described by equations and presented in the Appendix A in Table A4 and Table A5.
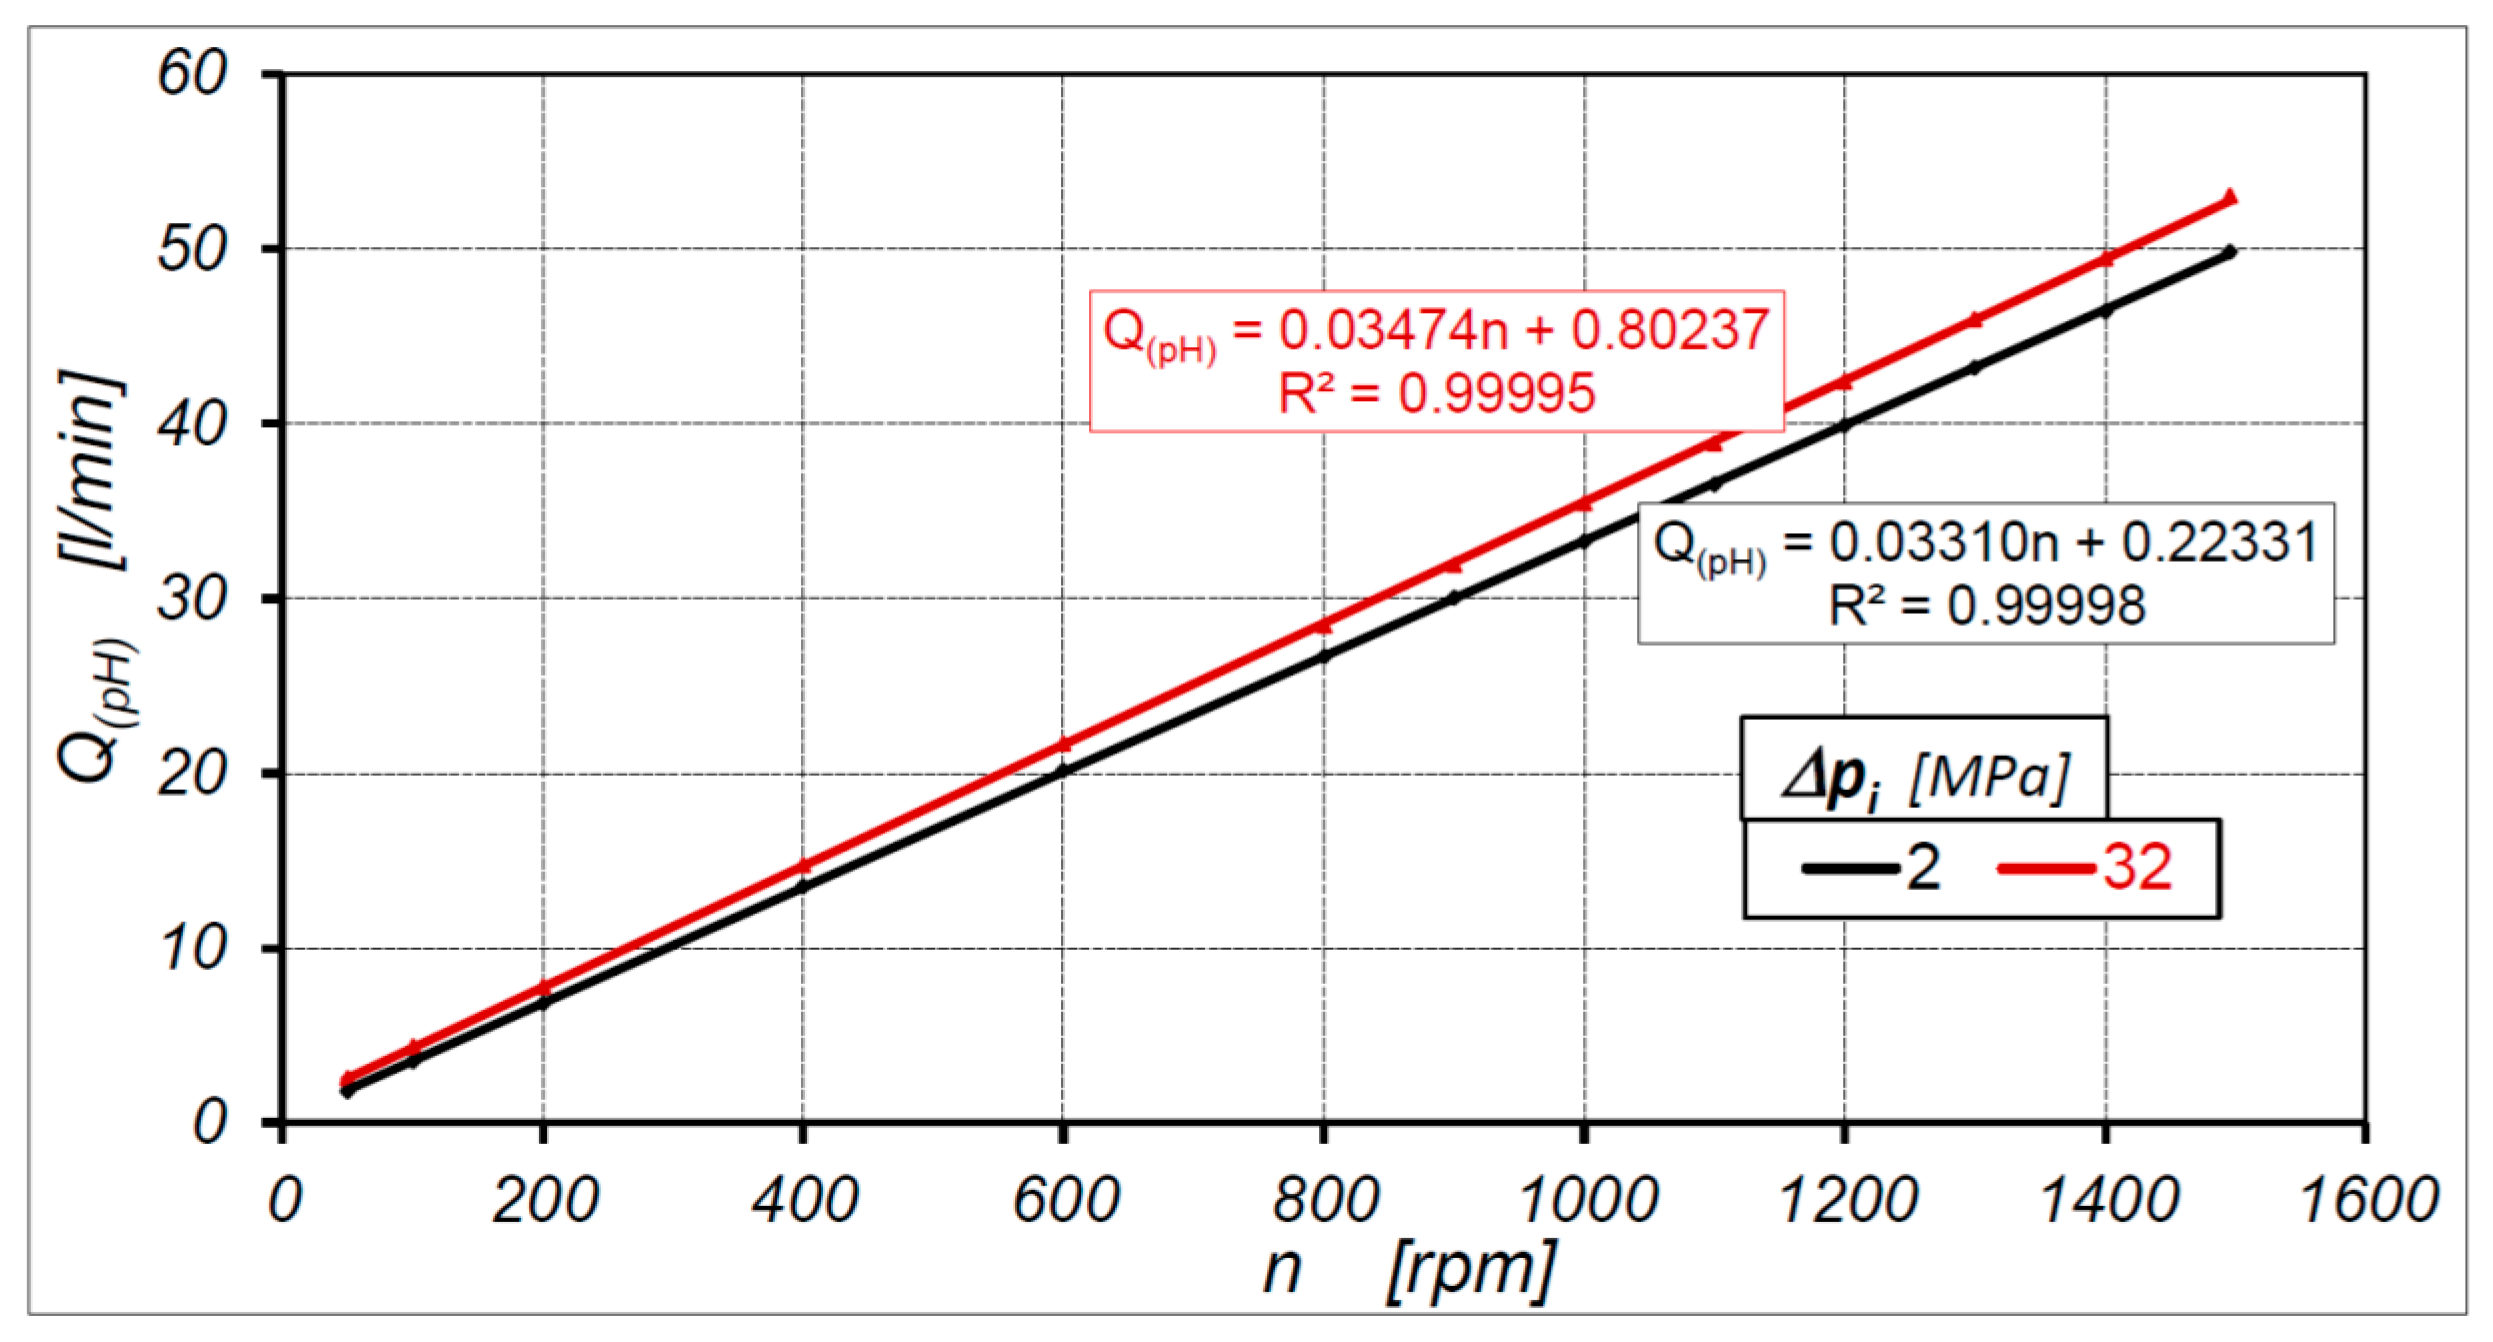
Using the method described in Section 3.3, the flow rate Q(pH) related to the pressure pH in the high-pressure chamber of the motor was calculated, and the liquid compressibility was taken into account. The characteristics of Q(pHpi=const.) = f(n) for Δpi = 2 MPa and Δpi = 32 MPa are shown in Figure 14. The characteristics for other Δpi are described by equations and presented in the Appendix A in Table A6.

4.6. Motor Theoretical Working Volume According to Known Methods

The working volume A was calculated for two cases, omitting and including the influence of oil compressibility. The characteristics of A = f(Δp) determined according to Toet’s and Balawender’s method for both cases are presented in Figure 15. The characteristics of external leakage in the motor show, that lim · p 0 Q L e ( · p ) = 0 (Figure 11). Thus, in Balawender’s method, the external leakage does not affect the theoretical working volume qt.

4.7. Motor Theoretical Working Volume According to Proposed Method

In Figure 16 are shown the characteristics A = f(Δpi) of the working volume A per one revolution of the shaft:
(a)
determined taking into account the influence of oil compressibility;
(b)
determined omitting the influence of oil compressibility.
The theoretical working volume qt of the motor determined by all the methods described above is shown in Table 1.

5. Discussion

The results of the experimental research confirm that the following characteristics can be described by a linear function of the rotational speed n:
(a)
Q2 = f(n)Δp=const (Figure 10);
(b)
Q2 = f(n)Δpi=const (Figure 12);
(c)
Q(pH) = f(n)Δpi=const (Figure 14).
The value of the correlation coefficient R2 of the above-mentioned linear function is close to one (R2 > 0.999). Hence, the equations accurately describe the process of the fluid flow in the motor. Undoubtedly, the small scatter of the measurement results was mainly influenced by the piston flow meter. This flow meter measured the average flow rate corresponding to more than 18 revolutions of the motor shaft. Thus, the result indicated by the flow meter is the result of over 432 cycles of filling and emptying of the working chambers. Furthermore, very precise parameters were maintained during the tests, as described in Section 4.2.
The results of the experimental research confirm that, regardless of the method used, the theoretical working volume qt of a hydraulic motor is independent of its rotational speed n. However, the value of qt depends on the method used to calculate it (Table 1). Theoretical working volume qt calculated using Balawender’s method differs up to 1.43% from qt calculated using Toet’s method. This difference is not big. Nevertheless, it is difficult to indicate a more reliable result because both Toet’s method and Balawender’s method contain simplifications (described in Section 3.3 and Section 3.4).
Nonetheless, qt calculated using the new method (taking into account the pressure drop in the motor internal channels, the flowmeter position in the measurement system and the influence of oil compressibility) is about 1.06% larger than qt calculated using Balawender’s method and is about 0.22% larger than qt calculated using Toet’s method (Table 1). These differences are also not big. It is assumed that one of the main reasons for such small differences in the results may be the low pressure drop Δpi in the motor internal channels. In addition, for this motor, simplified calculations of the effect of liquid compressibility on the flow rate (according to Toet’s and Balawender’s methods) do not have, as can be seen, any greater impact on the theoretical working volume qt.
Omitting the influence of liquid compressibility in the proposed method overstates the theoretical working volume by about 0.5%. Is this value small or large? From the point of view of the motor user, a difference of 0.5% is negligibly small. Bigger differences are observed in the known methods, i.e., they are 0.8% and 3.1% in Toet’s and Balawender’s methods, respectively. A difference in the order of 1% and above, however, should not be underestimated, especially by designers and researchers of positive displacement machines. From their point of view, each difference in the theoretical working volume is important because it directly influences the assessment of mechanical and volumetric efficiency.
The theoretical working volume qt is constant in all ranges of speed n and load M of the motor. It has been shown above that with the change in the motor load (and thus the pressure drop in the motor) the working volume of the motor changes. Thus, the efficiencies defined according to Formulas (1) and (2) are subject to error. Therefore, the efficiencies should be calculated taking into account the actual working volume qr:
η m = 2 π · M q r · Δ p i
η v = q r · n Q 1
where if Δpi = 0 then qr = qt.
For example, if the theoretical working volume calculated according to the simplified (omitting the influence of oil compressibility) Balawender’s method is accepted for calculations of losses, the volumetric efficiency of the motor for Δpi < 4 MPa is larger than one (ηv > 1) (Figure 17). This makes no physical sense, of course.
The theoretical working volume qt in all ranges of pressure drops Δpi in the motor has commonly been accepted for assessment of losses in a hydraulic motor and its efficiencies, whereby it causes (Figure 17):
  • an overestimation of volumetric losses and an underestimation of volumetric efficiency ηv;
  • an underestimation of mechanical losses and an overestimation of mechanical efficiency ηm.
The results of the experimental research (Figure 16) confirm that the actual working volume qr is a nonlinear function of pressure drop Δpi in working chambers of the motor and can be described by a third order polynomial (expressed by Formula (29)). It should be clearly emphasized that the actual working volume qr is determined including the influence of oil compressibility and the pressure drop Δpich in the motor internal channels. Then qr = A = f(Δpi) and qr > qt for Δpi > 0. Therefore, the values of qr according to Formula (29) should be taken into account to calculate the volumetric and mechanical losses in a hydraulic motor. In the tested satellite motor, this is:
q r = 0.00002054 · Δ p i 3 0.00211551 · Δ p i 2 + 0.10404691 · Δ p i + 32.91602674
From a practical point of view, it may seem a bit problematic to measure the pressure drop Δpich in internal channels of a hydraulic motor according to the method described in Section 3.4. For example, according to this method Δpich in an axial piston motor cannot be measured. Nevertheless, this measurement can be made using other methods, described in detail in [16].
Another issue requiring discussion is the value of geometric working volume qg of the motor resulting from the CAD drawing documentation. Thus, this geometric working volume qg is as much as 4.6% larger than the theoretical working volume qt calculated according to the proposed new method. Why such a big difference? Components of the working mechanism are made by electrical cutting with wire. Obviously, this cut is made with certain allowance for the finishing treatment (lapping). The manufacturer of the motor does not reveal the size of the allowance and the final geometrical dimensions after lapping. As a result, the geometrical working volume of a satellite motor is definitely smaller than that of the drawing documentation. In addition, there are teeth tip clearances in a satellite working mechanism, the effect of which is a certain volume included in the geometric working volume. It can be assumed that the impact of this volume on the process of pumping liquid through the working mechanism is small or negligible. However, this thesis would require proof.

Funding

This research was funded by the National Centre for Research and Development in Poland, grant number LIDER/35/102/L-2/10/NCBiR.

Conflicts of Interest

The author declares no conflict of interest.

Appendix A

Table A1. Equations Q2 = A·n + B of motor output flow rate at Δp = const. (Toet’s method).
No.Δp [MPa]Q2 = A n + BA [cm3/rev]R2
12Q2 = 0.033120·n + 0.24549633.1200.999984
24Q2 = 0.033369·n + 0.37931233.3690.999982
36Q2 = 0.033590·n + 0.44114133.5900.999974
48Q2 = 0.033762·n + 0.46246133.7620.999988
510Q2 = 0.033973·n + 0.47632733.9730.999979
612Q2 = 0.034124·n + 0.49848034.1240.999990
714Q2 = 0.034256·n + 0.51811634.2560.999970
816Q2 = 0.034411·n + 0.56637034.4110.999989
920Q2 = 0.034689·n + 0.64984234.6890.999989
1024Q2 = 0.034968·n + 0.73556434.9680.999992
1128Q2 = 0.035170·n + 0.80005035.1700.999986
1232Q2 = 0.035349·n + 0.85226835.3490.999966
Table A2. Equations Q2 = A·n + B of motor output flow rate at Δp = const. (Balawender’s method).
No.Δp [MPa]Q2 = A·n + BA [cm3/rev]R2
12Q2 = 0.033715·n + 0.14547433.7150.999960
24Q2 = 0.033844·n + 0.25694433.8440.999785
36Q2 = 0.034086·n + 0.32720634.0860.999926
48Q2 = 0.034232·n + 0.37255034.2320.999909
510Q2 = 0.034517·n + 0.38890334.5170.999904
612Q2 = 0.034577·n + 0.42986634.5770.999537
714Q2 = 0.034732·n + 0.43035034.7320.999907
816Q2 = 0.034931·n + 0.48672534.9310.999677
920Q2 = 0.035275·n + 0.54084235.2750.999824
1024Q2 = 0.035629·n + 0.66469835.6290.999920
1128Q2 = 0.035868·n + 0.74299435.8680.999823
1232Q2 = 0.036213·n + 0.80107336.2130.999438
Table A3. Equations Q2 = A·n + B of motor output flow rate at Δpi = const. (new method without the influence of the oil compressibility).
No.Δp [MPa]Q2 = A·n + BA [cm3/rev]R2
12Q2 = 0.033251·n + 0.22633433.2510.999992
24Q2 = 0.033513·n + 0.29148733.5130.999989
36Q2 = 0.033714·n + 0.34738333.7140.999992
48Q2 = 0.033881·n + 0.39716133.8810.999995
510Q2 = 0.034034·n + 0.44299534.0340.999996
612Q2 = 0.034183·n + 0.48630334.1830.999995
714Q2 = 0.034333·n + 0.52792534.3330.999994
816Q2 = 0.034484·n + 0.56828434.4840.999995
920Q2 = 0.034778·n + 0.64553034.7780.999996
1024Q2 = 0.035035·n + 0.71718935.0350.999992
1128Q2 = 0.035235·n + 0.78109035.2350.999979
1232Q2 = 0.035408·n + 0.83400035.4080.999957
Table A4. Equations Q(p1) = A·n + B of motor output flow rate at Δp = const. (Toet’s metod).
No.Δp [MPa]Q(p1) = A·n + BA [cm3/rev]R2
12Q(p1) = 0.032787·n + 0.24549732.7880.999984
24Q(p1) = 0.032991·n + 0.37931232.9910.999983
36Q(p1) = 0.033168·n + 0.44114133.1680.999974
48Q(p1) = 0.033298·n + 0.46246233.2980.999988
510Q(p1) = 0.033468·n + 0.47632833.4680.999978
612Q(p1) = 0.033580·n + 0.49848133.5800.999991
714Q(p1) = 0.033674·n + 0.51811633.6740.999969
816Q(p1) = 0.033791·n + 0.56637033.7910.999989
920Q(p1) = 0.033996·n + 0.64984233.9960.999989
1024Q(p1) = 0.034207·n + 0.73556434.2070.999992
1128Q(p1) = 0.034340·n + 0.80005034.3400.999986
1232Q(p1) = 0.034452·n + 0.85226934.4520.999965
Table A5. Equations Q(p1) = A·n + B of motor output flow rate at Δp = const. (Balawender’s metod).
No.Δp [MPa]Q(p1) = A·n + BA [cm3/rev]R2
12Q(p1) = 0.032566·n + 0.13792632.5660.999848
24Q(p1) = 0.032770·n + 0.24845932.7700.999924
36Q(p1) = 0.032906·n + 0.31658832.9060.999977
48Q(p1) = 0.032797·n + 0.37359932.7970.999991
510Q(p1) = 0.032923·n + 0.40454932.9230.999977
612Q(p1) = 0.032867·n + 0.45247432.8670.999993
714Q(p1) = 0.033010·n + 0.44362633.0100.999967
816Q(p1) = 0.033279·n + 0.45297733.2790.999982
920Q(p1) = 0.033603·n + 0.50974833.6030.999537
1024Q(p1) = 0.033501·n + 0.68288533.5010.999856
1128Q(p1) = 0.033663·n + 0.72282133.663 0.999790
1232Q(p1) = 0.033824·n + 0.79167833.8240.999661
Table A6. Equations Q(pH) = A·n + B of motor output flow rate at Δpi = const. (new method).
No.Δpi [MPa]Q(pH) = A·n + BA [cm3/rev]R2
12Q(pH) = 0.033095·n + 0.22331033.0950.999982
24Q(pH) = 0.033308·n + 0.34618033.3080.999991
36Q(pH) = 0.033487·n + 0.40430233.4870.999993
48Q(pH) = 0.033638·n + 0.43119433.6380.999992
510Q(pH) = 0.033769·n + 0.44806733.7690.999990
612Q(pH) = 0.033886·n + 0.46685733.8860.999988
714Q(pH) = 0.033997·n + 0.49284333.9970.999988
816Q(pH) = 0.034105·n + 0.52687534.1050.999989
920Q(pH) = 0.034315·n + 0.61084634.3150.999990
1024Q(pH) = 0.034497·n + 0.69620334.4970.999988
1128Q(pH) = 0.034626·n + 0.76454834.6260.999979
1232Q(pH) = 0.034744·n + 0.80237234.7440.999947

References

  1. Wilson, W.E. Positive Displacement Pumps and Fluid Motors; Publication Corporation: New York, NY, USA, 1950. [Google Scholar]
  2. Schlosser, W.M.J. Meten aan Verdringerpompen. Ph.D. Thesis, Technical Hogeschool Delft, Delft, The Netherlands, 1957. [Google Scholar]
  3. Schlosser, W.M.J.; Hilbrands, J.W. Das Theoretische Hubvolumen von Verdrangerpumpen; No. 4. Olhydraul. und Pneum. 1963, 7, 133–138. [Google Scholar]
  4. Schlosser, W.M.J.; Hilbrands, J.W. Das Volumetrische Wirkungsgrad von Verdrongerpumpen; No. 12. Olhydraul. und Pneum. 1963, 7, 469–476. [Google Scholar]
  5. Toet, G. Die Bestimmung des Theoretischen Hubvolumens von hydrostatischen Verdrangerpumen und Motoren aus Volumetrischen Messungen; No 14. Olhydraul. und Pnaum. 1970, 14, 185–190. [Google Scholar]
  6. Toet, G.; Johnson, J.; Montague, J.; Torres, K.; Garcia-Bravo, J. The determination of the theoretical stroke volume of hydrostatic positive displacement pumps and motors from volumetric measurements. Energies 2019, 12, 415. [Google Scholar] [CrossRef] [Green Version]
  7. Balawender, A. Opracowanie Metodyki Wyznaczania Teoretycznej Objętości Roboczej Pomp i Silników Hydraulicznych Wyporowych (The Development of the Methodology for the Determination of the Theoretical Working Volume of Positive Displacement Pumps and Hydraulic Motors). Ph.D. Thesis, Gdansk University of Technology, Gdansk, Poland, 1974. [Google Scholar]
  8. Balawender, A. Analiza energetyczna i metodyka badań silników hydraulicznych wolnoobrotowych (Energy analysis and methodics of testing of low-speed hydraulic motors). In Scientific Book of the Gdansk University of Technology; Mechanika No. 54; Gdansk University of Technology Publishing House: Gdansk, Poland, 1988. [Google Scholar]
  9. Garcia-Bravo, J.; Nicholson, J. What is the real size of that pump? Fluid Power J. 2018. Available online: https://fluidpowerjournal.com/real-size-pump/ (accessed on 1 September 2020).
  10. Manring, N.; Williamson, C. The theoretical Volumetric Displacement of a check-valve type, digital displacement pump. J. Dyn. Syst. Meas. Control 2019, 141, 12–14. [Google Scholar]
  11. Myszkowski, A. Energy analysis of an ideal suction-pressure unit. Arch. Mech. Technol. Mater. 2015, 35, 51–60. [Google Scholar]
  12. Post, W. Models for steady-state performance of hydraulic pumps: Determination of displacement. In Proceedings of the 9th Bath International Fluid Power Workshop, University of Bath, Bath, UK, 9–11 September 1996; Volume 9. [Google Scholar]
  13. International Organisation for Standardization. ISO 8426:2008: Hydraulic Fluid Power. Positive Displacement Pumps and Motors. Determination of Derived Capacity; ISO Copyright Office: Geneva, Switzerland, 2008. [Google Scholar]
  14. Kim, T.; Kalbfleisch, P.; Ivantysynova, M. The effect of cross porting on derived displacement volume. Int. J. Fluid Power 2014, 15. [Google Scholar] [CrossRef]
  15. Stryczek, S. Napęd Hydrostatyczny; WNT: Warszawa, Poland, 2005. [Google Scholar]
  16. Sliwinski, P. Satellite Displacement Machines. Basic of Design and Analysis of Power Loss; Gdansk University of Technology Publishers: Gdansk, Poland, 2016. [Google Scholar]
  17. Osiecki, L. Commutation Units of Hydraulics Axial Piston Machines; Gdansk University of Technology Publishers: Gdansk, Poland, 2006. [Google Scholar]
  18. Zaluski, P. Influence of the Position of the Swash Plate Rotation Axis on the Volumetric Efficiency of Axial Piston Pumps. Ph.D. Thesis, Gdansk University of Technology, Gdansk, Poland, 2017. [Google Scholar]
  19. Sliwinski, P.; Patrosz, P. Satellite Operating Mechanism of the Hydraulic Displacement Machine. Patent PL218888, 27 February 2015. [Google Scholar]
  20. Sliwinski, P. The methodology of design of axial clearances compensation unit in hydraulic satellite displacement machine and their experimental verification. Arch. Civ. Mech. Eng. 2019, 19. [Google Scholar] [CrossRef]
  21. Sliwinski, P. The influence of water and mineral oil on mechanical losses in a hydraulic motor for offshore and marine application. Pol. Marit. Res. 2020, 27. [Google Scholar] [CrossRef]
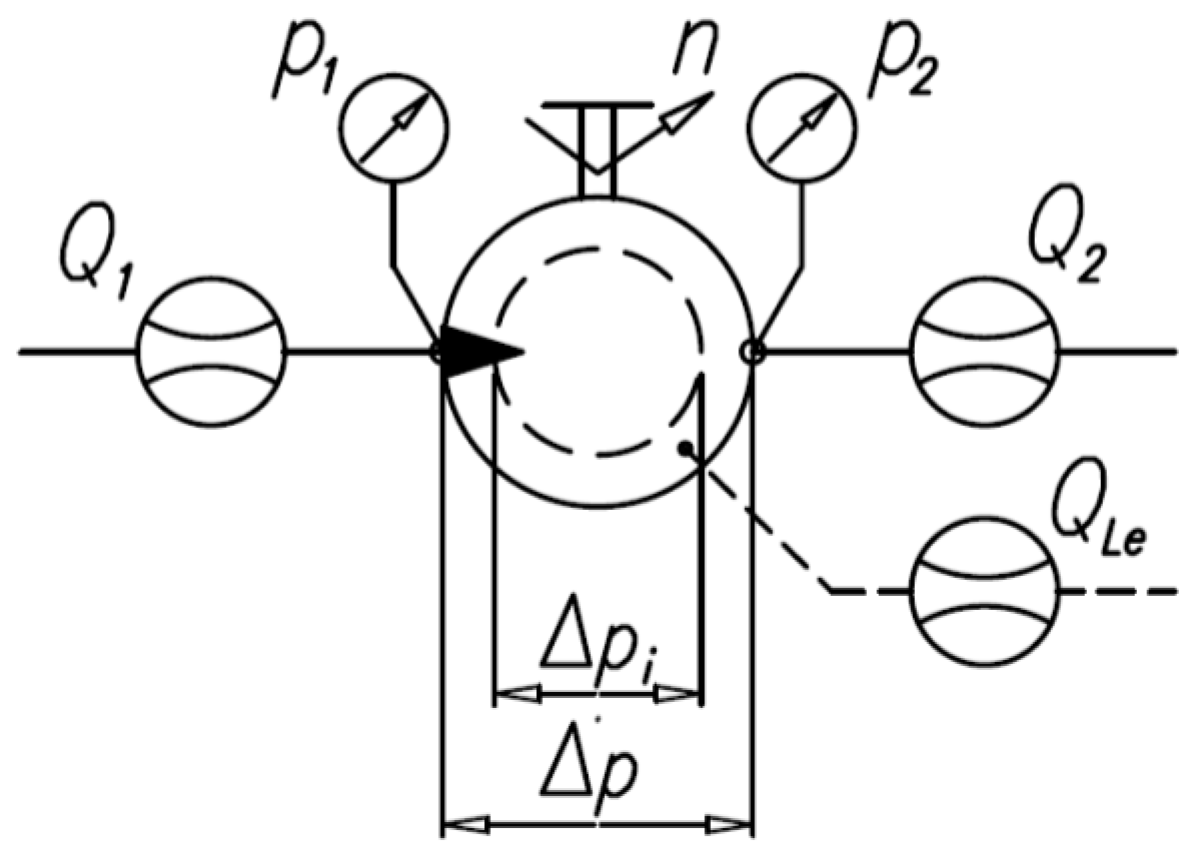
Figure 1. Symbol of hydraulic motor with measuring instruments: Q1, Q2 and QLe—flowmeters, p1 and p2—pressure gauges, n—speedometer, Δp—pressure drop in motor, Δpi—pressure drop in motor working chambers.
Energies 13 05933 g001
Figure 2. Linear interrelationship between motor input flow rate Q1 and shaft speed n [6].
Energies 13 05933 g002
Figure 3. Working volume A vs. pressure difference Δp for a hydraulic motor [6].
Energies 13 05933 g003
Figure 4. Working volume A and leakage B vs. pressure difference Δp for hydraulic motor [7,8].
Energies 13 05933 g004
Figure 5. Diagram of the hydraulic circuit of the test stand for measuring the pressure drop in the internal channel of a hydraulic motor [16]: D and L—suction tube diameter and length, respectively, 1—tested motor, 2—electric motor controlled by a frequency converter, Q2—flow meter, n—rotational speed, pLPC—pressure in the low-pressure working chamber, p1—pressure in the motor inflow port, Δpich1—pressure drop in the high-pressure internal channel of the motor.
Energies 13 05933 g005
Figure 6. Hydraulic satellite motor [16]: C—curvature (stator); S—satellite; R—rotor; 1—shaft; 2—case; 3 and 4—inflow and outflow manifolds, respectively; 5—rear body; 6 and 7—distribution (compensation) plates.
Energies 13 05933 g006
Figure 7. Satellite mechanism of type II [16,19,20,21]: C—curvature, R—rotor, S—satellite, 1–10—working chambers, HPC—high pressure chambers, LPC—low pressure chambers, Vk-min—working chamber with minimum volume (dead chamber) and with minimum area Amin, Vk-max—working chamber with maximum volume and with maximum area Amax.
Energies 13 05933 g007
Figure 8. Diagram of the test stand measurement system [21]: P—pump, M—tested hydraulic motor, PN—pump for filling leaks in P and M, IP—impeller pump (pre-supply pomp), SV—safety valve, F—filter, T—reservoir, IAG—intersecting axis gear, E1 and E2—electric motors with frequency converters, T1, TT—temperature sensors, Q2—flowmeter, QLe—leakage measurement, FT—force transducer (torque measurement), n—inductive sensor (rotational speed measurement).
Energies 13 05933 g008
Figure 9. Tangential isentropic bulk modulus KZ(p) of Total Azolla mineral oil in the test stand [18].
Energies 13 05933 g009
Figure 10. Characteristics of motor output flow rate Q2 as a function of rotational speed n at Δp = const. On the left—Toet’s method; on the right—Balawender’s method.
Energies 13 05933 g010
Figure 11. Characteristics of external leakage QLe in the motor.
Energies 13 05933 g011
Figure 12. Characteristics of motor output flow rate Q2 vs. rotational speed n at Δpi = const. The influence of liquid compressibility is omitted.
Energies 13 05933 g012
Figure 13. Characteristics of motor output flow rate Q(p1) related to pressure p1 in the motor inflow port vs. rotational speed n at Δp = const. On the left—Toet’s method; on the right—Balawender’s method.
Energies 13 05933 g013
Figure 14. Characteristics of motor output flow rate Q(pH) related to the pressure in the high-pressure working chamber vs. rotational speed n at Δpi = const.
Energies 13 05933 g014
Figure 15. Characteristics of working volume A vs. pressure drop Δp in the motor. On the left—Toet’s method; on the right—Balawender’s method.
Energies 13 05933 g015
Figure 16. Characteristics of working volume A vs. pressure drop Δpi in the motor working chambers including and omitting the influence of oil compressibility.
Energies 13 05933 g016
Figure 17. Comparison of volumetric efficiency ηv (on the left) and mechanical efficiency ηm (on the right) of the satellite motor at n = 1500 rpm for different working volumes.
Energies 13 05933 g017
Table 1. Theoretical working volume qt of a satellie motor.
Methodqt [cm3/rev]
From project—qg34.440
Omitting the influence of oil compressibilityToet33.105
Balawender33.577
Proposed method33.076
Including the influence of oil compressibilityToet32.842
Balawender32.571
proposed method32.916
Publisher’s Note: MDPI stays neutral with regard to jurisdictional claims in published maps and institutional affiliations.