Abstract
As a component of China’s strategic emerging industries, green lighting is an important industry supporting the high-quality and high-efficiency development of China’s economy, and is also an important way to achieve energy conservation and emission reduction. At present, China has basically established a policy framework to promote the development of green lighting industry, but there is no empirical evidence on the performance of existing policies on energy conservation and emission reduction. Based on the development status of China’s green lighting industry, this paper sorts out the milestones of China’s green lighting industry policy and the current status of the framework of the existing green lighting industry development policies, constructs a policy performance evaluation model for China’s green lighting industry based on the difference-in-difference (DID) model, and evaluates the implementation effects of green lighting industry policies in China from the perspective of energy conservation and emission reduction. The empirical results of China’s 85 cities show that the implementation of green lighting industry policies has significantly promoted regional energy conservation and emission reduction. Finally, this paper puts forward targeted policy recommendations to provide policy support for the transformation of China’s green lighting industry from “large” to “strong”.
1. Introduction
Since the 19th century, the continuous exploitation and consumption of coal, oil, and natural gas have supported the industrialization of the global economy [1]. In the late 20th century, although China’s macroeconomics achieved rapid development that has attracted worldwide attention, the high-consumption energy development mode has raised serious problems, such as resource scarcity and the deterioration of the ecological environment [2]. In order to cope with such issues, China vigorously develops renewable energy, takes a green economy as the main line of sustainable development, and takes energy conservation and emission reduction as the main feature of the economic growth mode transformation [3]. Therefore, China has vigorously developed strategic emerging industries that conform to the characteristics of the times and meet development needs.
As a leap in the history of human lighting, the green lighting industry represented by solid-state lighting (SSL) is triggering a lighting revolution in the global context [4]. SSL is one of the strategic emerging industries that best meets China’s development needs and has the most development prospects in the high-tech field of the 21st century. It is also one of the important paths for China to achieve green and low-carbon development [5]. According to the China Solid State Lighting Alliance (CSA) report [6], in 2018, China’s domestic light emitting diode (LED) lighting products saved 279 billion kWh of electricity, and achieved a reduction of 220 million tons of carbon emissions. The scale of electricity saving and the reduction of carbon emissions increased respectively by 40.7% and 23.6% compared with 2017. From the CSA data, the development of the SSL industry has made important contributions to China’s energy conservation and emission reduction efforts.
Driven by the support of national policies and the expansion of market demand in the early 21st century, China’s SSL companies have grown rapidly. However, since 2017, the downward pressure on China’s macroeconomic development has continued to increase, the effective internal demand has fallen, and the rise of international trade protectionism has had a certain degree of impact on the SSL industry in the rapid development stage [7]. In 2018, the growth rate of the SSL industry dropped to 12.8%, a decrease of 12.5% from the same period last year, and the industrial development began to enter a downward adjustment stage. Therefore, with the continuous changes in the development environment of the SSL industry, it is necessary to analyze the current state of China’s SSL industry policies based on the characteristics of China’s current development, and evaluate the SSL industry policy effect from the perspective of energy conservation and emission reduction, which can provide theoretical basis for the development of China’s green lighting industry.
Currently, the research of China’s SSL industry is basically focused on technical theoretical research [8,9,10]. In terms of industrial policy system analysis and scientific evaluation of policy implementation performance, there is currently a lack of sufficient empirical analysis in academia and SSL industry to support relevant conclusions. There are many policies in the SSL industry, and the implementation time of different policies is also different [11]. There are two difficulties in the research on the implementation performance of specific SSL industry policies [12]: First, it is difficult to separate the implementation effects of a single policy. In the case of multiple SSL industry policies, how to separate the impact of a single SSL industry policy (such as a certain tax preference policy) on the economy and society is quite difficult. This is also the biggest difficulty in evaluating the implementation effect of SSL industry policies. Second, it is difficult to obtain a universal difference in the implementation of a single SSL industry policy. The key to evaluate the performance of policy implementation is to analyze the differences between the policy actors before and after the implementation of the policy in specific aspects (such as the level of energy conservation and emission reduction). However, due to the significant regional differences in the development of China’s SSL industry, there are also large differences in SSL industry policies in different regions, making it difficult to find a unified SSL industry policy applicable to multiple regions. If the implementation effect of a series of SSL industry policies are analyzed, the overlap of multiple single policy effects and the universality of policy differences can be avoided, but the difficulty lies in the difference in the timing of policy implementation. For the SSL differential policy system, multiple industrial policies have different implementation time points, making it difficult to determine a certain implementation time point as the boundary point before and after the policy implementation, which makes it difficult to evaluate the policy effect. Due to the above considerations, there are currently few theoretical and practical results regarding the implementation performance of SSL industry policies. Related research is mainly analyzed from a qualitative perspective, and there is a lack of empirical support on the implementation effects of SSL industry policies [13,14,15], which is not conducive to accurately grasp the implementation effects of SSL industry policies and propose targeted policy recommendations.
Based on the background of green and low-carbon development, and the development status of China’s SSL industry, this paper sorts out the milestones of China’s green lighting industry policy and the current status of the framework of green lighting industry development policies, and constructs a policy effect evaluation model for China’s green lighting industry to evaluate the policy implementation performance from the perspective of energy conservation and emission reduction. The relevant results and conclusions can provide references for the healthy and sustainable development of China’s SSL industry, which can also promote the smooth transformation of China’s green and low-carbon development direction. On the whole, the contributions of this paper include:
- (1)
- This paper sorts out the policy milestones of China’s SSL industry, analyzes the current framework of the green lighting industry development policy, which accurately grasps the status quo of China’s SSL industry policy, and lays a foundation for policy makers to continuously improve related industrial policies and promote the healthy and orderly development of the industry.
- (2)
- By employing the DID model, this paper constructs an evaluation model for the implementation performance of China’s SSL industry policy, and empirically measures and analyzes the impacts of China’s SSL industry policy on regional energy conservation and emission reduction based on relevant data from 85 cities in China. The empirical results verify the effects of the SSL industry policy on energy conservation and emission reduction, and can provide an empirical basis for formulating related industrial policies from the perspective of energy conservation and emission reduction.
The rest of this paper is organized as follows. Section 2 introduces the development status and policy framework of China’s green lighting industry. Section 3 develops a model for evaluating the effects of green lighting industry policies based on the DID technique. Section 4 performs an empirical analysis based on relevant data of 85 cities in China. Finally, the research results of this paper are summarized and relevant policy recommendations are put forward in Section 5.
2. China’s Green Lighting Industry Development Status and Policy Framework
2.1. The Status Quo and Characteristics of the Development of Green Lighting Industry
From a global perspective, after more than 10 years of development, the SSL products represented by light-emitting diodes (LED) have fully entered the lighting alternative market [16]. The SSL industry in China has developed rapidly in recent years. With the gradual advancement of the global ban on incandescent lamps and the rapid breakthrough of SSL technology, the SSL industry, which represents a new generation of green lighting industry, has shown a steady growth trend. In 2017, the sales revenue of China’s SSL industry exceeded 650 billion RMB yuan, with a year-on-year growth rate of 25.35%. In recent years, China’s green lighting industry has shown new development trends and characteristics in product exports, technology research and development, business operations, and market applications. In particular, the breakthroughs in some of China’s core technologies, large-scale production capacity, and huge application market have created favorable conditions for strengthening China’s SSL industry [17].
In recent years, in both the lighting market and the lighting industry, incandescent lamps, fluorescent lamps and LED lamps are still three major mainstreams, but LED lamps are constantly improving and has occupied the mainstream of the market. The lighting products produced in China has accounted for more than 50% of the global lighting market, and the domestic lighting market has accounted for about 20% of the global lighting market [18]. According to the China Lighting Industry Association, the total output of China’s traditional electric light source products in 2016 was 7.78 billion RMB yuan. Incandescent lamps and fluorescent lamps are still the main products of China’s lighting industry, but the output of traditional light source products has dropped significantly compared with previous years [19].
As a global manufacturing base for lighting products, China’s lighting products have a global market share of more than 50%, and the lighting products have exported to more than 200 countries and regions [20,21]. Since 2009, China’s lighting product exports have continued to maintain a rapid growth trend. In 2015, the national lighting appliance exports reached 45 billion US dollars. However, due to the rapid development of LED replacement light source products, traditional electric light source products have shown a decline year by year in recent years [22]. Meanwhile, due to fierce market competition, the price of LED lighting products fell rapidly, resulting in the national lighting product exports falling to 38.5 billion US dollars in 2016, a year-on-year decrease of 14.5%. Among them, the export value of LED lighting products is about 12 billion US dollars, accounting for more than 30% of the total export of lighting products.
From the development trend of the green lighting industry, LED lighting will undoubtedly become a mainstream product. China’s green lighting industry, especially the key LED technology, has steadily improved, and the gap with the international level has been further narrowed. Some technologies are internationally advanced. It has become an important production and export base for global LED packaging and application products. In 2017, the domestic chip production capacity accounted for 58% of the global. In LED epitaxial materials, chip manufacturing, device packaging, and phosphors, China has developed unit technologies with independent technical property rights, forming a relatively complete R&D and industrial system involving upstream materials, chip preparation, midstream device packaging and downstream applications [23]. In particular, China’s silicon-based LED technology has continuously made breakthroughs, and the research and development level is internationally leading.
2.2. Existing Policy Framework for the Development of Green Lighting Industry
Reviewing the process of China’s lighting industry development and transformation, four important landmark milestones (as shown in Figure 1) are presented, reflecting the four different historical stages of industrial transformation and the development process of policies and systems. The development of China’s green lighting industry at every stage is inseparable from the support of national strategic planning, industrial development planning, departmental regulations, national mandatory standards, incentive policies and technological development routes. In particular, various plans, departmental normative documents, and mandatory standards have played important roles in the four stages and represent milestones in different development stages of the green lighting industry.
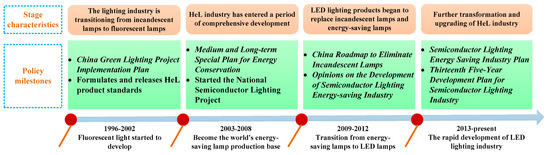
Figure 1.
The development stage and important policy milestones of green lighting industry.
Currently, driven by both market opportunities and industrial policies, China’s lighting industry is clearly in the stage of industrial restructuring and further transformation and upgrading. Although incandescent lamps and fluorescent lamps are still the main products of China’s lighting industry, the decline in output is relatively large. It is an inevitable trend for the industry to replace traditional lighting products with energy-efficient LED lighting products [24]. After more than 20 years of development, it can be found that at each stage of the development of the green lighting industry, there will be some problems and barriers to transformation. In order to solve the main problems and obstacles to the development of green lighting industry, China’s central government has issued a series of laws, regulations, standards, systems and policies, and the local governments have also introduced supporting policies and measures in the development of green lighting industry and product promotion and application in accordance with national and local regulations [25]. This research divides the existing policy framework into laws, regulations, departmental rules, plans, standards, systems, economic incentive policies, national science and technology plans, and various national funds, which have basically established a relatively complete policy framework system (as shown in Figure 2), supporting the rapid and healthy development of the green lighting industry in China.
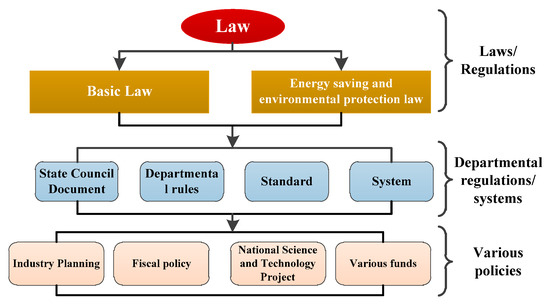
Figure 2.
Existing policy framework system of green lighting industry.
From the perspective of time distribution, the 12th Five-Year Plan period is the period with the highest density of policies (policy density refers to the number of policies in a certain length of period). During the 12th Five-Year Plan period, the number of policies to promote the development of the green lighting industry was the largest, accounting for 42% of the total number of policies (as shown in Figure 3). Although there are differences in the weight and execution of laws, regulations, standards, systems, and economic policies, it can be seen from the density of policies that government decision-making bodies attach importance and support to the development of the green lighting industry.
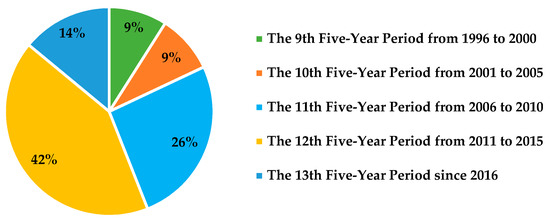
Figure 3.
Time distribution of the existing laws, regulations and policies related to green lighting industry. Data sources: [26].
From the perspective of policy types, industrial development environment policies dominate. The existing green lighting industry policies are mainly related to the industrial development environment, and the number of policies issued accounts for 73% of the total number of policies (as shown in Figure 4). The policy orientation is more inclined to regulate the market and provide a good industrial development environment. This policy tendency is precisely to solve the main problems of uneven product quality in the development of China’s green lighting industry, market competition inferior currency drives out good currency, and consumers’ difficulty in identifying high-quality energy-saving products. However, the policy of encouraging technological innovation is insufficient, accounting for only 12% of the total number of policies. This policy layout may cause insufficient industrial development potential, which will affect the realization of the goal of strengthening the green lighting industry.
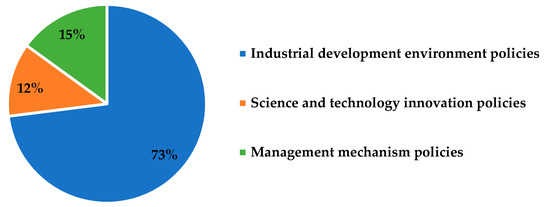
Figure 4.
Types of existing policies in the green lighting industry. Data sources: [26].
In terms of the nature of the policy, there are a large number of standards and plans, and a small number of economic incentive policies, laws, and systems. Judging from the nature of existing policies, they can be divided into seven categories: energy saving and environmental protection laws, systems, departmental rules, planning, energy efficiency standards, fiscal, taxation and financial policies, and national science and technology plans like projects and funds. It can be found from Figure 5 that the energy efficiency standard accounts for 33%, which is the most important means of guidance and restraint. Fiscal, taxation and financial policies accounted for 19%, and national science and technology plans accounted for 14%, indicating that the economic incentive policies accounted for about 33%. Departmental rules and planning accounted for 22%, while the energy-saving-related laws and systems account for a relatively low proportion, accounting for 5% and 7%, respectively.
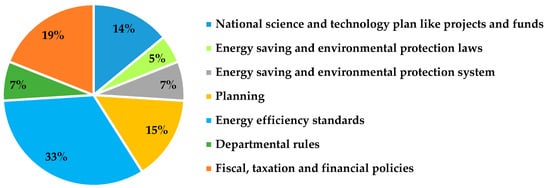
Figure 5.
Category distribution of green lighting industry policies. Data sources: [26].
3. Policy Performance Evaluation Model for the Green Lighting Industry Based on the DID Model
3.1. Basic Principles of the DID Model
The difference-in-difference (DID) is a policy evaluation technique widely used in sociology. Its basic principle is to start from a counterfactual framework to evaluate the changes of a certain observed factor Y under the two situations of policy occurrence and policy failure [27]. The DID model supposes that an exogenous policy shock can divide the sample into two groups, namely the Treat Group that is affected by the policy and the Control Group that is not affected by the policy. If there is no significant difference between the observed factor Y in the Treat Group and the Control Group before the policy shock, the change in Y of the Control Group before and after the policy can be regarded as the situation of the Treat Group when it did not receive the policy shock (called the counterfactual result). In this way, by comparing the change in Treat Group Y (D1) and the change in Control Group Y (D2), the actual impact of policy shocks on the observed factor Y (DID = D1 − D2) can be calculated.
When using the DID model to evaluate the performance of policy implementation, it should be firstly assumed that the model meets the linear regression assumption. In addition, three premises should be met [28], that is, the policy shock has no significant impact on the Control Group, factors other than policy shocks have the same impact on the Treat Group and the Control Group, and the observed variables in the Treat Group and the Control Group have stable distribution characteristics and do not change with time.
In 1985, Princeton University scholars Ashenfelter and Card introduced the DID model for the first time in a project evaluation article [29]. Subsequently, the model was widely used in the fields of econometrics and sociology [30,31]. According to the basic principles of the DID model, the following two key conditions must be met when using the DID model: First, there must be a pilot policy impact, otherwise it is impossible to find a Treat Group and a Control Group for the researched policy. That is to say, those policies that are implemented for all objects at one time are not suitable for DID analysis. Second, considering that policy effects often take a while to appear, a panel data set of at least two years (one year before and after policy implementation) must be available to realize parameter estimation. Suppose there are the following two periods of panel data:
where , , and are regression parameters to be estimated in this equation. is a dummy variable reflecting the policy implementation period (, if t = 2, indicating that the policy has been implemented; , if t = 1, indicating that the policy has not been implemented). is a dummy variable reflecting the policy implementation object, and its value is shown in formula (2) is the unobservable individual characteristic, and is the residual item.
According to formula (2), when t = 1, the Treat Group and the Control Group are treated the same, that is, is equal to 0; when t = 2, the of the Treat Group is set to 1, while the of the Control Group is still equal to 0.
If the treatment of policy shocks cannot be completely randomized, may be related to , resulting in inconsistencies in the results of least squares regression (OLS). Since the panel data is used, the original formula (1) can be first-differenced to eliminate :
Using the OLS to estimate the above formula (3), the consistency estimator can be obtained. According to the same reasoning as the difference estimator:
where is the average value of the observations in each group. This method is called Difference-in-Difference estimator (abbreviated as DID), denoted as . The DID estimator has eliminated the effects of pretreatment differences between the Treat Group and the Control Group, as shown in Figure 6.
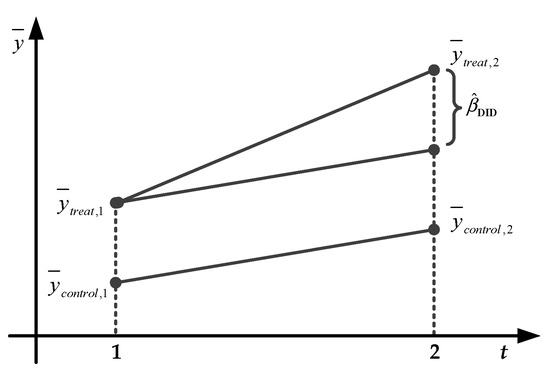
Figure 6.
Schematic diagram of DID estimators.
For DID estimators, other explanatory variables can also be introduced, namely:
where are the regression parameters to be estimated in this equation. The DID model with as the explained variable is not applicable to multi-period data.
Returning to the panel model with as the explained variable, without considering the explanatory variables, and still assuming two-period panel data, it can be considered that the original Equation (1) is equivalent to the following two-period panel model:
where , , and are the regression parameters to be estimated in this equation, and . is the residual item. . is the dummy variable of the Treat Group (. when the individual i belongs to the Treat Group; . when the individual i belongs to the Control Group). . is a dummy variable reflecting the period of policy intervention (. if t = 2 and if t = 1). The interactive item (valued 1 if the individual i belongs to the Treat Group and t = 2, otherwise it values 0). The grouping dummy variable represents the difference between the Treat Group and the Control Group itself. The time dummy variable represents the difference between the two periods before and after the policy intervention. The interaction term . is the net effect of the policy. If there are other explanatory variables, they can be directly put into the above equation.
When t = 1, the equation can be written as:
When t = 2, the equation can be written as:
Subtract the two equations to get:
This equation is exactly the same as the difference equation shown by formula (3). Performing the OLS estimation on this equation, the obtained is the coefficient of the interaction term , which is called the DID estimator. The advantage of the DID method is that it simultaneously controls time-specific effects and group-specific effects .
3.2. Model Hypothesis and Sample Data
The main purpose of this section is to examine the implementation effects of China’s SSL industry policies from the perspective of energy conservation and emission reduction. China’s electricity consumption for lighting accounts for about 14% of the entire society’s electricity consumption, which is an important area of energy conservation and emission reduction. The 2016–2017 China SSL Products Market Research Report shows that China’s LED lamp market share in 2017 was 69.1%, of which the market share of LED lamps in indoor lighting was 68.8%. In 2016, China’s LED lamp market share was 48.7%, of which the market share of LED lamps in indoor lighting was 47.7% [32]. In 2016 and 2017, the market share of LED lamps in outdoor lighting street lamps was about 20%, and the market share of night scene lighting LED was 100%.
The total electricity consumption of lighting in 2017 was 885.8 billion kWh, accounting for 14.04% of the total electricity consumption of the whole society, and the total electricity consumption of lighting in 2016 was 839.9 billion kWh, accounting for 14.19% of the total electricity consumption of the whole society. Due to the improvement of urban planning and construction in 2016–2017, the proportion of electricity consumption for lighting in the total electricity consumption of society has dropped significantly. The above data show that the use of SSL products has played an important role in national energy conservation and emission reduction [33].
Based on the above analysis, the hypothesis (H) is made: the SSL industry policy promotes energy conservation and emission reduction.
In order to verify the above hypothesis, this section applies the DID method to build am SSL industry policy effect evaluation model. From the point of view of policy implementation, 2009 and 2010 are turning years for the development of China’s SSL industry. As the National Development and Reform Commission issued the Guidance for the Development of SSL Energy-saving Industry in 2009 and initiated the preparation of the Roadmap for the Phase-out of Incandescent Lamps in China in 2011, China’s SSL industry has begun to enter a period of rapid growth, and various regions have introduced targeted SSL industry policies (industry planning, standard systems, fiscal and tax policies, and technology roadmaps) [34]. Although the timing of the introduction of different policies in different regions is different, the years when the relevant policies were issued specifically for the SSL industry were concentrated in 2010. Therefore, without loss of generality, this section sets 2010 as the starting year for the implementation of SSL industry policies.
From the perspective of policy implementation cities, currently, China has formed seven national SSL engineering industrialization bases in cities of Shanghai, Dalian, Nanchang, Xiamen, Shenzhen, Yangzhou and Shijiazhuang. In addition, the Yangtze River Delta, Pearl River Delta, Fujian Delta and northern regions have become gathering places for the development of China’s LED industry [35]. In the above-mentioned areas, the policy system (including industrial development planning, standard system, fiscal and taxation policies) specifically for the SSL industry is relatively complete, and policy support is relatively strong. In other regions, there are fewer relevant policies for the SSL industry, especially the lack of targeted SSL industry policies, and the policy effects are not significant.
Based on national statistical yearbooks, local statistical yearbooks, and annual statistical bulletins of local governments, we extract data on the economic and social development of cities with a population of more than 1 million in China from 2008 to 2019, and set the exclusion criteria:
Cities lacking a large-scale SSL industry; cities with incomplete annual data of variables; cities with outliers; considering that the overall development of the SSL industry in the western region is relatively weak, in order to avoid overestimating the impact of the SSL industry, the western region is not included.
Finally, 85 sample cities were selected. This paper identifies cities with perfect or complete SSL industry policies based on the standards in the Research Report on the Development Policy Framework of Green Lighting Industry issued by China SSL Promotion Project [26]. According to the report, cities with the perfect or complete SSL industry policies refer to the cities that established targeted regional SSL industry development plans, strictly implemented the SSL industry standard system, and have rich economic incentive policies on SSL industry. According to this standard, 25 of the 85 cities can be called cities with perfect or complete SSL industry policies (called policy implementation cities), while the SSL industry policies in other 60 cities cannot be called perfect or complete, and these cities are called the non-policy cities. The Appendix Table A1 of this paper reports the list of all analyzed cities.
3.3. Construction of the Evaluation Model of Green Lighting Industry Policy Effect
3.3.1. The Explained Variable
The main principles for selecting the explained variables of this model include [36]:
- ★
- Relative quantity: When using absolute quantities, if the city sizes of the Treat Group and the Control Group are different, there will be different estimates of the macro-environmental impact, which makes the estimated results biased. So setting the dependent variable as a relative quantity can avoid biased estimates as much as possible.
- ★
- Representation: The selected index should be able to fully represent the information characteristics of the research object.
- ★
- Scientificity: The selected indicators should be scientific, reasonable, measurable, and operable.
Considering the proposed model assumptions, among the explained variables, Y1–Y3 are variables that represent energy conservation and emission reduction, and the specific definitions and calculation formulas of variables are listed in Table 1.

Table 1.
Definitions and calculation formulas of variables.
3.3.2. Explaining Variables
The data in this paper are panel data, so a fixed-effect panel model is used for parameter estimation [37], and dummy variables of each year are introduced for control. The explanatory variables are set as the policy implementation time (Time), the key cities for policy implementation (City), and the DID item (Time*City). The specific explanation is shown in Table 1, and their values are shown in Table 2, Table 3 and Table 4:
Table 2.
Values of the explanatory variable Time.
Table 3.
Values of the explanatory variable City.
Table 4.
Values of the explanatory variable Time*City.
3.3.3. Control Variables
In order to ensure the robustness of the results and increase the goodness of model fit, this paper selects variables such as urban population, urbanization rate, fixed asset investment, and labor force as alternative control variables, so as to control the potential impact of the differences in urban characteristics on the explained variables. According to the correlation analysis and stepwise regression method [38], the urbanization rate (X1), fixed asset investment logarithmic value (X2), and labor force population logarithmic value (X3) are finally selected as the control variables of the model, and the following DID model is constructed:
where represents the intercept item, represents the difference before and after the policy implementation time, represents the difference between the Treat Group and the Control Group, and represents the DID statistic, reflecting the impact of the policy on the explained variable. , and are the parameters of urbanization rate, fixed asset investment logarithmic value, and labor force population logarithmic value, respectively. represents the residual item, i represents the city, and t represents the year.
4. Evaluation Results of China’s Green Lighting Industry Policy Effect
4.1. Descriptive Statistical Analysis of Variables
Table 5 shows the descriptive statistical results of related variables in all sample cities. It can be seen that the average per capita carbon emissions of 85 cities from 2008 to 2019 is 6748 kg/person, the average per capita energy consumption is 3038 kg/person, and the average carbon emission per unit GDP is 1063 kg/10,000 RMB yuan. Both the fixed asset investment and labor force in the control variables take the natural logarithm, so the gap between the maximum and minimum is small. The urbanization rate is a percentage value, with an average of 59.4, a minimum of 46.3, and a maximum of 88.1, indicating that there are significant differences in the degree of urbanization development between different cities. Observations (sample size) are all 1020.
Table 5.
Variable descriptive statistics.
4.2. Estimation Results of DID Model
This research is mainly to test the policy effects of the SSL industry, so the analysis focuses on the DID estimator, so as to obtain the influence of the SSL industry policy on different explained variables.
Table 6 shows the regression results of variables related to energy conservation and emission reduction. According to Table 6, it can be learnt that:
Table 6.
Regression results of energy conservation and emission reduction related variables.
- (1)
- The estimated DID coefficient corresponding to per capita carbon emissions (Y1) is −62.5935 (p = 0.0081), and the hypothesis of Time*City coefficient = 0 is rejected at the 1% significance level, indicating that cities with perfect SSL industry policies will reduce their per capita carbon emissions by 62.5935 kg, which is statistically significant.
- (2)
- The DID statistic corresponding to per capita energy consumption (Y2) is −22.7538 (p = 0.0192), and the hypothesis of Time*City coefficient = 0 is rejected at the 5% significance level, revealing that the per capita energy consumption in cities with complete SSL industry policies will reduce by 22.7538 kg of standard coal, compared with the cities without relevant industrial policies, and this difference is statistically significant.
- (3)
- The DID statistic corresponding to carbon emissions per unit of GDP (Y3) is −13.7334 (p = 0.0769), and the assumption of Time*City coefficient = 0 is rejected at the significance level of 10%, that is, cities with perfect SSL industry policies will reduce their carbon emissions per unit of GDP by 13.7334 kg compared with cities without relevant industrial policies, and this difference is statistically significant.
The regression results of the above fixed effects panel show that the implementation of SSL industry policies has positive effects on promoting regional energy conservation and emission reduction, meaning that the hypothesis (H) is established.
4.3. Robustness Test of Estimation Results
This research uses descriptive statistics and fixed-effect panel models to empirically analyze the impact of SSL industry policies on regional energy conservation and emission reduction. In order to verify that the above-mentioned effects on energy conservation and emission reduction are caused by policy implementation, this section reports the performance of a robustness test.
4.3.1. Parallel Trend Test
The consistency of the DID estimation results depends on whether the parallel trend hypothesis holds, that is, the Treat Group and the Control Group have the same development trend in energy conservation and emission reduction before the implementation of the policy [39]. Since 2009 and 2010 are turning years for the development of China’s SSL industry, the aforementioned sample data from 2008 to 2019 cannot be used. This section collects the economic and social development data of the aforementioned 85 cities from 2000 to 2007 as a sample to test whether the hypothesis of parallel trends holds. Set the following model:
where is 1–8 in 2000–2007, respectively, and the definition of other variables is the same as those in formula (10).
Table 7 shows the test results of the parallel trend hypothesis. The DID statistics corresponding to per capita carbon emissions (Y1), per capita energy consumption (Y2), and unit GDP carbon emissions (Y3) are −30.6858 (p = 0.4281), −17.7900 (p = 0.3192), −8.9267 (p = 0.1769), accept the Time*City coefficient = 0 at the 10% significance level, indicating that the parallel trend hypothesis was established in 2000–2007.
Table 7.
Test results of parallel trend hypothesis.
4.3.2. Time Point Inspection of Policy Implementation
The basic idea of the policy implementation time point test is to fabricate the policy implementation time point, and use the DID model to analyze the policy effects before and after the imaginary policy implementation time point [40]. If the analysis result shows that the regression result of the DID estimator is significant at the time of implementation of the fictitious policy, it indicates that the original estimation result is biased. This section still employs the economic and social development data of the 85 cities from 2000 to 2007 as a sample to test whether the fictitious time point of policy implementation has a significant policy effect. Assuming that the policy implementation time point is 2004, the DID model constructed based on formula (10), the explanatory variables are set to policy implementation time (Time), key cities for policy implementation (City), and DID item (Time*City), and the values are shown in Table 8, Table 9 and Table 10.
Table 8.
The value of the policy implementation time under the time point inspection.
Table 9.
The value of the key cities for policy implementation under the time point inspection.
Table 10.
The value of the DID item under the time point inspection.
Based on the above explanatory variables and the setting of the DID item, this section uses the aforementioned DID model for analysis, and the results are shown in Table 11. It can be seen that the DID statistics corresponding to per capita carbon emissions (Y1), per capita energy consumption (Y2), and unit GDP carbon emissions (Y3) are −43.0049 (p = 0.2418), −15.6330 (p = 0.2187) and −9.4355 (p = 0.2476), accept the hypothesis of Time*City coefficient = 0 at a significance level of 10%. It shows that the policy effect is not significant before and after the implementation of the fictitious policy, which is in line with the model’s expectations.
Table 11.
Test results of time point inspection.
Based on the robustness test, the DID model constructed in this paper is robust in analyzing the impacts of SSL industry policies on regional energy conservation and emission reduction. Based on the regression results, it can be found that:
The DID results show that before and after the implementation of the SSL industry policies, the per capita carbon emissions, per capita energy consumption, and carbon emissions per unit of GDP in the key implementation cities of the policy have all decreased compared with other cities, and the decline is statistically significant, revealing that the SSL industry policies have positive effects on promoting regional energy conservation and emission reduction. Based on the above discussion and analysis, the results of this research hypothesis verification are summarized in Table 12:
Table 12.
Validation results of model research hypotheses.
5. Conclusions and Policy Suggestions
In recent years, China’s SSL industry has developed rapidly, and China has become the world’s largest producer, consumer and exporter of SSL products. The State Council, the Ministry of Science and Technology, the Ministry of Industry and Information Technology, and the National Development and Reform Commission have successively introduced policies and measures to promote the development of the SSL industry, laying the foundation for China’s development as a powerhouse in the SSL industry. This paper follows the context of “status analysis, model construction, empirical research, and policy recommendations”, analyzes the development status and policy framework of China’s green lighting industry, conducts a policy effect evaluation model for the green lighting industry based on the DID model, and empirically measures the impacts of SSL industry policies on regional energy conservation and emission reduction.
The empirical results support that the implementation of SSL industry policies has significant positive effects on promoting energy conservation and emission reduction. Specifically, after the implementation of the SSL industry policies, the per capita carbon emissions, per capita energy consumption, and carbon emissions per unit of GDP in the key policy cities have all declined compared with other cities, and the declines are statistically significant.
Through combing and analyzing the current situation and framework of China’s SSL industry policy, it is found that at this stage, the quality of China’s LED products is uneven, and the lacks of authoritative certification and measurement standards have discouraged many buyers from LED products. At the same time, since China has not issued relevant national standards for the LED industry, government subsidies lack relevant evidence. Therefore, relevant government departments should make efforts to step up the research and formulation of the basic standards, product standards and testing method standards of LED products, increase investment in testing equipment, improve the inspection and testing capabilities of LED products, establish an LED standard system, issue standards including product testing, safety, performance and energy efficiency, and actively participate in the formulation of international standards.
The evaluation results of the implementation effect of China’s SSL industry policy show that the implementation of the SSL industry policies has significant positive effects on promoting energy saving and emission reduction. Therefore, it is necessary to introduce corresponding SSL industry policies. However, as an important policy to promote the development of the SSL industry, fiscal and taxation policies have problems such as the incompatibility of subsidy objects and subsidy methods with industrial development needs, and insufficient tax incentives and preferential policies, which restrict the rapid and healthy development of China’s SSL industry. Therefore, efforts should be made to improve the fiscal and taxation policy system of the SSL industry and enhance the support for development.
When evaluating the impact of China’s SSL industry policy, this research uses a DID model to evaluate the environmental impact of the development of China’s SSL industry. In future research, as the economic and social situation changes, the selection of model indicators may be adjusted to some extent. Meanwhile, other policy evaluation models such as the computable general equilibrium (CGE) model, the instrumental variable (IV) model, and the trend matching method can also be adopted to comprehensively evaluate the impact of China’s SSL industry policies.
Author Contributions
Conceptualization, S.G.; Data curation, L.L.; Formal analysis, L.L.; Investigation, K.W. and S.G.; Methodology, K.W., L.L., S.Q. and S.G.; Resources, S.Q.; Software, K.W., L.L. and S.Q.; Writing—original draft, K.W.; Writing—review & editing, S.G. All authors have read and agreed to the published version of the manuscript.
Funding
This research received no external funding.
Conflicts of Interest
The authors declare no conflict of interest.
Appendix A
Table A1.
85 cities selected for DID estimation in this paper.
Table A1.
85 cities selected for DID estimation in this paper.
| City Types | City Names |
|---|---|
| 25 policy implementation cities | Shanghai, Dalian, Nanchang, Xiamen, Shenzhen, Yangzhou, Shijiazhuang, Fuzhou, Quanzhou, Zhangzhou, Guangzhou, Maoming, Shantou, Zhuhai, Haikou, Zhangjiakou, Baoding, Tangshan, Langfang, Zhengzhou, Nanjing, Suzhou, Jinan, Hangzhou, Ningbo |
| 60 non-policy cities | Fuyang, Suqian, Xuancheng, Wuhu, Yulin, Liuzhou, Hezhou, Beihai, Zunyi, Anshun, Sanya, Kaifeng, Xuchang, Xinxiang, Jiaozuo, Xinyang, Qinhuangdao, Suihua, Jixi, Hegang, Heihe, Mudanjiang, Huanggang, Xiaogan, Yichang, Enshi, Jingmen, Huangshi, Ezhou, Hengyang, Yueyang, Yongzhou, Huaihua, Zhuzhou, Xiangtan, Jilin, Siping, Tonghua, Shangrao, Yichun, Ji’an, Chaoyang, Dandong, Yingkou, Liaoyang, Chifeng, Tongliao, Xing’an League, Zibo, Jinzhong, Jinzhou, Luliang, Weinan, Hanzhong, Nanchong, Mianyang, Bazhong, Qujing, Yuxi, Pu’er |
References
- Zhao, H.; Guo, S.; Zhao, H. Characterizing the influences of economic development, energy consumption, urbanization, industrialization, and vehicles amount on PM2.5 concentrations of China. Sustainability 2018, 10, 2574. [Google Scholar] [CrossRef]
- Lin, T.; Wu, Y.; He, X.; Zhang, S.J.; Hao, J.M. Well-to-wheels fossil energy consumption and CO2 emissions of hydrogen fuel cell vehicles in China. Environ. Sci. 2018, 39, 3946–3953. [Google Scholar]
- Xingdong, W.; Yanling, X. Study on influencing factors of farmers’ green energy consumption behavior: A comparative analysis of household biogas and medium & large-scale biogas user. J. Nanjing Tech Univ. 2018, 17, 69–78. [Google Scholar]
- Martinot, E.; Borg, N. Energy-efficient lighting programs. Energy Policy 1998, 26, 1071–1081. [Google Scholar] [CrossRef]
- Guo, F.; Pachauri, S. China’s green lights program: A review and assessment. Energy Policy 2017, 110, 31–39. [Google Scholar] [CrossRef]
- Liu, S.; Luo, X. Appendix: Measurement method for integral LED road lights approved by china solid state lighting alliance. In LED Packaging for Lighting Applications; Chemical Industry Press: Beijing, China, 2011; pp. 331–347. [Google Scholar] [CrossRef]
- Kong, X.; Zhang, M.; Ramu, S.C. China’s semiconductor industry in global value chains. Asia Pac. Bus. Rev. 2016, 22, 150–164. [Google Scholar] [CrossRef]
- Schaum, K.D. Light emitting device, method of manufacturing the same, light emitting device package, and lighting system. Adv. Skin Wound Care 2011, 23, 17–20. [Google Scholar] [CrossRef]
- Kim, J.W. Nanorod array structure through a nanomolding process for SSL and display applications. Nano 2019, 14, 51–333. [Google Scholar] [CrossRef]
- Chen, B.; Pradhan, N.; Zhong, H. From large scale synthesis to lighting device applications of ternary I-III-VI semiconductor nanocrystals: The inspiring greener material emitters. J. Phys. Chem. Lett. 2018, 9, 435–445. [Google Scholar] [CrossRef]
- Kidwell, P.A. Making microchips: Policy, globalization, and economic restructuring in the semiconductor industry. IEEE Ann. Hist. Comput. 2000, 22, 75–76. [Google Scholar] [CrossRef]
- Gregg, T. Industrial policy in a new era: Government roles in the U.S. semiconductor industry and its value chain. Mol. Hum. Reprod. 2013, 7, 553–558. [Google Scholar]
- Li, S.; Huang, H.; Wang, H. Analysis and policy measures of China’s LED industry development status. Macroeconomics 2011, 9, 25–32. [Google Scholar]
- Deng, Q.; Li, J.; Zhao, F. Policy roadmap for the cultivation of strategic emerging industries: Taking Guangdong LED industry as an example. Sci. Technol. Manag. Res. 2012, 32, 51–56. [Google Scholar]
- Ye, X.; Li, M. Literature quantitative research on the differences of china’s industrial policy: Taking the SSL industry as an example. J. Public Manag. 2015, 12, 145–152, 159–160. [Google Scholar]
- Cheng, Q. The new development direction of China’s LED lighting industry in the global lighting market. China Light Light. 2019, 1, 16–23. [Google Scholar]
- Wu, M.; Qiu, S.; Xu, X.; Xu, J.; Zhang, Y. Current status and trends of SSL industry. Adv. Mater. Ind. 2016, 11, 14–20. [Google Scholar]
- China Light Industry Network. 2017 Report on the Development of China’s Lighting Industry. Available online: http://www.clii.com.cn/zhhylm/201802/t20180213_3917480.html (accessed on 13 February 2018).
- Wen, Q. 2016 China’s lighting industry development and analysis of corporate competitiveness. China Light Light. 2016, 11, 1–8. [Google Scholar]
- Sun, Q.; Li, L. The dilemma and way of China’s LED lighting products export. Pract. Foreign Econ. Relat. Trade 2017, 2, 49–52. [Google Scholar]
- Xie, W.; Yan, X. Research on the impact of international trade barriers on the export of LED industry and countermeasures: Taking guangdong province as an example. China Light Light. 2018, 6, 8–14. [Google Scholar]
- Liu, J.; Yin, Z. The experience of China’s led lighting industry’s development. Light Eng. 2018, 26. [Google Scholar] [CrossRef]
- The Group of Research on Independent Development Strategy of New Generation Green Lighting High-end Manufacturing Equipment. Independent development strategy of high-end manufacturing equipment for China’s LED lighting industry. Strateg. Study CAE 2017, 19, 142–148. [Google Scholar]
- Song, C. Thirteen ministries including the national development and reform commission jointly formulated the thirteenth five-year development plan for the SSL industry. China Plant Eng. 2017, 16, 1. [Google Scholar]
- Geerten, V.D.K.; Greeven, M. LED standardization in China and South East Asia: Stakeholders, infrastructure and institutional regimes. Renew. Sustain. Energy Rev. 2017, 72, 863–870. [Google Scholar]
- China Solid-State Lighting Promotion Project. Research Report on the Development Policy Framework of Green Lighting Industry; China Environmental Publishing Group: Beijing, China, 2019. [Google Scholar]
- Qian, X.; Kang, J.; Tang, Y.; Cao, X. Industrial policy, capital allocation efficiency, and enterprise total factor productivity: Based on the empirical research of natural experiments of China’s 2009 ten major industries revitalization plan. China Ind. Econ. 2018, 8, 42–59. [Google Scholar]
- Wing, C.; Simon, K.; Bello-Gomez, R.A. Designing difference in difference studies: Best practices for public health policy research. Annu. Rev. Public Health 2018, 39, 453–469. [Google Scholar] [CrossRef]
- Ashenfelter, O.; Card, D. Using the longitudinal structure of earnings to estimate the effect of training programs. Rev. Econ. Stat. 1985. [Google Scholar] [CrossRef]
- Dendir, S.; Orlov, A.G.; Roufagalas, J. Do economics courses improve students’ analytical skills? A difference-in-difference estimation. J. Econ. Behav. Organ. 2019, 165, 1–20. [Google Scholar] [CrossRef]
- Sun, Y.; Yan, K. Inference on difference-in-differences average treatment effects: A fixed-b approach. J. Econom. 2019, 211, 560–588. [Google Scholar] [CrossRef]
- China Industry Information Network. Analysis and Forecast of the Overall Scale and Growth Rate of China’s SSL Industry in 2017. Available online: http://www.chyxx.com/industry/201709/559923.html (accessed on 7 September 2017).
- Light Library Network. SSL Plays a Key Role in Energy Saving and Emission Reduction. Available online: http://www.365dsw.com/newsdetail/336 (accessed on 4 November 2019).
- Wu, L. The prospect of the development of China’s solid-state lighting industry in 13th five-year. Appl. IC 2017, 34, 28–30. [Google Scholar]
- Butollo, F.; Ten Brink, T. A great leap? Domestic market growth and local state support in the upgrading of China’s LED lighting industry. Glob. Netw. 2018, 18, 285–306. [Google Scholar] [CrossRef]
- Blanchet, F.G.; Legendre, P.; Borcard, D. Forward selection of explanatory variables. Ecology 2008, 89, 2623–2632. [Google Scholar] [CrossRef]
- Wang, H.; Ho, C. Estimating fixed-effect panel stochastic frontier models by model transformation. J. Econom. 2009, 157, 286–296. [Google Scholar] [CrossRef]
- Roger, A. Avoiding fallacious significance tests in stepwise regression: A Monte Carlo method applied to a meteorological theory for the Canadian lynx cycle. Int. J. Biometeorol. 1989, 33, 24–26. [Google Scholar]
- Houngbedji, K. Abadie’s semiparametric difference-in-differences estimator. Stata J. 2016, 16, 482–490. [Google Scholar] [CrossRef]
- Alemi, F.; Rodier, C.; Drake, C. Cruising and on-street parking pricing: A difference-in-difference analysis of measured parking search time and distance in San Francisco. Transp. Res. Part A Policy Pract. 2018, 111, 187–198. [Google Scholar] [CrossRef]


Publisher’s Note: MDPI stays neutral with regard to jurisdictional claims in published maps and institutional affiliations. |
© 2020 by the authors. Licensee MDPI, Basel, Switzerland. This article is an open access article distributed under the terms and conditions of the Creative Commons Attribution (CC BY) license (http://creativecommons.org/licenses/by/4.0/).