Data-Driven Three-Phase Saturation Identification from X-ray CT Images with Critical Gas Hydrate Saturation


Abstract
1. Introduction
2. Methodology
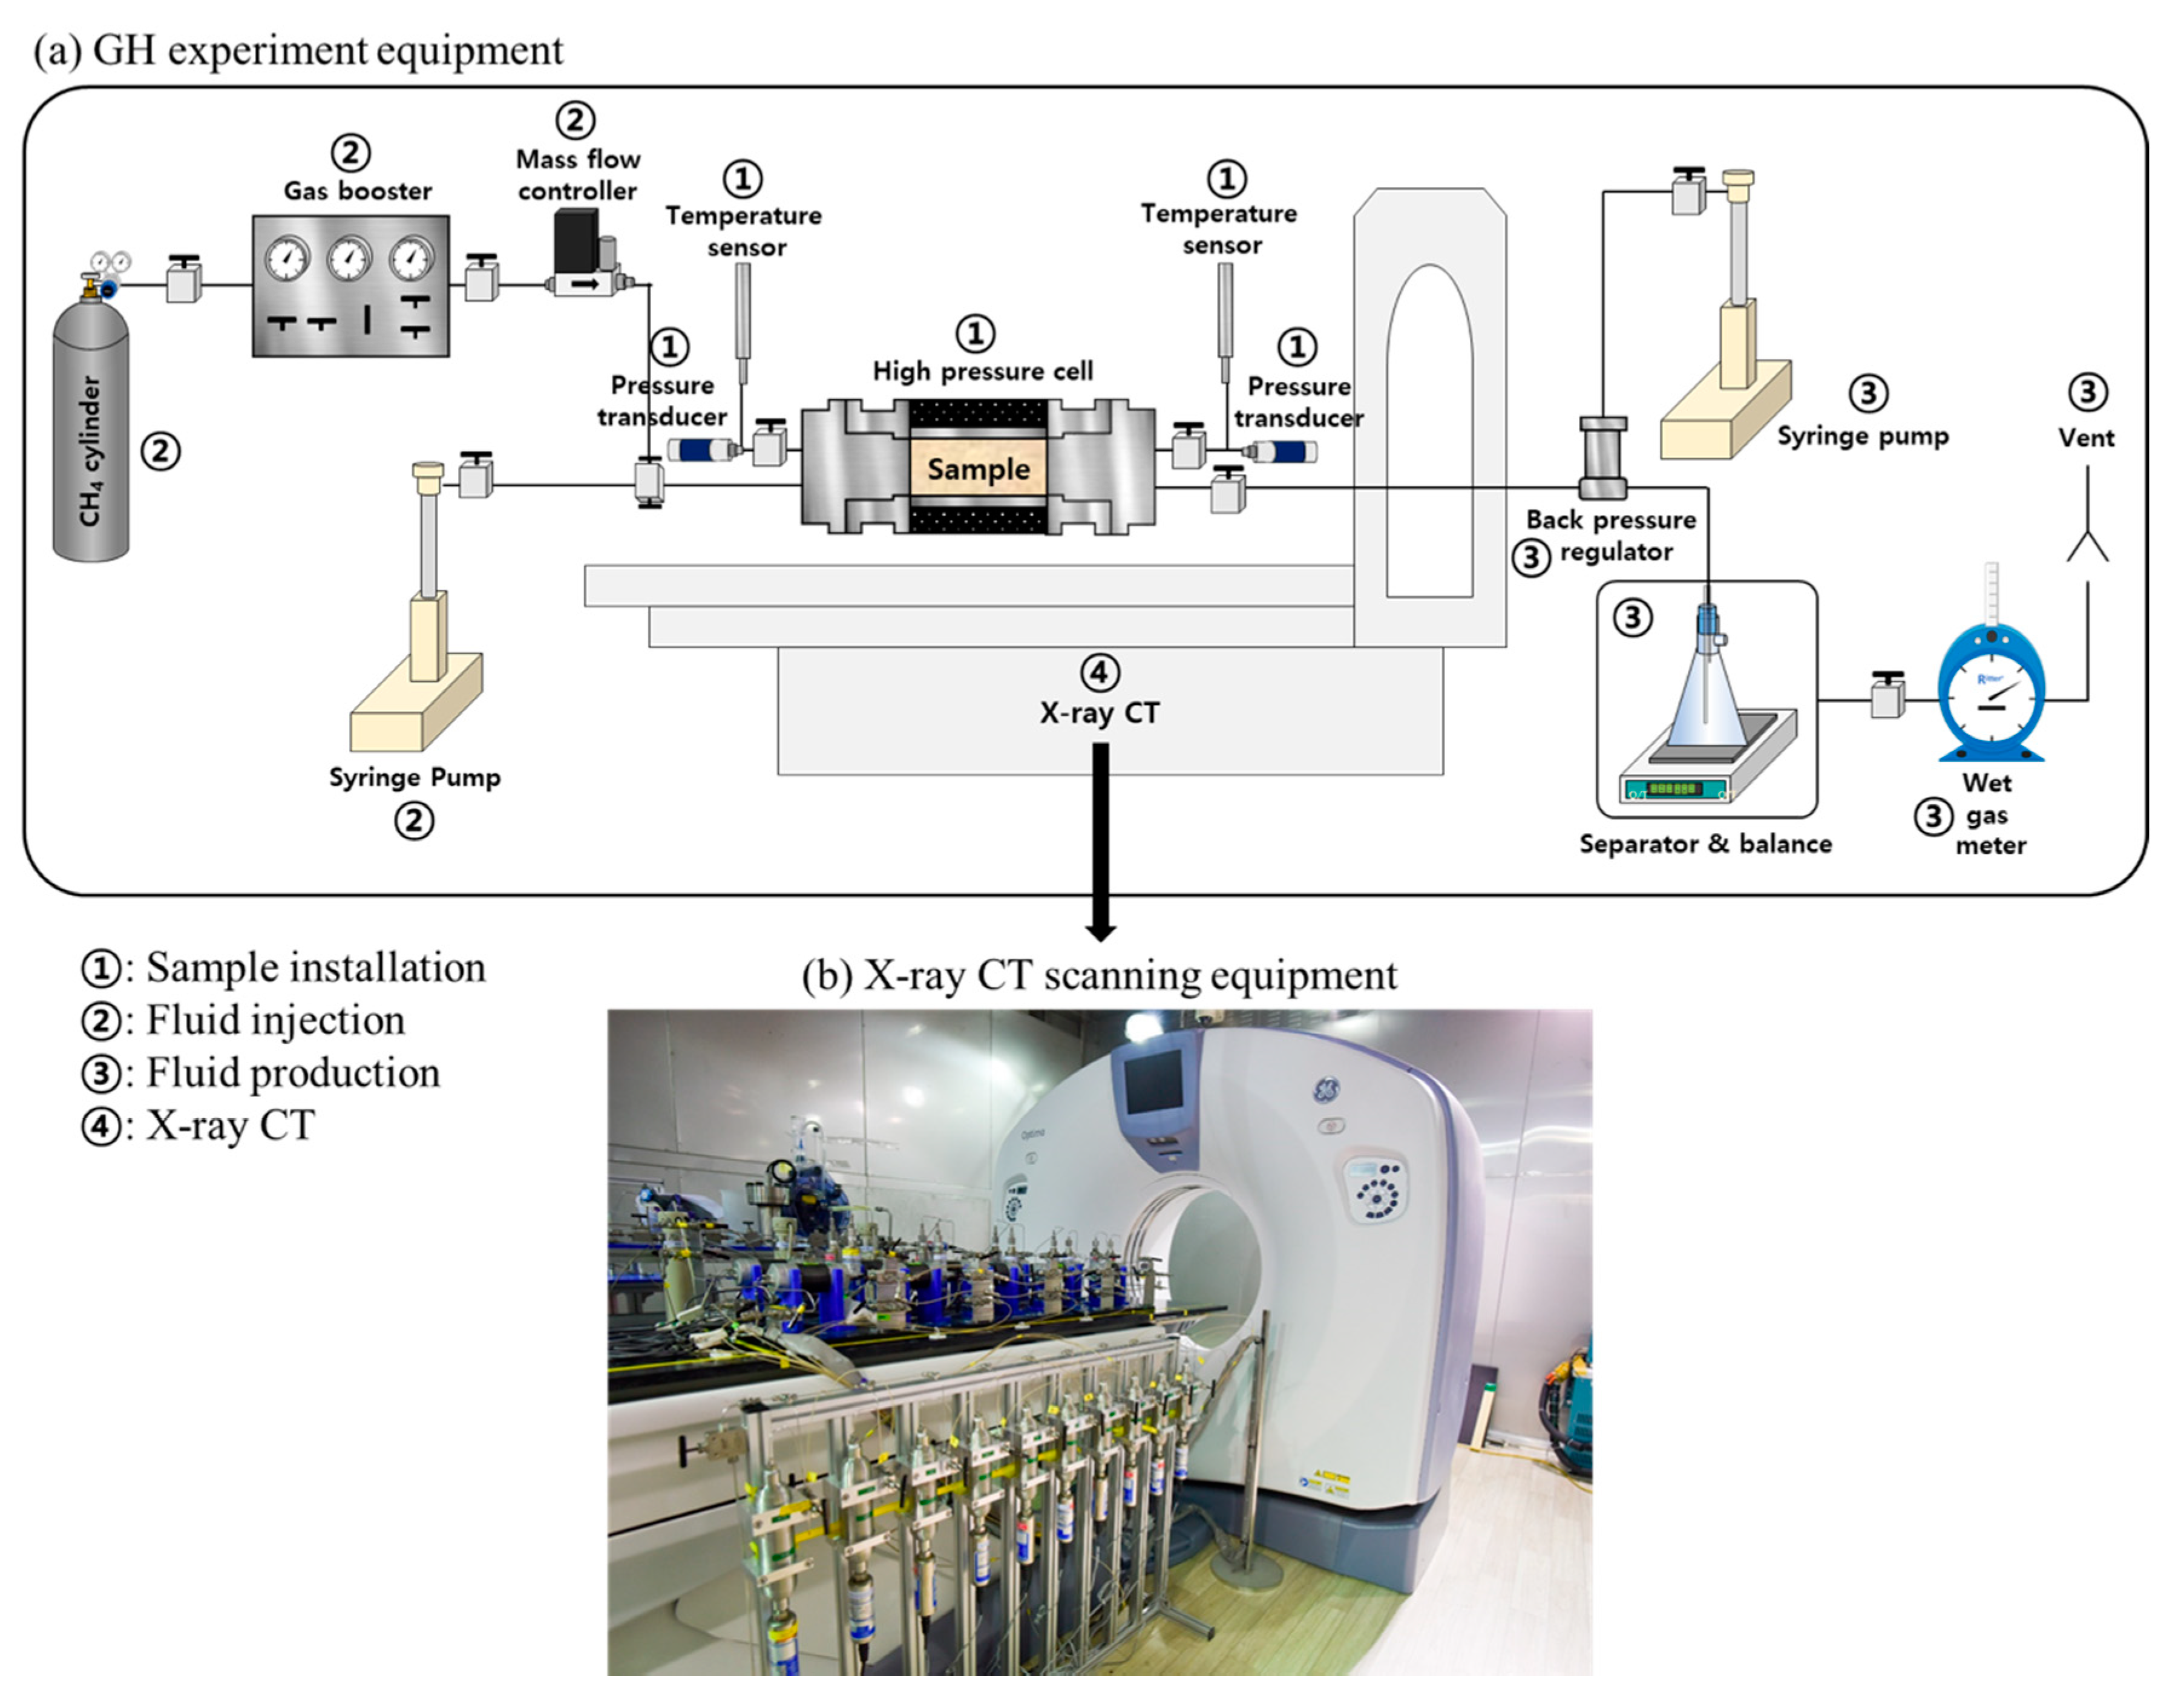
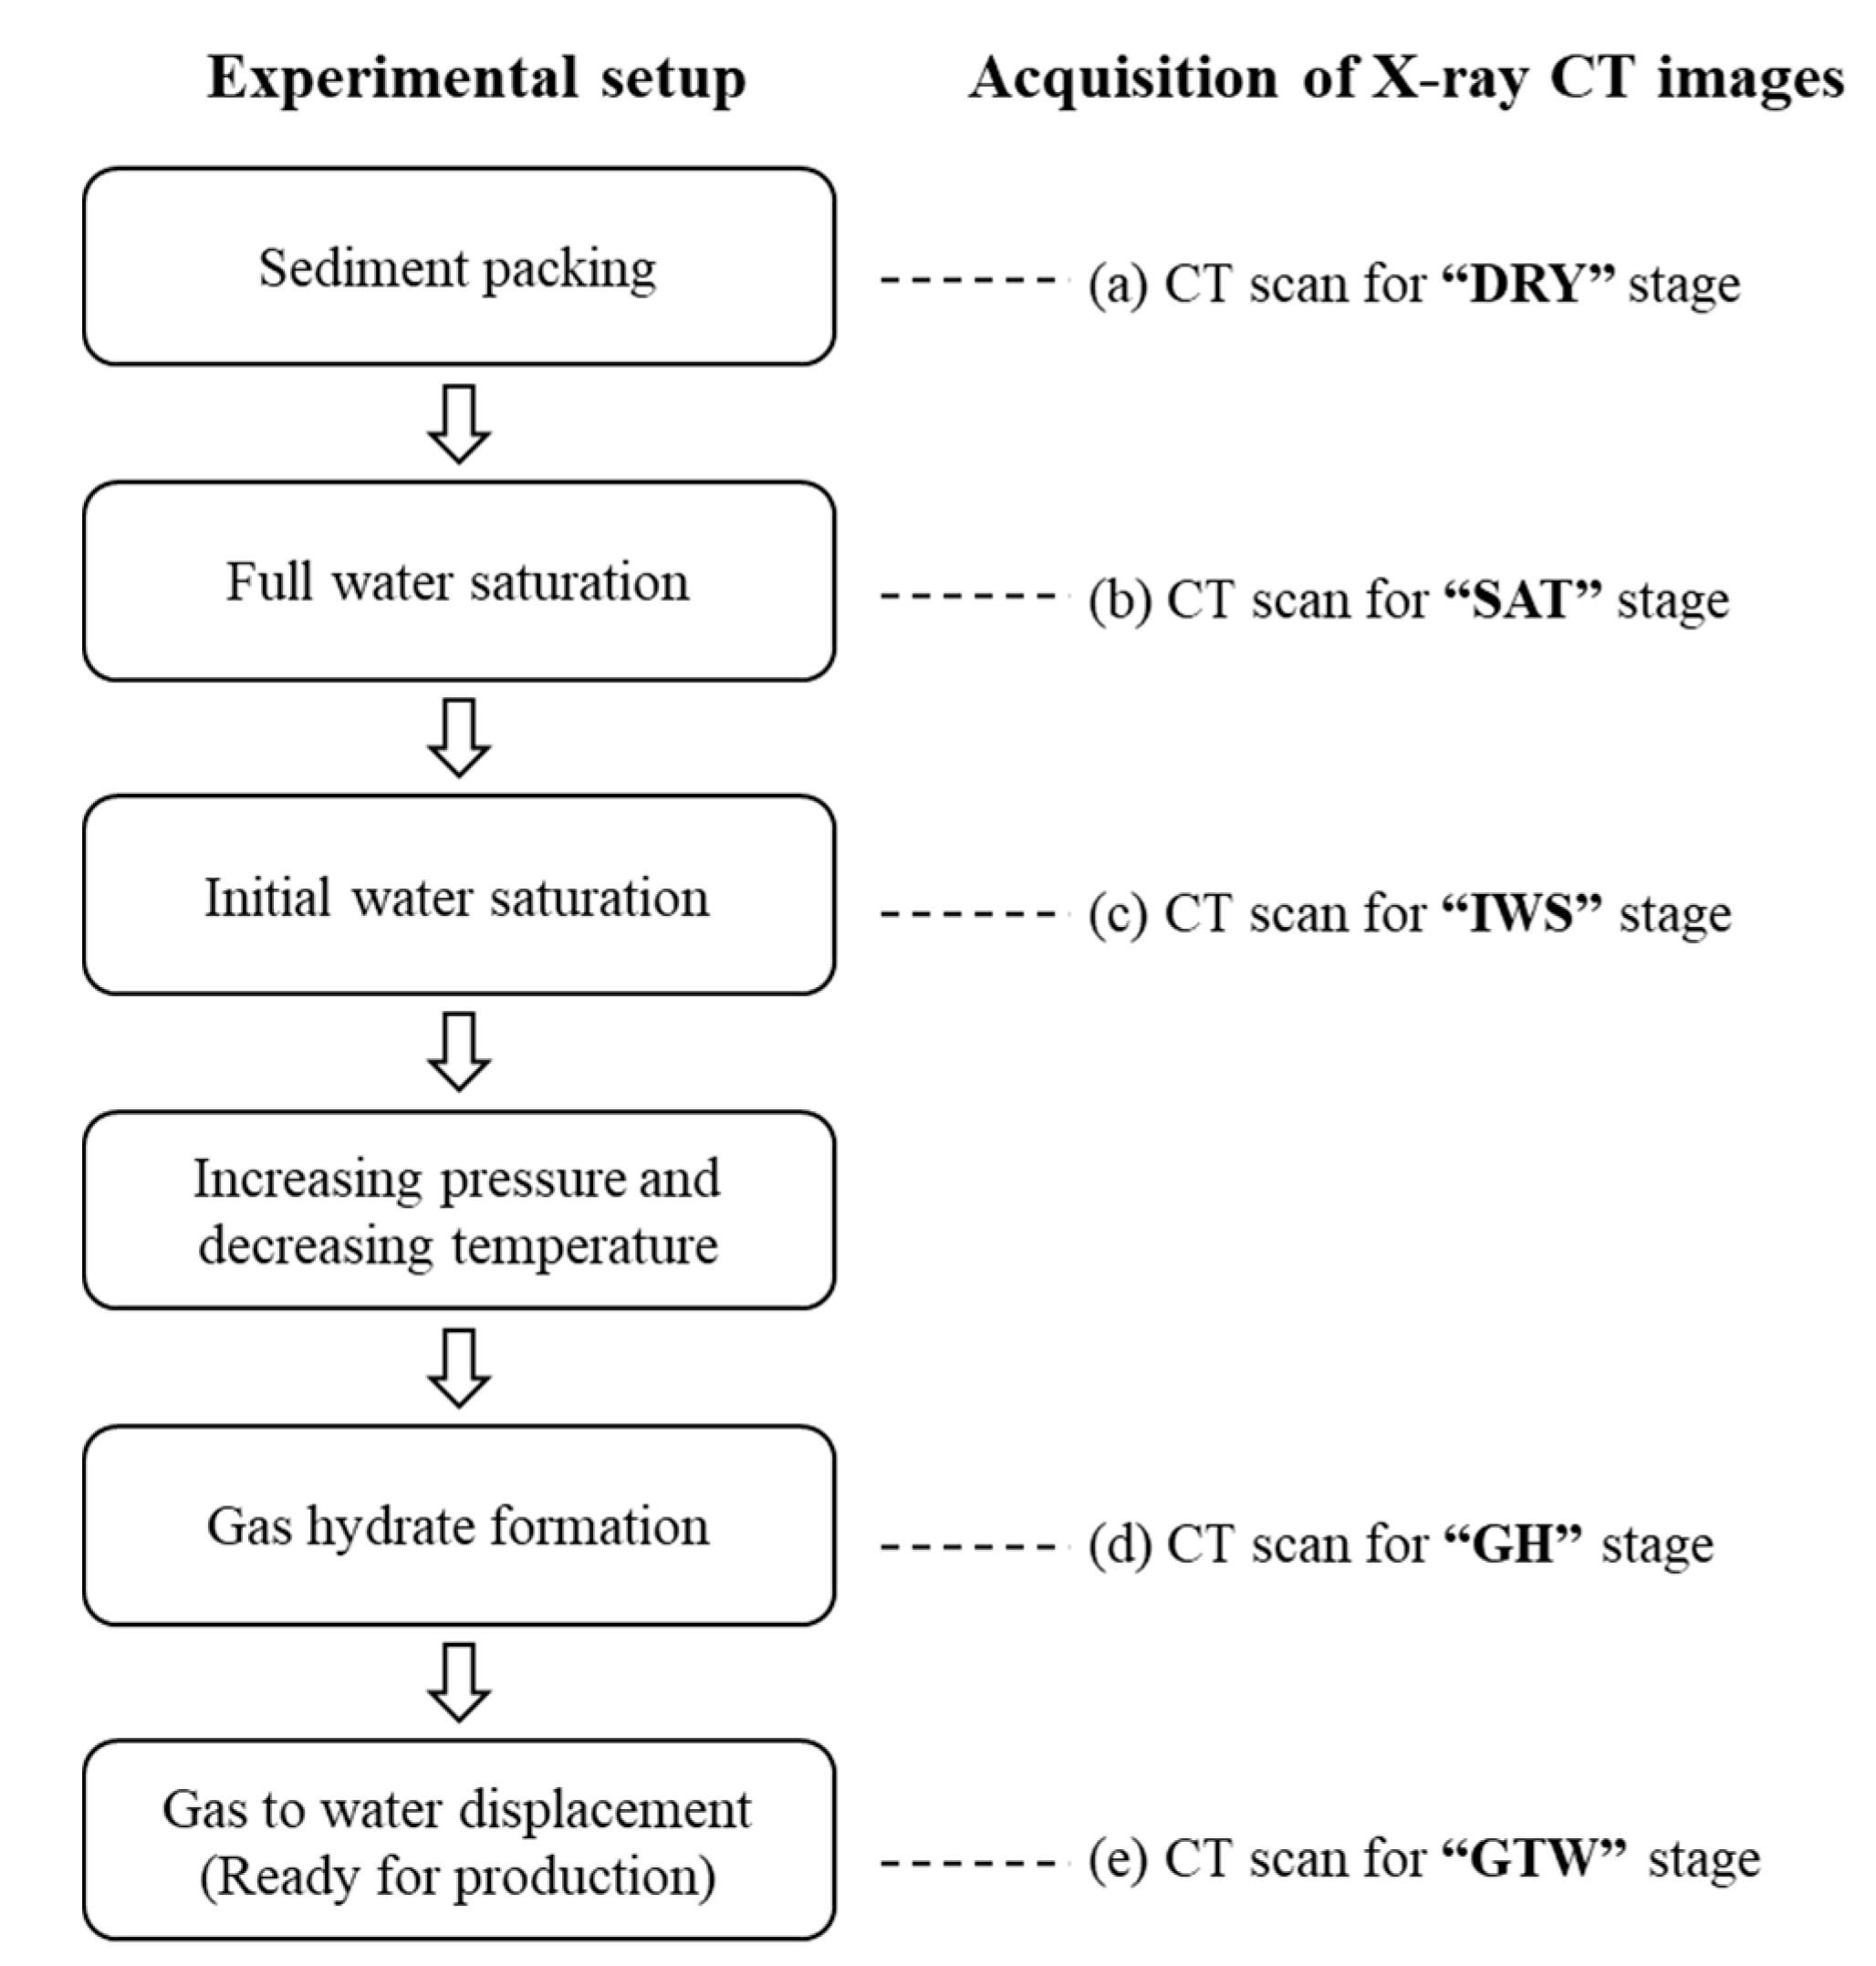
2.1. Experiments of Gas Hydrate (GH) with X-Ray Computerized Tomography (CT) Scanning
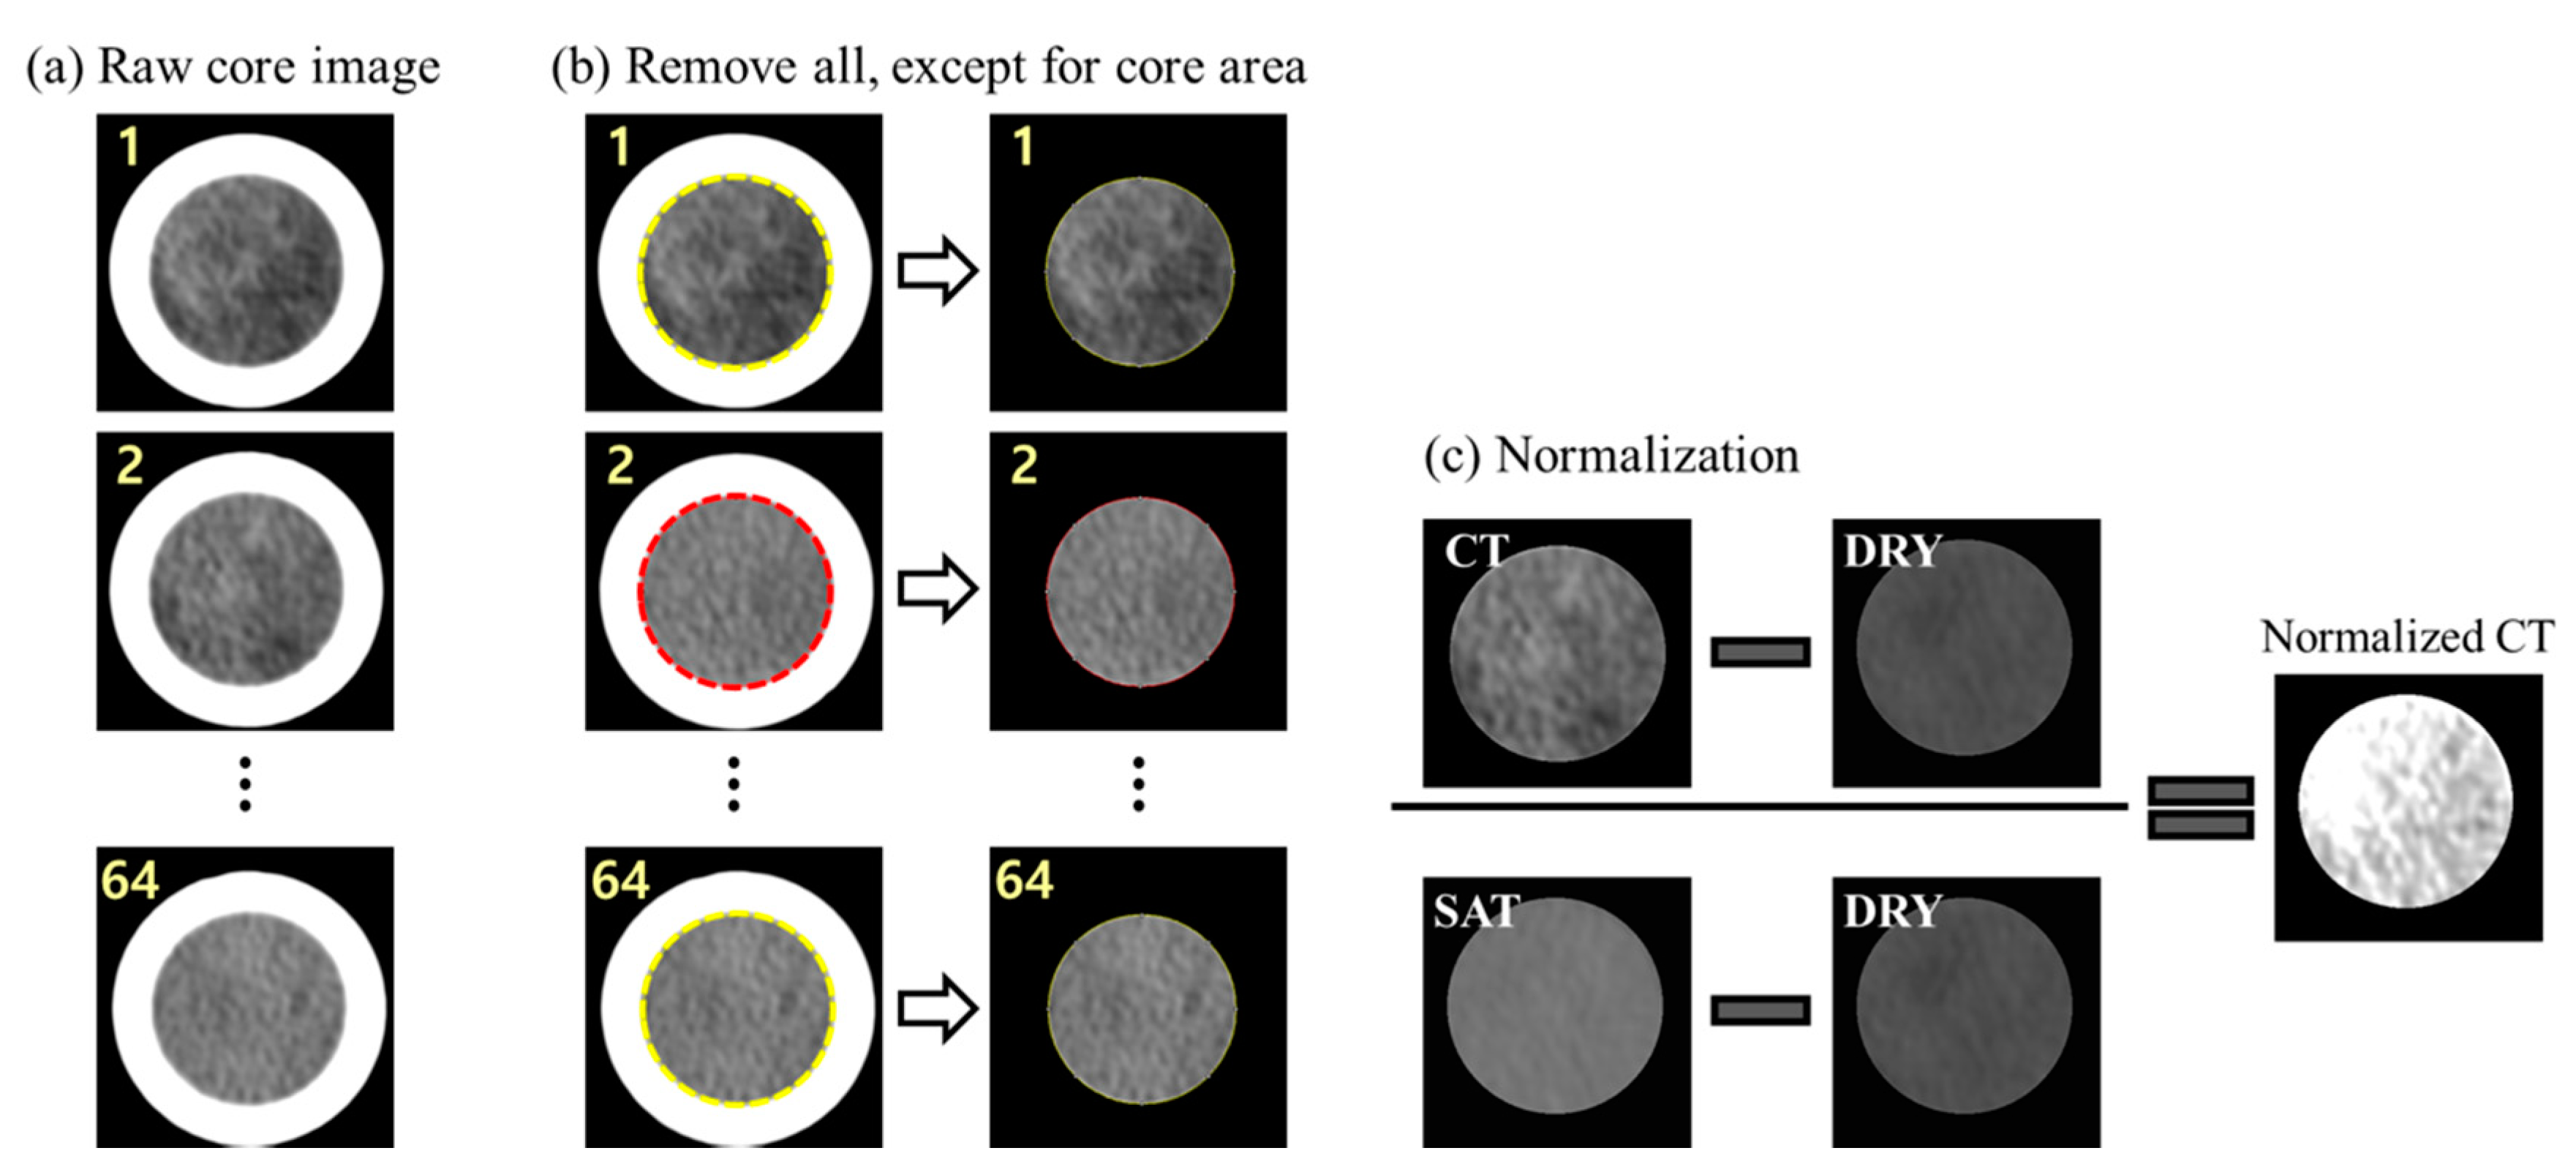
2.2. Data Acquisition and Preprocessing
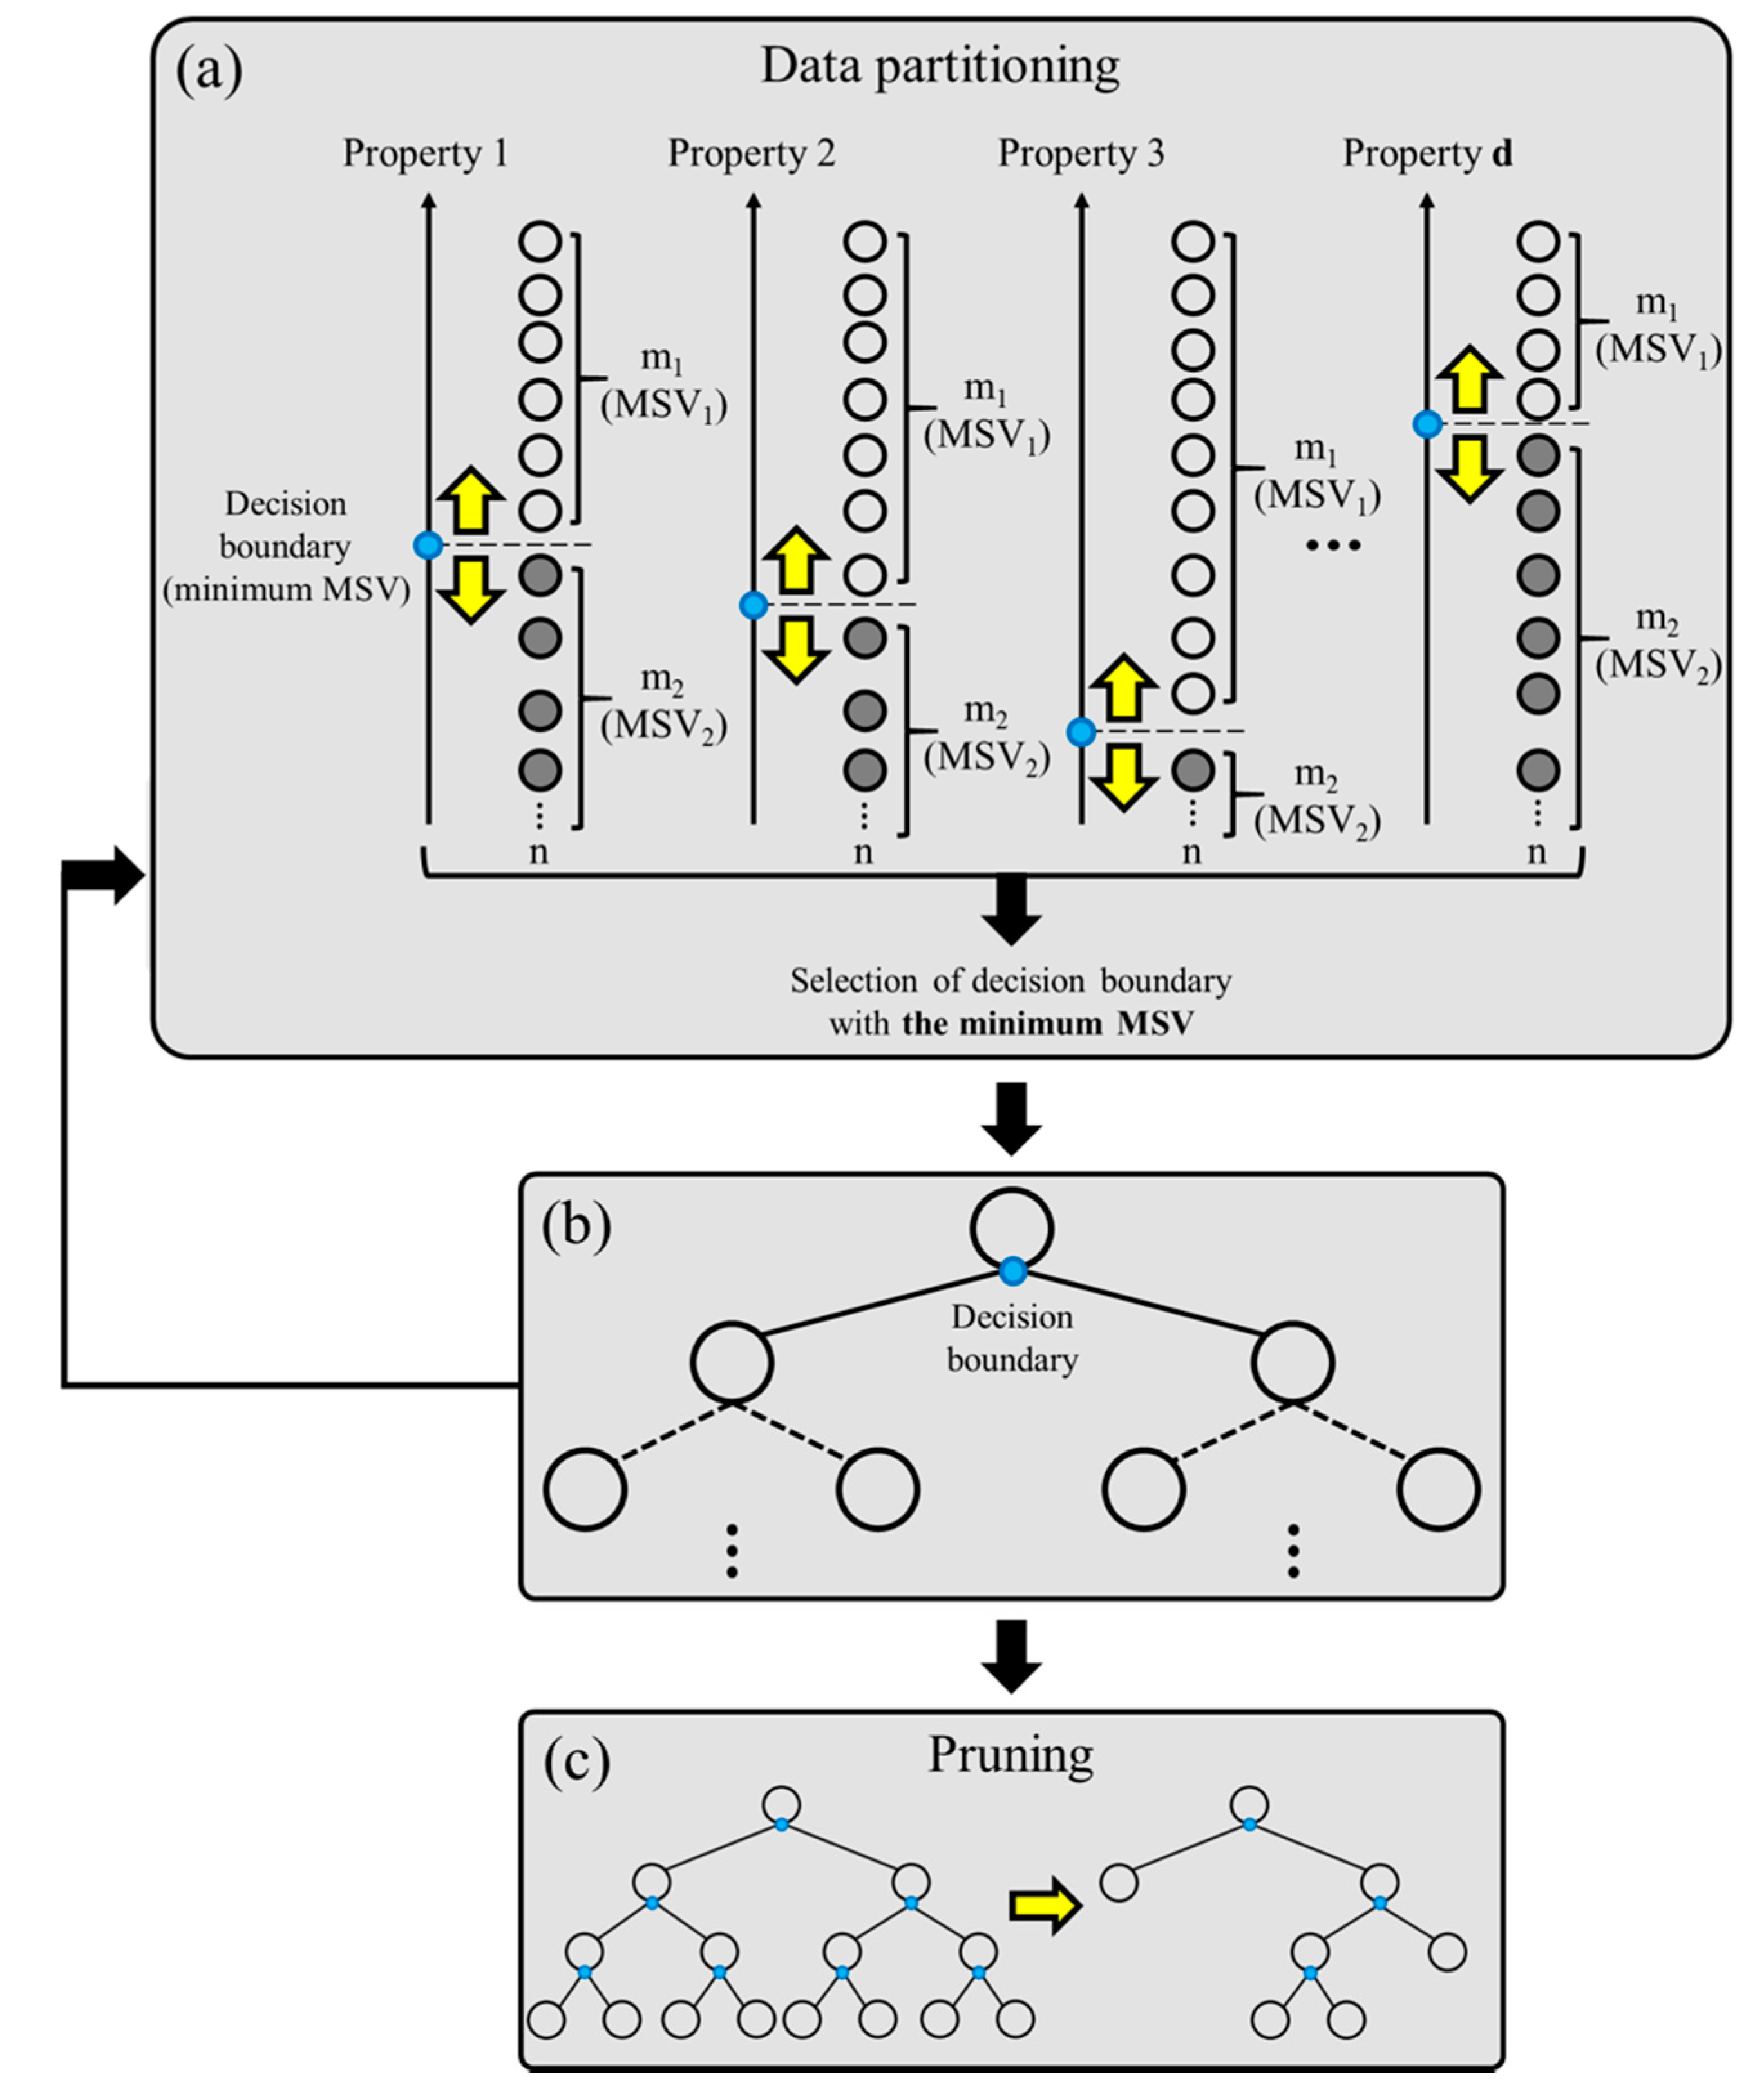
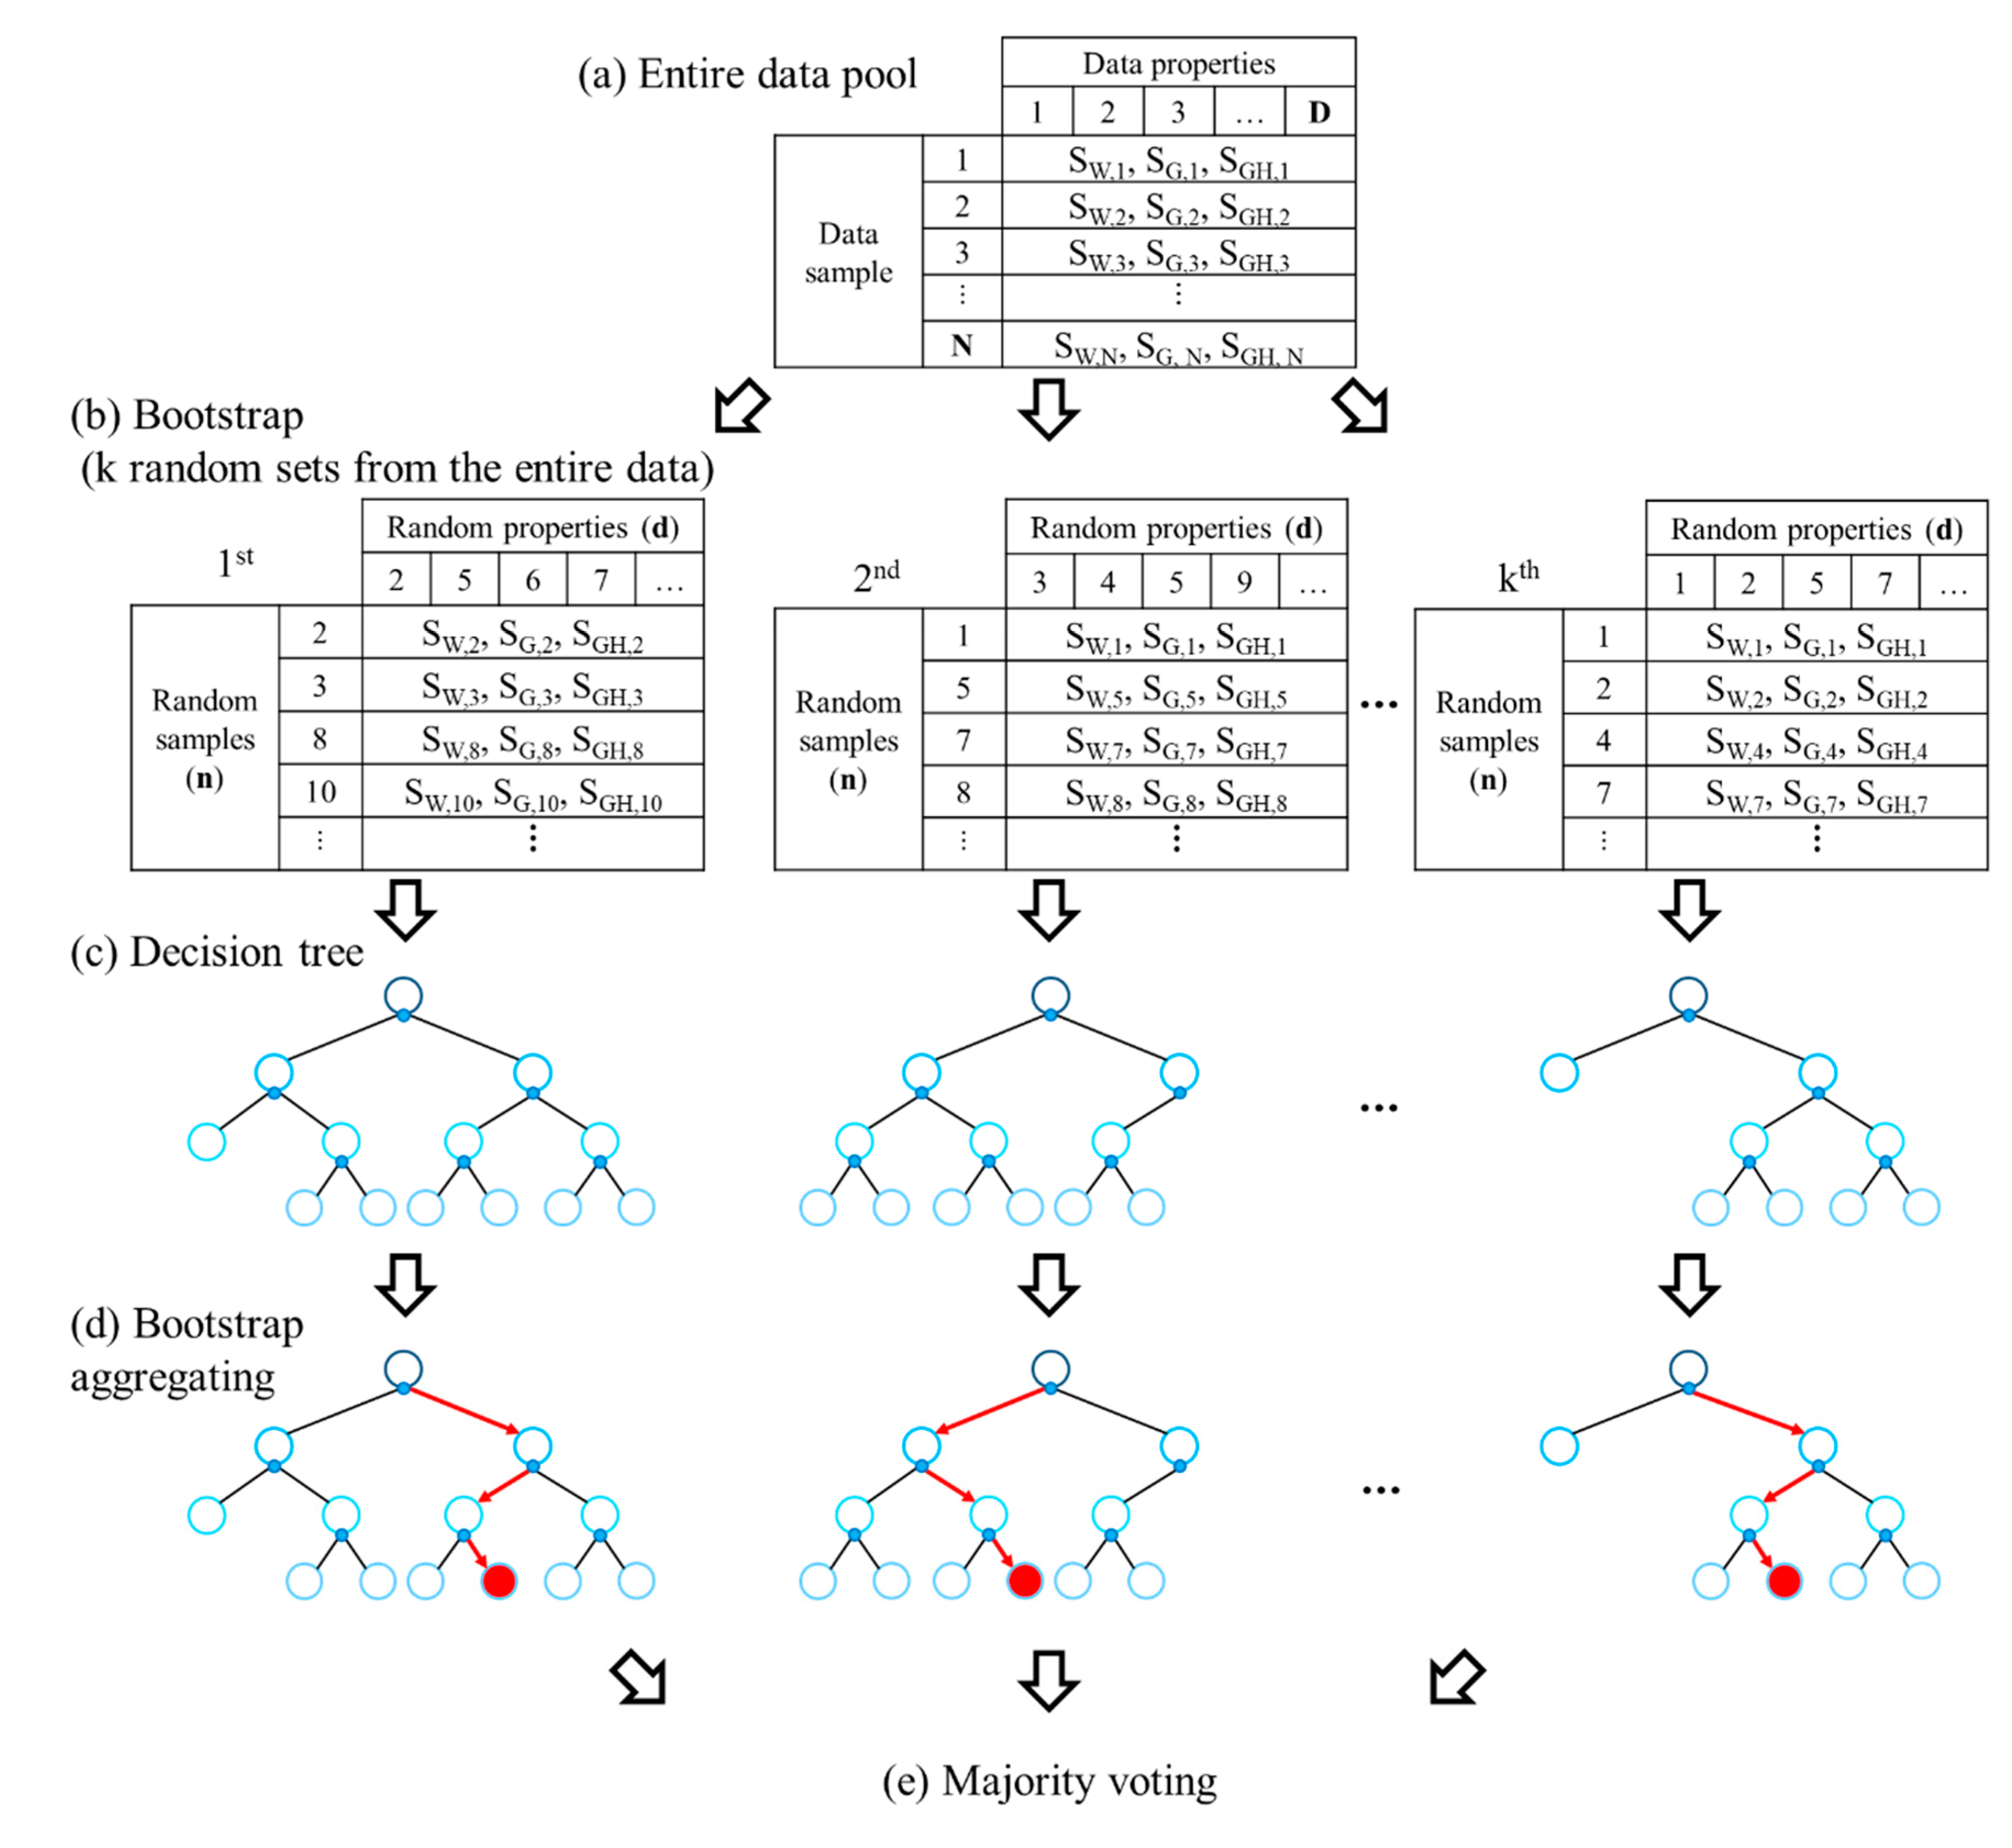
2.3. Machine-Learning Methodology: Random Forest (RF)
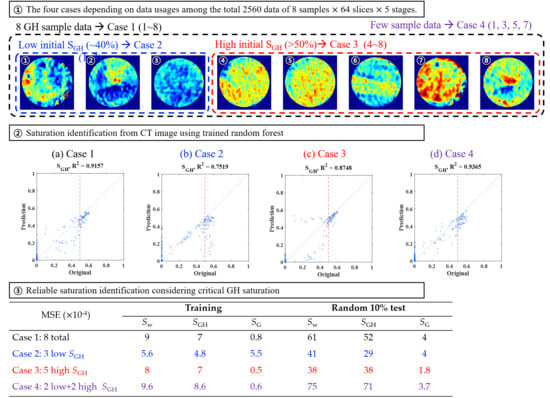
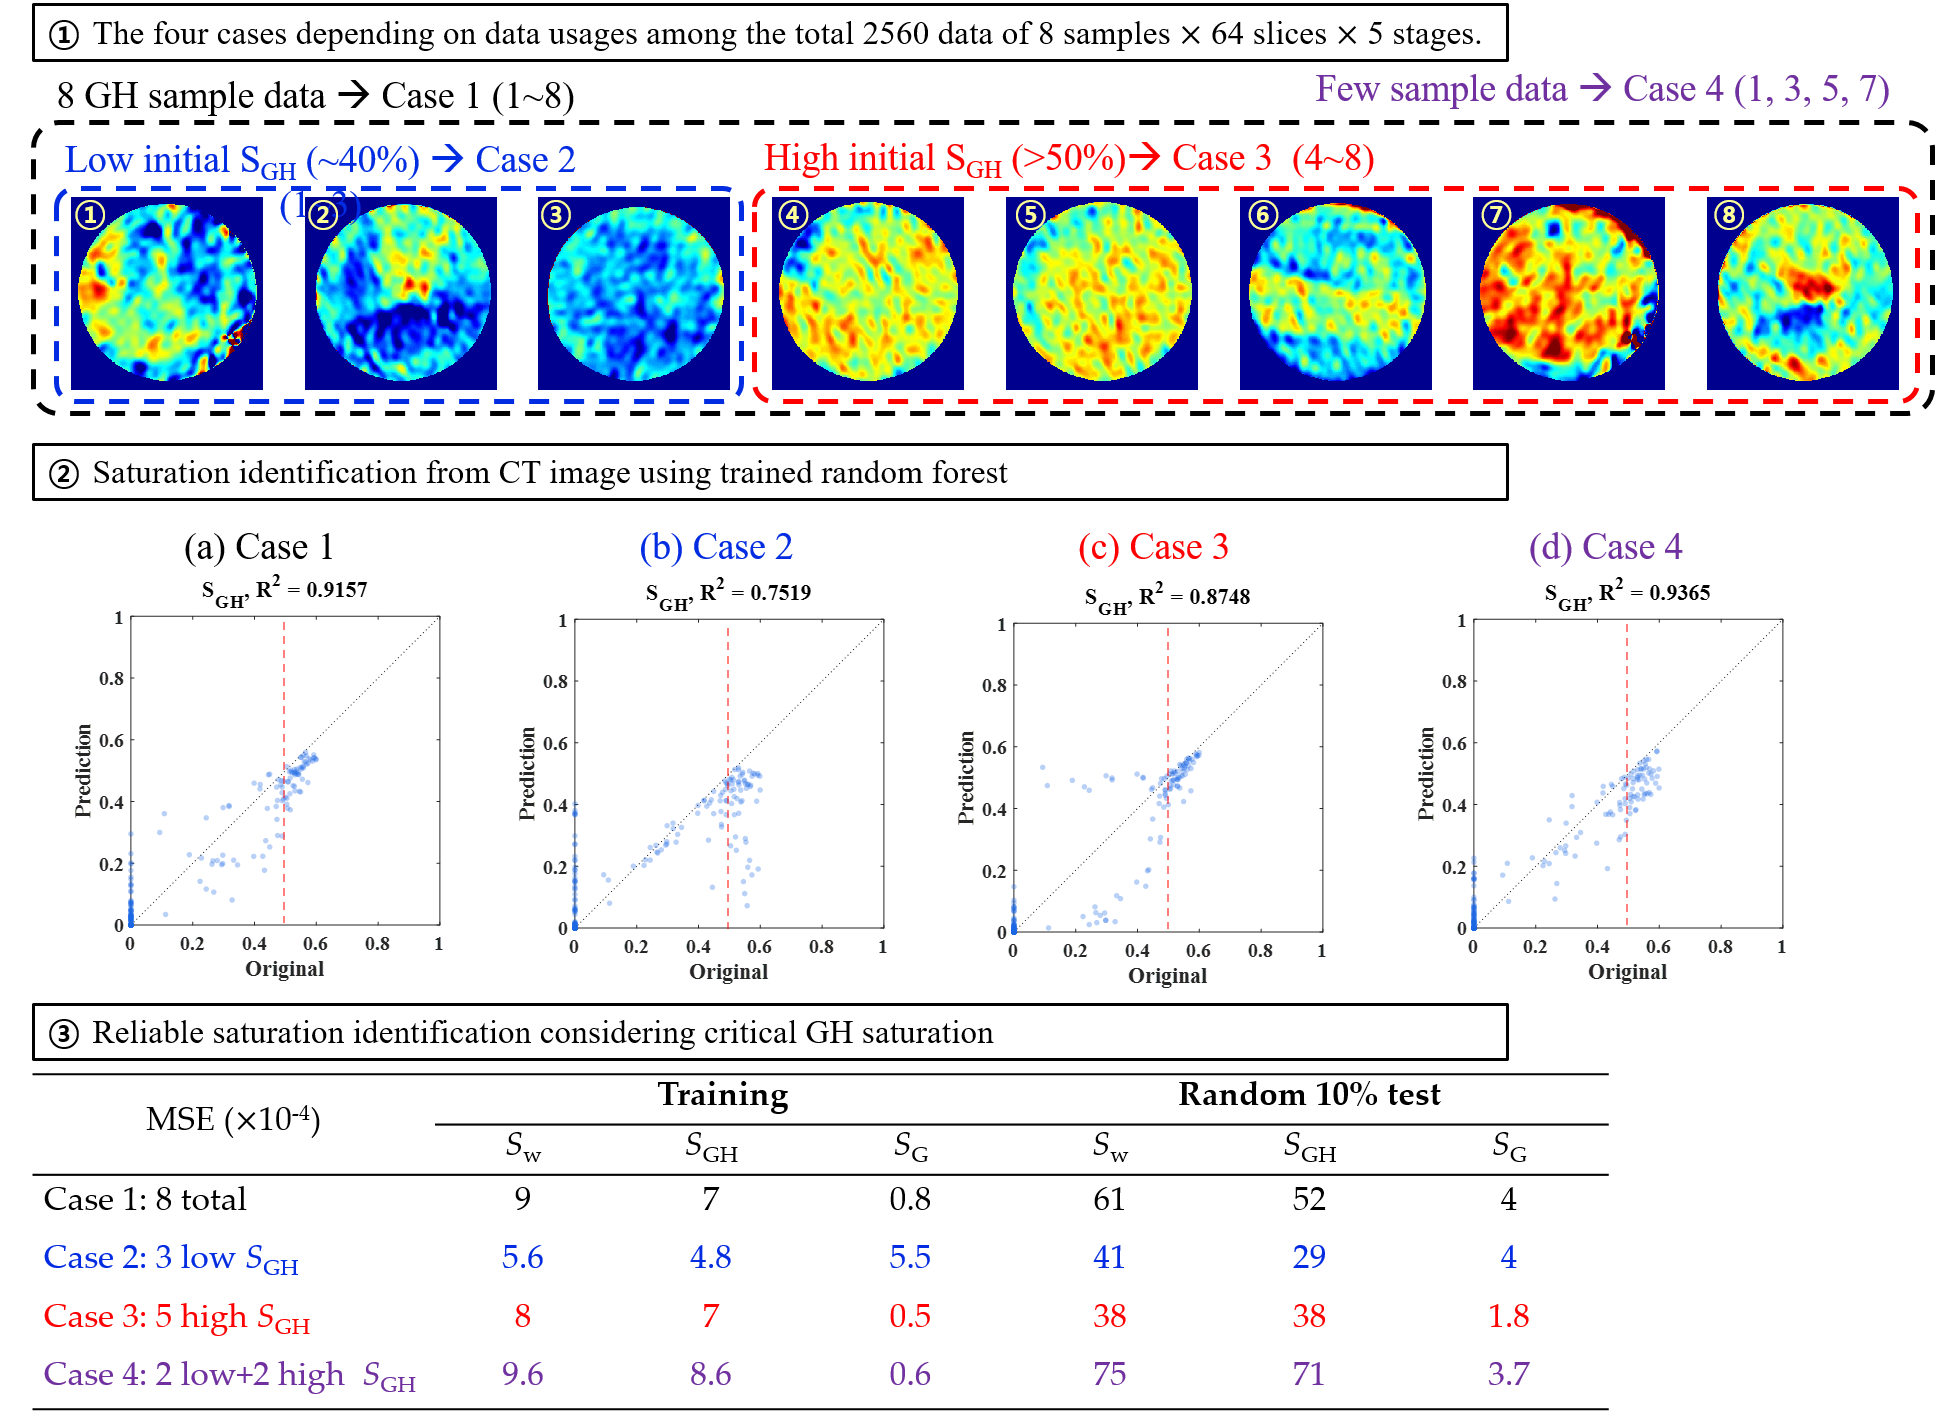
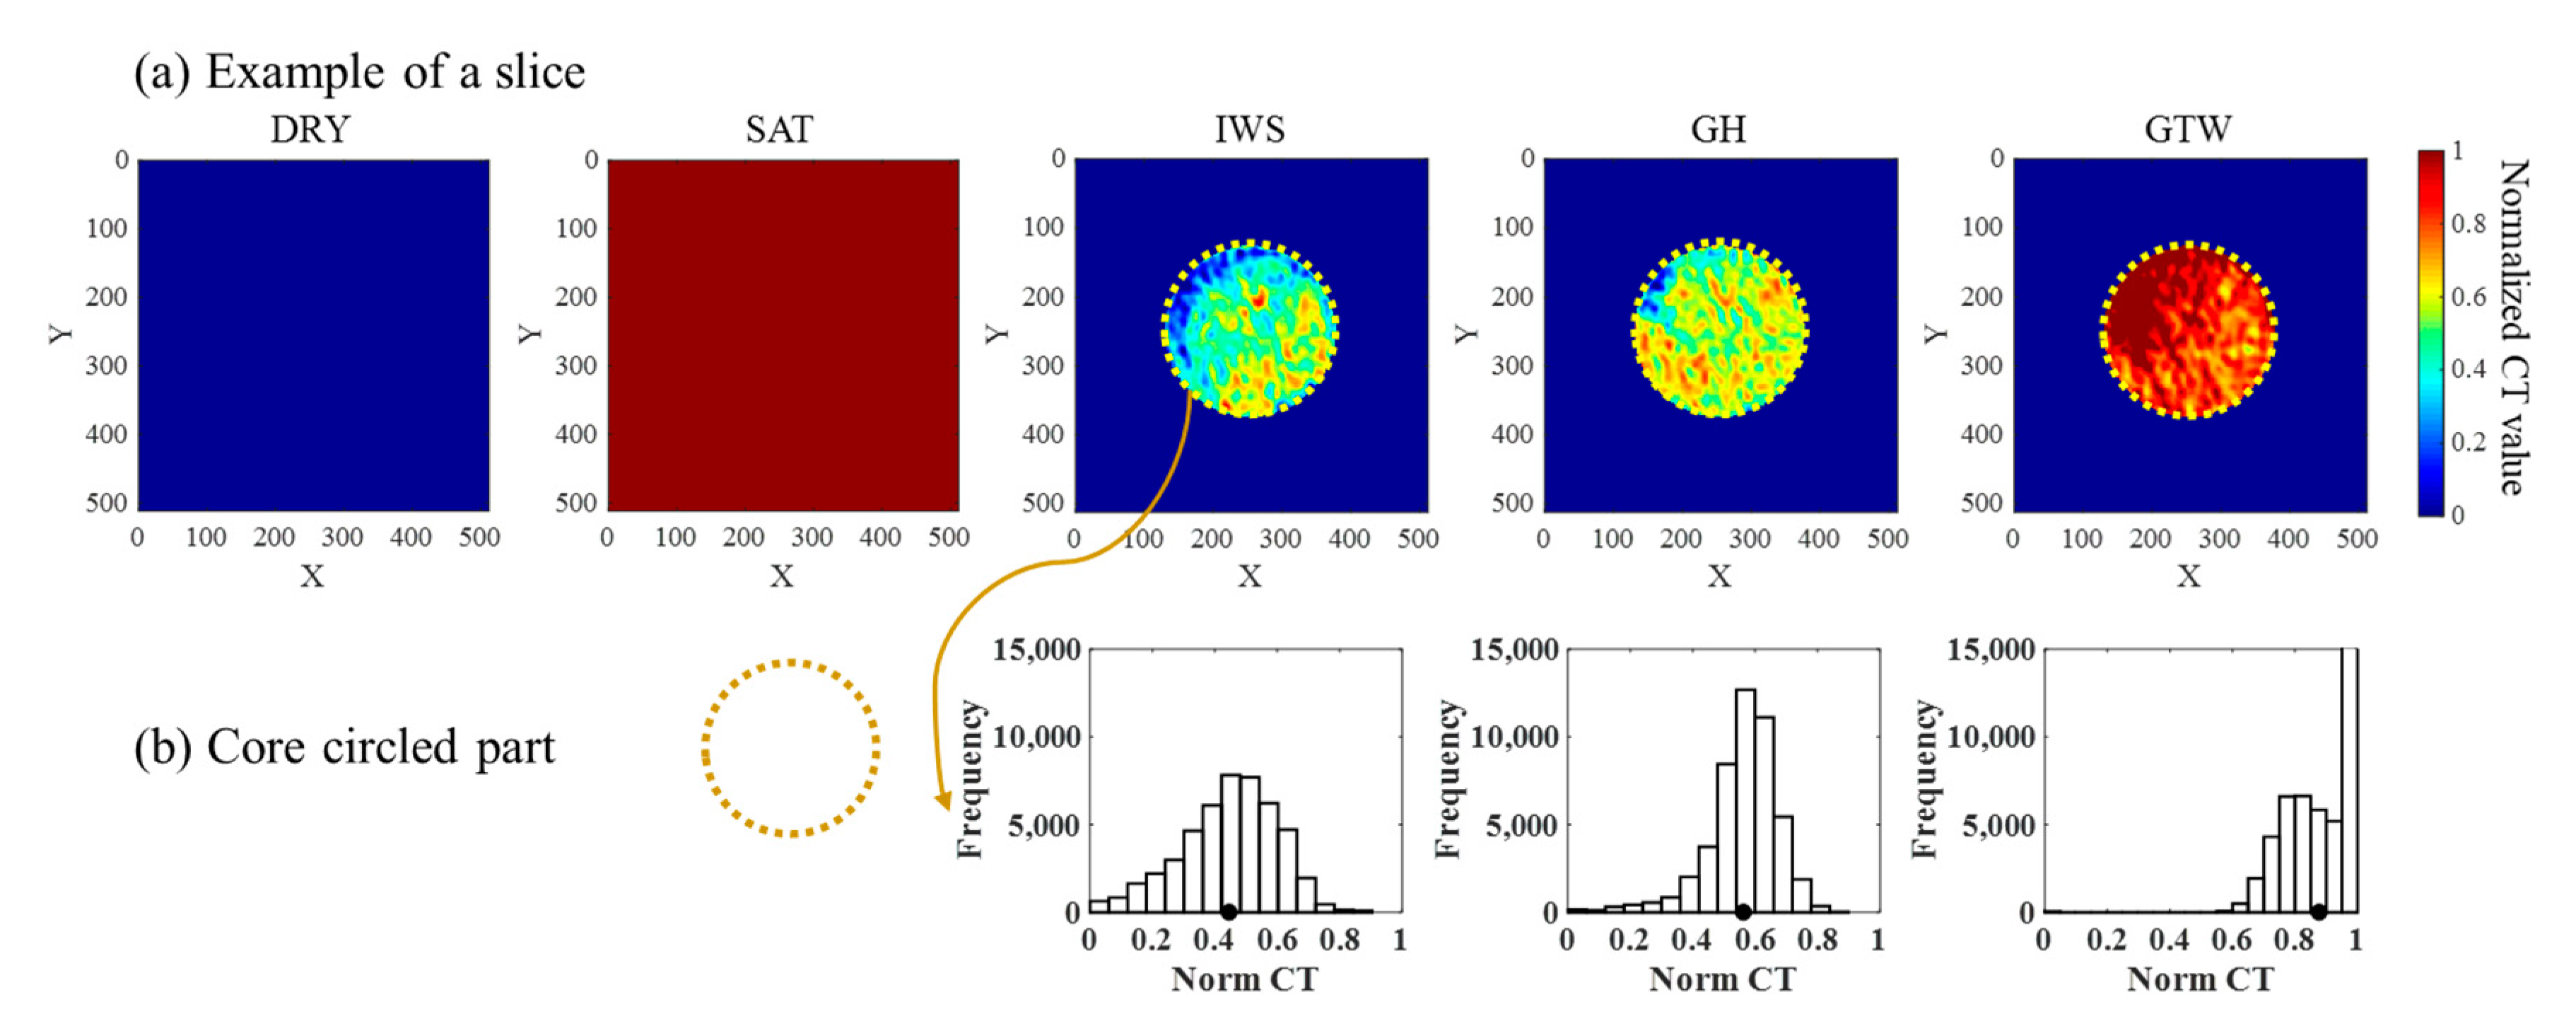
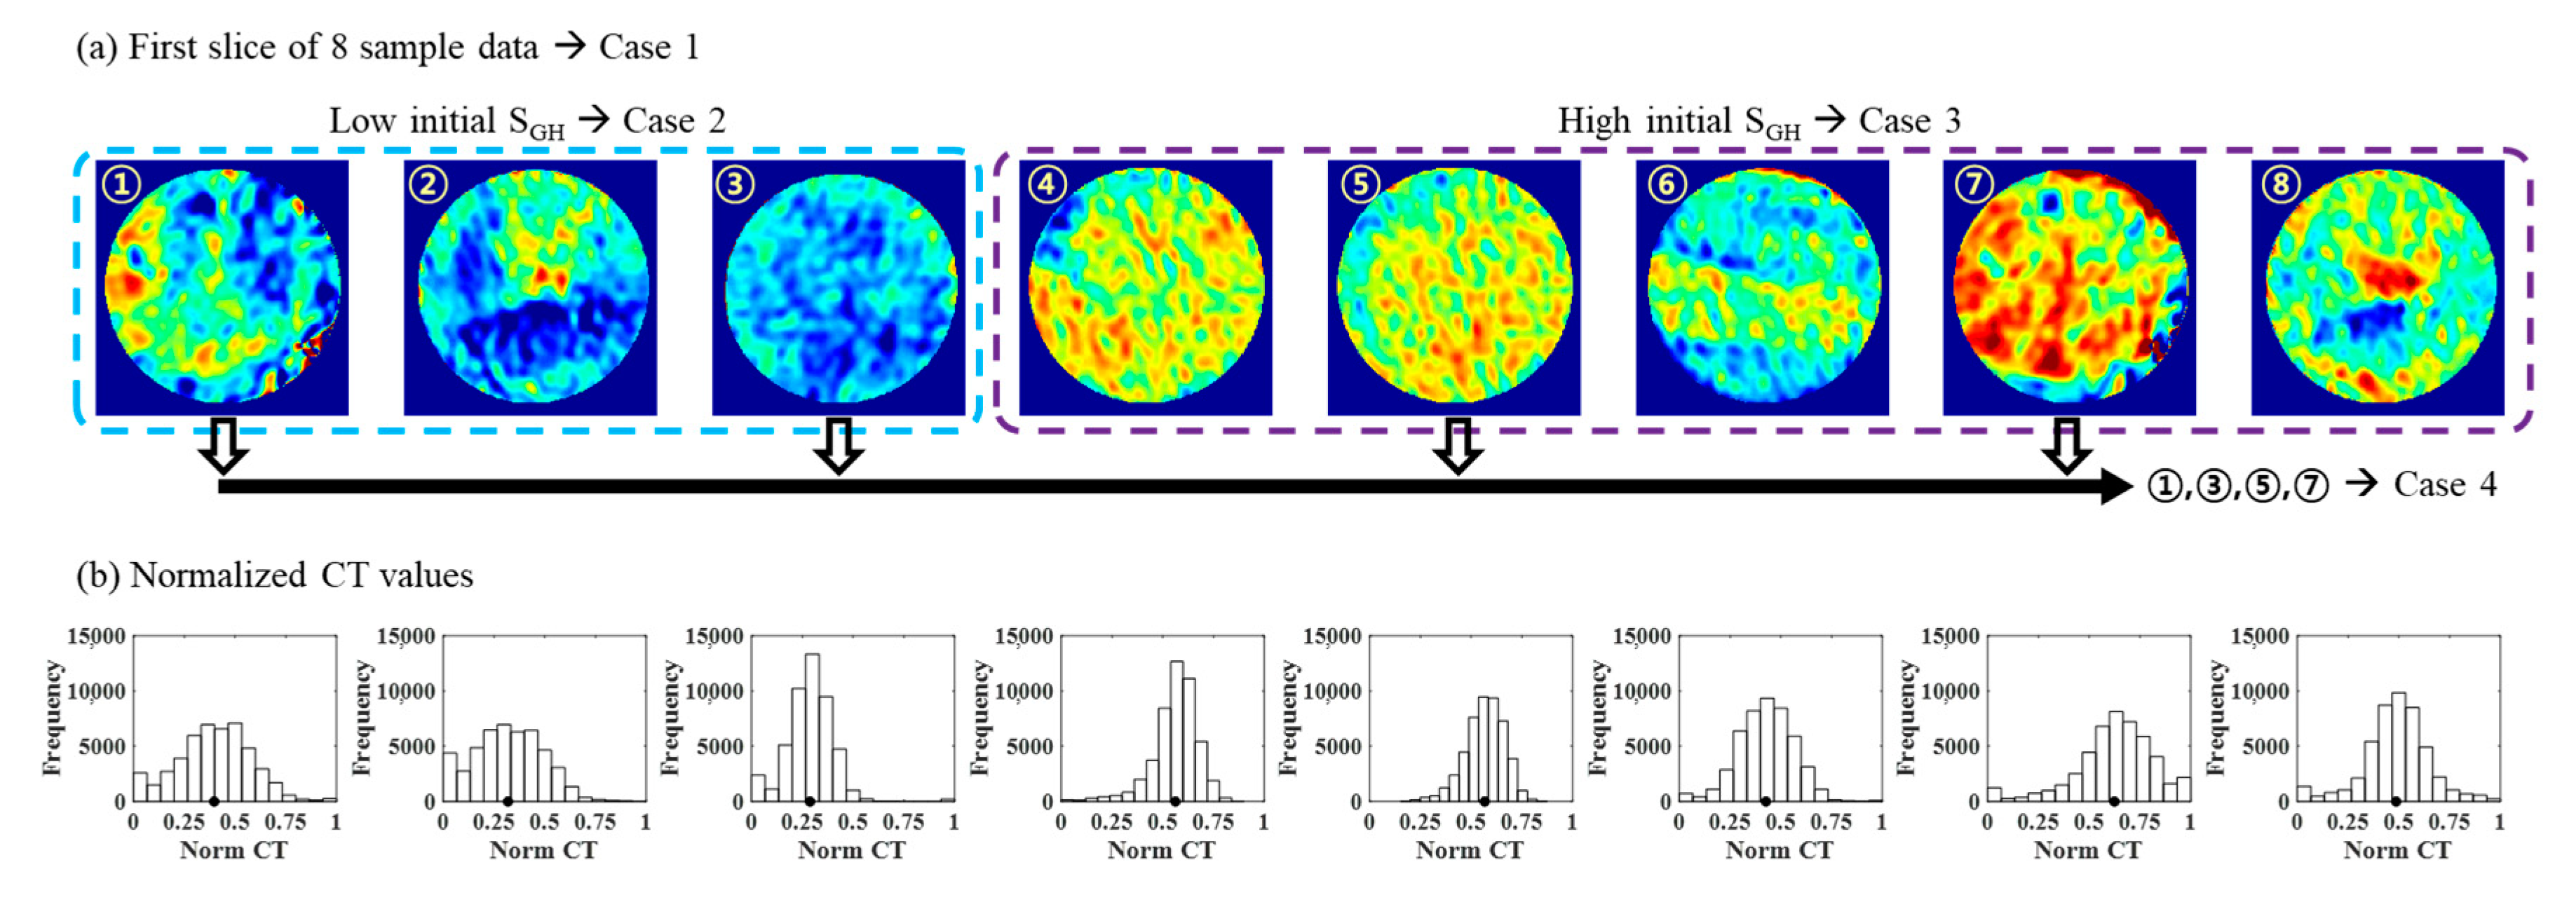
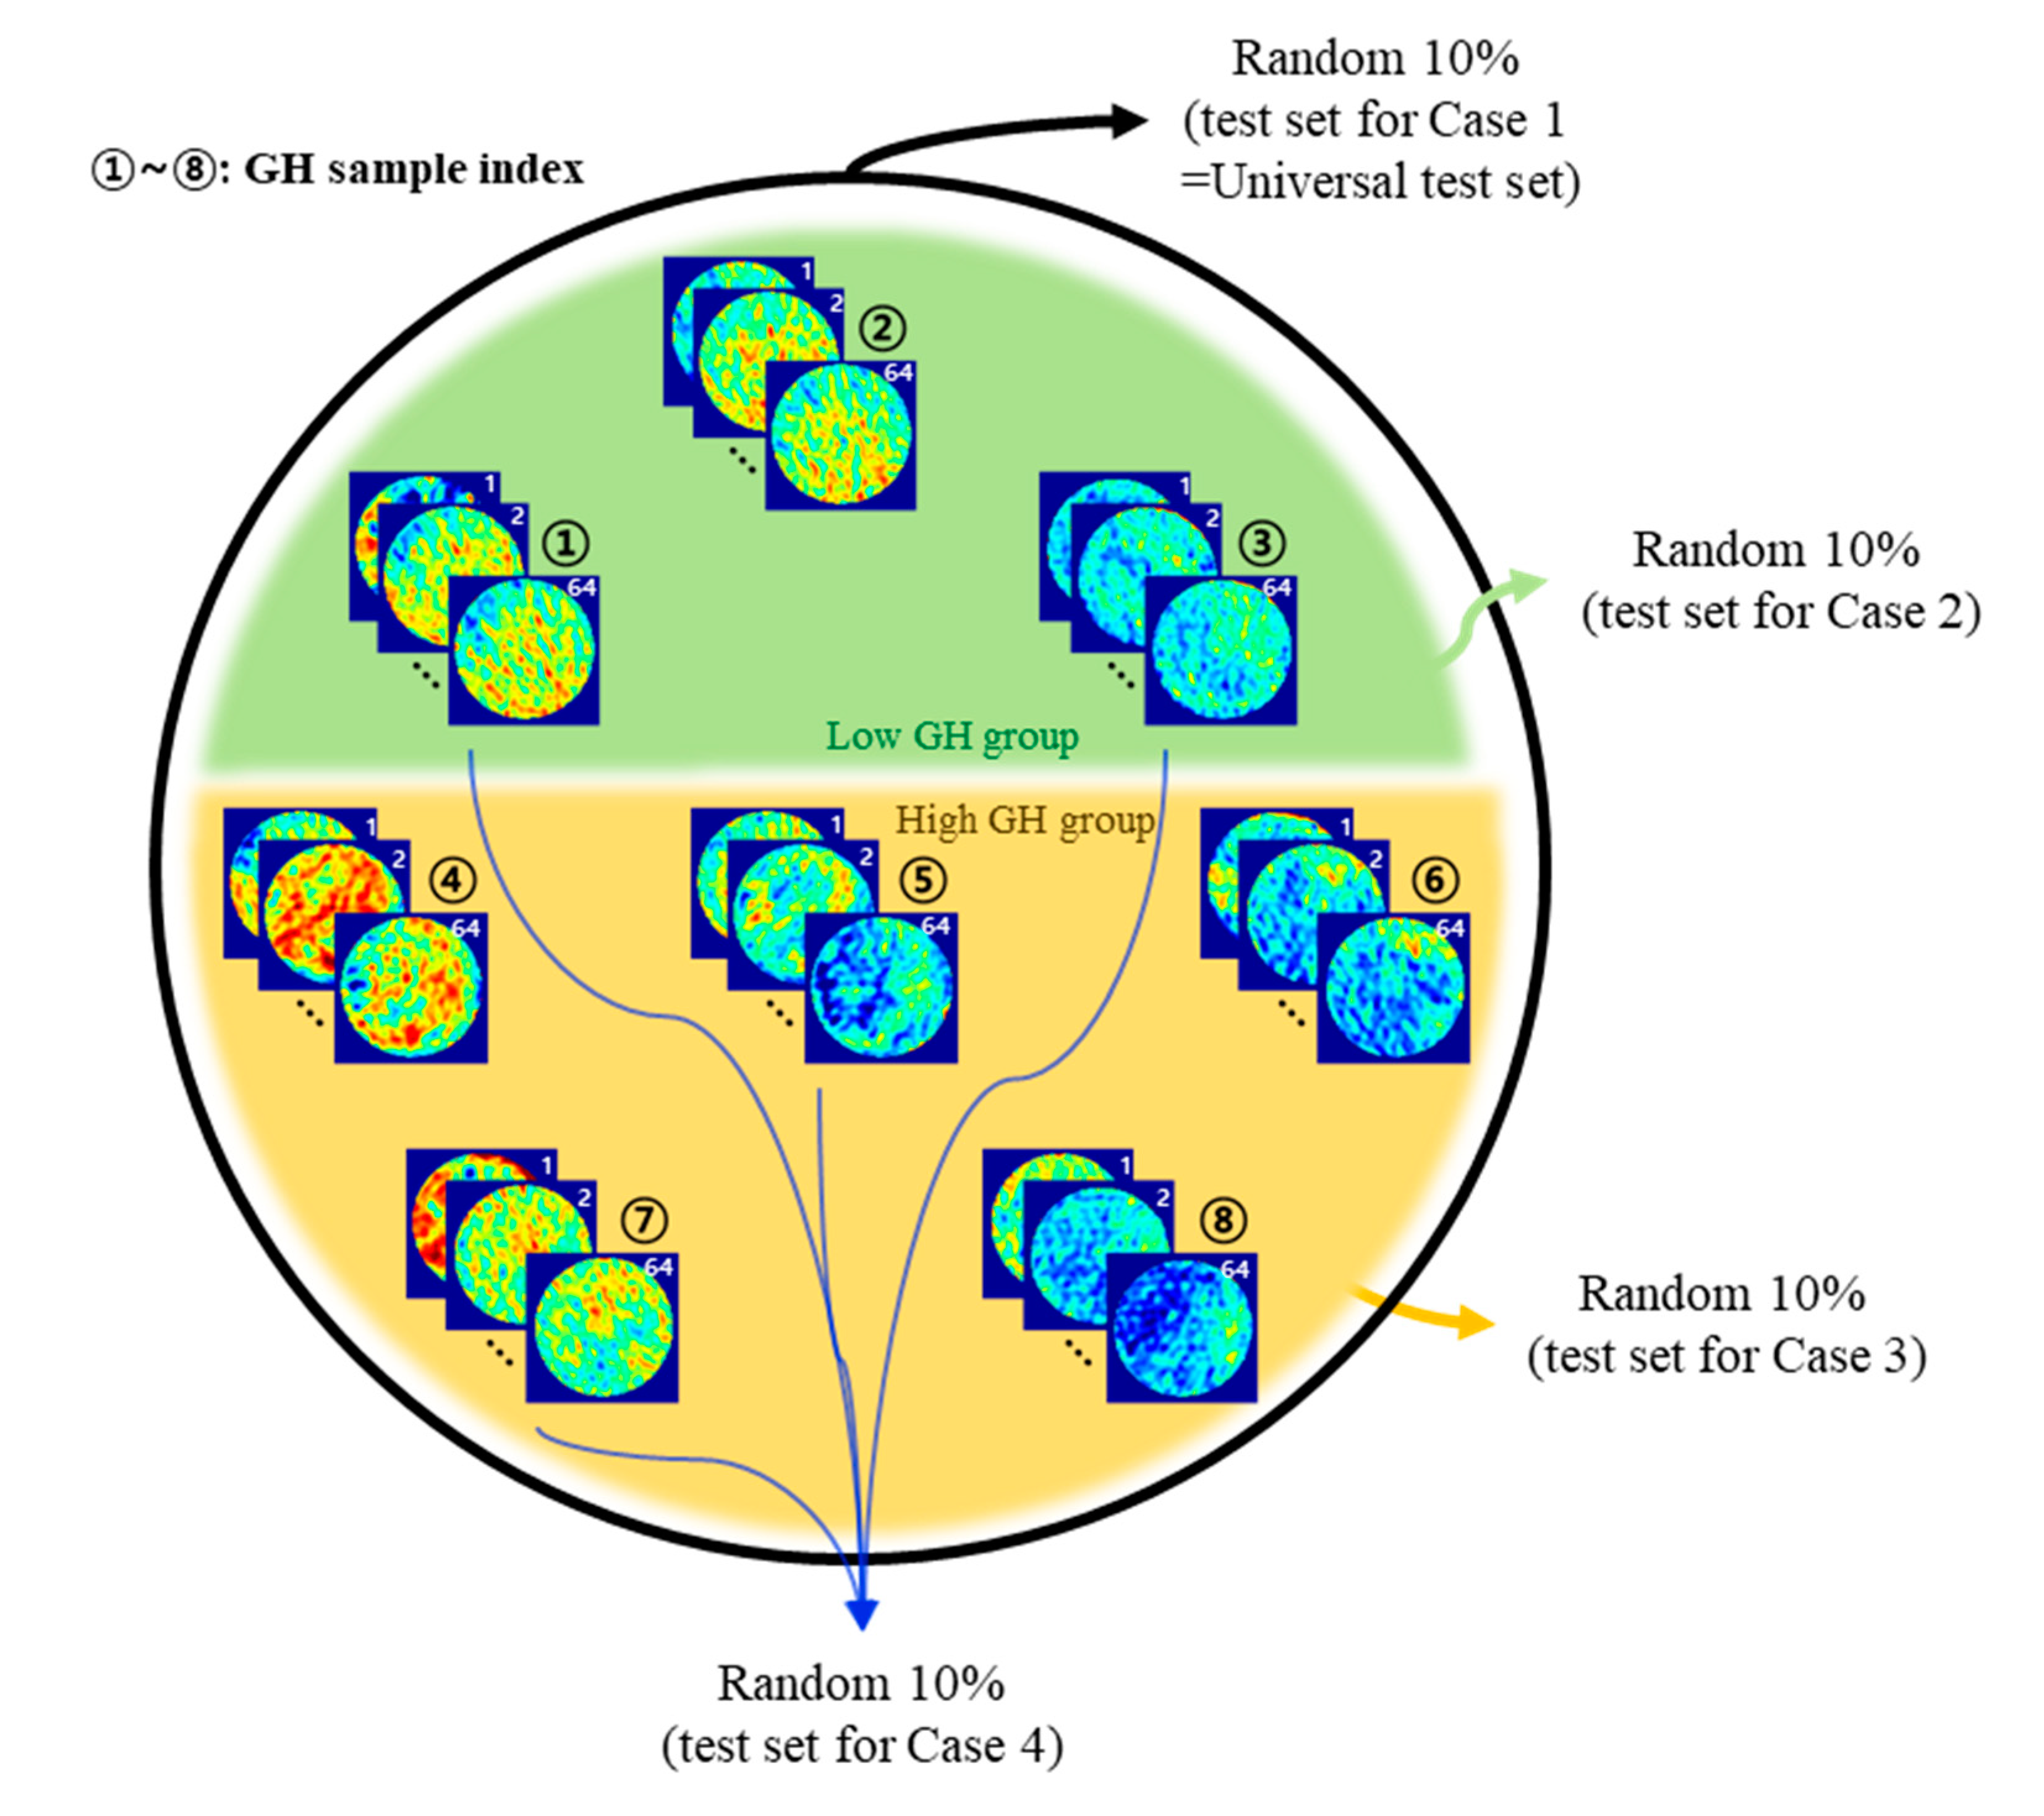
3. Construction of Training Data
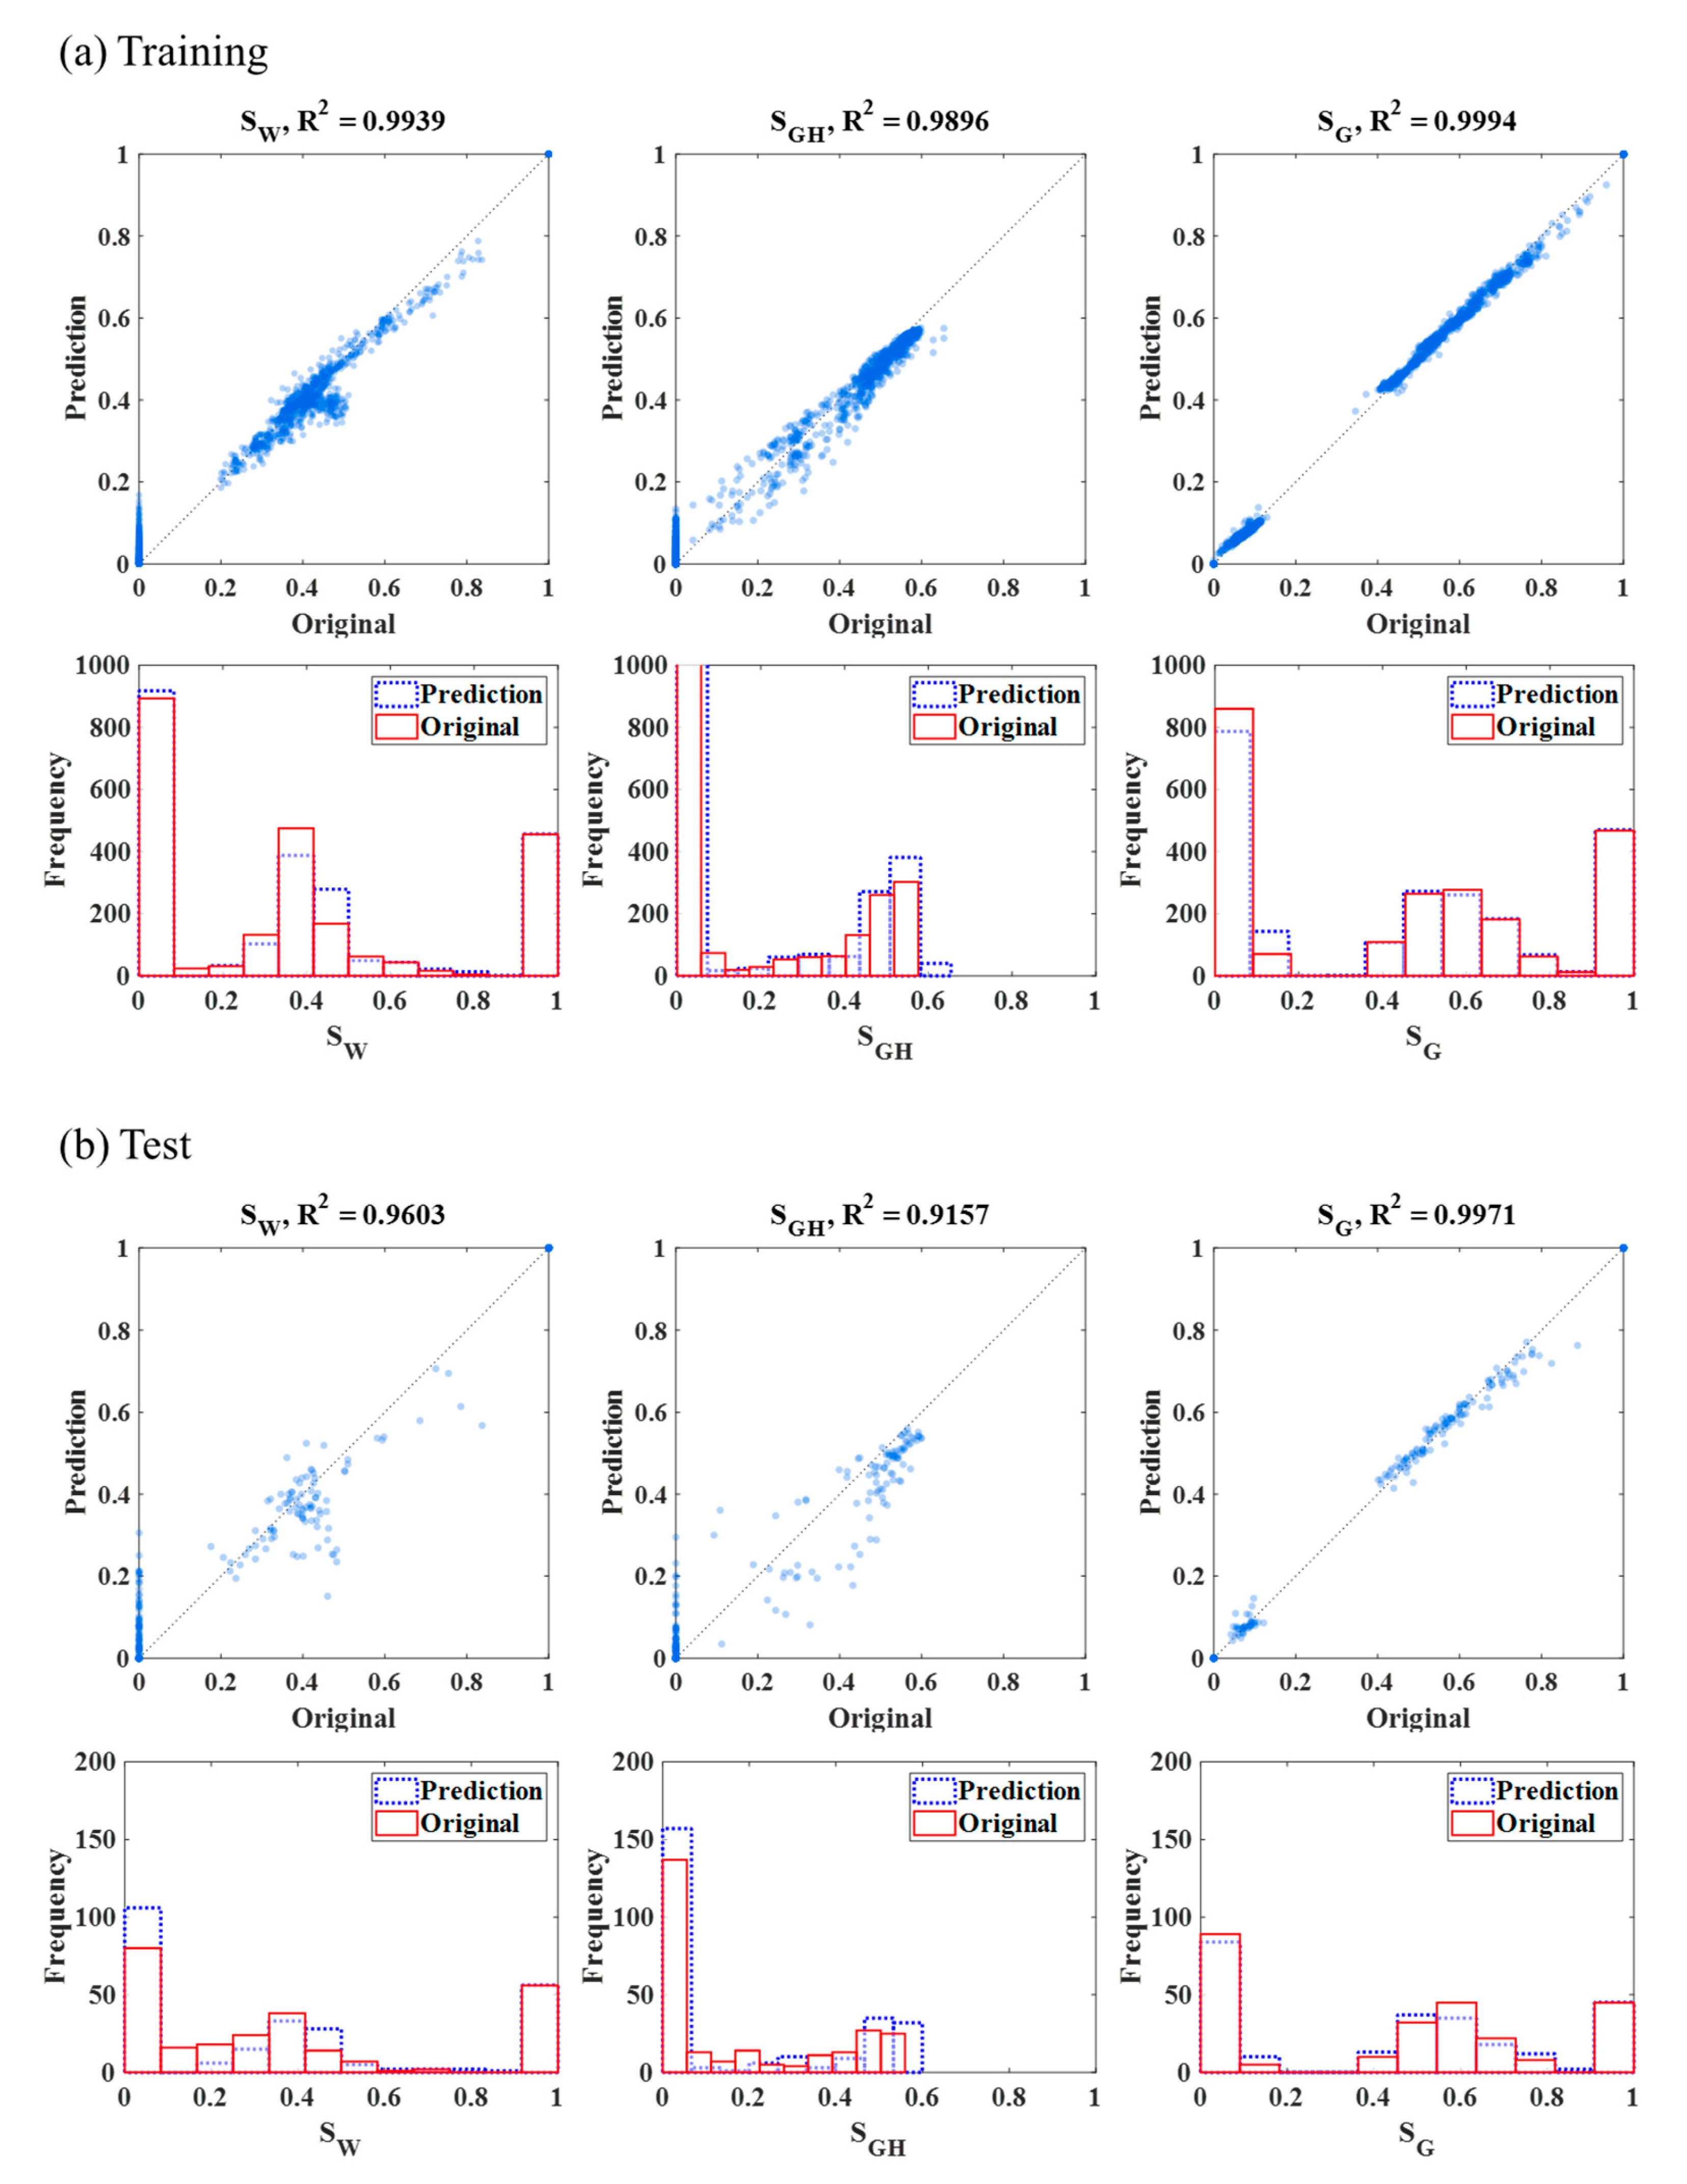
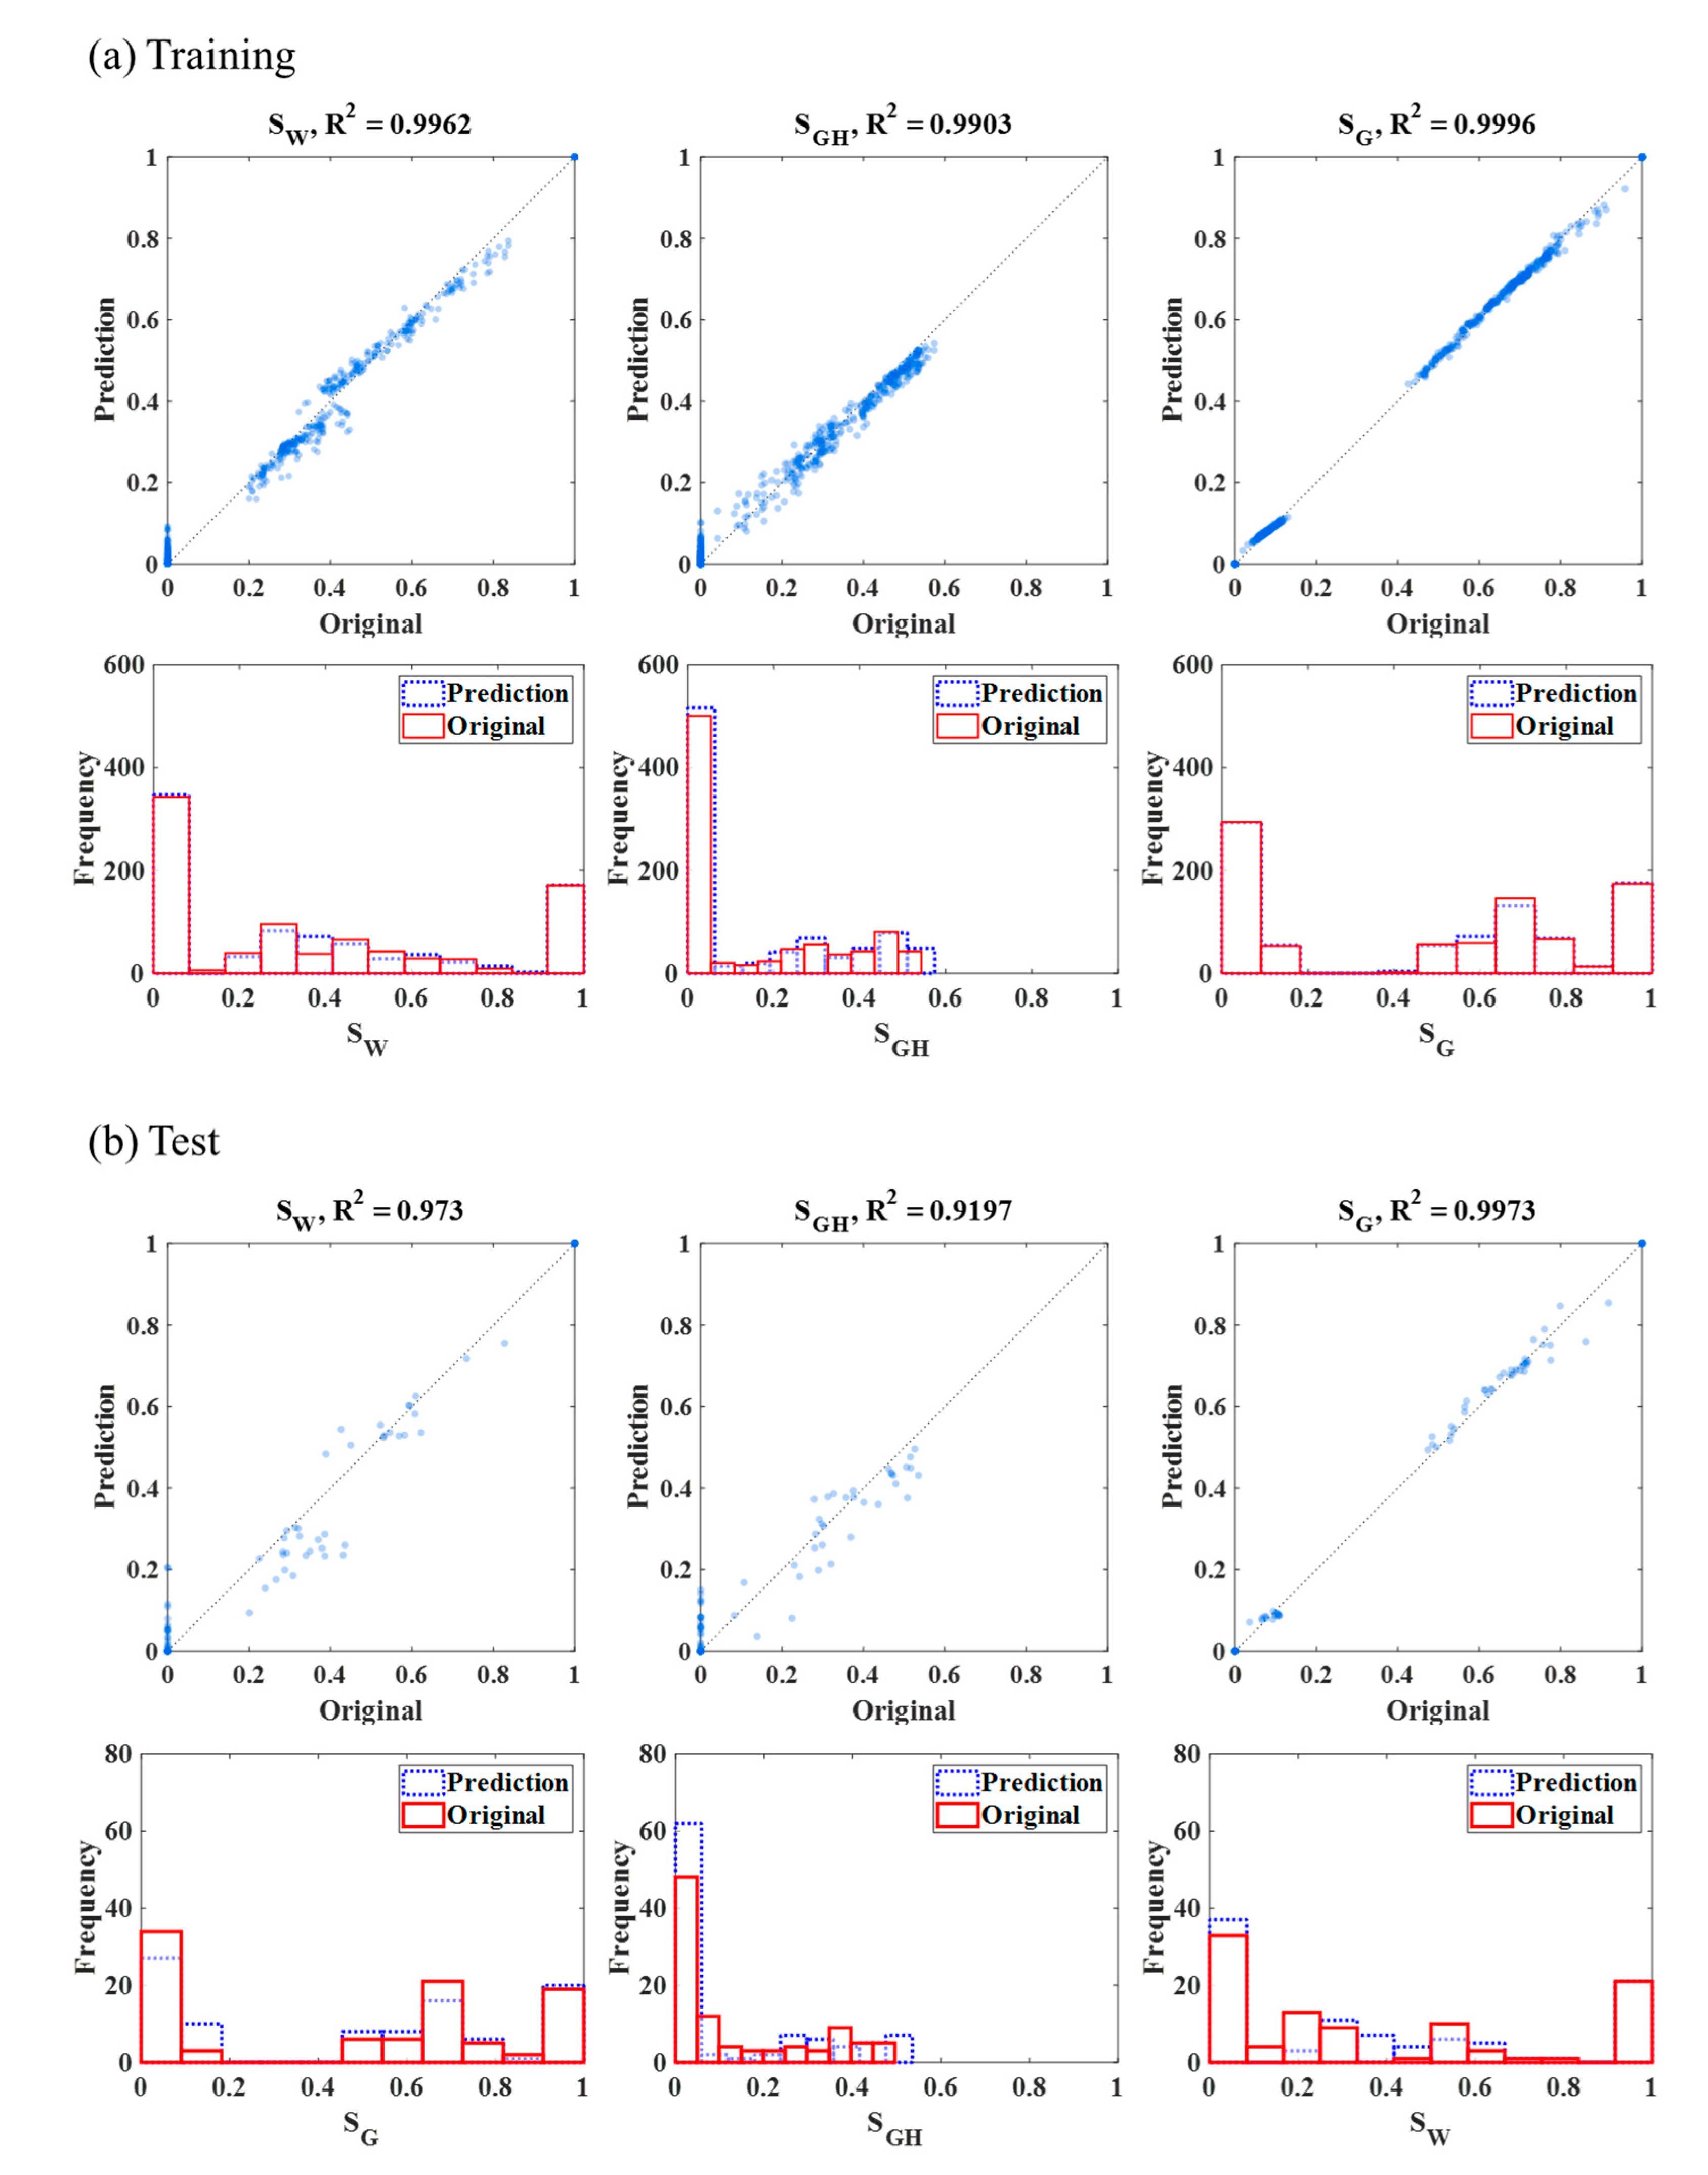
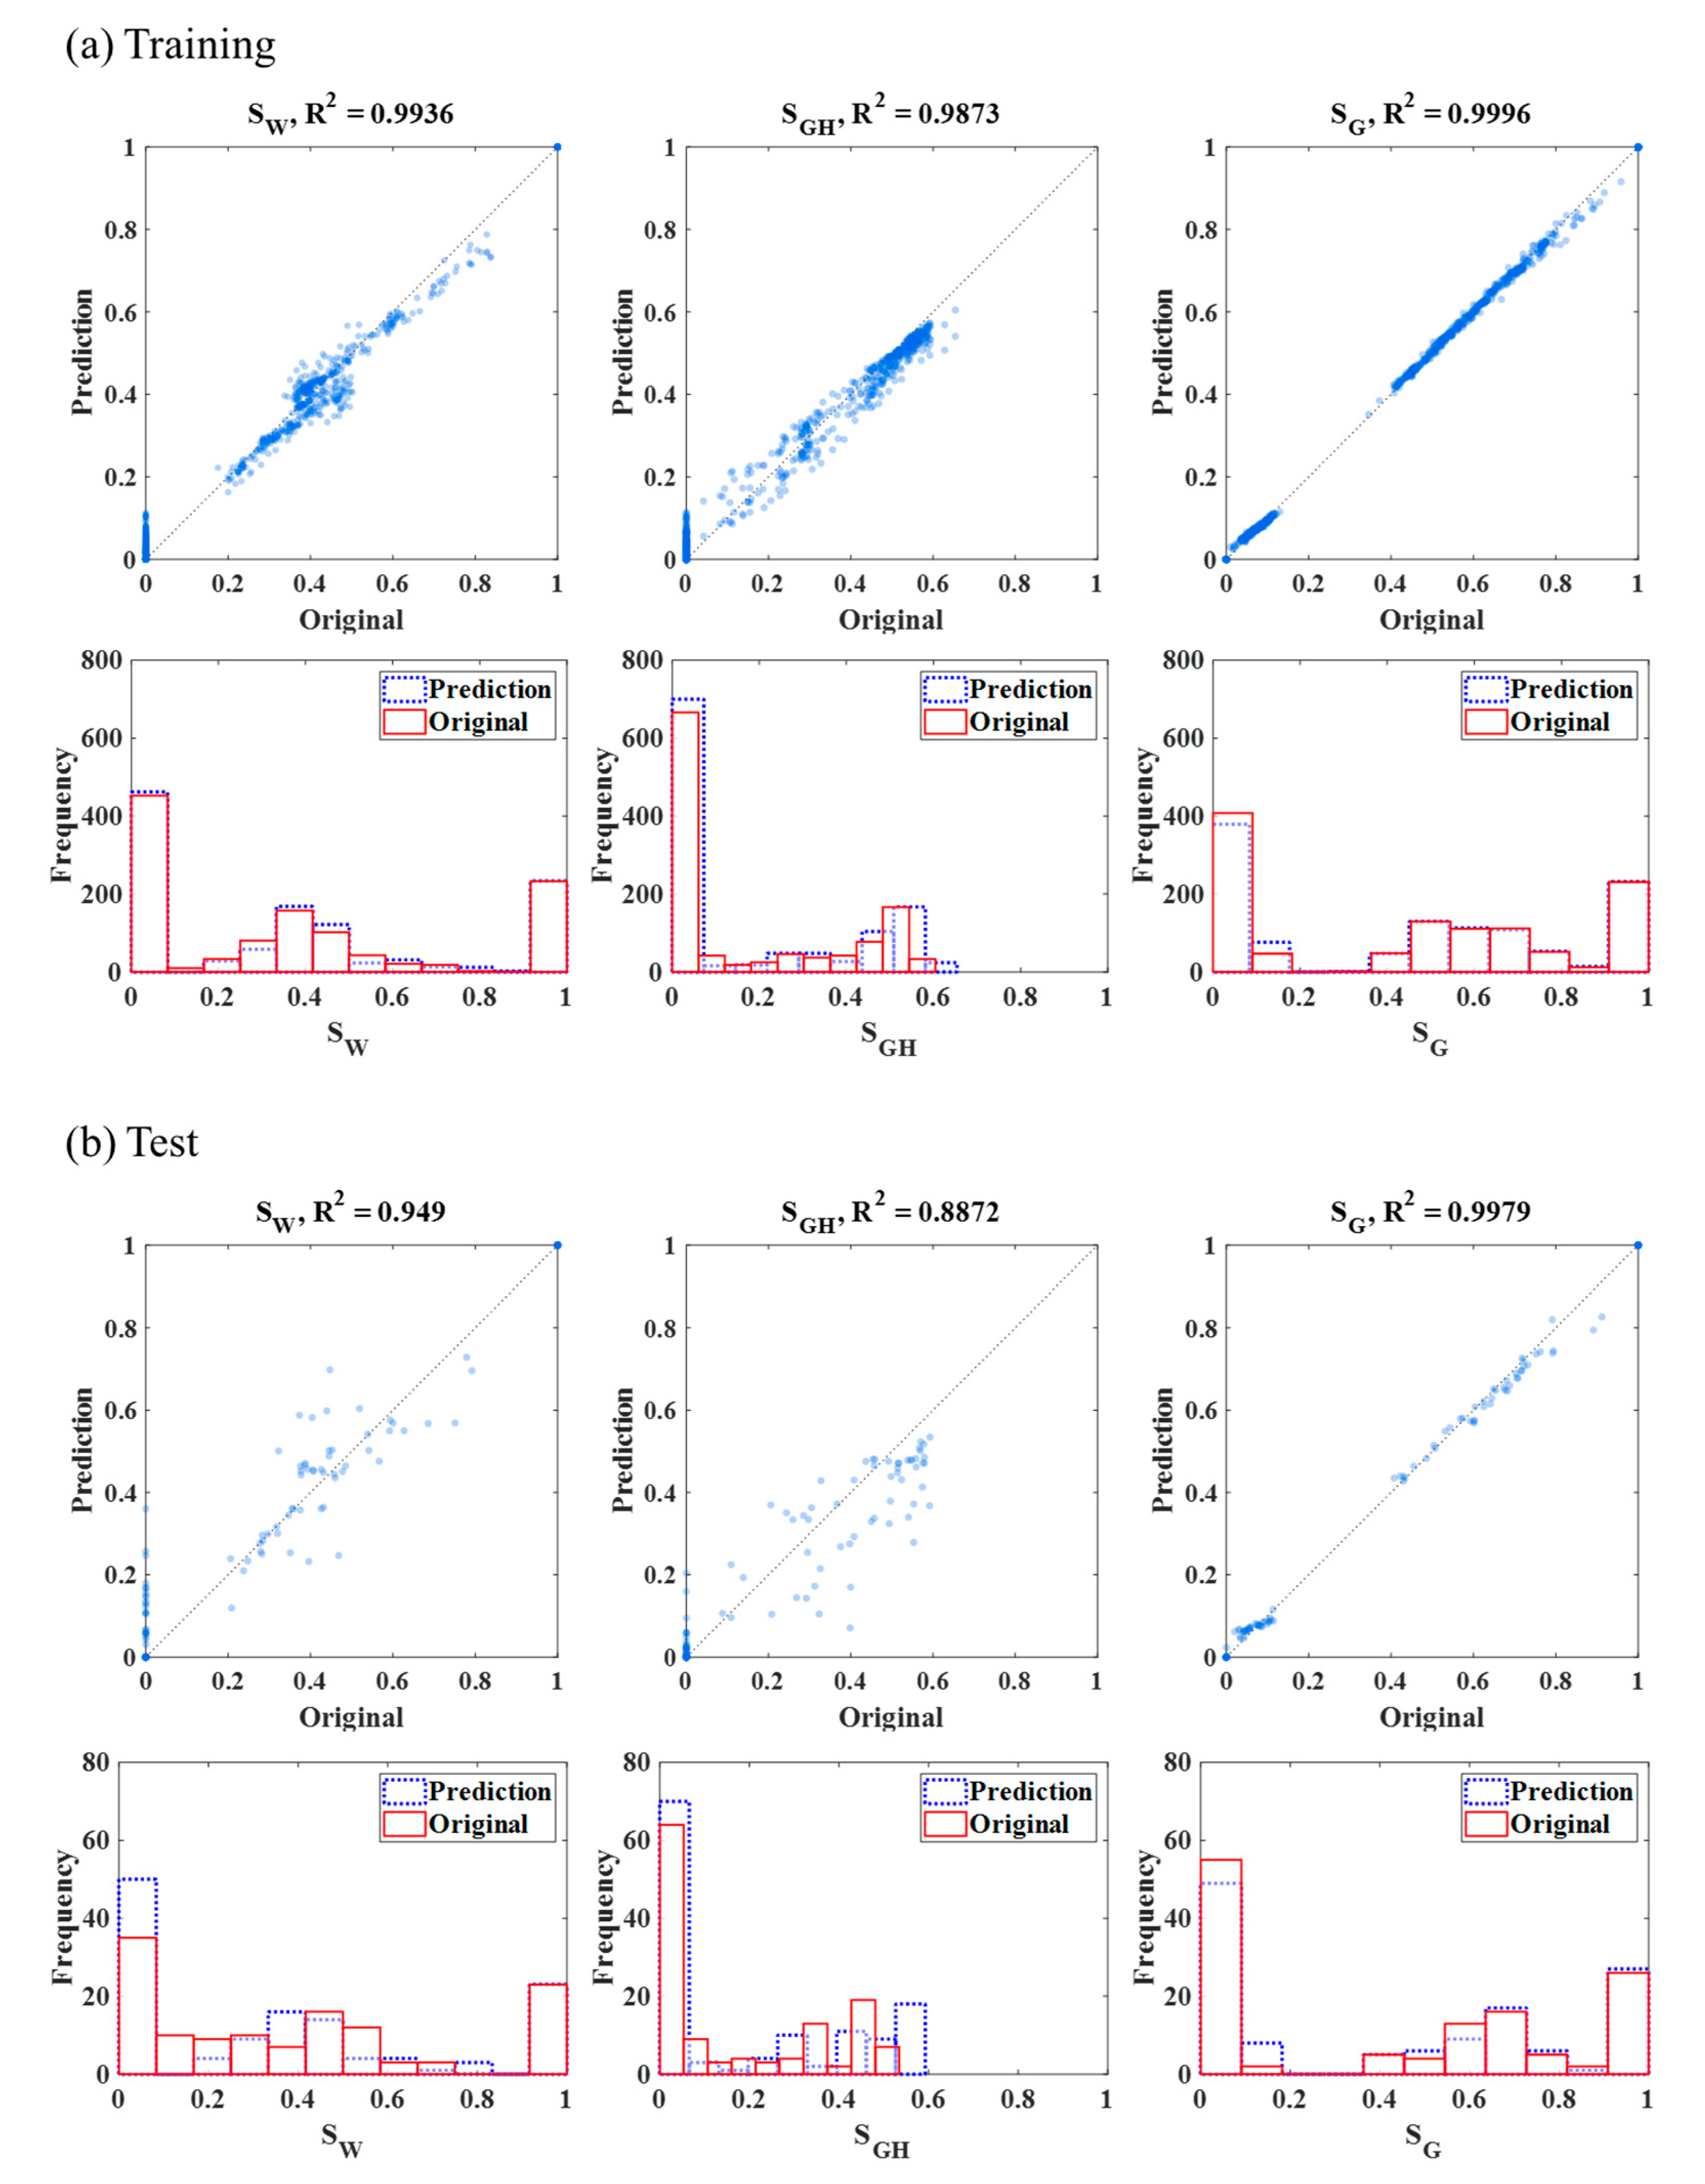
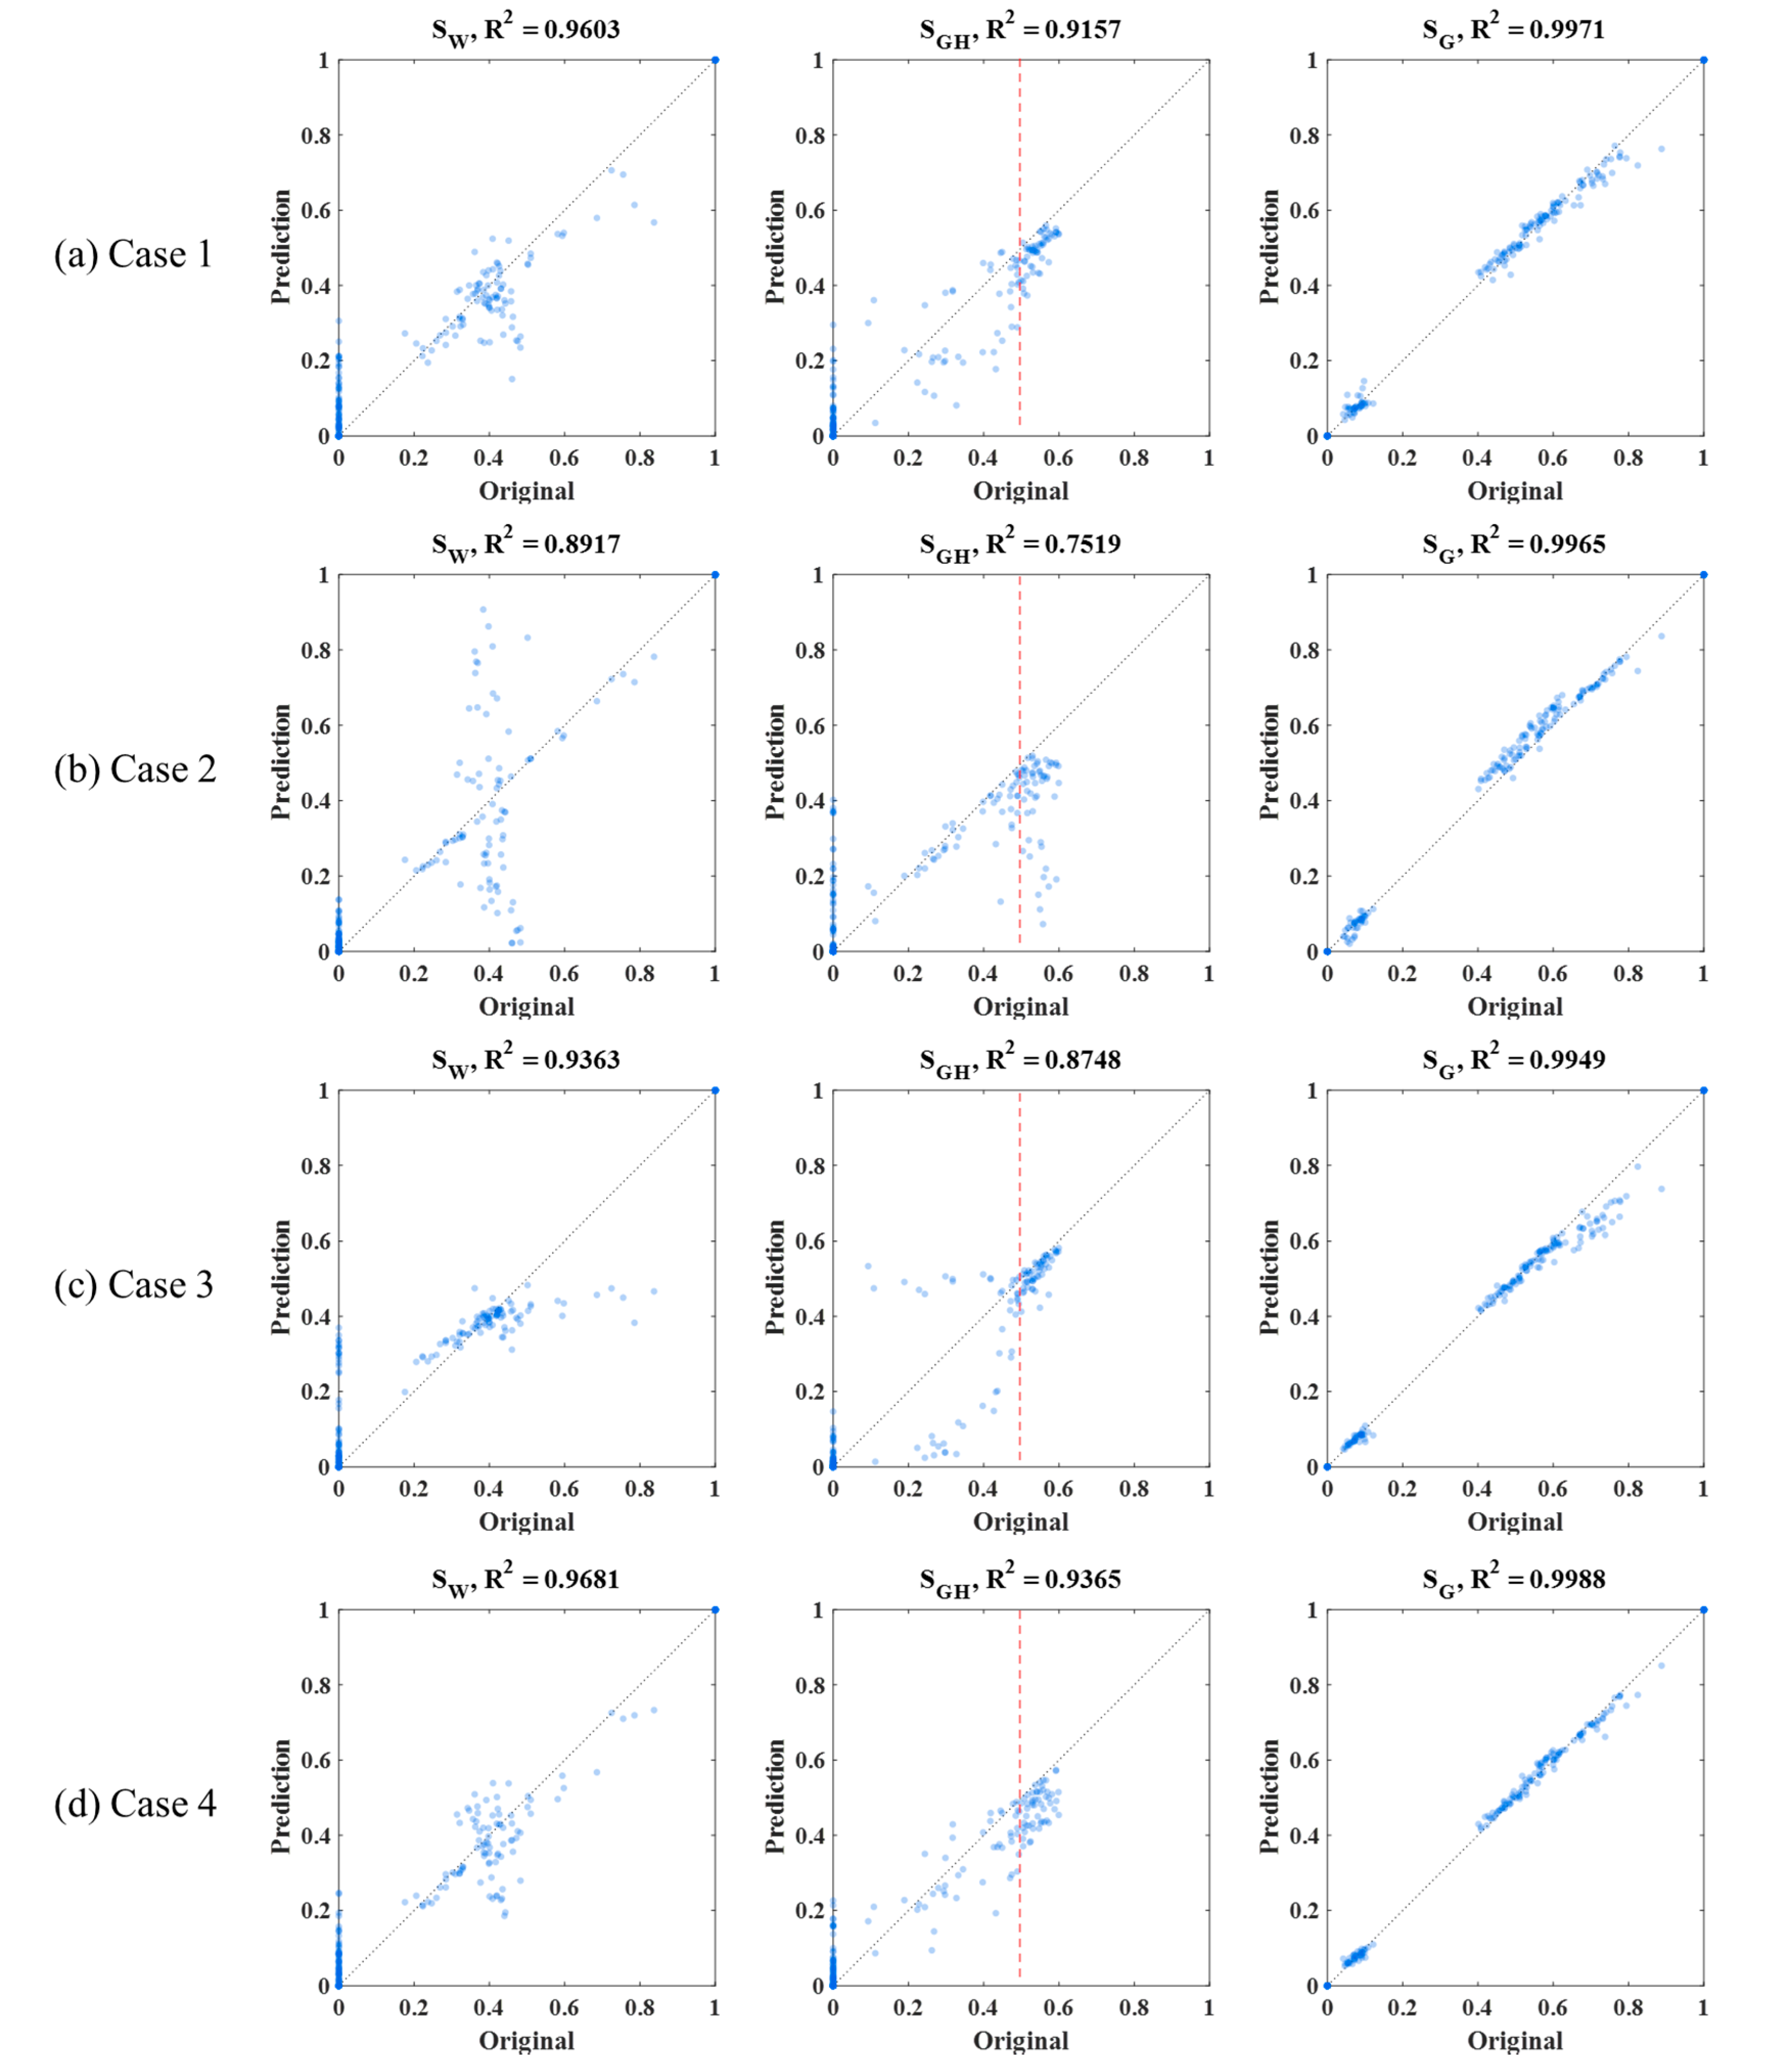
4. Results and Discussion
5. Conclusions
Author Contributions
Funding
Acknowledgments
Conflicts of Interest
References
- Kumar, P.; Collett, T.S.; Shukla, K.M.; Yadav, U.S.; Lall, M.V.; Vishwanath, K.; Yamada, Y. India National Gas Hydrate Program Expedition-02: Operational and technical summary. Mar. Petrol. Geol. 2019, 108, 3–38. [Google Scholar] [CrossRef]
- Li, J.; Ye, J.; Qin, X.; Qiu, H.J.; Wu, N.Y.; Lu, H.L.; Xie, W.W.; Lu, J.A.; Peng, F.; Xu, Z.Q.; et al. The first offshore natural gas hydrate production test in South China Sea. China Geol. 2018, 1, 5–16. [Google Scholar] [CrossRef]
- Haines, S.S.; Hart, P.E.; Collett, T.S.; Shedd, W.; Frye, M.; Weimer, P.; Boswell, R. High-resolution seismic characterization of the gas and gas hydrate system at Green Canyon 955, Gulf of Mexico, USA. Mar. Petrol. Geol. 2017, 82, 220–237. [Google Scholar] [CrossRef]
- Chong, Z.R.; Yang, S.H.B.; Babu, P.; Linga, P.; Li, X.-S. Review of natural gas hydrates as an energy resource: Prospects and challenges. Appl. Energy 2016, 162, 1633–1652. [Google Scholar] [CrossRef]
- Ito, T.; Komatsu, Y.; Fujii, T.; Suzuki, K.; Egawa, K.; Nakatsuka, Y.; Konno, Y.; Yoneda, J.; Jin, Y.; Kida, M.; et al. Lithological features of hydrate-bearing sediments and their relationship with gas hydrate saturation in the eastern Nankai Trough, Japan. Mar. Petrol. Geol. 2015, 66, 368–378. [Google Scholar] [CrossRef]
- Lee, J.Y.; Jung, J.W.; Lee, M.H.; Bahk, J.J.; Choi, J.; Ryu, B.J.; Schultheiss, P. Pressure core based study of gas hydrates in the Ulleung Basin and implication for geomechanical controls on gas hydrate occurrence. Mar. Petrol. Geol. 2013, 47, 85–98. [Google Scholar] [CrossRef]
- Huh, D.; Lee, J.Y. Overview of gas hydrates R&D. J. Korean Soc. Miner. Energy Resour. Eng. 2017, 54, 201–214. [Google Scholar]
- Boswell, R.; Schoderbek, D.; Collett, T.S.; Ohtsuki, S.; White, M.; Anderson, B.J. The Iġnik Sikumi field experiment, Alaska North Slope: Design, operations, and implications for CO2-CH4 exchange in gas hydrate reservoirs. Energy Fuel. 2017, 31, 140–153. [Google Scholar] [CrossRef]
- Koh, D.Y.; Kang, H.; Lee, J.W.; Park, Y.; Kim, S.J.; Lee, J.; Lee, J.Y.; Lee, H. Energy-efficient natural gas hydrate production using gas exchange. Appl. Energy 2016, 162, 114–130. [Google Scholar] [CrossRef]
- Zhao, J.; Zhu, Z.; Song, Y.; Liu, W.; Zhang, Y.; Wang, D. Analyzing the process of gas production for natural gas hydrate using depressurization. Appl. Energy 2015, 142, 125–134. [Google Scholar] [CrossRef]
- Anderson, B.J.; Kurihara, M.; White, M.D.; Moridis, G.J.; Wilson, S.J.; Pooladi-Darvish, M.; Gaddipati, M.; Masuda, Y.; Collett, T.S.; Hunter, R.B.; et al. Regional long-term production modeling from a single well test, Mount Elbert Gas Hydrate Stratigraphic Test Well, Alaska North Slope. Mar. Petrol. Geol. 2011, 28, 493–501. [Google Scholar] [CrossRef]
- Tang, L.G.; Li, X.S.; Feng, Z.P.; Li, G.; Fan, S.S. Control mechanisms for gas hydrate production by depressurization in different scale hydrate reservoirs. Energy Fuel. 2007, 21, 227–233. [Google Scholar] [CrossRef]
- Lee, M.; Suk, H.; Lee, J.; Lee, J. Quantitative analysis for gas hydrate production by depressurization using X-ray CT. In Proceedings of the 2018 Joint International Conference of the Geological Science & Technology of Korea, KSEEG, Busan, Korea, 17–20 April 2018; p. 363. [Google Scholar]
- Wang, J.; Zhao, J.; Yang, M.; Li, Y.; Liu, W.; Song, Y. Permeability of laboratory-formed porous media containing methane hydrate: Observations using X-ray computed tomography and simulations with pore network models. Fuel 2015, 145, 170–179. [Google Scholar] [CrossRef]
- Mikami, J.; Masuda, Y.; Uchida, T.; Satoh, T.; Takeda, H. Dissociation of natural gas hydrate observed by X-ray CT scanner. Ann. N. Y. Acad. Sci. 2006, 912. [Google Scholar] [CrossRef]
- Kim, S.; Lee, K.; Lee, M.; Ahn, T.; Lee, J.; Suk, H.; Ning, F. Saturation modeling of gas hydrate using machine learning with X-ray CT images. Energies 2020, 13, 5032. [Google Scholar] [CrossRef]
- Alhashem, M. Supervised machine learning in predicting multiphase flow regimes in horizontal pipes. In Proceedings of the Abu Dhabi International Petroleum Exhibition & Conference, Abu Dhabi, UAE, 11–14 November 2019. [Google Scholar] [CrossRef]
- Singh, A.; Ojha, M.; Sain, K. Predicting lithology using neural networks from downhole data of a gas hydrate reservoir in the Krishna-Godavari basin, eastern Indian offshore. Geophys. J. Int. 2020, 220, 1813–1837. [Google Scholar] [CrossRef]
- Kim, S.; Kim, K.H.; Min, B.; Lim, J.; Lee, K. Generation of synthetic density log data using deep learning algorithm at the Golden field in Alberta, Canada. Geofluids 2020, 2020, 5387183. [Google Scholar] [CrossRef]
- Kim, S.; Lee, K.; Lim, J.; Jeong, H.; Min, B. Development of ensemble smoother-neural network and its application to history matching of channelized reservoir. J. Petrol. Sci. Eng. 2020, 191, 107159. [Google Scholar] [CrossRef]
- Kim, S.; Min, B.; Kwon, S.; Chu, M. History matching of a channelized reservoir using a serial denoising autoencoder integrated with ES-MDA. Geofluids 2019, 2019, 3280961. [Google Scholar] [CrossRef]
- Kim, S.; Min, B.; Lee, K.; Jeong, H. Integration of an iterative update of sparse geologic dictionaries with ES-MDA for history matching of channelized reservoir. Geofluids 2018, 2018, 1532868. [Google Scholar] [CrossRef]
- Chen, B.; Harp, D.R.; Lin, Y.; Keating, E.H.; Pawar, R.J. Geologic CO2 sequestration monitoring design: A machine learning and uncertainty quantification based approach. Appl. Energy 2018, 225, 332–345. [Google Scholar] [CrossRef]
- Esmaili, S.; Mohaghegh, S.D. Full field reservoir modeling of shale assets using advanced data-driven analytics. Geosci. Front. 2016, 7, 11–20. [Google Scholar] [CrossRef]
- Lee, K.; Lim, J.; Yoon, D.; Jung, H. Prediction of shale gas production at Duvernay Formation using deep-learning algorithm. SPE J. 2019, 24, 2423–2437. [Google Scholar] [CrossRef]
- Kim, J.; Kim, S.; Park, C.; Lee, K. Construction of prior models for ES-MDA by a deep neural network with a stacked autoencoder for predicting reservoir production. J. Petrol. Sci. Eng. 2020, 187, 106800. [Google Scholar] [CrossRef]
- LeCun, Y.; Bottou, L.; Bengio, Y.; Haffner, P. Gradient-based learning applied to document recognition. Proc. IEEE 1998, 86, 2278–2324. [Google Scholar] [CrossRef]
- Kim, T.; Kim, S.; Lim, J. Modeling and prediction of slug characteristics utilizing data-driven machine-learning methodology. J. Petrol. Sci. Eng. 2020, 195, 107712. [Google Scholar] [CrossRef]
- Such, F.P.; Peri, D.; Brockler, F.; Hutkowski, P.; Ptucha, R.; Alaris, K. Fully convolutional networks for handwriting recognition. In Proceedings of the 2018 16th International Conference on Frontiers in Handwriting Recognition (ICFHR), Niagara Falls, NY, USA, 5–8 August 2018; pp. 86–91. [Google Scholar] [CrossRef]
- Gil, S.M.; Shin, H.J.; Lim, J.S.; Lee, J. Numerical analysis of dissociation behavior at critical gas hydrate saturation using depressurization method. J. Geophys. Res. Sol. Ea. 2019, 124, 1222–1235. [Google Scholar] [CrossRef]
- KIGAM. Gas Hydrate Exploration and Production Study; GP2016-027-2017(2); KIGAM: Daejeon, Korea, 2017; pp. 164–199. [Google Scholar]
- Ta, X.H.; Yun, T.S.; Muhunthan, B.; Kwon, T. Observations of pore-scale growth patterns of carbon dioxide hydrate using X-ray computed microtomography. Geochem. Geophys. Geosyst. 2015, 16, 912–924. [Google Scholar] [CrossRef]
- Waite, W.F.; Santamarina, J.C.; Cortes, D.D.; Dugan, B.; Espinoza, D.N.; Germaine, J.; Jang, J.; Jung, J.W.; Kneafsey, T.J.; Shin, H.; et al. Physical properties of hydrate-bearing sediments. Rev. Geophys. 2009, 47, RG4003. [Google Scholar] [CrossRef]
- LeCun, Y.; Bengio, Y.; Hinton, G. Deep learning. Nature 2015, 521, 436–444. [Google Scholar] [CrossRef] [PubMed]
- Domingos, P. A few useful things to know about machine learning. Commun. ACM 2012, 55, 78–87. [Google Scholar] [CrossRef]
- Kang, B.; Lee, K. Managing Uncertainty in Geological Scenarios Using Machine Learning-Based Classification Model on Production Data. Geofluids 2020, 2020, 8892556. [Google Scholar] [CrossRef]


| Experimental Stage | SW (Density, g/cc) | SGH (Density, g/cc) | SG (Density, g/cc) |
|---|---|---|---|
| “IWS” (14.7 psi, 18 °C) | SW,IWS (dW,IWS = 1) | SGH,IWS = 0 | 1 − SW,IWS (dG,IWS = 0.000678) |
| “GH” (2500 psi, 16 °C) | SW,GH = 0 | SGH,GH (dGH,GH = 0.91) | 1 − SGH,GH (dG,GH = 0.143) |
| “GTW” (2900 psi, 16 °C) | SW,GTW (dW,GTW = 1.008) | SGH,GTW = SGH,GH | 1 − SW,GTW − SGH,GTW (dG,GTW = 0.167) |

| Method | List | Case 1 | Case 2 | Case 3 | Case 4 |
|---|---|---|---|---|---|
| Number of data | Entire data | 2560 | 960 | 1600 | 1280 |
| Training data | 2304 | 864 | 1440 | 1152 | |
| Test data (10% of the entire data) | 256 | 96 | 160 | 128 | |
| Training condition of RF | Maximum depth | 10 | |||
| Number of trees | 200 | ||||
| Number of properties | 219 | ||||
| Data size of one sample | 47,996 | ||||
| Training | Random 10% Test | Universal Test | |||||||||
|---|---|---|---|---|---|---|---|---|---|---|---|
| Sw | SGH | SG | Sw | SGH | SG | Sw | SGH | SG | |||
| Case 1: 8 total | 9 | 7 | 0.8 | 61 | 52 | 4 | 61 | 52 | 4 | ||
| Case 2: 3 low SGH | 5.6 | 4.8 | 5.5 | 41 | 29 | 4 | 170 | 143 | 5.5 | ||
| Case 3: 5 high SGH | 8 | 7 | 0.5 | 38 | 38 | 1.8 | 100 | 71 | 8 | ||
| Case 4: 2 + 2 SGH | 9.6 | 8.6 | 0.6 | 75 | 71 | 3.7 | 49 | 44 | 1.6 | ||
| Average of SW, SGH, and SG | |||||||||||
| Case 1: 8 total | 5.6 | 39 | |||||||||
| Case 2: 3 low SGH | 5.3 | 24.7 | 106.2 | ||||||||
| Case 3: 5 high SGH | 5.2 | 25.9 | 60.0 | ||||||||
| Case 4: 2 + 2 SGH | 6.3 | 49.9 | 31.5 | ||||||||
Publisher’s Note: MDPI stays neutral with regard to jurisdictional claims in published maps and institutional affiliations. |
© 2020 by the authors. Licensee MDPI, Basel, Switzerland. This article is an open access article distributed under the terms and conditions of the Creative Commons Attribution (CC BY) license (http://creativecommons.org/licenses/by/4.0/).
Share and Cite
Kim, S.; Lee, K.; Lee, M.; Ahn, T. Data-Driven Three-Phase Saturation Identification from X-ray CT Images with Critical Gas Hydrate Saturation. Energies 2020, 13, 5844. https://doi.org/10.3390/en13215844
Kim S, Lee K, Lee M, Ahn T. Data-Driven Three-Phase Saturation Identification from X-ray CT Images with Critical Gas Hydrate Saturation. Energies. 2020; 13(21):5844. https://doi.org/10.3390/en13215844
Chicago/Turabian StyleKim, Sungil, Kyungbook Lee, Minhui Lee, and Taewoong Ahn. 2020. "Data-Driven Three-Phase Saturation Identification from X-ray CT Images with Critical Gas Hydrate Saturation" Energies 13, no. 21: 5844. https://doi.org/10.3390/en13215844
APA StyleKim, S., Lee, K., Lee, M., & Ahn, T. (2020). Data-Driven Three-Phase Saturation Identification from X-ray CT Images with Critical Gas Hydrate Saturation. Energies, 13(21), 5844. https://doi.org/10.3390/en13215844