Article

Field Test of Wind Power Output Fluctuation Control Using an Energy Storage System on Jeju Island

1
Electric Energy Research Center, Jeju National University, Jejudaehakno 102, Jeju-si 63243, Korea
2
Department of Mechatronics Engineering, Jeju National University, Jejudaehakno 102, Jeju-si 63243, Korea
3
Department of Electrical Engineering, Jeju National University Jejudaehakno 102, Jeju-si 63243, Korea
*
Author to whom correspondence should be addressed.
Energies 2020, 13(21), 5760; https://doi.org/10.3390/en13215760
Submission received: 23 September 2020 / Revised: 27 October 2020 / Accepted: 2 November 2020 / Published: 3 November 2020
(This article belongs to the Special Issue Smart Distribution Grid Technologies and Applications)

Abstract

:
At present, renewable energy installations are expanding to solve both environmental problems and expensive energy fuel import prices in isolated areas. However, in a small-scale power system, rapid output fluctuations of renewable energy may cause power quality problems such as voltage and frequency fluctuations in the power system. To solve this problem, the local government of Jeju Island in South Korea implemented a megawatt (MW)-class pilot project to stabilize the output power of wind turbines using an energy storage system (ESS). In this project, a 0.5 MWh lithium-ion battery was connected to a 3 MW wind turbine via 1 MW power conversion system (PCS). In this paper, the field test results were divided into four categories as follows. First, the performance of stabilizing the output of the wind turbine using ESS was confirmed. Second, the control performance of the ESS was confirmed when the wind turbine suddenly stopped due to an accident. Third, it was confirmed that the ESS discharged energy into the power system after the stabilization of the wind turbine output. Fourth, the reasons for the failure of the ESS to control output stabilization of the wind turbine were analyzed through MATLAB simulation.

1. Introduction

In order to solve fossil fuel-related problems such as environmental pollution and energy security, renewable energy is being widely installed worldwide. However, output fluctuations due to intermittent output characteristics of renewable energy can cause voltage and frequency changes in power systems. In particular, if an output fluctuation slope is higher than the acceleration and deceleration abilities of the power source based on the rotor, it becomes a big risk factor. The smaller the power system, the more likely it is to act as an instability factor. Therefore, a small power system such as a microgrid needs to be prepared [1,2,3,4].
Jeju Island is South Korea’s largest island and is located on the south side of the Korean Peninsula. The maximum and average power loads of the Jeju power system in 2019 were recorded as 966 and 613 MW, respectively. As shown in Figure 1, the power system is composed of thermal power plants and two unidirectional high voltage direct current transmission systems (HVDCs) connected to the mainland power system. Jeju Island has an active policy of “Carbon-Free Island Jeju by 2030” [5]. From this policy, 624 MW of new and renewable energy was installed, and 20,105 electric vehicles, the most popular in South Korea, were supplied in 2019. Although Jeju Island is where most renewable energy resources have been installed in Korea, it faces system stability issues.
In fact, the power quality deterioration due to fluctuations in wind power output is also mentioned in “Power quality aspects in a wind power plant” from the National Renewable Energy Laboratory [6]. Especially, the issue of output fluctuations of wind power generators in the Jeju power system has been raised in “Analysis of power quality on wind power fluctuation during HVDC overhaul period in Jeju island power system” [7]. Additionally, the rapid increase in electric vehicles mentioned above may increase the maximum load of the Jeju system, and this problem can be confirmed in “Impact of electric vehicle charging demand on a Jeju Island radial distribution network” [8]. To solve these two problems at the same time, the local government of Jeju Island plans to use an energy storage system (ESS) to mitigate fluctuations in wind power output and at the same time discharge the energy stored in the battery at the maximum load time to help Jeju power system operation. Additionally, the central government of the Republic of Korea provides economic benefits through the renewable energy portfolio standard (RPS) system when an ESS linked to a wind turbine discharges energy stored at the maximum load time. Therefore, through this field test, a technical review was conducted to see if the ESS could perform wind power output stabilization control and whether the wind power operators could obtain economic benefits by discharging the energy stored in the battery during the maximum load time.
From this point, the local government of Jeju Island installed a 0.5 MWh ESS on 3 MW of wind turbines and conducted a pilot project on the suppression of fluctuations in the wind power output. In the case of the Type 3 and 4 wind turbines, these may possibly have limited control of the wind power output fluctuation [9,10,11]. However, since many wind turbines including Type 2 were installed in Jeju Island, only the wind power output fluctuation suppression control using an ESS was performed. The hardware for the demonstration test consists of a 3 MW wind turbine, 1 MW power conversion system (PCS), and a 0.5 MWh battery with a maximum C-rate of 2C. The software includes an energy management system (EMS) with wind power output stabilization control and a battery management system (BMS) with battery fault signals and state-of-charge (SOC) information. This paper analyzed the field test results with the focus on the following items:
  • Performance of stabilizing the output of the wind turbine using ESS;
  • Operation of the ESS when the wind turbine suddenly stopped due to an accident;
  • Reaching the target SOC while performing wind power output stabilization control and discharging the energy stored in the battery, at the time of peak load in the Jeju Island power system;
  • Simulation analysis of the failure to control the stabilization of wind power output.
In this paper, the pilot project results and problems are described and verified through a MATLAB simulation. These field test results will help small-scale power system operators and researchers consider the stabilization of MW class wind turbine outputs using an ESS.

2. Control Theory

There are three representative methods of wind power output stabilization controls as shown in Figure 2. First, smoothing control is a method used to extract the high-frequency component from the wind power output before canceling it and supplying the opposite power via ESS. Second, ramp-rate control is a method used to limit the slope of the wind power output. Third, firming control is used to make the wind power output constant or stepped [12,13,14,15,16,17,18,19,20,21,22,23]. In a small-scale power system, such as the Jeju power system, when the rapid output change of wind power is faster than the output acceleration and deceleration rate of a rotor-based power source, it may cause voltage or frequency variances in the power system. Therefore, in this project, the slope of the output fluctuation was limited during ramp-rate control of the ESS. Equations (1)–(6) represent the ramp-rate control method [24]. First, the output slope limitations per minute are set and the maximum output fluctuation value per sampling time is calculated in Equation (1).
R = ( L / 100 ) × C w × ( t s / 60 )
Second, the target of the total output, which is the sum of wind power generation output and ESS, should be obtained. The total output target value is determined in Equation (2) and depends on the sign of the total output slope and the current output variance per sampling time.
T ( i ) = {   T ( i 1 ) + D ( i ) × w     i f   D ( i ) > 0 , R > D ( i )   T ( i 1 ) + R × w           i f   D ( i ) > 0 , R < D ( i ) T ( i 1 ) + D ( i ) × w   i f   D ( i ) 0 , R D ( i ) T ( i 1 ) R × w         i f   D ( i ) 0 , R D ( i )
D ( i ) = P w ( i ) T ( i 1 )
Third, the weight factor should be calculated according to the SOC value. The weight factor w controls the fluctuation of the wind power output and reaches the target SOC of the battery. When the wind power output stabilization control repeats charging and discharging, the SOC target value can be reached by adjusting w according to the situation as shown in Equation (4).
w = {   1     i f   D ( i ) > 0 , S O C ( i ) S O C t   v     i f   D ( i ) > 0 , S O C ( i ) < S O C t 1     i f   D ( i ) 0 , S O C ( i ) < S O C t v     i f   D ( i ) 0 , S O C ( i ) S O C t
Through this process, the output power of the ESS and the total output power are determined through Equations (5) and (6), respectively.
P E ( i + 1 ) = { C e   i f   P E ( i + 1 ) > C e T ( i ) P w ( i )   C e   i f   P E ( i + 1 ) < C e     0   i f   P E ( i + 1 ) > 0 ,   S O C ( i ) S O C l     0   i f   P E ( i + 1 ) < 0 ,   S O C ( i ) S O C u
P t ( i + 1 ) = P E ( i + 1 ) + P w ( i + 1 )
It should be noted that in Equations (5) and (6), the output of ESS is calculated from the total output target value and the wind power output measured at the previous sampling time. Such a time delay may cause a control error. This point is further demonstrated in Section 4 through simulation and actual data results. The SOC required for calculating the weight factor is calculated in Equation (7). In the field test, the BMS sends it to the EMS.
S O C ( i + 1 ) = S O C ( i ) ( P E ( i + 1 ) / ( 3600 t s ) ) / C b
Equation (7) shows the SOC calculated through the output of the ESS. Equation (8) shows a method for calculating the fluctuation rate per minute to evaluate the results of the wind power output control. It is calculated by shifting the sampling time unit so that it is not affected by measurement timing.
f ( i ) = { ( max ( P t ( i 60 t s : i ) ) min ( P t ( i 60 t s : i ) ) } × 100 / C w
Table 1 shows the parameters applied to the field test, which were used in Equations (1)–(8).

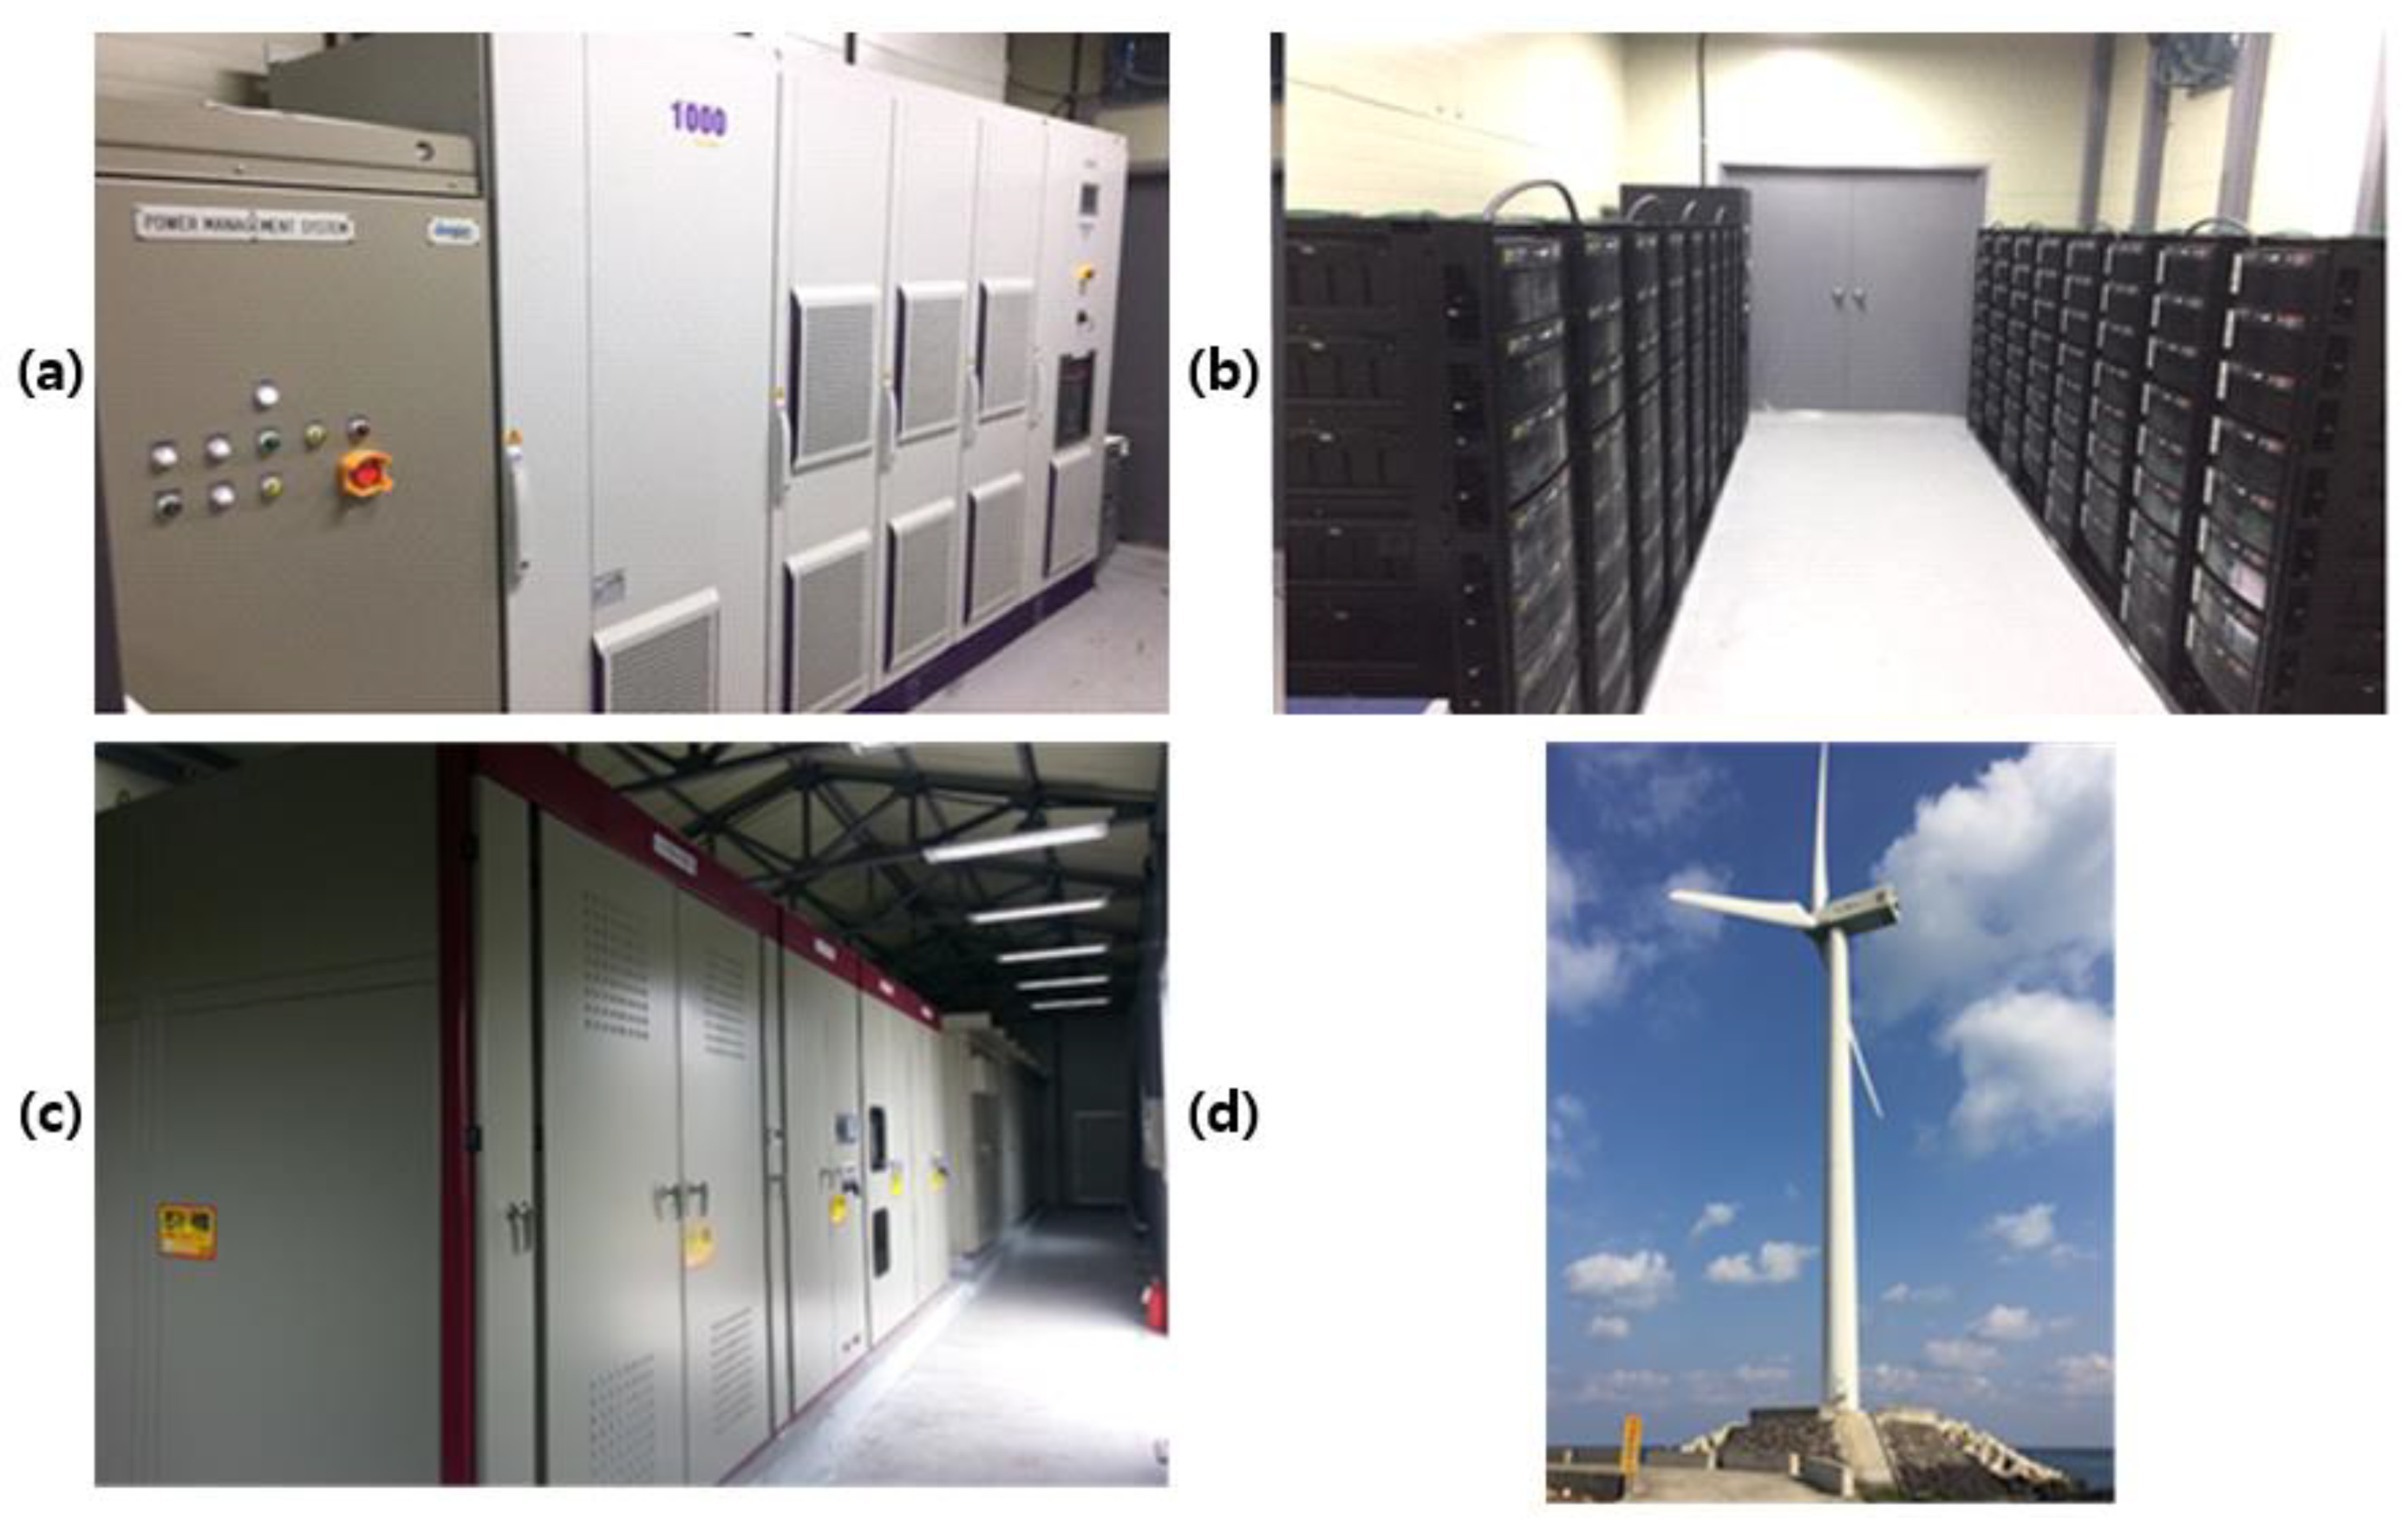
3. Configuration of Pilot Project

Figure 3 shows the schematics of the pilot project. The information on the red line is sent as the input of the EMS. The EMS calculates Equations (1)–(5) and delivers the power command value to the PCS of the battery at each sampling time. Figure 4 shows pictures of the actual facilities that are diagrammed in Figure 3.
The field test results are presented through four cases. First, we verified the effectiveness of fluctuation control using ESS. Second, we checked the control performance of the ESS when the wind turbine suddenly stopped. Third, we performed a test to control the output of the wind power generator, which discharged the energy stored in the battery at the maximum load time of the Jeju power system. Fourth, in the pilot project, we confirmed the limitation of the wind power generator’s output stabilization control through ESS, the cause of which was analyzed through simulation.

4. Results of Pilot Project

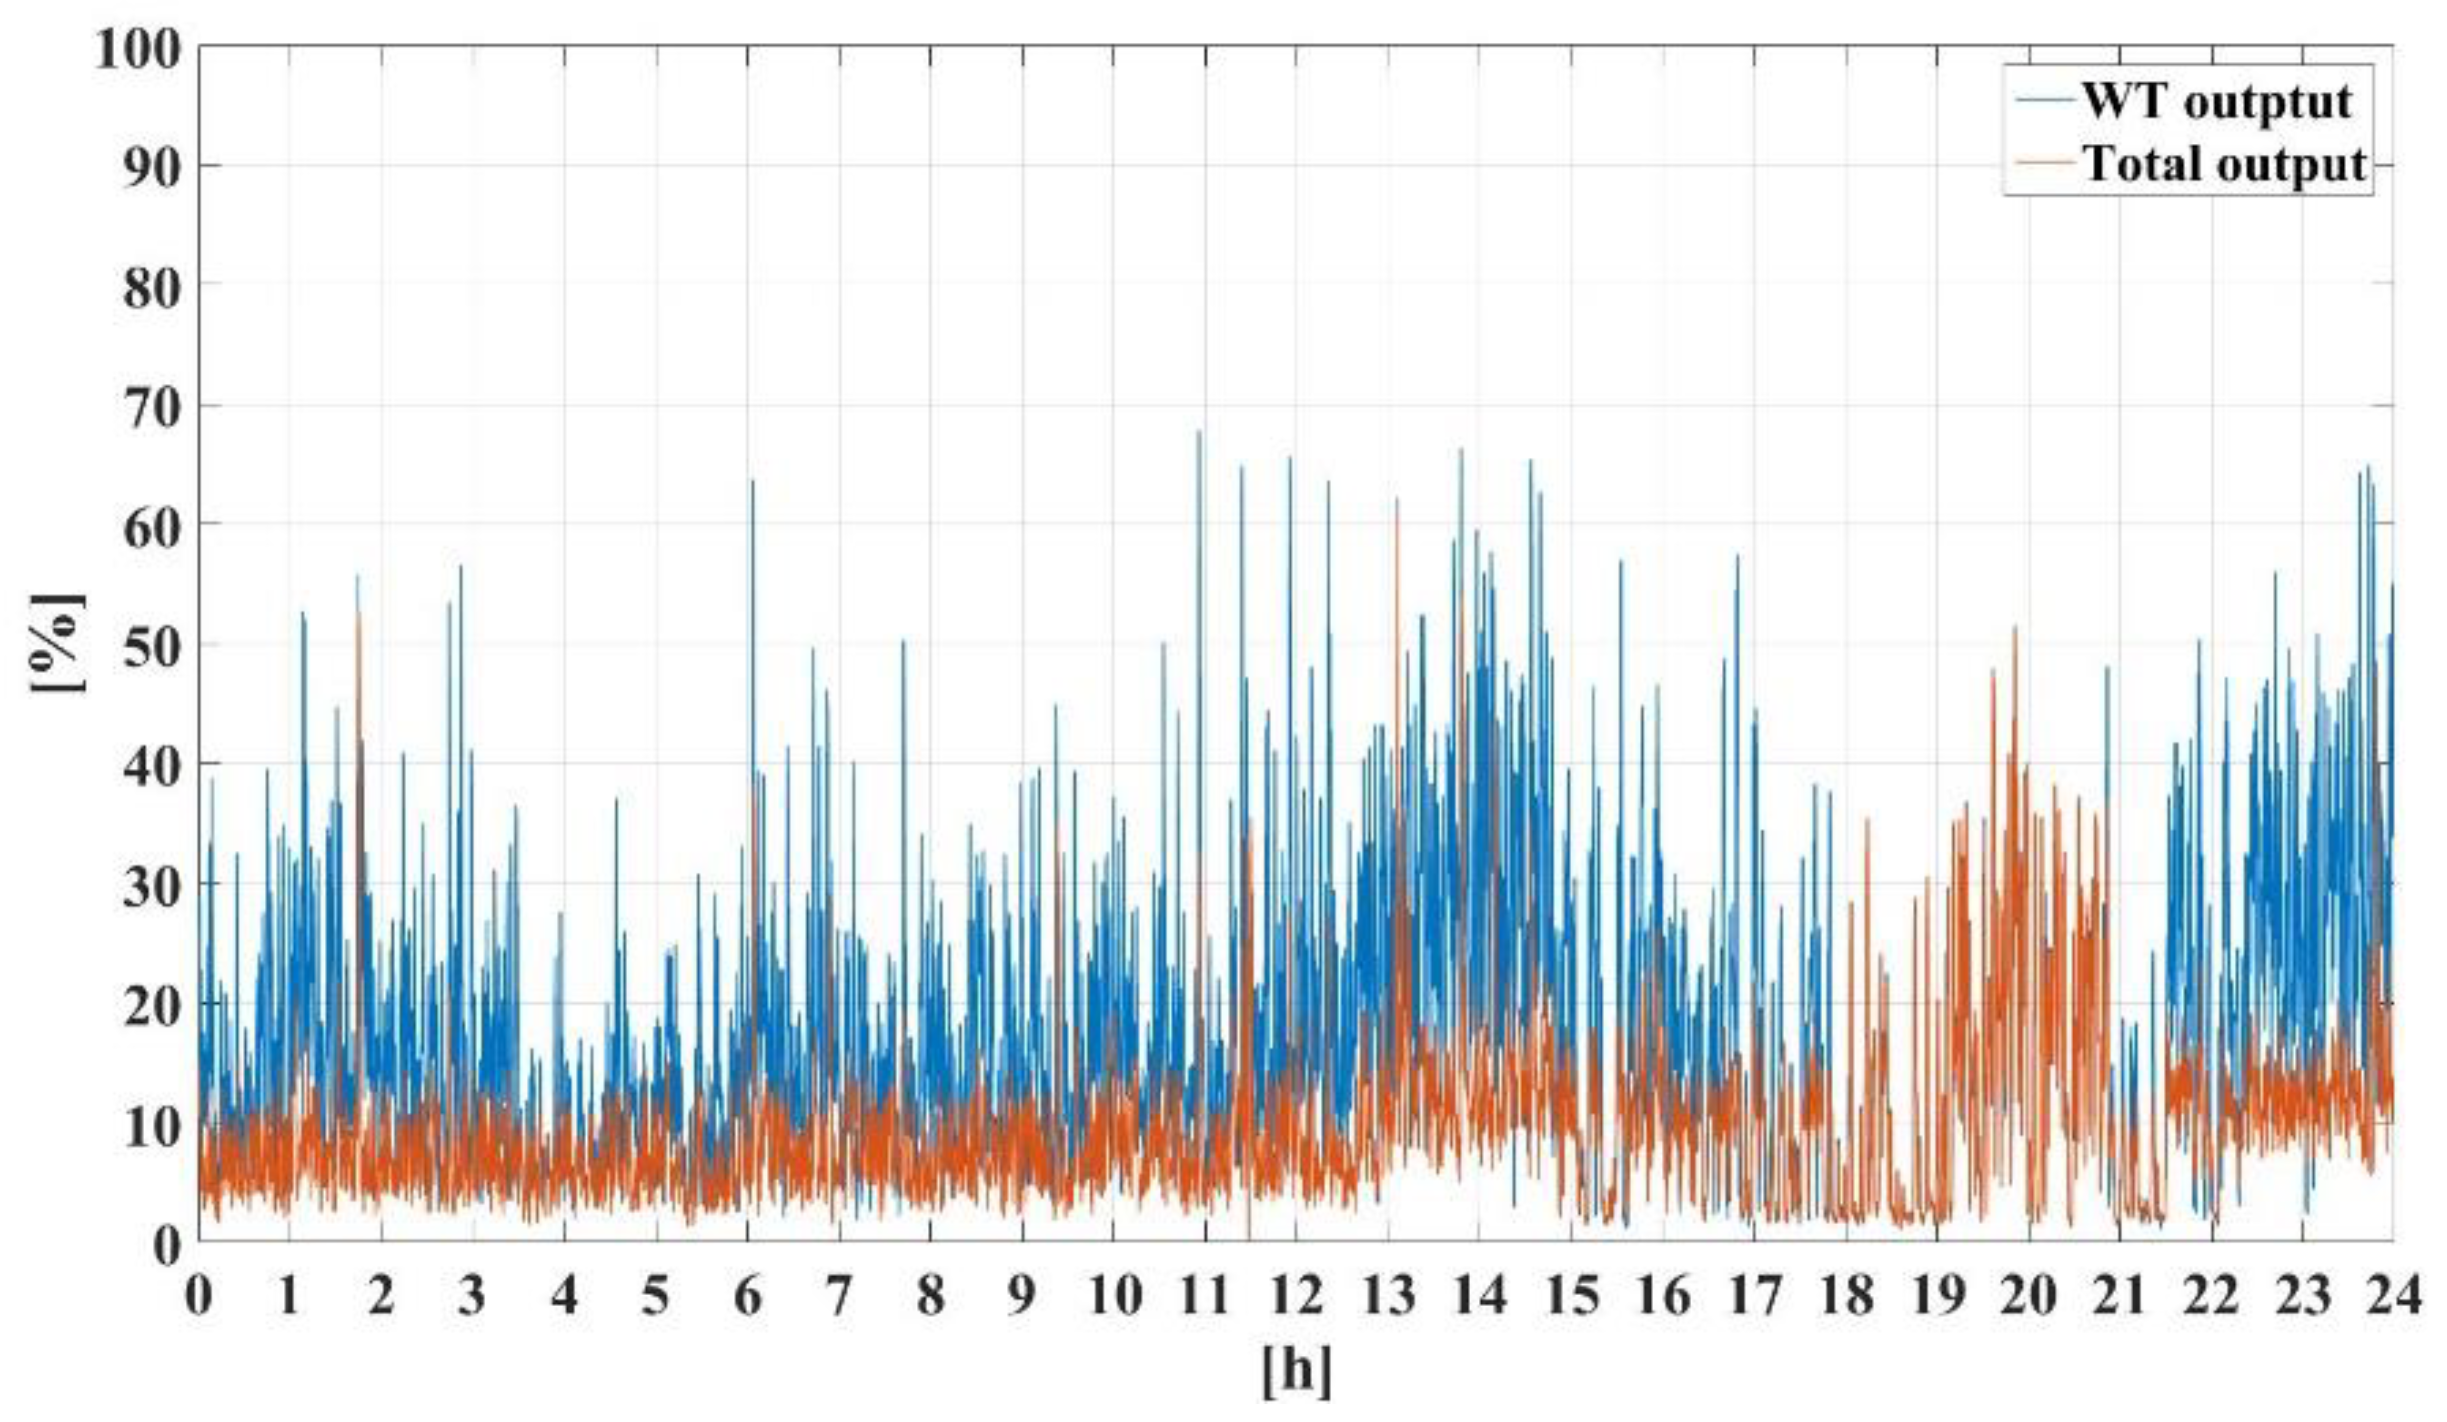
4.1. Operation of Ramp-Rate Control in Normal State

In Figure 5, the blue line represents the wind power generator output, and the orange line represents the total output of the wind power generator and ESS. We confirmed that the output fluctuation was less than the wind power generator. Figure 6 is an enlarged graph of Figure 5 that shows how the maximum slope of the total output maintained a constant value. Figure 7 shows the fluctuation rate per minute between the wind turbine output and total output. Excluding ESS, the output of the wind turbines recorded a maximum change rate of 68.4% per minute and an average of 11.2%. The maximum and average fluctuation rate per minute of the total output were calculated as 32.1% and 6.3%, respectively. The average fluctuation rate per minute was reliably improved to 4.9%. However, 23.2% of the output fluctuation exceeded the target value of 10%. The reasons that the fluctuation rate per minute was not improved were due to the control delay of about 0.5 s from the communication delay and insufficient PCS capacity. Figure 8 and Figure 9 show a histogram drawn by dividing the graph of fluctuation rate per minute in Figure 7 into positive and negative slopes. When comparing these two graphs, it can be seen that the distribution of the histogram centralized after ESS control.
Figure 10 shows the ESS output. It should be noted that 5.4% of the total data occurred when the ESS output was the same as the PCS-rated capacity, which insufficiently controlled the output fluctuation of the wind turbine. This was verified through simulation (see Section 4.4). Figure 11 shows the SOC of a 0.5 MWh lithium-ion battery, proving that the battery could be charged to the target value while performing ramp-rate control.

4.2. Operation of Ramp-Rate Control When the Wind Turbine Suddenly Stops

Figure 12 shows the operation of the ESS when the wind turbine output suddenly stops. Even though the wind power generator output sharply decreased, the total output decreased while maintaining a constant slope due to the ESS discharge. Figure 13 shows the fluctuation rate per minute for the output given in Figure 12. When the wind turbine stopped, the fluctuation rate per minute increased to about 32.3%, but the fluctuation rate per minute for the total output was maintained within 10% due to the operation of the ESS. Figure 14 shows the ESS output. It can be seen that the output compensation was performed up to the PCS-rated capacity when the wind turbine stopped. Then the discharge output was reduced with a certain slope. Figure 15 shows the SOC following the ESS output given in Figure 14.

4.3. Discharging the Energy in Daily Peak Demand Time

While performing output stabilization control of the wind power generator, the EMS was configured and tested to discharge stored energy during the maximum load time of the Jeju system. Figure 16 shows the result of the field test, indicating that the offset occurred in the total output from 18:00 to 21:00, which is the maximum load time of the Jeju system. Figure 17 shows the fluctuation rate per minute in the output graph of Figure 16. As shown in the figure, at the Jeju power system’s maximum load time, the fluctuation rate per minute for the total output and wind power output was the same. For the other time, the fluctuation rate per minute was reduced through ESS control. The ESS discharged all stored energy, thus contributing to the Jeju power system’s maximum load time. Figure 18 shows the ESS output. Since the ESS of 0.5 MWh applied with 70% depth-of-discharge (DOD), we confirmed that 117 kW was discharged per hour. Figure 19 shows the SOC curve for the ESS output. Since the SOC was charged to the target value at the same time as the wind power output ramp-rate control, the SOC reached the target value of 90% before the maximum load time. Then, during the maximum load time, the ESS was discharged until the lower limit value reached 20%. After the maximum load time, the ramp-rate control was performed again to reach the SOC target value of 90%.

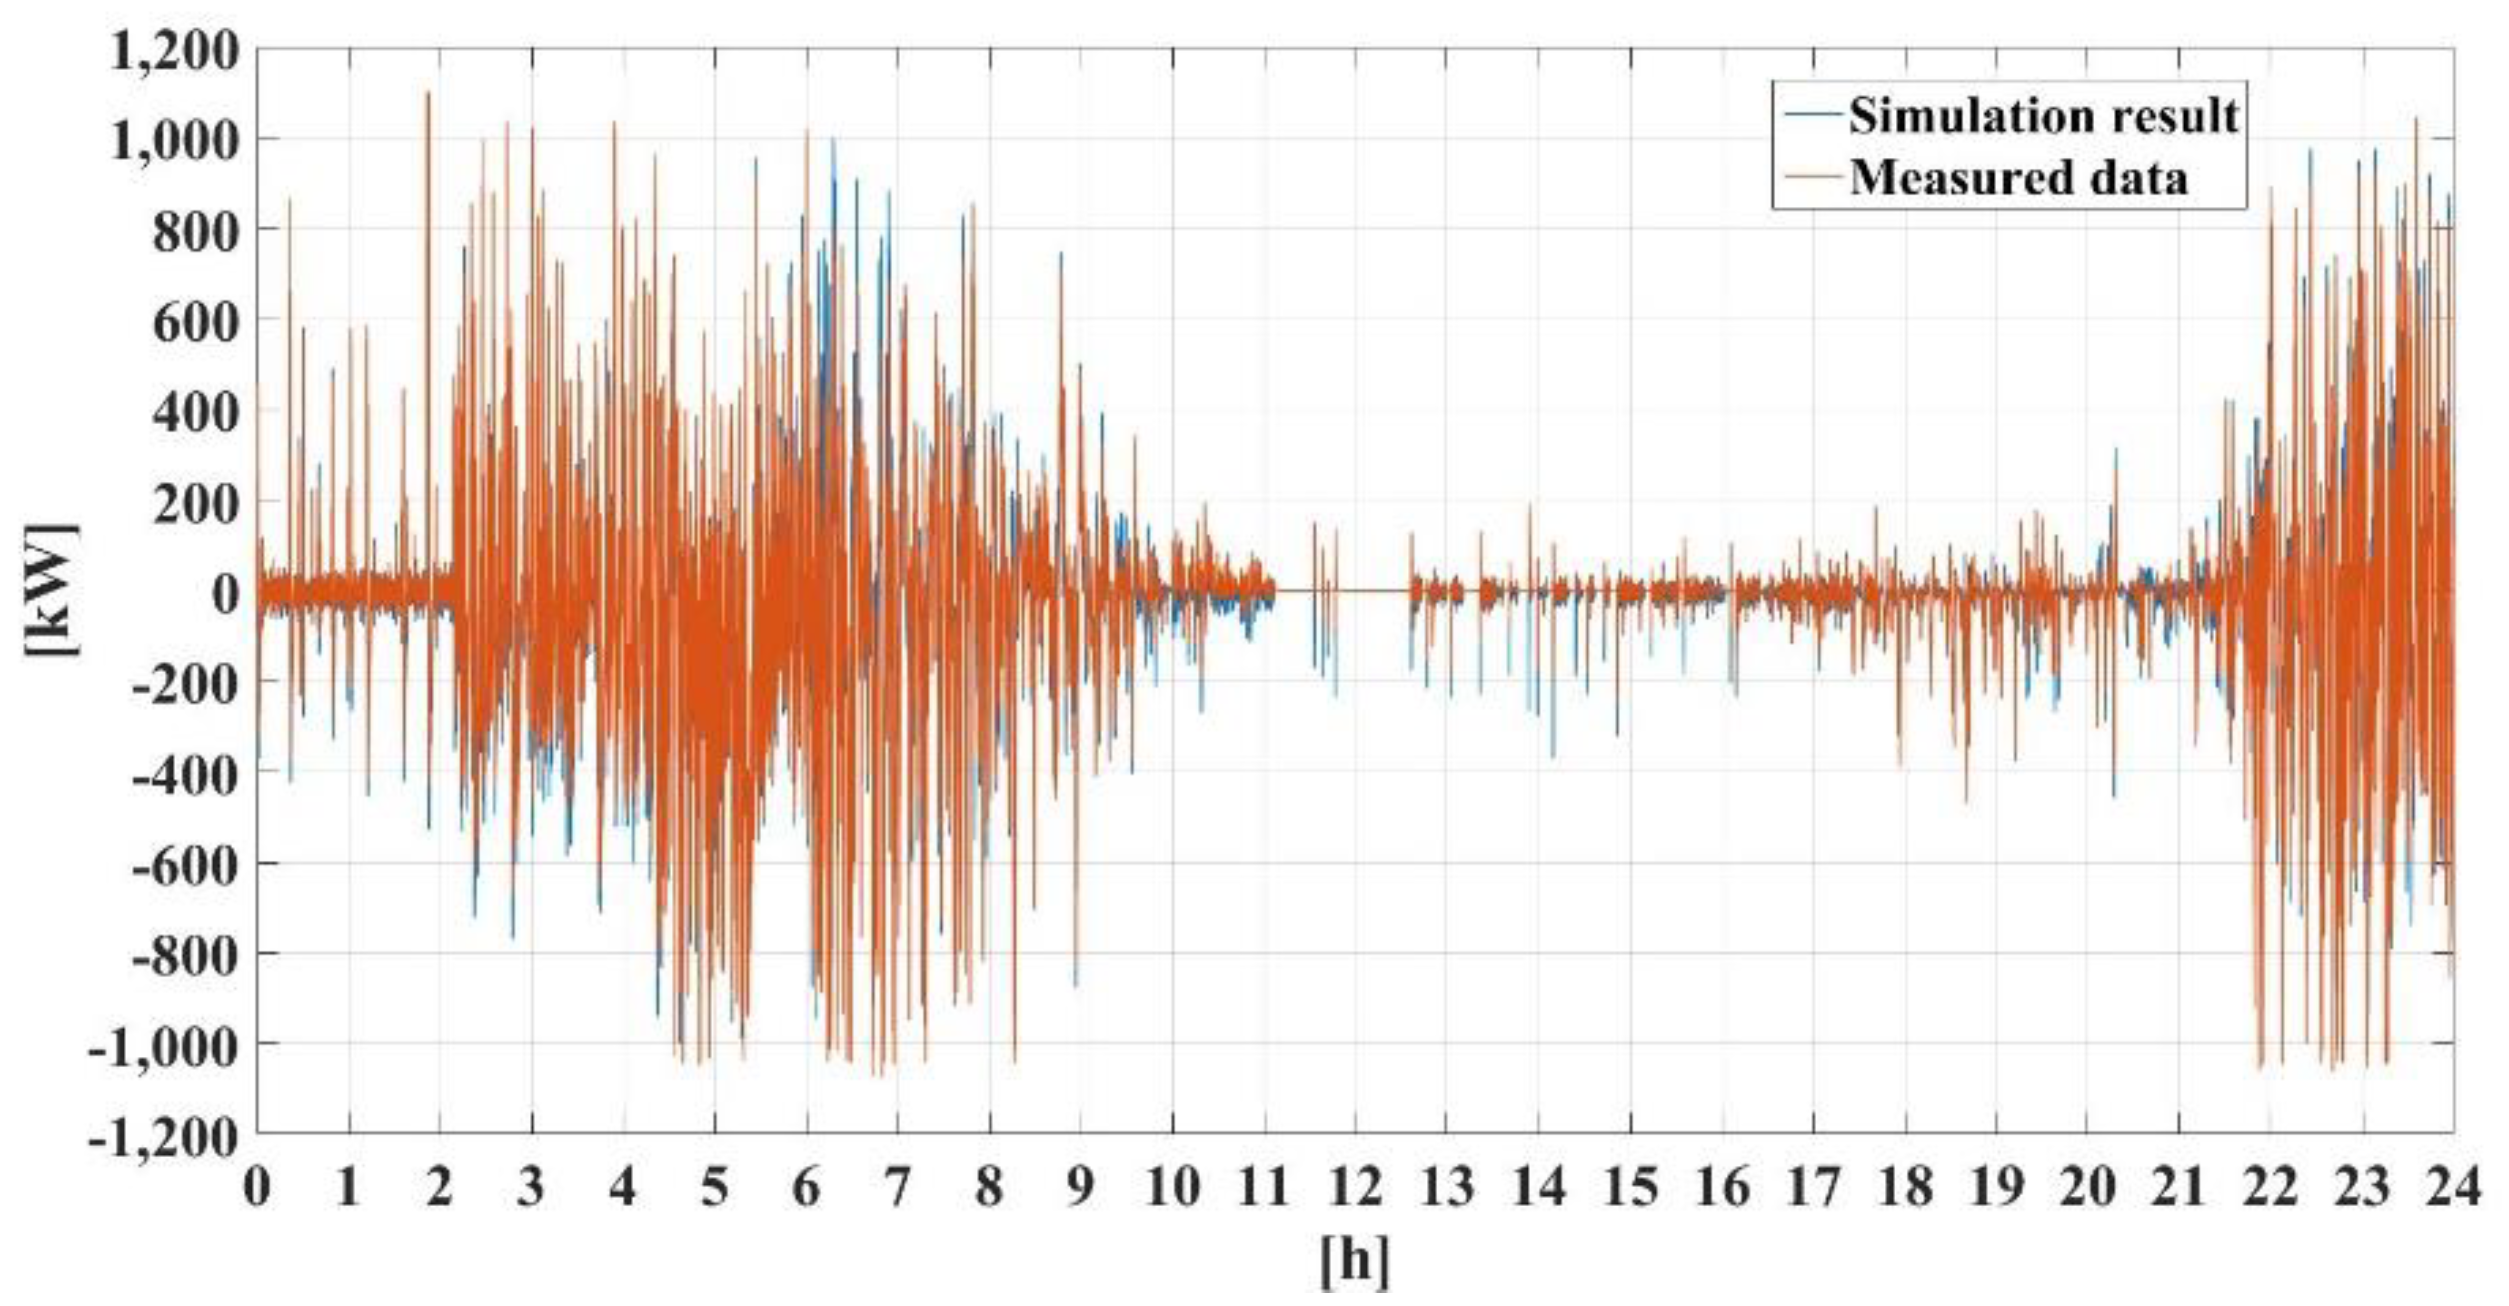
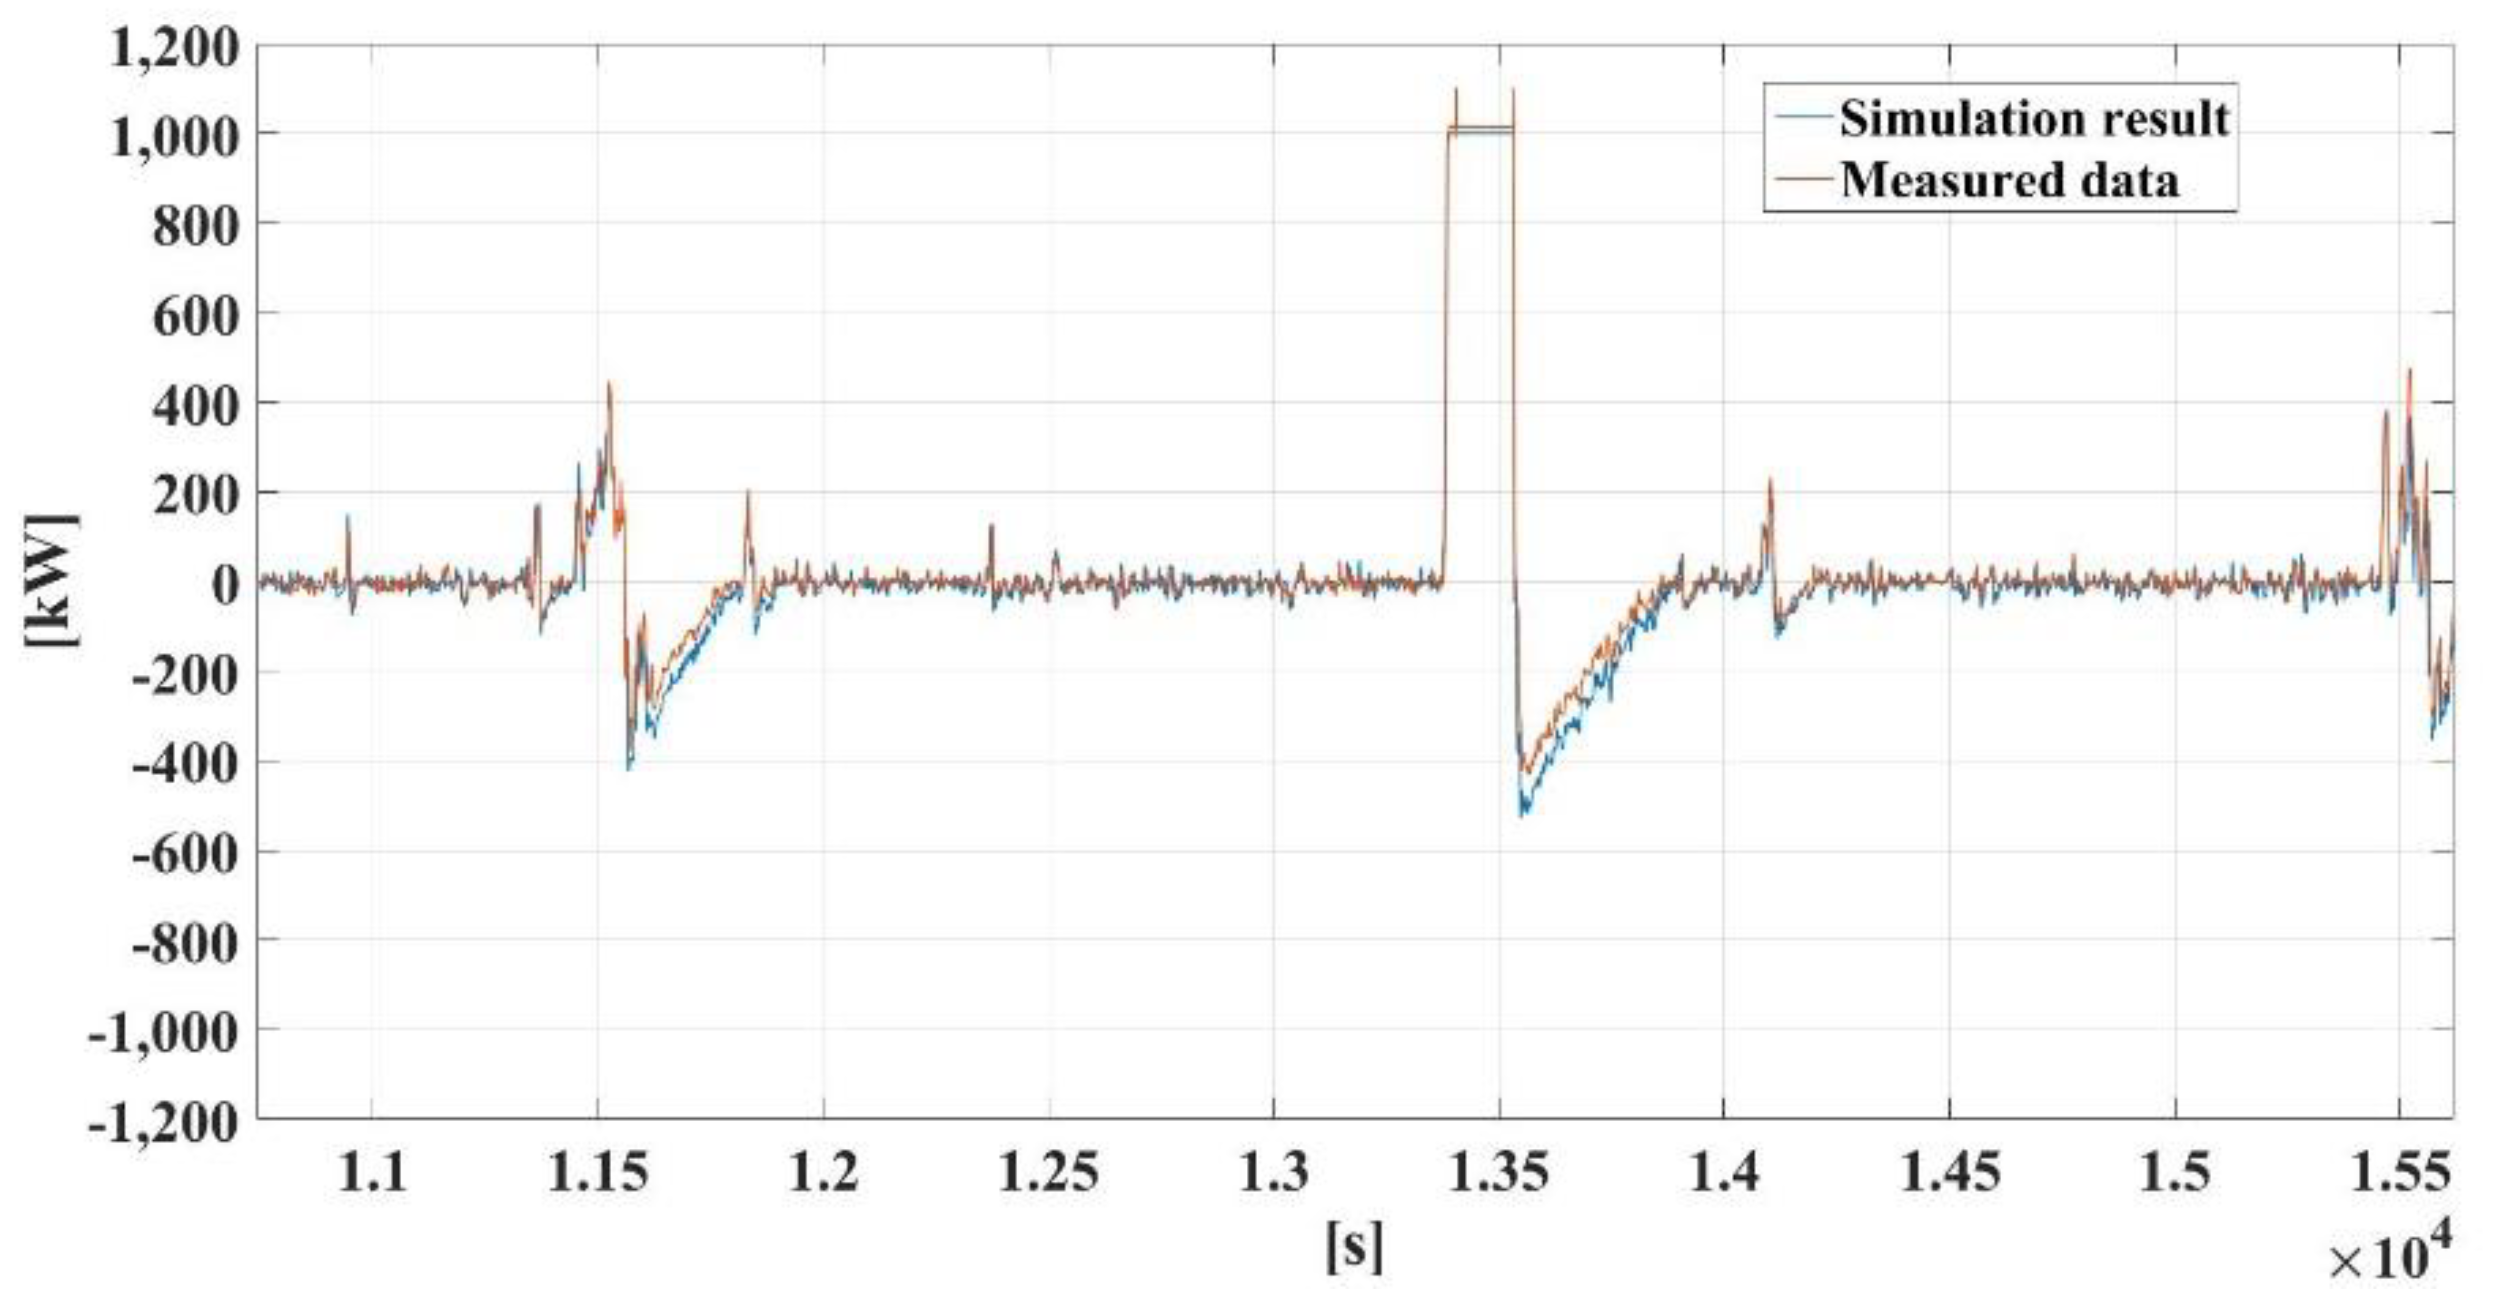
4.4. Simulation and Discussion

Computer analysis was performed with the MATLAB program to analyze the reason why the ESS did not fully compensate for the wind power output. Figure 20 shows the flow chart for the implementation of MATLAB simulation. The simulation used only the measured wind power output and was calculated using the equations defined in Section 2. The simulation proceeded as follows. First, the reliability was confirmed by performing a simulation using the same parameters as in reality. Second, by comparing the simulation results with the actual output data, errors and similarities were confirmed. Third, the results were verified by rerunning the simulation that corrected the time delay factor and the PCS capacity limit. Figure 21 is the result of comparing the measured total output shown in Figure 6 with the simulation result. The yellow line in Figure 21 represents the error between the simulation and the measured data; the maximum error of 596 kW and the average −2.6 kW were recorded. It was confirmed that an error occurred because the time delay was not exactly 0.5 s. Figure 22 presents a comparison between the actual ESS output and the simulation result. Figure 23 and Figure 24 show enlarged segments of Figure 22, and the simulation results derived were similar to field test data, even with a sudden discharge and continuous control.
Based on the results of the simulation’s similarity to the measurement data, we verified the PCS capacity and time delay. The modified simulation model was carried out assuming that the PCS capacity was unlimited and that there was no time delay. Figure 25 shows the ESS output of the simulation result. As described above, we confirmed that the PCS output reached the minimum of −1741 kW. Figure 26 shows the fluctuation rate per minute of the modified computer analysis results. It can be seen that the target value of 10% or less was achieved in all results.

5. Conclusion

In this paper, an analysis was performed on a field test that suppressed wind power output fluctuations using an ESS. Even in MW-class wind turbines, it was possible to control output fluctuations through an ESS based on lithium-ion batteries with fast responses. Therefore, the average fluctuation rate per minute improved from 11.2% to 6.3% after ESS installation, and it was confirmed that the ESS reliably compensated even when the wind turbine suddenly stopped. In addition, it was proven that the lithium-ion battery could reach SOC while performing the output fluctuation control of the wind turbine through the ramp-rate control of the set EMS. This is important because it contributed to a stable power supply by discharging stored energy at the maximum load time. However, it was confirmed that complete control was not possible due to the limitation of the installed PCS capacity; many cases were not satisfied with the target rate of change per minute due to communication and control operation time delays. These problems were verified through MATLAB simulation and can be solved by increasing PCS capacity, shortening time delay, and setting conservative control target values. As a result of the field test in terms of hardware, the capacity of the PCS was more important than the capacity of the lithium-ion battery in controlling the stabilization of the wind power output, and this would require more than 58% of the wind turbine capacity. However, since the lithium-ion battery has a limit that can be output according to the C-rate, it will be necessary to calculate the capacity of the battery in consideration of the PCS capacity and the C-rate. Regardless of the PCS capacity, the battery capacity was also an important factor in the amount of energy discharged from the battery at the maximum load time, which could bring economic benefits to wind turbine operators in Korea. Analysis of these field results will help small power systems consider renewable energy installation and control.

Author Contributions

S.H.C. performed the modeling, analysis, and writing. C.U.K. provided the conceptualization, methodology, validation, and editing. E.-H.K. provided supervision, project administration, and reviewing. All authors have read and agreed to the published version of the manuscript.

Funding

This research was funded by Korea Institute of Energy Technology Evaluation and Planning (KETEP) and Jeju National University.

Acknowledgments

This research was supported by the 2020 scientific promotion program funded by Jeju National University and the Korea Institute of Energy Technology Evaluation and Planning(KETEP), and the Ministry of Trade, Industry, and Energy (MOTIE) of the Republic of Korea (No. 20194030202310).

Conflicts of Interest

The authors declare no conflict of interest.

Abbreviations

The following abbreviations are used in this manuscript:
HVDCHigh voltage direct current transmission system
ESSEnergy storage system
RPSRenewable energy portfolio standard
SOCState-of-charge
PCSPower conversion system
BMSBattery management system
EMSEnergy management system
DODDepth-of-discharge
ACAlternative current
DCDirect current
R Limited wind power variation per sampling time (kW)
L Limited fluctuation rate per minute (%)
C w Wind turbine or farm capacity (kW)
t s Sampling time (s)
T ( ) Total output target value (kW)
D ( ) Difference between the wind power output and the previous total output target value (kW)
P w ( ) Wind power output (kW)
w Weight factor
i Discrete time signal (1, 2, 3 …)
v Set value (< 1)
S O C t SOC target value (per unit)
P E ( ) Output of the ESS (kW)
C e PCS capacity of the ESS (kW)
S O C l Lower limit value of SOC (per unit)
S O C u Upper limit value of SOC (per unit)
P t ( ) Total output of wind power and ESS (kW)
C b Capacity of the battery (kWh)
f ( ) Fluctuation rate per minute of the total output (%)
max()Maximum value operator
min()Minimum value operator

References

  1. Li, X.; Song, Y.-J.; Han, S.-B. Study on Power Quality Control in Multiple Renewable Energy Hybrid MicroGrid System. In Proceedings of the 2007 IEEE Lausanne Power Tech, Lausanne, Switzerland, 1–5 July 2007. [Google Scholar]
  2. Lin, J.; Sun, Y.Z.; Sørensen, P.; Li, G.J.; Li, X. Frequency Modeling of Wind Power Fluctuation and the Application on Power Systems. In Proceedings of the International Conference on Power System Technology, Hangzhou, China, 24–28 October 2010; pp. 1–8. [Google Scholar]
  3. Guo, P.; Chen, S.; Chu, J.; Infield, D. Wind direction fluctuation analysis for wind turbines. Renew. Energy 2020, 162, 1026–1035. [Google Scholar] [CrossRef]
  4. Zhang, E.; Huang, W.; Tai, N.; Chen, Z.; Ruan, W. A coordination strategy to smooth fluctuation of distributed renewable energy in combined heat and power community microgrids. In Proceedings of the 8th Renewable Power Generation Conference (RPG 2019), Shanghai, China, 24–25 October 2019. [Google Scholar]
  5. Jeju Special Self-Governing Province Local Government. Carbon Free Island Jeju by 2030; Jeju Special Self-Governing Province Local Government: Jeju Special Self-Governing Province, Korea, 2012. Available online: http://www.investkorea.org/jeju_en/about/cfi2030.do (accessed on 20 August 2020).
  6. Muljadi, E.; Butterfield, C.P.; Chacon, J.; Romanowitz, H. Power quality aspects in a wind power plant. In Proceedings of the 2006 IEEE Power Engineering Society General Meeting, Montreal, QC, Canada, 18–22 June 2006. [Google Scholar]
  7. Kim, J.H.; Van-Hoan, P.; Kim, E.H.; Kim, S.H.; Oh, S.B.; Young-Hwan, K.; Jang, G.S. Analysis of power quality on wind power fluctuation during HVDC overhaul period in Jeju island power system. In Proceedings of the 2009 IEEE 6th International Power Electronics and Motion Control Conference, Wuhan, China, 17–20 May 2009. [Google Scholar]
  8. Chang, M.; Bae, S.; Yoon, G.; Park, S.; Choy, Y. Impact of Electric Vehicle Charging Demand on a Jeju Island Radial Distribution Network. In Proceedings of the 2019 IEEE Power & Energy Society Innovative Smart Grid Technologies Conference (ISGT), Washington, DC, USA, 18–21 February 2019. [Google Scholar]
  9. Honrubia-Escribano, A.; Gómez-Lázaro, E.; Fortmann, J.; Sørensen, P.; Martin-Martinez, S. Generic dynamic wind turbine models for power system stability analysis: A comprehensive review. Renew. Sustain. Energy Rev. 2018, 81, 1939–1952. [Google Scholar] [CrossRef]
  10. Chang, Y.; Fu, K. Smoothing Control of Doubly-Fed Induction Generator Wind Turbine under Different Wind Conditions. In Proceedings of the 2015 Asia-Pacific Energy Equipment Engineering Research Conference, Zhuhai, China, 13–14 June 2015. [Google Scholar]
  11. Gholami, M.; Shahryari, O.-K. A new control strategy for PMSG based wind turbine to improve power smoothing. Kurd. J. Appl. Res. 2017, 2, 356–360. [Google Scholar] [CrossRef] [Green Version]
  12. Shivashankar, S.; Mekhilef, S.; Mokhlis, H.; Karimi, M. Mitigating methods of power fluctuation of photovoltaic (PV) sources—A review. Renew. Sustain. Energy Rev. 2016, 59, 1170–1184. [Google Scholar] [CrossRef]
  13. Lee, D.; Baldick, R. Limiting Ramp Rate of Wind Power Output using a Battery Based on the Variance Gamma Process. In Proceedings of the 2012 International Conference on Renewable Energies and Power Quality, Santiago de Compostela, Spain, 28–30 March 2012. [Google Scholar]
  14. Yan, R.; Saha, T.K. Power ramp rate control for grid connected photovoltaic system. In Proceedings of the 2010 Conference Proceedings IPEC, Singapore, 27–29 October 2010. [Google Scholar]
  15. De Rijcke, S.; Driesen, J.; Meyers, J. Power smoothing in large wind farms using optimal control of rotating kinetic energy reserves. Wind Energy 2014, 18, 1777–1791. [Google Scholar] [CrossRef] [Green Version]
  16. Pratap, A.; Urasaki, N.; Senju, T. Control Strategies for Smoothing of Output Power of Wind Energy Conversion Systems. Int. J. Emerg. Electr. Power Syst. 2018, 14, 525–534. [Google Scholar] [CrossRef]
  17. Xu, G.; Xu, L.; Yao, L. Wind turbines output power smoothing using embedded energy storage systems. J. Mod. Power Syst. Clean Energy 2013, 1, 49–57. [Google Scholar] [CrossRef] [Green Version]
  18. Lee, D.; Kim, J.; Baldick, R. Stochastic Optimal Control of the Storage System to Limit Ramp Rates of Wind Power Output. Ieee Trans. Smart Grid 2013, 4, 2256–2265. [Google Scholar] [CrossRef]
  19. Esmaili, A.; Nasiri, A. Power smoothing and power ramp control for wind energy using energy storage. In Proceedings of the 2011 IEEE Energy Conversion Congress and Exposition, Phoenix, AZ, USA, 17–22 September 2011. [Google Scholar]
  20. Li, X. Fuzzy Adaptive Kalman Filter for Wind Power Output Smoothing with Battery Energy Storage System. Iet Renew. Power Gener. 2012, 6, 340–347. [Google Scholar] [CrossRef]
  21. Koshimizu, G.; Numata, T.; Yoshimoto, K.; Hasuike, H.; Shibata, T. Subaru Project: Application of Energy Storage for Stabilization of Wind Power in Power Systems. In Proceedings of the ESA 2005 Annual Meeting Conference Energy Storage Association, Toronto, ON, Canada, May 2005. [Google Scholar]
  22. Koshimizu, G.; Numata, T.; Yoshimoto, K.; Hasuike, H.; Shibata, T. Subaru Project: Analysis of Field test results for Stabilization of 30.6MW Wind Farm with Energy storage. In Proceedings of the Electrical Energy Storage Applications and Technologies 2007 Conf. Energy Storage Association, San Francisco, CA, USA, 24–26 September 2007. [Google Scholar]
  23. Yoshimoto, K.; Nanahara, T.; Koshimizu, G.; Uchida, T. New Control Method for Regulating State of Charge of a Battery in Hybrid Wind Power/Battery Energy Storage System. In Proceedings of the 2006 IEEE PES Power Systems Conference & Exposition, Atlanta, GA, USA, 29 October–1 November 2006; pp. 1244–1251. [Google Scholar]
  24. POSCO ICT. New Renewable Generator Output Control Device and Method. Korean Patent 10-1514886, 11 March 2015. [Google Scholar]
Figure 1. Jeju Island power system.
Energies 13 05760 g001
Figure 2. Examples of the wind power output control scheme using an energy storage system (ESS).
Energies 13 05760 g002
Figure 3. Single line diagram of the pilot project.
Energies 13 05760 g003
Figure 4. Facilities used in the pilot project: (a) 1 MW PCS, (b) 0.5 MWh lithium-ion battery, (c) switchgear, and (d) 3 MW wind turbine.
Energies 13 05760 g004
Figure 5. Field test result 1: wind and total output power.
Energies 13 05760 g005
Figure 6. Field test result 1: wind and total output power (zoomed segment).
Energies 13 05760 g006
Figure 7. Field test result 1: fluctuation rate per minute.
Energies 13 05760 g007
Figure 8. Field test result 1: histogram of wind power output.
Energies 13 05760 g008
Figure 9. Field test result 1: histogram of total output.
Energies 13 05760 g009
Figure 10. Field test result 1: output power of ESS.
Energies 13 05760 g010
Figure 11. Field test result 1: state-of-charge (SOC) of ESS.
Energies 13 05760 g011
Figure 12. Field test result 2: wind and total output power.
Energies 13 05760 g012
Figure 13. Field test result 2: fluctuation rate per minute.
Energies 13 05760 g013
Figure 14. Field test result 2: output power of ESS.
Energies 13 05760 g014
Figure 15. Field test result 2: SOC of ESS.
Energies 13 05760 g015
Figure 16. Field test result 3: wind and total output power.
Energies 13 05760 g016
Figure 17. Field test result 3: fluctuation rate per minute.
Energies 13 05760 g017
Figure 18. Field test result 3: output power of ESS.
Energies 13 05760 g018
Figure 19. Field test result 3: SOC of ESS.
Energies 13 05760 g019
Figure 20. Flow chart for the implementation of simulation.
Energies 13 05760 g020
Figure 21. Field test and simulation results: total output powers and error.
Energies 13 05760 g021
Figure 22. Field test and simulation results: output powers of ESS.
Energies 13 05760 g022
Figure 23. Field test and simulation results: output powers of ESS (zoomed segment 1).
Energies 13 05760 g023
Figure 24. Field test and simulation results: output powers of ESS (zoomed segment 2).
Energies 13 05760 g024
Figure 25. Simulation results: output powers of ESS after and before modification.
Energies 13 05760 g025
Figure 26. Simulation results: fluctuation rate per minute after and before modification.
Energies 13 05760 g026
Table 1. Energy management system (EMS) parameters.
ItemValue
C w 3000 kW
C e 1000 kW
C b 500 kWh
S O C t 90%
t s about 0.5 s
L 10%
v 0.5
S O C l 0.25 per unit
S O C u 0.95 per unit
Publisher’s Note: MDPI stays neutral with regard to jurisdictional claims in published maps and institutional affiliations.

