Article

Patterns of Energy Consumption in Polish One-Person Households

College of Economics and Social Sciences, Warsaw University of Technology, Plac Politechniki 1, 00-661 Warsaw, Poland
Energies 2020, 13(21), 5699; https://doi.org/10.3390/en13215699
Submission received: 25 August 2020 / Revised: 14 October 2020 / Accepted: 23 October 2020 / Published: 30 October 2020

Abstract

:
Poland belongs to a group of countries with the highest share of expenditure on energy carriers in total household expenditure among the EU-28 countries. This fact adversely affects the quality of life of Polish citizens. One of the types of households which are most severely burdened with expenditure on energy carriers are households run by a single person. The scientific objective of the study was to identify the consumption patterns of energy carriers in Polish one-person households. The findings of the research were used to assess the correlation between the risk of energy poverty and particular socio-economic and demographic characteristics of the representatives of these households. Many statistical methods were used to achieve the research goal: analysis of variance, regression analysis, and cluster analysis. An aggregated index of energy comfort has been designed. Social factors, such as the level of education and the fact of holding non-manual positions, are strongly related to the level of expenditure on energy carriers and the degree of satisfaction of the needs related to the thermal comfort. The types of one-person households particularly vulnerable to energy poverty were individuals who had a number of different characteristics. The group included individuals who were unemployed, disabled, with low disposable income, with a low education level, living in the rural areas as well as elderly people. Polish one-person households can be divided into four groups according to the expenditure on energy carriers and meeting their needs related to thermal comfort.

1. Introduction

The welfare of society is closely related to the use of energy services and access to modern energy technologies [1]. Energy is essential to improved quality of life and to economic and social development [2]. Ensuring energy security for all residents of a particular country is one of the priorities of contemporary economies. The comfort related to warmth is a basic human need. The expenses associated with meeting this need appear to be a severe burden for the budgets of Polish households. Poland belongs to a group of countries with the highest share of expenditure on energy carriers in total household expenditure among the EU-28 countries. This fact adversely affects the quality of life of Polish citizens. Expenses for the maintenance of a flat or house, including energy, constitute the so-called fixed expenses, thus determining the value of costs related to other consumption needs.
In 2018, in Poland, the average share of expenditure on energy, gas, and other fuels (energy carriers) consumed in the household amounted to 8.0%. In European countries, a higher percentage of energy expenditure was recorded only in Slovakia—8.4% and the average for the EU-28 was estimated at 3.9% [3]. Poland also recorded the highest increase in the share of expenditure on energy carriers in overall consumption spending among European countries. In 2000–2018, the increase in spending on energy, gas, and other fuels in Polish households amounted to 1.5 percentage points (pp). Next to Poland, the highest growth in expenditure on energy carriers was recorded in Greece—an increase by 1.3 pp, in Sweden and Romania—by 1.2 pp each. In 2000–2018, on average, household expenditure on energy and other fuels for the EU-28 increased by 0.6 pp.
Expenditure on energy carriers is one of the largest groups of expenses in Polish household budgets (the first is spending on food and non-alcoholic drinks). A high share of these expenses may affect the existence of a significant group of people with insufficiently satisfied needs related to warmth, which may ultimately lead to energy poverty. The studies suggest that the group which is particularly exposed to energy poverty includes individuals with low incomes, residents of single-family houses of poor technical condition, who are burdened with high heating costs [4]. The literature review [5,6,7] and the analysis of statistical data [8] indicate that one of the types of households which are most severely burdened with expenditure on energy carriers are households run by a single person. In 2018, spending on energy carriers consumed 10.6% of the disposable income of a single-person household, while in households consisting of more people, it ranged from 6.0% to 8.1% of their disposable income (Figure 1).
The number and share of households managed by single persons are still increasing, and forecasts [9] show that this trend is likely to continue. Therefore, it seems reasonable to consider and analyze the problem of energy poverty in these types of households. A one-person household is understood as a self-supporting person, regardless of whether she or he lives alone or with other people. For the purpose of the present study, the term “energy poverty” was defined as the scarcity of affordable energy and low level of satisfaction of the needs related to household energy. It is important to note that the deficit of affordable energy is associated with a high share of energy expenditure (20% and more) in disposable income.
The scientific objective of the study is to identify the consumption patterns of energy carriers in Polish one-person households. The findings of the research will be used to assess the correlation between the risk of energy poverty and particular socio-economic and demographic characteristics of the representatives of these households. Patterns of consumption of energy carriers realized by different types of one-person households reflect the actual level of expenditure on energy carriers as well as meeting the energy requirement using these carriers in particular socio-economic conditions of the country. The scientific objective adopted in this study was achieved through the implementation of specific tasks performed in the subsequent stages of the research, namely:
  • examining the impact of economic factors on the share of energy expenditure in Polish one-person households in the period of 2000–2018;
  • establishing a hierarchy of the types of one-person households according to being exposed to the risk of energy poverty;
  • delimitation of one-person households into groups characterized by different consumption patterns related to energy carriers.
In view of the research goals and tasks presented above, the following research hypotheses were formulated:
Hypothesis 1. (H1).
The increase in the prices of energy carriers and the improved income situation of people in 2000–2018 impacted the shaping of the share of expenditure on energy carriers in the income of members of one-person households.
Hypothesis 2. (H2).
The socio-economic characteristics of members of one-person households exert the strongest influence on the risk of being included in the sphere of energy poverty.
Hypothesis 3. (H3).
Objective and subjective indicators related to the use of energy carriers in a household determine the heterogeneity of consumption patterns of these energy carriers in households run by one person.
The subject-matter considered in this paper is significant for several reasons. Recognizing the consumption patterns of energy carriers and identifying people who are continually exposed to energy poverty is vital from the perspective of the country’s social policy, especially if, according to the forecasts, the group of people managing one-person households is likely to increase. Energy poverty affects the quality of life and health of people, and these issues are of interest to the state authorities and politicians responsible or dealing with health care. The use of energy carriers in households can also be associated with responsible consumption. The standard of buildings and related satisfaction with the living conditions, expressed by members of one-person households, are also important for the sectors dealing with the modernization of residential buildings. The discussed topic is important from the point of view of the seventeen Goals of Sustainable Development defined by the United Nations, including in particular: 1. No poverty, 3. Good health and well-being, 7. Affordable and clean energy and 13. Climate action [10].
The remainder of the paper is structured as follows. Section 2 discusses the concept of energy poverty and presents the research methods used. Section 3 explains the data used in the analysis. Section 4 discusses the results. The final section provides some concluding remarks.

2. Literature Review

2.1. Historical Approach to Research on Energy Poverty

A high share of expenditure on energy carriers in the disposable income and the lack of satisfaction in terms of the needs related to the thermal comfort in homes may be a symptom of energy poverty. The perception and definition of energy poverty are closely related to the level of energy consumption that is insufficient to meet specific basic needs in this regard. It is important to note that there is no universally accepted definition of energy poverty in the literature. The works of the British researcher, Boardman [11,12], who, based on the earlier contributions of Isherwood and Hancock [13], defined the poverty index, became an inspiration for a wider group of researchers to consider this research problem. The frequently cited definition of energy poverty created by Boardman [11] indicates that a poor household is defined as one where more than 10% of its income is spent on energy carriers, which include heating, electricity, and hot water. According to Bouzarovski and Petrova [14] fuel poverty as “the inability to attain sufficient levels of domestic energy services (e.g., heating, cooking, showering, washing, etc.)”. Galvin [15] points out that energy poverty has three aspects: (a) has understood in the context of physical, social, and technological facets; (b) people’s experiences are affected by intersecting challenges as per these conditions; and (c) the progression and the nature of these challenges is variable over time. In turn in French legislation defines fuel poverty as follows: “A household that has difficulties obtaining the necessary energy to satisfy its basic needs due to the inadequacy of its resources or its living conditions is in fuel poverty under this Act” [16].
In Poland, so far, there is no officially adopted definition of energy poverty [17]. According to the definition proposed by Miazga and Owczarek [18], energy poverty is a phenomenon which consists in experiencing difficulties in satisfying basic energy requirement in the place of residence at a reasonable price (...) to adequately meet the essential needs of biological and social functioning of household members. A particular household experiences energy poverty if it has difficulty meeting its energy needs because of low income or the specific characteristics of the place in which the household members reside. Failure to meet this basic energy requirement can lead to the deterioration of health. It can also be associated with digital exclusion, i.e., limited access to information technologies, for example, by limiting expenses on electricity. Energy poverty is related to the failure to meet the basic needs of an individual, including the activities that use both heat and electricity, which are necessary to maintain a decent standard of living. The essential energy needs in a household include heating, lighting, heating water, preparing meals, and using basic household appliances as well as audio/video devices. In this context, it is important to indicate that the degree of failure to meet the above needs may vary [4,19].
In Poland, research on energy poverty has been developing since the end of the first decade of the 21st century. Szamrej-Baran [20] pointed to the significance of the issue of energy poverty, which is particularly common in rural areas. The study conducted by Szamrej-Baran demonstrates, among others, that in the period of 2005–2007 over 60% of people aged 65+ who manage single-person households declared that they could not meet their needs as far as heating their flat or house is concerned, while for the EU-15 the share of individuals expressing such an opinion was estimated at approximately 16% [20]. In 2008, the percentage of older people who did not meet their basic requirement connected with heating their apartment decreased slightly, amounting to over 50%. When analyzing the data available for 2008, Kurowski’s studies [7] have shown that approximately 40% of Polish households were energy-poor, i.e., the energy expenditure in these households accounted for over 10% of their disposable income. It was estimated that in a single-person household, on average, 13.5% of consumption expenditures were allocated to cover the expenses associated with energy carriers, and 55% of single-person households recorded energy expenditures which exceeded 10% of their income. However, it was discovered [18] that these data were overestimated due to the fact that the analysts used real energy expenditure instead of a hypothetical one. In this context, establishing the energy poverty line at the level of 10% of household expenditure on energy carriers in disposable income seems too low for Poland. In subsequent analyses [21], the actual energy expenditure in the place of residence, i.e., a flat or a house was adopted as the threshold of an energy shortage, which exceeded 20% of the household income. It was found that exceeding this share of expenses constituted a heavy burden on the household budget and might be caused by a combination of different factors. The examples of such determinants include a flat which is too large, its poor technical condition, old and energy-consuming household appliances, lack of energy awareness, wasteful habits regarding the use of energy, and in particular, the low level of disposable income [22]. The literature review, both Polish and foreign sources, suggests that there exist few studies on energy poverty in single-person households, which is the type of household with the highest absolute and relative expenditure on energy carriers. The analysis of scientific literature on the subject also shows that there is no recommended measure of energy poverty. In conclusion, it is worth emphasizing that Boardman’s research achievements were a milestone in the development of energy poverty measurement. In conclusion, it is worth emphasizing that Boardman’s research achievements were a milestone in the development of energy poverty measurement. The 10% metric to assess energy poverty is a simplification of Boardman’s original proposal which had a statistical sound methodology behind it and has been misinterpreted extensively.

2.2. Measures of Energy Poverty

According to the definition of energy poverty presented in the British literature [23], we may distinguish two measures applied in this case. They are as follows: an absolute measure, the so-called “10% of income”, which means that a household is energy-poor when its expenditure on energy carriers exceeds 10% of its disposable income; and a relative measure (English: low income high costs—LIHC): an energy poor household is the one which incurs high hypothetical energy expenditure in comparison to other households and whose income is relatively low compared to that of other households. Hypothetical energy expenditure refers to the expenses which a particular household would incur if it were able to fully meet its basic energy needs. In other words, it is a level of expenditure where, taking into account energy prices, the characteristics of the building (its energy efficiency, surface area, the energy efficiency of electrical appliances, etc.) and the characteristics of household members (age, time spent at home, etc.), would allow the household members to lead a decent life. There are two reasons supporting the use of hypothetical rather than actual household energy expenditure. Firstly, many households do not heat their flats for financial reasons [24]. Taking into account the energy poverty measure of their actual energy expenditure would not reflect their real needs and would result in some households being incorrectly classified as energy non-poor. Secondly, the use of hypothetical energy expenditure in the definition of the LIHC indicator results in excluding the households whose high energy expenditure results from personal preferences (e.g., maintaining a temperature in the apartment higher than recommended by WHO) and attitudes [18] from the group of energy-poor households. The 10% measure was used in research into energy poverty carried out, among others, by Boardman [12]; Heindl and Schüssler [25]; Phimister et al. [26]; Okushima [27]; and Pachauri et al. [28]. However, the application of the 10% threshold has many disadvantages. First, it is relative, which makes it difficult to compare countries characterized by different economic situations and development level [29]. This indicator does not provide any mechanism which would enable the exclusion of affluent households, such as the ones living in large houses, where more than 10% of their income is spent on energy [30]. Some studies attempt to identify energy poverty based on adapting the 10% measure to local conditions. For example, in the studies carried out in former post-communist countries, the analysts applied the 20% measure [22,31], and in other studies, the threshold was established at the level of 13% [19]. Thus, there is much debate about how to define and quantify an energy poverty measure, and the original approach considering only household expenditure has become subject to much criticism [32,33,34].
In the most recent publications on energy poverty, authors and researchers present three types of indicators: apart from the objective ones (e.g., actually incurred expenses), they also use subjective (e.g., the level of satisfaction of needs) and complex measures [35]. Objective indicators are based on measurable and observable criteria and the theory of consumption. As previously indicated, objective indicators consider the value of the expenditure which is allocated to meeting energy needs (after fuel cost poverty—AFCP and indicator and the low income high cost—LIHC). Subjective energy poverty indicators are the result of personal opinions, interpretations, points of view and judgments. They are usually constructed on the basis of responses provided by households members to the questions included in a survey which is conducted by social researchers (e.g., Is your flat warm enough in winter?). One of the pioneers applying subjective variables that were established based on the inability to meet basic life needs were Gordon et al. [36]. Healy and Clinch [32] used subjective variables such as the lack of central heating and the possibility of keeping the flat or house warm. Other studies based on subjective indicators of energy poverty include the research carried out by Thomson and Snell [37]. However, it is important to note that the approach taking into account subjective variables also has its shortcomings, because the households which are energy poor may not identify themselves as such [38]. Thus, both the use of objective measures of energy consumption and the subjective satisfaction of the energy needs of the household have a number of disadvantages.
The third indicator used to measure energy poverty are composite indices, which are designed as a specific compromise between the simplicity of one-dimensional indicators and the need to consider the multi-dimensional nature of the issue of energy poverty. They are an attempt to overcome the shortcomings of one-dimensional indicators and simultaneously produce a result that will condense information into single values which are easy to interpret [37]. It emerges that energy poverty arises from the complex interaction of low income, energy inefficient housing, and high fuel costs [39]. There are many studies in the literature which measure energy poverty according to a multi-dimensional framework [1,26,40,41,42,43]. Aristondo and Onaindia [1], researchers from Spain, applied three indicators of energy poverty: the ability to maintain adequate heat in the home, arrears in payments for utility bills (electricity, water, and gas), and the circumstances such as a leaking roof, damp walls, or rotten windows. Researchers from Poland [18] took into account the relative measure of energy poverty (LIHC), the absolute measure (energy expenditure exceeding 10% of income) and the subjective measure (lack of heat comfort in the flat during the winter). Szamrej-Baran [44] has also applied a multi-dimensional approach when conducting her study into energy poverty. So, there is no consensus on the method of constructing index the comfort of energy.

3. Research Methods

3.1. Data Sources and Study Design

The study was focused on one-person households in Poland. The research material was represented by the statistical data from Statistics Poland data for household budget investigations (individual, unpublished) in 2000–2016, that covered over 36,000–37,000 households. There were from 5096 in 2000 to 7950 in 2016 one-person households [45]. Statistical data analyses were performed using Statistica software version 13.0.
To achieve the research objective and carry out the tasks presented in this paper, the researcher had to apply a number of statistical measures and methods. Subsequent research tasks were subordinated to research hypotheses.
Research task no. 1. In order to examine the impact of economic factors on the share of energy expenditure in Polish single-person households, the author undertook the actions which included:
  • building dynamic time series for disposable income and expenditure on energy carriers,
  • calculating chain indices that were used to calculate the dynamics of real energy expenditure and real disposable income,
  • using regression methods to test the degree of dependence of the share of energy expenditure on changes in prices and changes in disposable income, and
  • comparing the differences in the average shares of expenditure on energy carriers using post hoc tests.
Research task no. 2. To establish the hierarchy of the types of one-person households according to the risk of energy poverty, the author undertook the following steps:
  • Designing an aggregate indicator which included quantitative and qualitative variables. The created index was verified by analyzing the correlation between its components. For this purpose, the author has applied the analysis of reliability, which was used to determine the accuracy with which a particular scale measures a given phenomenon.
  • Using multiple regression analysis to carry out the combined analysis of the energy poverty factors. Multiple regression is widely described in the books: Chatterjee, Hadi, [46] and Schroeder, Sjoquist, Stephan, [47].
Research task no. 3. For the delimitation of single-person households according to groups characterized by different consumption patterns of energy carriers, the author realized the following steps:
  • Using the k-means cluster analysis with the application of data mining techniques. K-means cluster is widely described in the book: Charu C. Aggarwal and Chandan K. Reddy [48]. K-means clustering is a type of unsupervised learning. The aim of this algorithm is to find groups (clusters) in the data, with the number of clusters represented by the variable K. The algorithm works iteratively. Each data point is assign to one of K clusters based on the features that are provided. Data points are clustered based on feature similarity. More about the k-means algorithm on the example of country grouping in the paper [49].
  • Calculating the average values for each group using the arithmetic mean (e.g., expenditure on energy carriers, the share of expenditure on energy carriers in disposable income), horizontal distributions of socio-economic and demographic characteristics for each group (e.g., respondents’ marital status, their sex, and level of education).
  • Comparing the differences in mean values of the parameters related to energy carriers between the groups using the analysis of variance and post hoc tests. The study uses also method of variance and post hoc tests to show statistically significant differences between the analyzed types of households. In the first step it was checked statistically significant differences (p < 0.05, significance level α = 0.05) between the considered means. If there were statistically significant differences, in the second step post hoc tests were used to find the answer the question which of the n means are significantly different from each other. For unequal sample sizes the Tukey’s range test (HSD) was used. This test is especially recommended for comparisons of pairwise differences between factor level means [50]. It is worth mentioning that, in testing statistical hypotheses, the significance level α plays an important role. Using the α level (denoted as α or alpha), the probability of rejecting the true hypothesis is determined at the desired level. This probability is exactly equal to the α value only for a single application of the statistical test. With multiple comparison of average value pairs, as it is in the conducted study, there is a certain cumulative level of significance, greater than α, and it is a proper characteristic of the probability for false rejection of at least one of the true hypotheses telling about the equality of the average values compared. The alpha level of 0.05 was adopted in the paper.

3.2. Energy Poverty Test Method and Preliminary Research Results

In order to implement the research objective no. 2, the author had to construct an aggregated indicator. The author decided to use both objective and subjective measures related to the use of energy carriers in the household. The designed indicator takes into account variables related to energy expenditure, the degree of satisfaction of the needs related to using energy carriers and the standard of a flat or a house (Table 1).
To design the indicator, the variables were transformed in such a way that they all were stimulants, i.e., larger values of a given variable positively correlated with the synthetic feature, i.e., a more advantageous comfort of energy. The differential transformation is described using Theorem 1. Both objective and subjective social indicators have been taken into consideration.
Theorem 1.
Transformation of variables in stimulants.
x’ij = 1/xij
where xij—is the value of the i-th implementation of the j-th variable in the form of anti-stimulants.
The first group included the following objective indicators: the level of available income, the share of expenditure on energy in available income, the level of expenditure on housing and energy sources, housing conditions: the access to hot water, presence of leaking roofs, damp walls and rotting windows, and construction period.
In the other group, concerning the subjective social indicators, the following factors were taken into consideration: the subjective standard of the building, the assessment of temperature conditions in the apartment in summer and winter and the assessment of its improvement, the assessment of the satisfaction of needs in the field of food, healthcare, and timely payment of housing and energy fees (Theorem 2).
Theorem 2.
The aggregate indicator.
CI = io + is
where
CI—the aggregate (composite) indicator,
io—objective variables of energy comfort (e.g., share of expenditure in energy carriers in disposable income, and share of expenditure on energy carriers in disposable income), and
is—subjective variables of energy comfort (e.g., the apartment is cool enough in summer, and assessment of meeting the needs of food).
While determining the aggregate indicator for the comfort of energy, the division of households with regard to the level of expenditure was determined arbitrarily, using the amounts of expense in the minimum subsistence consumer goods and services basket (expenditure on housing and energy sources) and data from the literature review (share of expenditures on energy carriers in available income). The adopted divisions of households are justified both statistically and substantively, although they are only arbitrary.
The designed composite indicator for the comfort of energy was verified by analyzing the correlations between its components. For this purpose, reliability analysis was applied. The reliability analysis assesses the accuracy with which a given scale (composite indicator for the comfort of energy) measures a given phenomenon [51,52]. “Reliability” is how well a test measures what it should. In this example, the author measures thermal comfort. High reliability means it is measuring thermal comfort, while low reliability means it is measuring something else (or nothing at all).
An average of 21.76 was obtained from the summing of scale statistics, with a variance of 21.50 and standard deviation of 4.64. The Cronbach’s alpha coefficient (mathematical formula no. 3)—a measure of internal scale consistency—was 0.67, while the standardized alpha was 0.69. Cronbach’s alpha coefficient takes values from 0 to 1; the value above 0.7 means fair reliability of the scale [53,54]. Considering the fact that all correlations were positive and basing on the obtained reliability coefficients, it was assumed that the indicator is internally consistent, and its individual components represent a mapping of elements of one phenomenon determining satisfaction of the needs as well as living conditions of single-person households.
The formula for Cronbach’s alpha is the following (Theorem 3):
Theorem 3.
The formula for Cronbach’s alpha.
Cronbach s   α = N *   c ¯ / v ¯ + ( N 1 ) *   c ¯
where
N—the number of items,
c ¯ —average covariance between item-pairs, and
v ¯ —average variance.
In order to analyze statistically significant differences in the level of the composite indicators of life quality between types of households, analysis of variance was used. The research hypothesis assumed that the mean values of the composite indicator for the standard of living in the types of single-person households are the same, while the alternative hypothesis put forward that at least two mean values of the composite indicator for the standard of living in these types of households are different.

3.3. Identify Types of Households According to Energy Expenditure and Satisfaction of Energy Needs

To carry out the research task no. 3, the author had to apply data hierarchy methods. To identify groups of households with different consumption patterns of energy carriers, she used cluster analysis with the application of data mining techniques. The k-means algorithm was applied in this case. The selection of the V-fold cross-validation test enabled the selection of the optimal number of clusters (number of trials—10). The study assumed the minimum number of clusters at two and established the maximum number at twenty-five. As a result of the analyses, the most effective division included 4 clusters (groups of households). One-person households were grouped, using six variables:
two quantitative variables: the level of expenditure on energy carriers (PLN) and the share of expenditure on energy carriers in the disposable income (%);
four qualitative variables: the flat is warm enough in winter (variable 0–1), the flat is cool enough in summer (variable 0–1), access to hot running water and how to heat the house (variable 0–1).
The quantitative variables which the author used indicated one of the elements of the standard of living in single-person households, which is the actual expenditure on energy carriers (objective indicator). Qualitative variables showed the existence of thermal comfort in the household and the convenience of using energy carriers (subjective index). Maintaining the right temperature at the place of residence, access to hot water, or the method of heating (central heating is a more convenient way to heat a flat or house compared to heating them with a solid fuel stove) have an impact on the quality of life of household members. Four groups (clusters) of households were created, with different expenditure on energy carriers and various needs related to energy.
Cluster analysis k-mean to create groups of one-person households with similar profiles due to the objective material and consumption situation as well as subjective feelings of the financial situation and satisfying energy consumption needs.

4. Results

4.1. The Influence of Economic Factors on Changes in Expenditure on Energy Carriers in One-Person Households

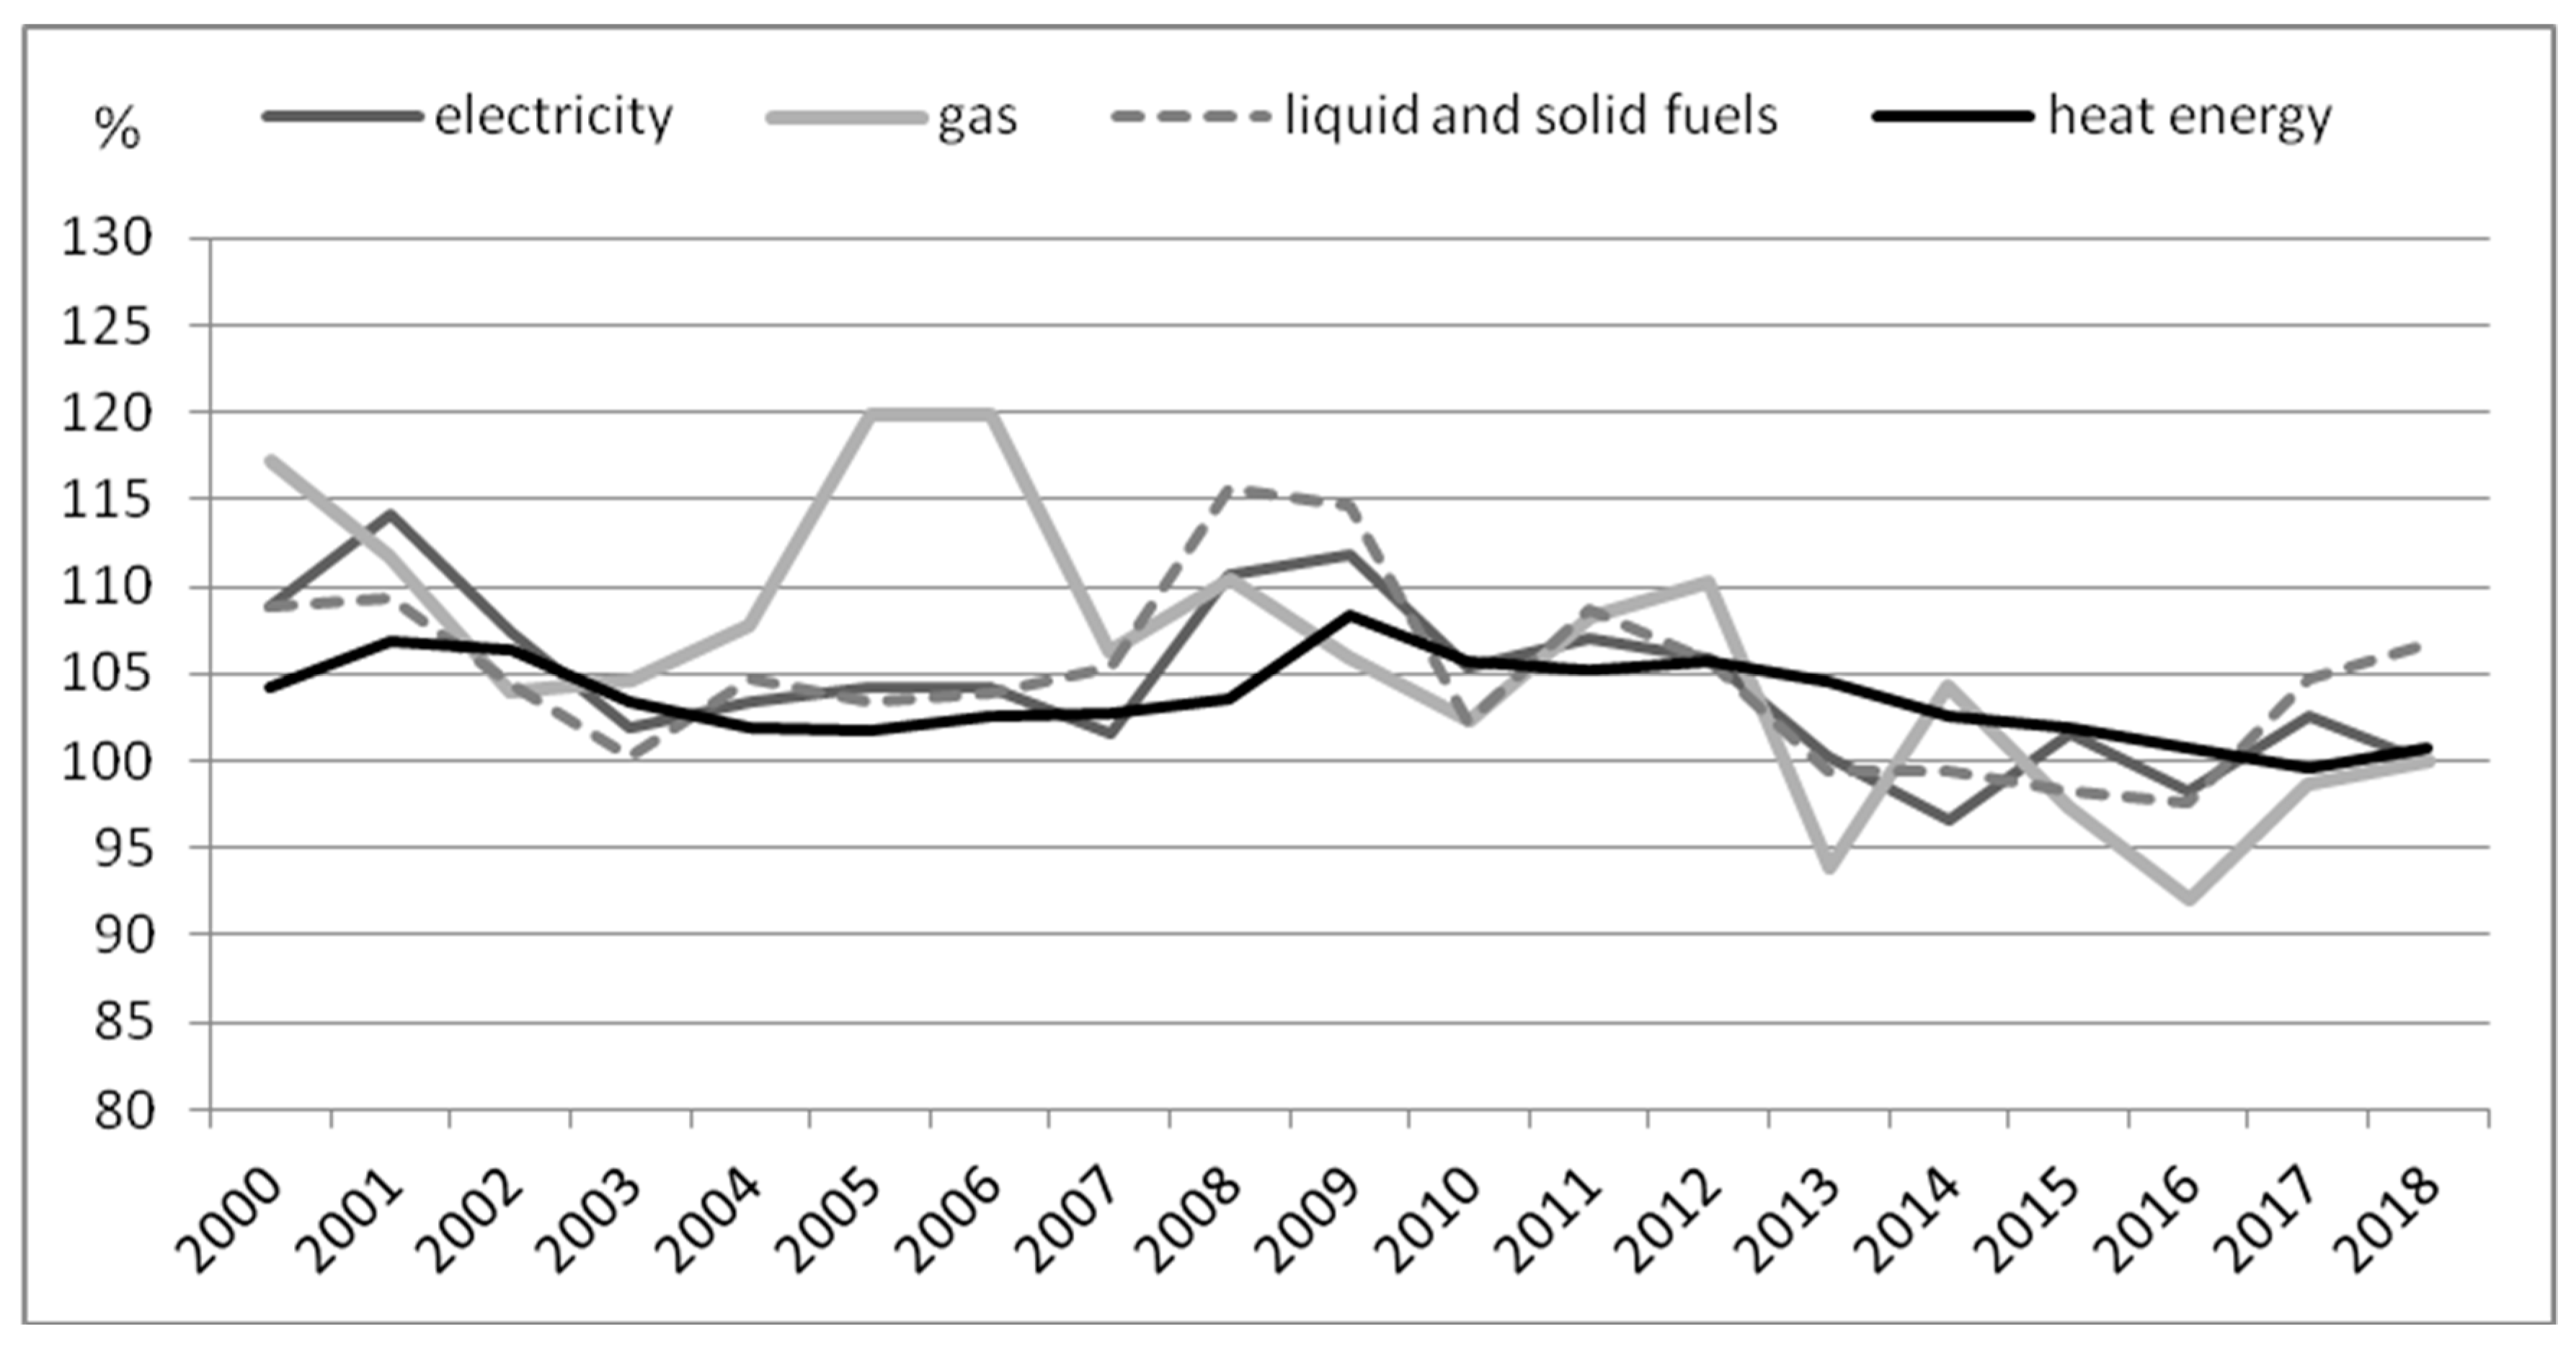
The expectations of household members with regard to improving their quality of life require ensuring both stable sources of income and certain supplies of low-cost energy carriers [50]. Therefore, economic factors such as consumers’ incomes and product prices have a significant impact on the shaping of consumption patterns of energy carriers. Every year the disposable income in single-person households is rising [55], and the prices of energy carriers are also increasing. In Poland, in the period of 2000–2012, we could observe a systematic increase in the prices of all energy carriers. In the following years, i.e., the period of 2013–2018, the prices of energy carriers remained stable or decreased, even though further increases were recorded in the "thermal energy" category in this period (Figure 2). The increase in energy prices for households was the result of the simultaneous occurrence of the following circumstances: (1) the need to finance significant investments in the energy sector, (2) the liberalization of the electricity and natural gas trading markets, and (3) the implementation of the climate policy imposing on energy producers the costs related to the negative effects of greenhouse gas emissions on the environment [56].
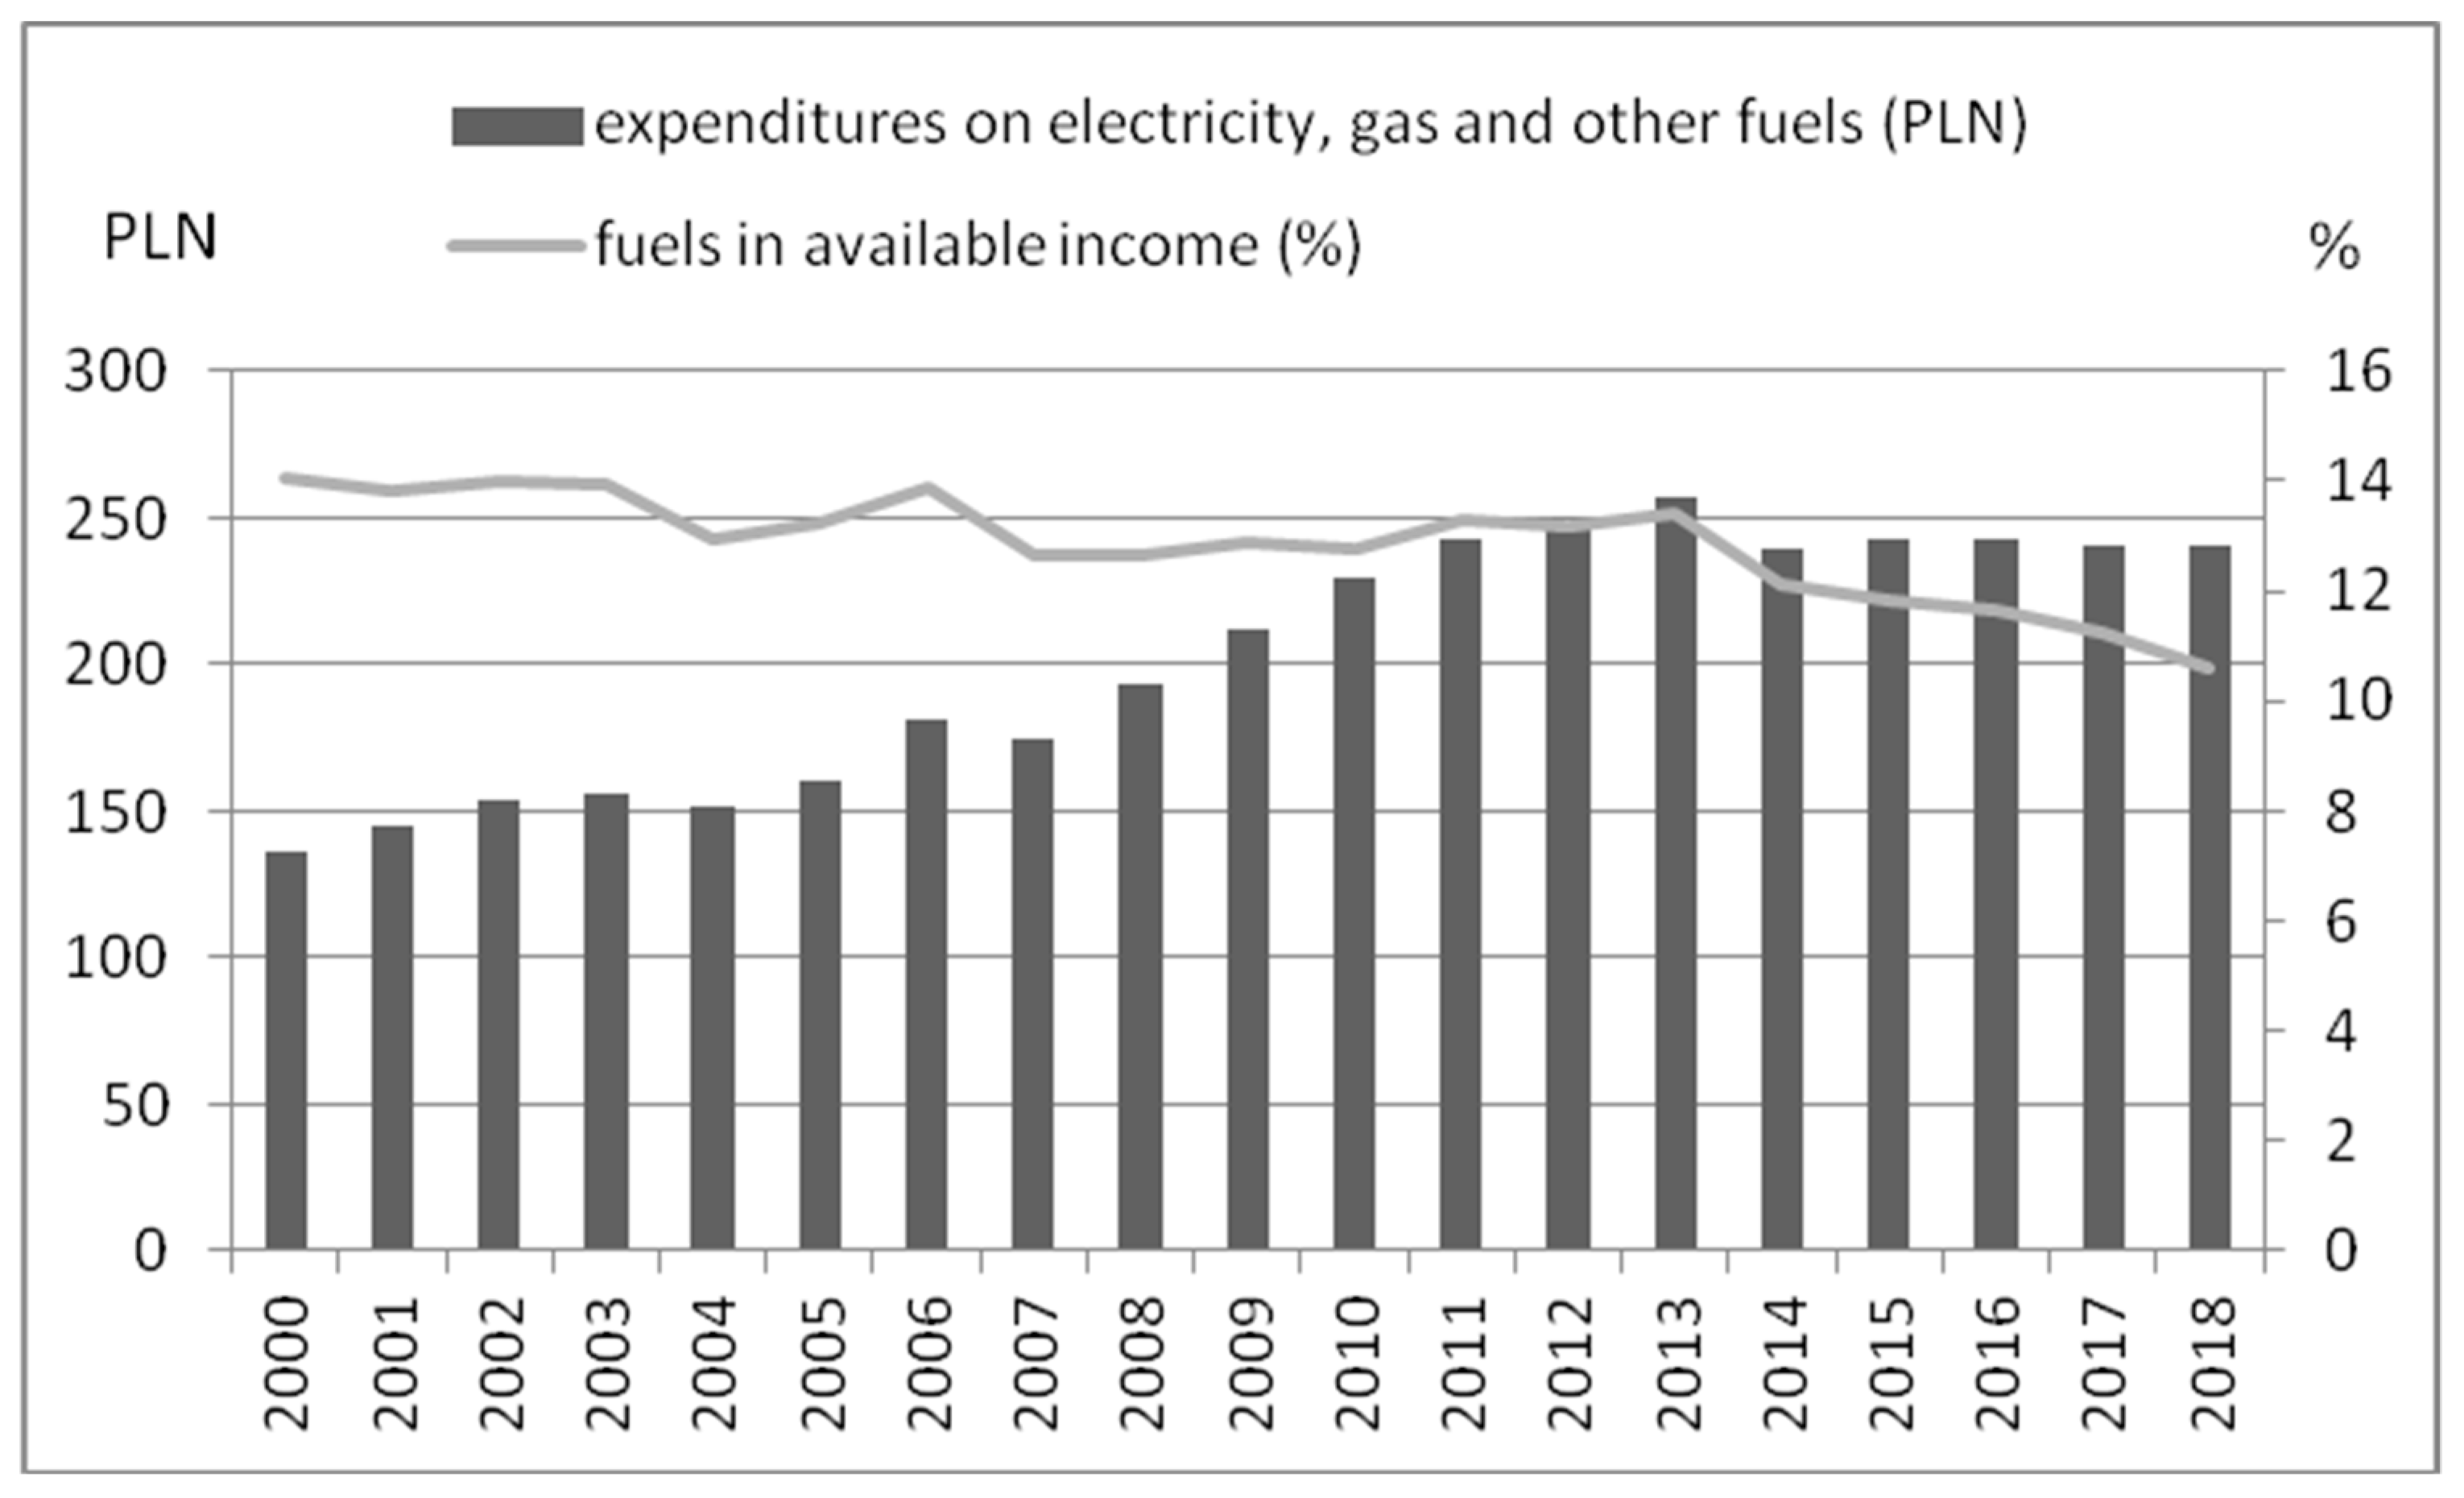
It is essential to indicate that, apart from the rising prices of energy carriers, disposable income in one-person households has also shown an increase which was statistically significant (p = 0.0000), i.e., in nominal terms, the increase has amounted to 2.3 times in the period of 2000–2018. The rise in prices contributed to the increase in expenditure on energy carriers. Statistically significant changes (p = 0.0000) were recorded both in terms of nominal expenditure on energy carriers as well as the share of the expenditure in disposable income. In the years 2000–2018, on average, annual spending on energy carriers in single-person households increased by PLN 7.1, while the share of expenditures on energy carriers in disposable income decreased on average by −0.15 pp. The decrease in the percentage of spending on energy carriers confirms the growing wealth of Polish one-person households (Figure 3).
Energy carriers are a component of housing maintenance expenses, and according to Schwabe’s law, “The poorer a person is, the greater part of his income must be spent on housing” [57].
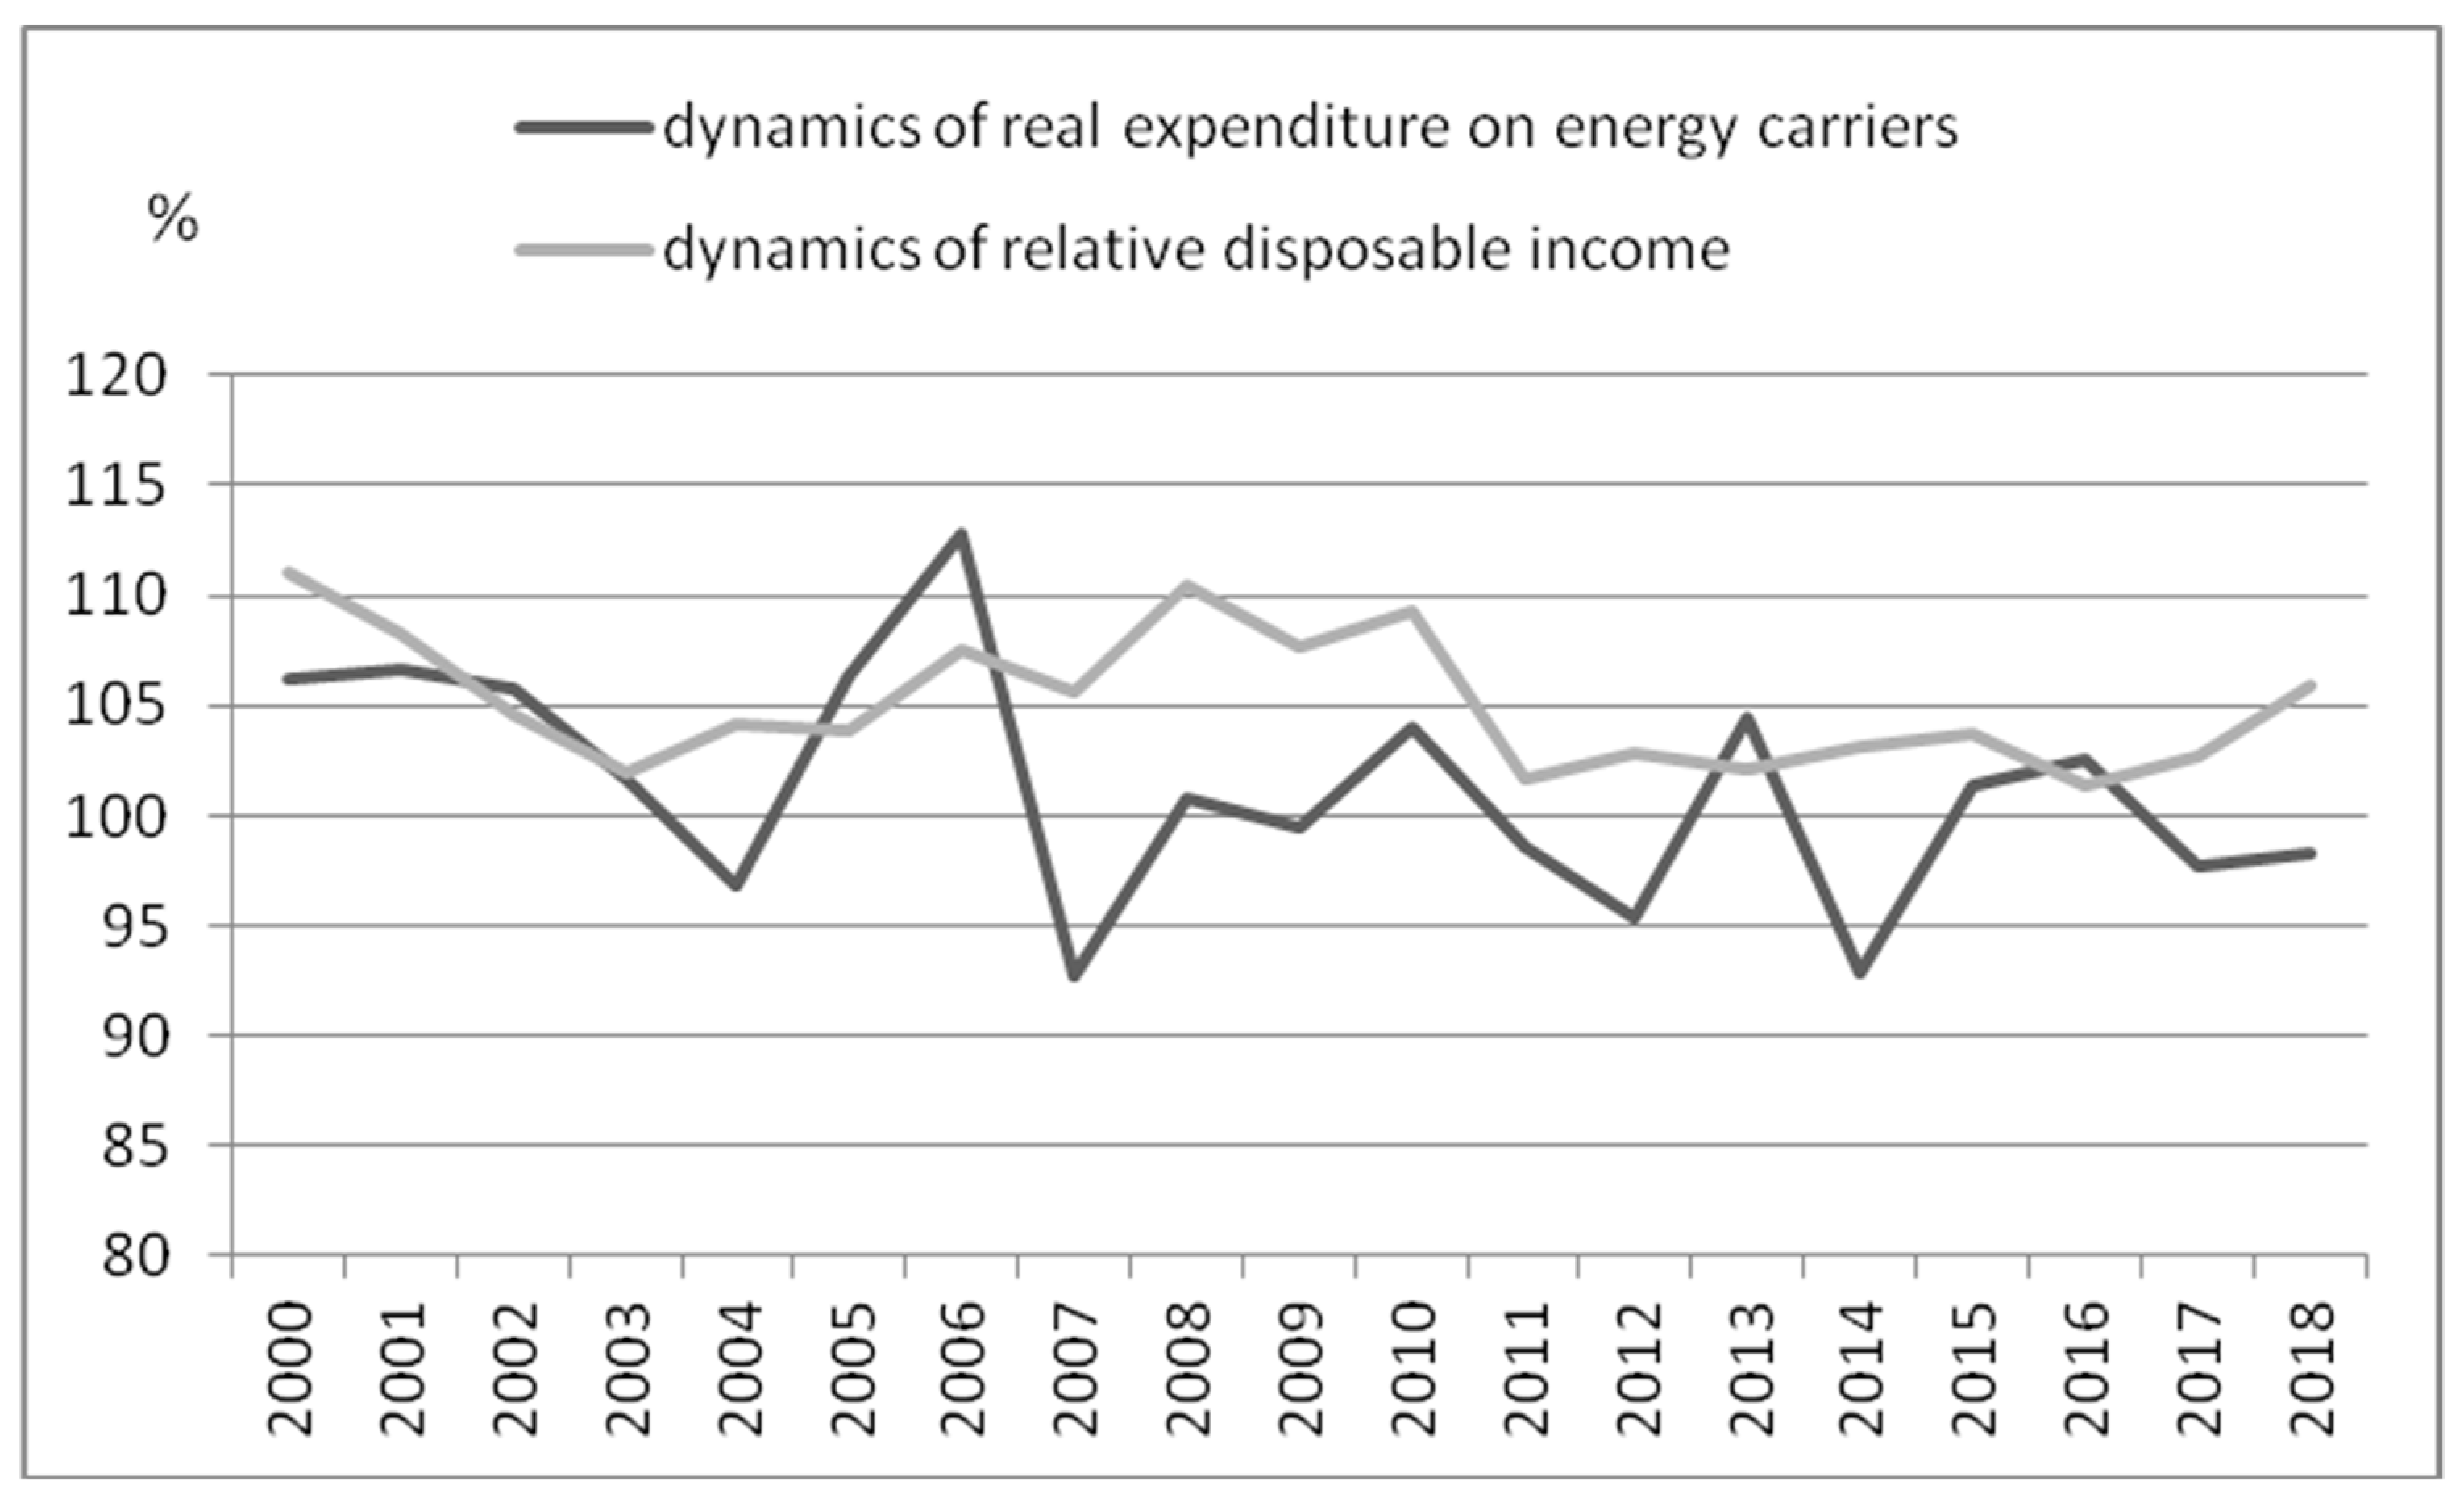
The analysis of changes in real expenditure on energy carriers has proven their stability. It is important to indicate that no statistically significant changes in the dynamics of these expenses were noticed (p = 0.0584) (Figure 4).
The results of the calculations demonstrated that in the period of nineteen years examined in this study, the decrease in the share of expenditure on energy carriers in the disposable income was influenced by the improvement of the income situation in one-person households. However, no statistically significant correlation (p = 0.4528) was found between the change in the share of expenditure on energy carriers and changes in energy prices (Table 2). The presented results may be caused by the fact that the increasing wealth of consumers leads to using more convenient and also more expensive energy sources, i.e., coal-fired furnaces are replaced with gas, biomass, and other more expensive fuels, which is also confirmed by the findings of other studies [58].
Expenditure on energy carriers varies depending on the level of disposable income. In the case of the poorest consumers, the share of spending on energy carriers is statistically significantly higher (p < 0.05) than in the case of consumers with a better income situation. In 2016, 20% of the poorest single-person households (income group 1st) indicate the share of expenditure on energy carriers in disposable income which was at the level of 18.2%, while in other income groups it ranged from 7.5% to 15.8%. In the period of 2000–2016, the share of expenditure on energy carriers in disposable income decreased in all income groups, and in the group of the poorest people this percentage decreased the least, by 0.5 pp, while in other income groups the changes ranged from 1.8 pp to 4.0 pp. (Figure 5). The income situation, which is inherently related to energy poverty, tends to improve; however, the slowest improvement can be observed in the group of the poorest people who are managing single-person households.

4.2. Energy Poverty in One-Person Households

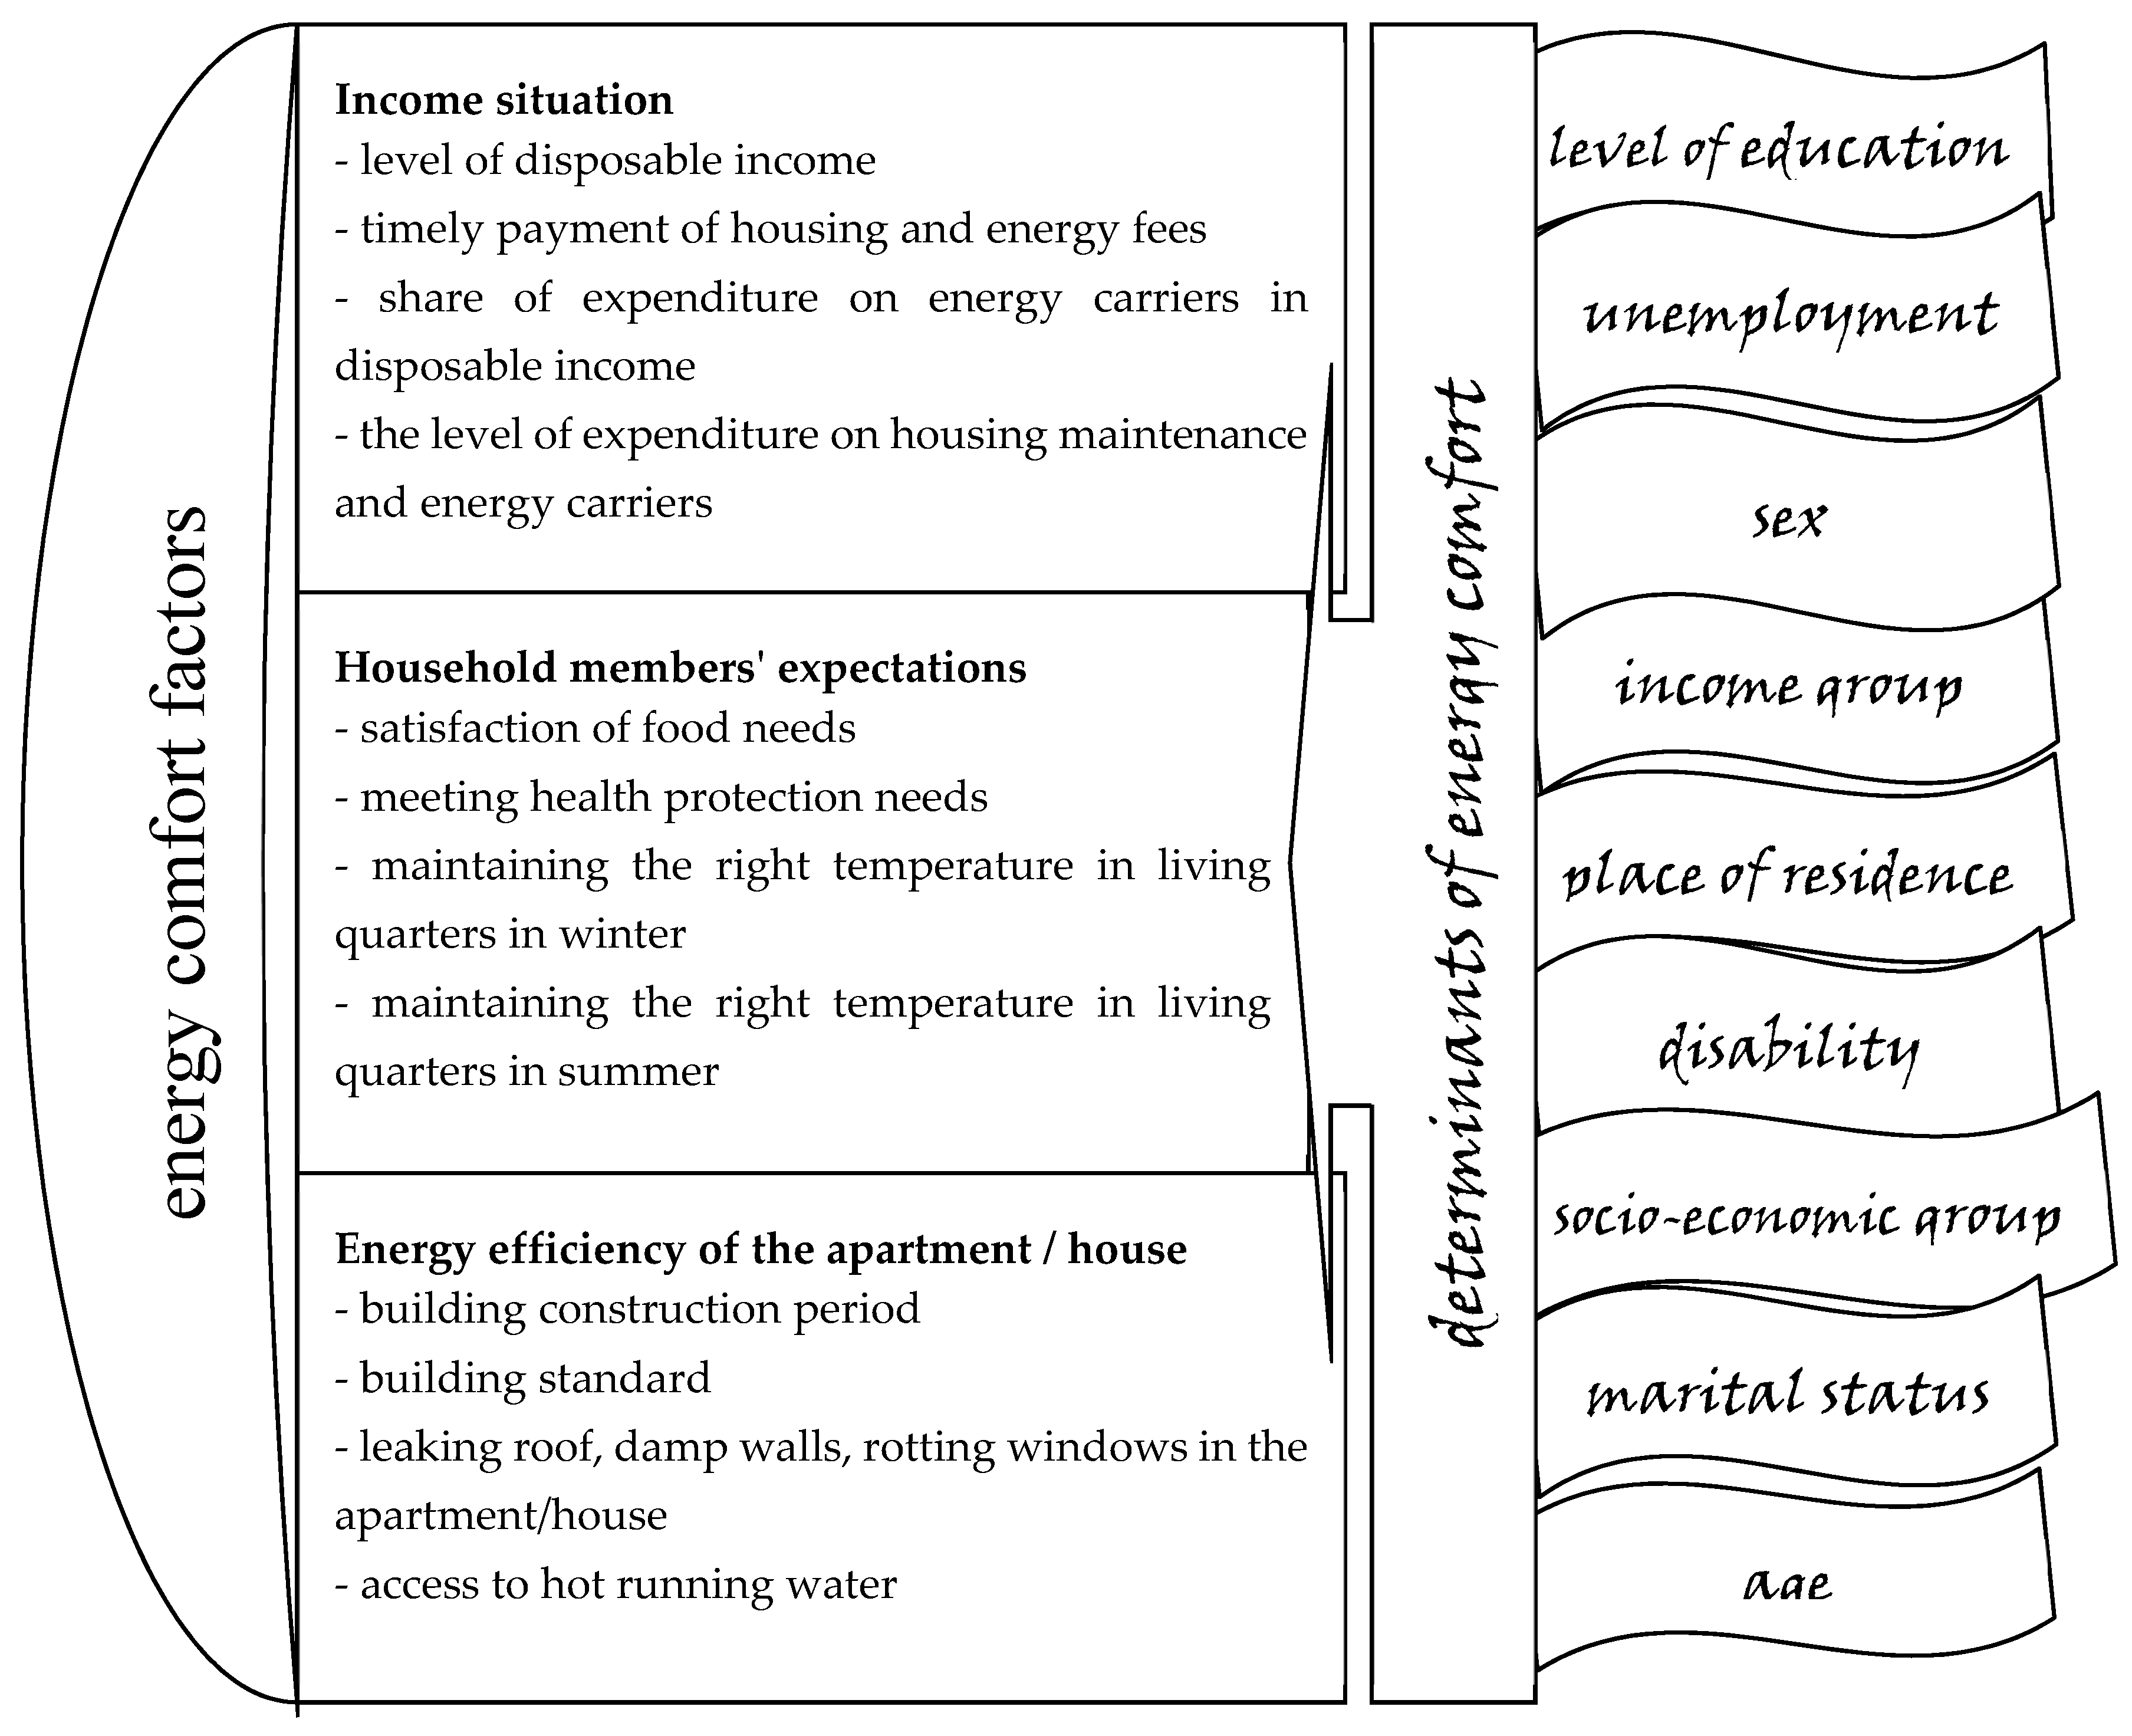
There are many variables which influence the energy poverty of household members. Starting with the income situation of the household, through the energy efficiency of the flat to the personal expectations of household members. In order to identify the types of households which remain at risk of energy poverty, the author determined an aggregate index in which she took into account three groups of variables, i.e., those related to the income situation of a household, energy efficiency of a flat and the one connected with meeting the consumption needs of people who constitute particular households. The values of descriptive statistics of the aggregate indicator for one-person households are presented in the Table 3.
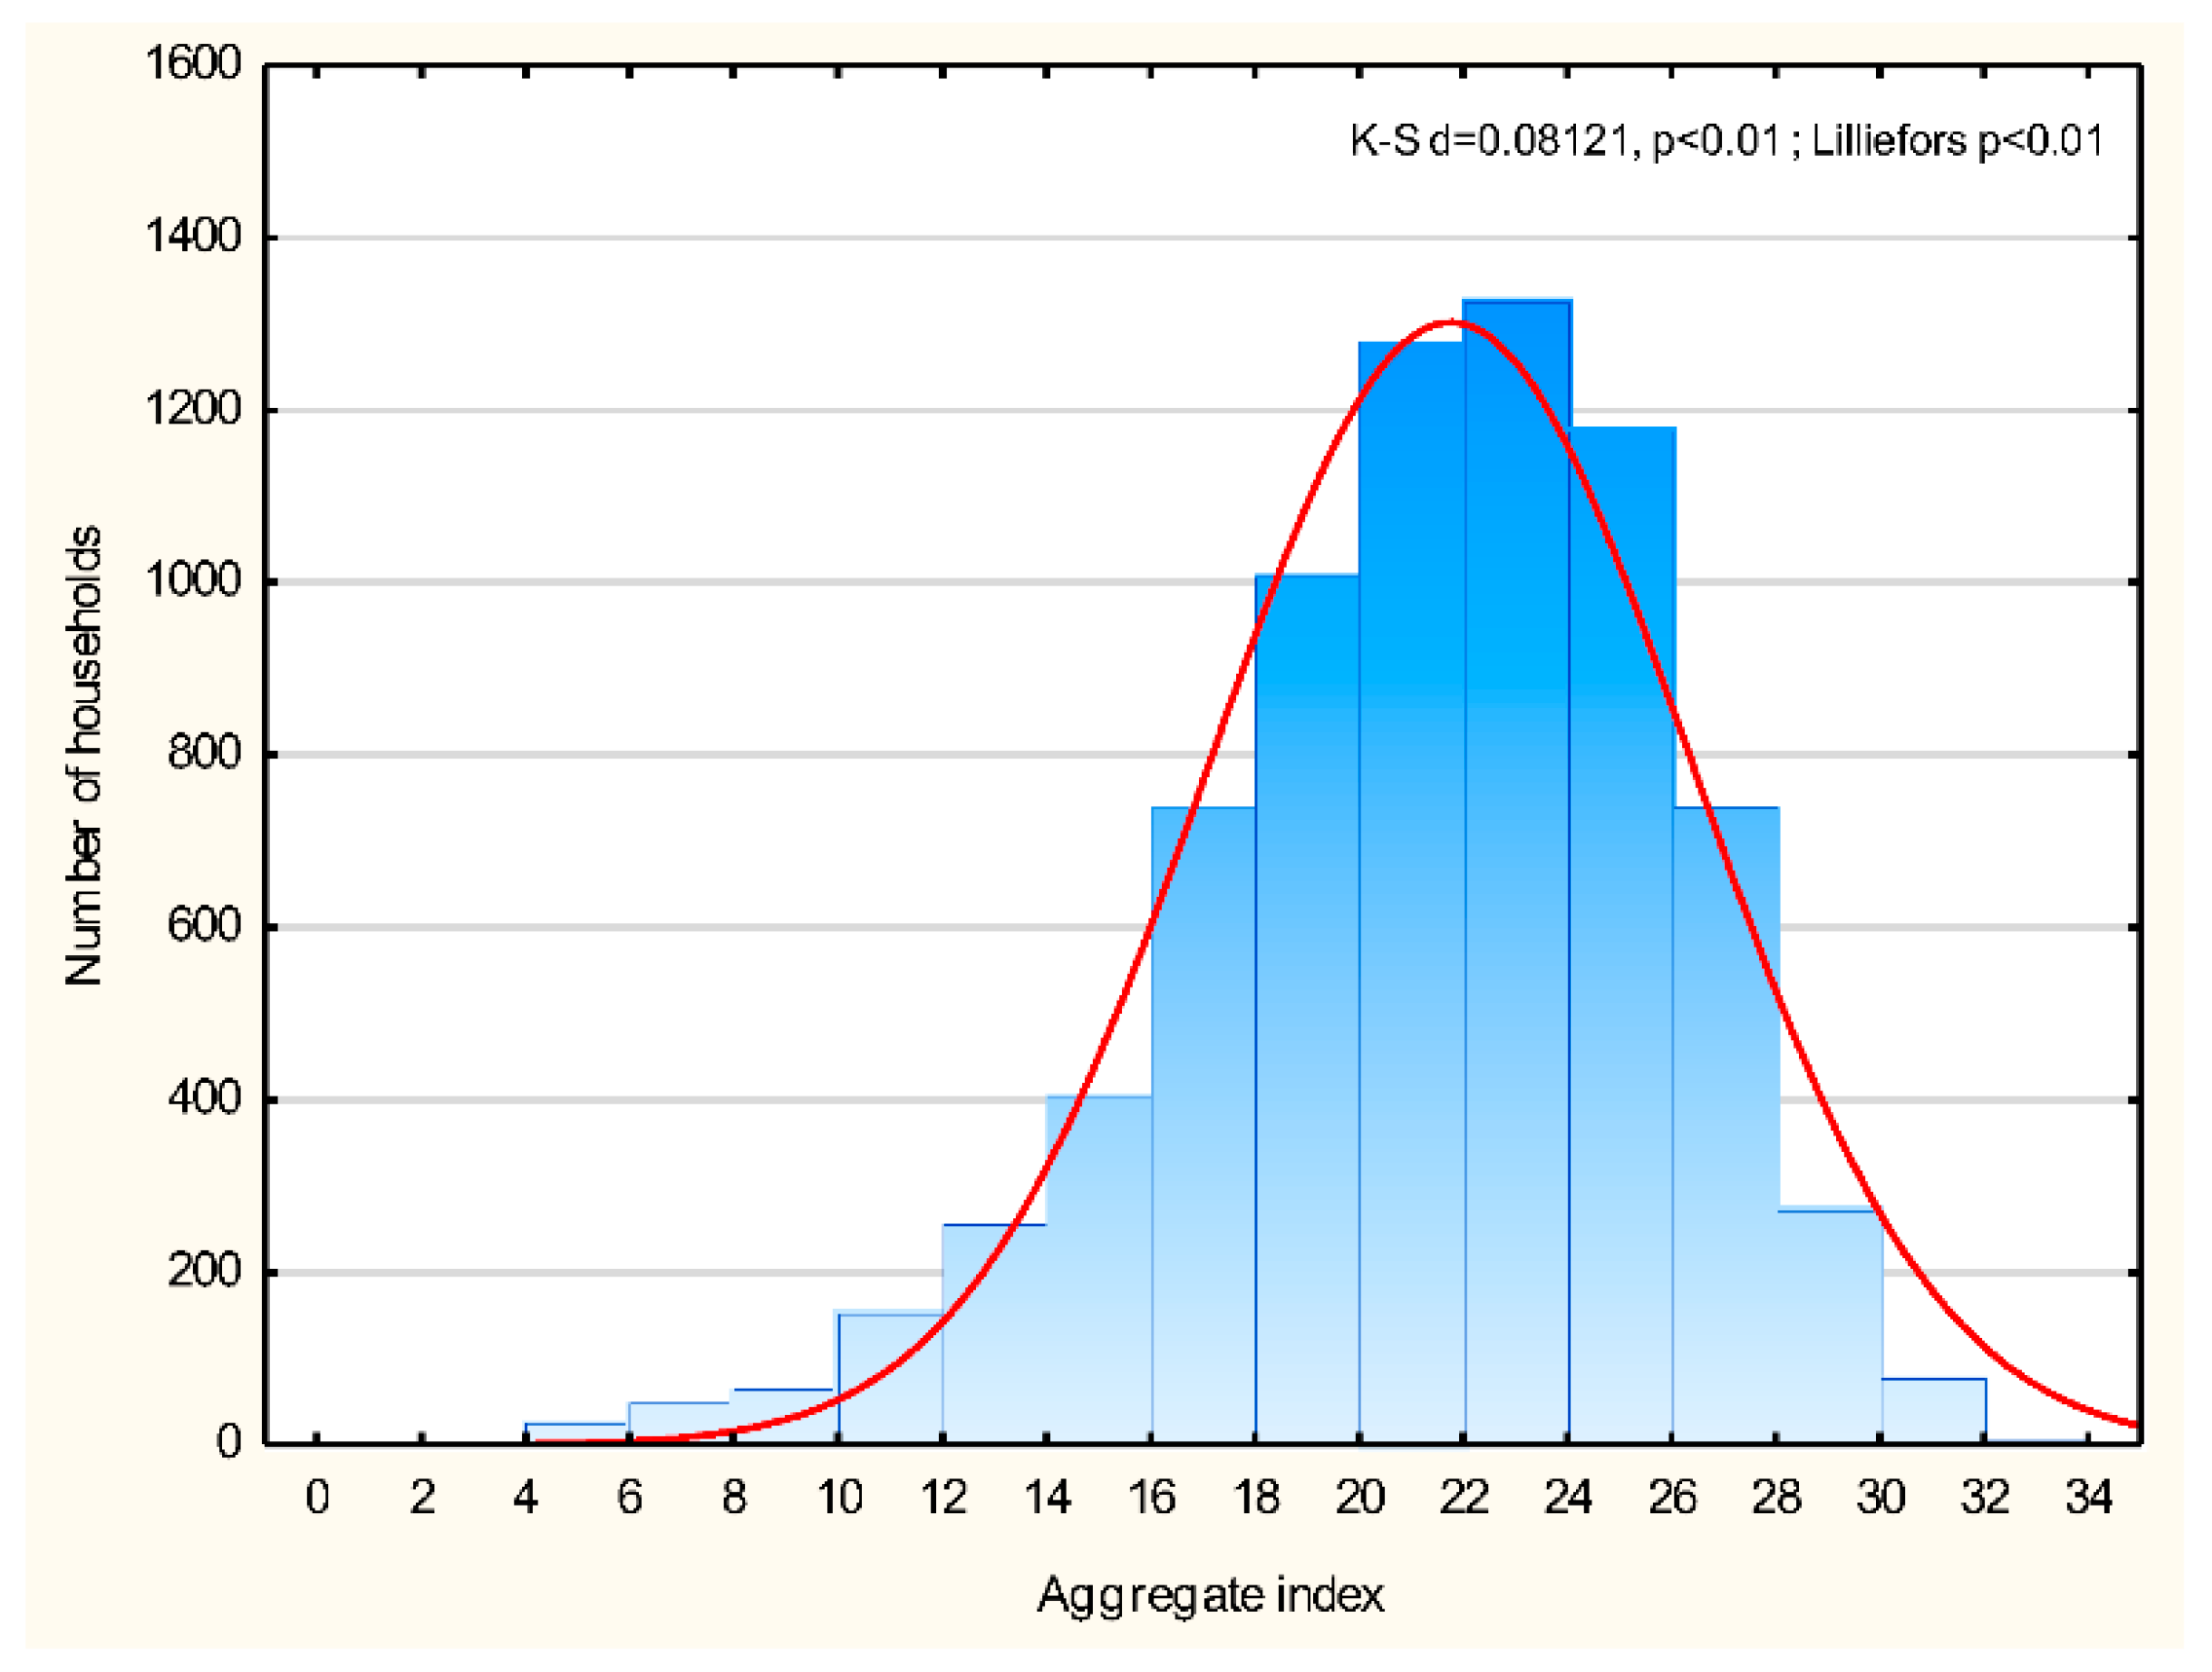
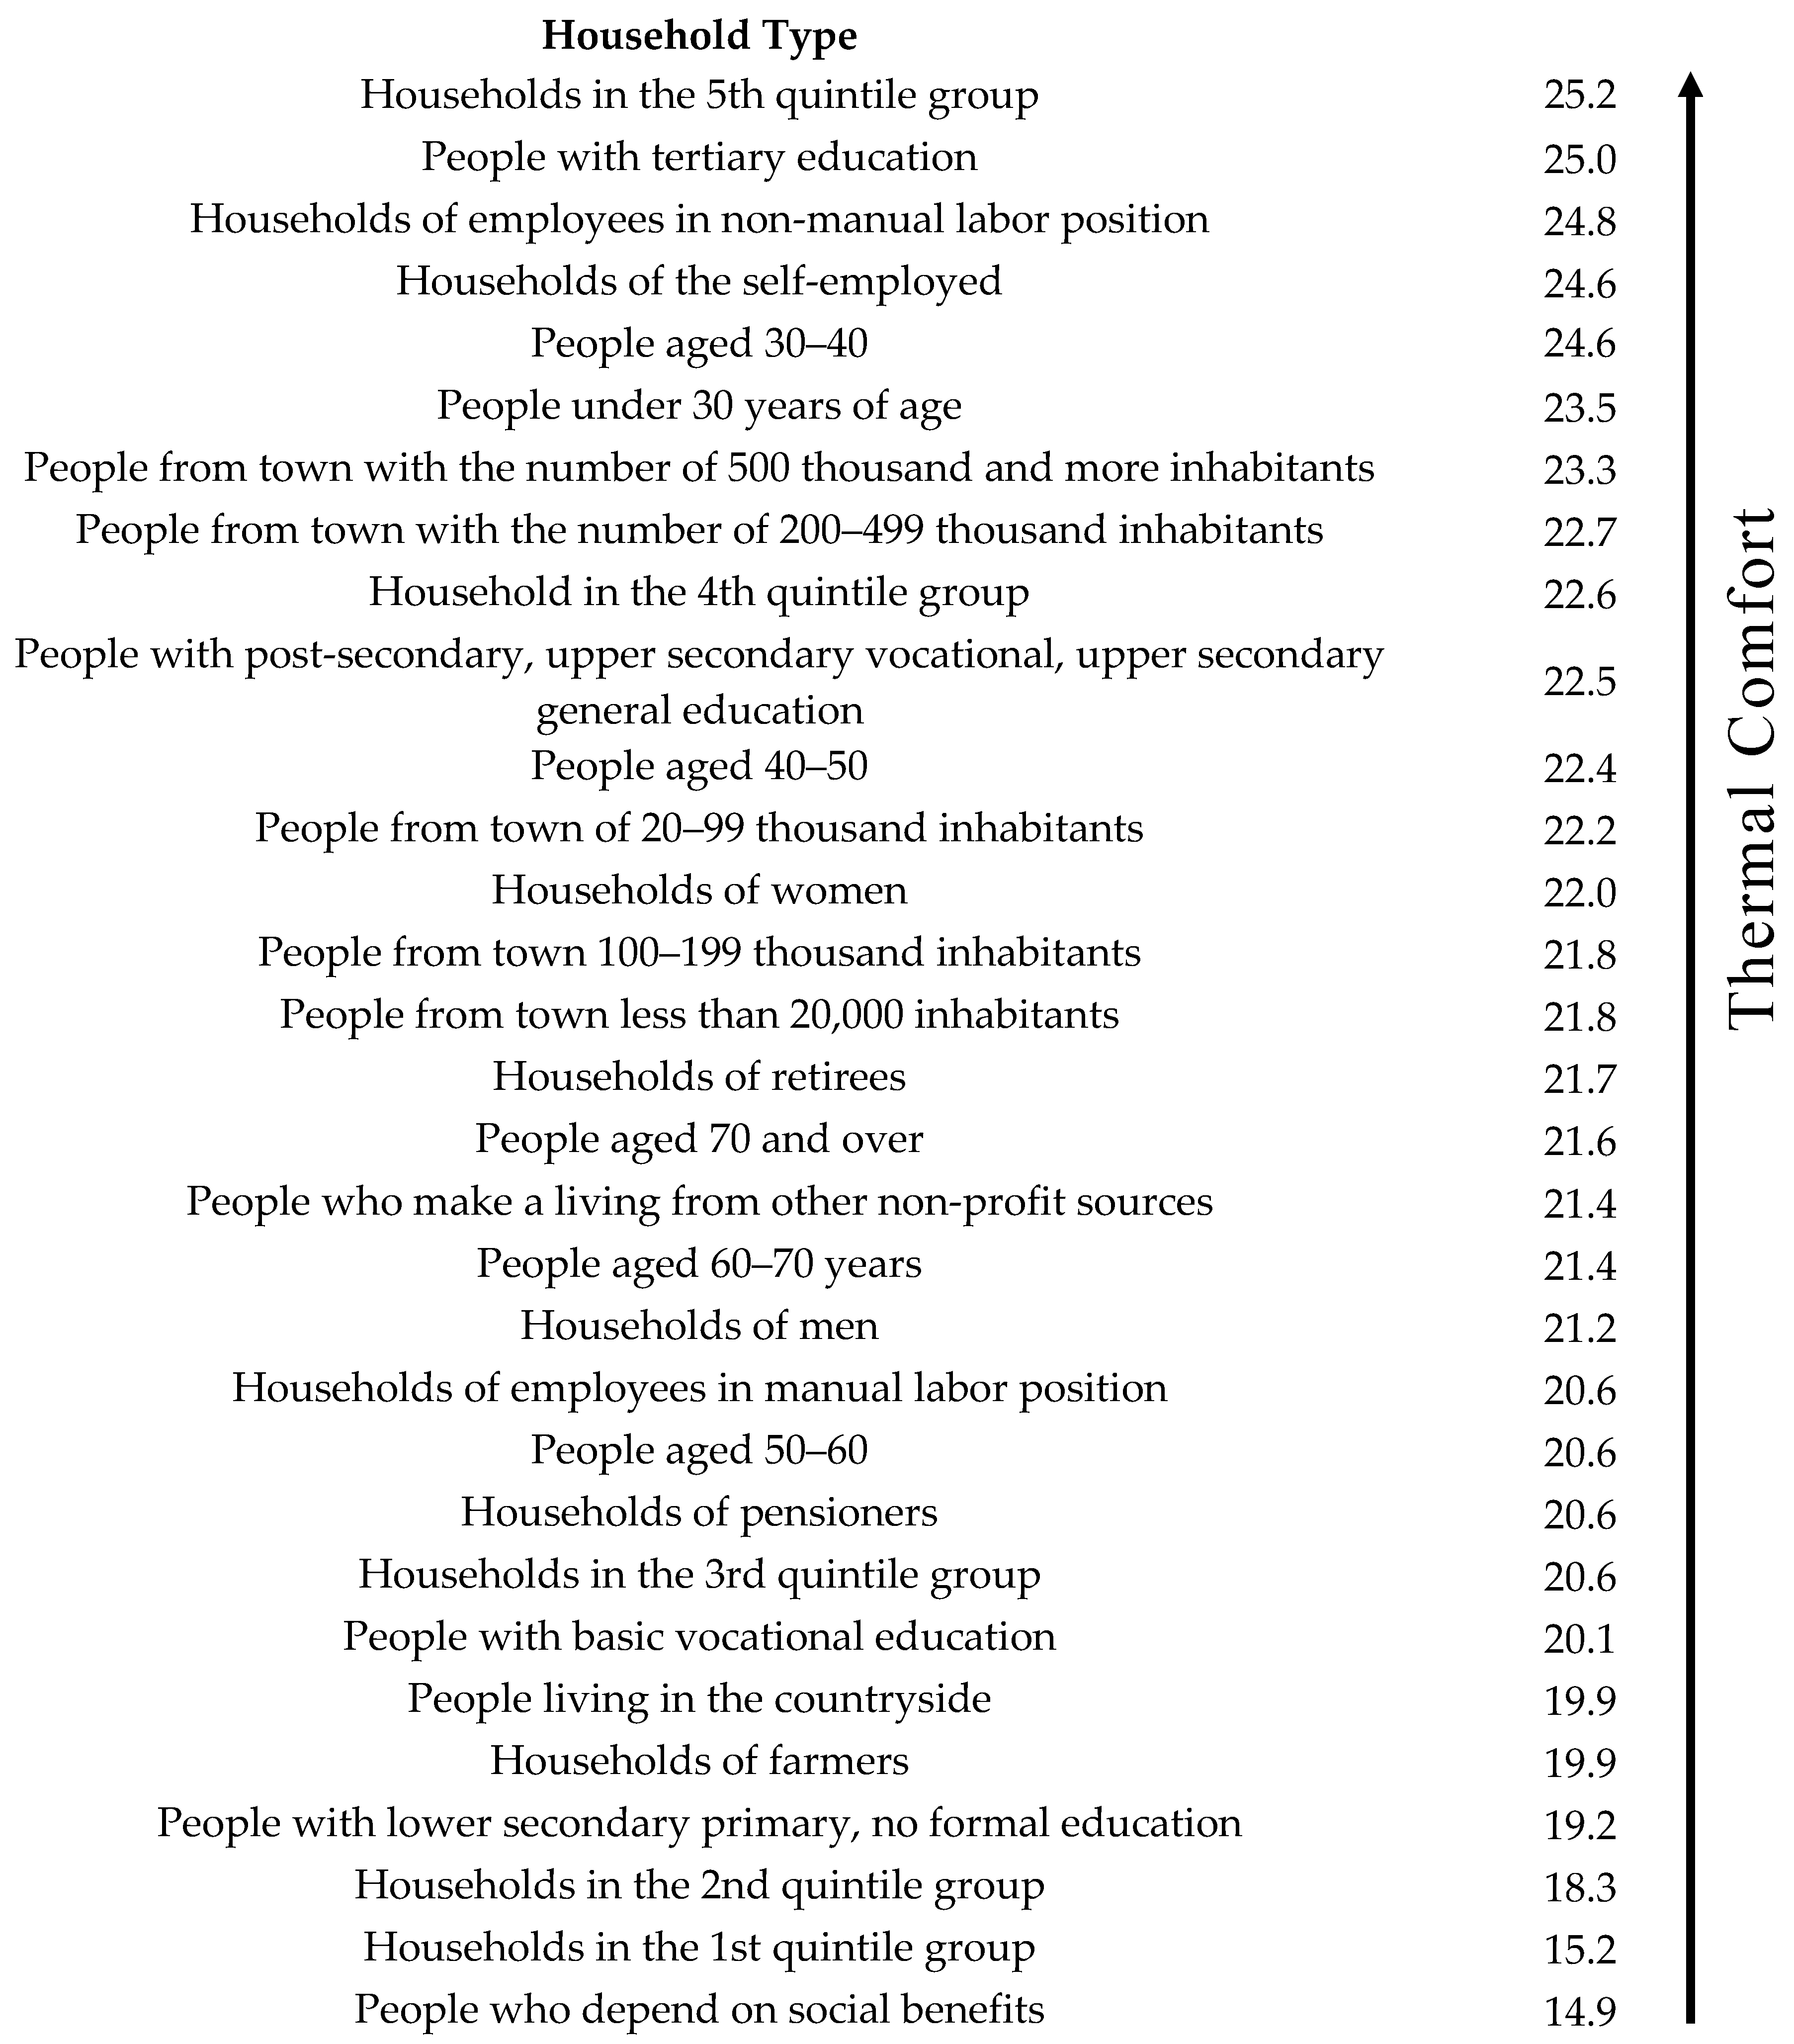
The distribution of the aggregate index turned out to be similar to the normal distribution, although the Lilliefors distribution normality test formally rejected the normality hypothesis. This may be due to a large sample considered in the study, in which even small deviations from normality are considered significant. The aggregate distribution of the indicator showed that the largest share of one-person households obtained from 22 to 24 points, while the highest aggregate index amounted to 34. The distribution of the indicator was characterized by a slight left-hand asymmetry (asymmetry coefficient = −0.59), which means that for a slightly larger number of single-person households, the aggregate energy poverty index has values above the average, i.e., which are higher than 21.8 (Figure 6).
The highest level of the aggregate indicator was obtained in the case of single-person households with the highest income level (20% of people with the highest income), run by individuals with higher education, earning their living holding a non-manual position or being self-employed, and also among young people up to 40 years of age. In these types of households, the level of the aggregate indicator was estimated at 24 points or more.
Low aggregate values of the indicator were received in the case of single-person households of people living on social benefits, with low disposable income (the first and second quintile groups), people with primary or lower secondary education, and those living in the countryside and supporting themselves relying on income from agriculture. The level of the aggregate indicator for these types of households did not exceed 20 points. The characteristics of the households such as living on social benefits, with low income, with a low level of education and living in the countryside appear to be symptoms of energy poverty. In rural areas, the maintenance of large houses tends to be burdensome for older people living alone (Scheme 1).
The results also showed that women running one-person households had higher thermal comfort than men. That is quite an interesting observation. It is worth adding, women predominated in the structure of Polish one-person households. Almost 71% of all one-person households were run by women, including 72% by women aged 60 and more.
The multiple regression method was used to carry out the overall analysis of the energy poverty factors. The model also included quantitative and qualitative explanatory variables. Qualitative variables were transformed into 0–1 variables. As a result of descending stepwise regression, at each stage, the author of the study eliminated one variable. The variable which was eliminated was the one with the highest p value while meeting the condition of p > α (α = 0.05). The estimated model accounted for 36.5% of the variability of the original dependent variable. The remaining share of the variability resulted from the effects of other variables not included in the study as well as the random component. Thus, it emerges once again that research into energy poverty is a multi-dimensional problem. The average difference between the observed values of the dependent variable and the theoretical values for the presented model was 3.70. The value of the F statistic and the corresponding p test probability level confirm a statistically significant linear relationship (F (20.7546) = 216.89, p < 0.0000) (Table 4). Moreover, the values of the t-statistics indicate that the constant term and regression coefficients are significantly different from zero. Differentiation with regard to the thermal comfort in one-person households was best explained by belonging to a socio-economic group, and subsequently by the level of education and the amount of disposable income indicated by the respondents. The factors such as unemployment, disability, age, and being male contribute to the increased risk of energy poverty. Lack of professional activity and disability have a negative effect on the quality of life [55], which also includes energy poverty. The regression results indicated that the probability of being in the group of people experiencing energy poverty grows in line with age.
On the basis of the analyses conducted by the author, it can be concluded that the group which is exposed to the risk of energy poverty shares certain characteristics. The factors such as socio-professional and income situation of the household, the level of education, sex, age and marital status, place of residence, and disability may contribute to the fact that a particular household may find itself in energy poverty.
Factors determining the comfort associated with energy carriers in Polish one-person households are illustrated Scheme 2.

4.3. Patterns of Consumption of Energy Carriers in One-Person Households

The application of cluster analysis using the k-means method led to distinguishing of four consumption patterns of energy carriers and, subsequently, to the identification of four groups of one-person households.
The largest group, (Group I), the so-called “modest, energy-satisfied group” (the group which was satisfied with meeting their energy requirement), was represented by the relatively oldest people, whose average age was estimated at 64.1 years. People up to 50 years old constituted less than a 15% share of this group. They were mainly widowed (59%) or they have never married (22%). A relatively low percentage of people in this group declared having higher education (about 15%), and relatively the largest number of people, i.e., over 52% of the share declared having basic vocational or lower education level. Pensions were the main source of income in over half of the households considered in the study. The first group included individuals living mainly in small towns or villages, i.e., villages (40%) and towns up to 99,000 inhabitants (33%) (Table 5). The pattern of consumption of energy carriers corresponding to the group of people with the characteristics presented above was as follows. These were one-person households with an average level of expenditure on energy carriers, which constituted a relatively high share in their disposable income (14.9%). Relatively low percentages of respondents indicated a lack of thermal comfort in their flat or house in winter and summer. A relatively low percentage of respondents also indicated lack of hot running water. Over 81% of respondents stated that they had a central heating system in their place of residence (e.g., from a heat and power plant, boiler house), nearly 14% used a solid fuel heater, and about 5% an electric furnace. Over three-quarters of people from the first group positively evaluated the fulfillment of the needs related to the timely payment of flat/house fixed costs, including the energy used. Satisfying this need was assessed negatively by slightly over 4% of respondents. In this group, more than half of people lived in multi-family buildings, and about 41% in detached single-family houses. In the first group, the average floor area was estimated at 69 m2, which indicates that these people had large flats or houses (Table 6). It can be concluded that in more than half of the single-person households of the analyzed group, there appeared extra square footage. According to the double criterion of Parker Morris (In the publication “Homes for today and tomorrow”, Department of the Environment, HMSO 1961 Parker Morris Standard was 33.0 m2.) [59], a single-person household has excess space if the floor area of his apartment exceeds 66 m2 [19].
In the second group (Group II, N = 2305), known as the “energy-satisfied” group, the average age of respondents was estimated at 58.7 years, and relatively many people, compared to the other groups, were up to 50 years of age (nearly 27%). About one-third of the respondents have never been married before (singles). Relatively many of the survey participants included in this group declared having higher education, almost one-third, or indicated having secondary education (42%). Every fourth person declared having basic vocational education level or lower and it was the smallest percentage of all examined groups. In the case of a quarter of the individuals surveyed in the study, the main source of income was being employed in non-manual positions. The second group included the highest share of individuals living in the largest cities, i.e., with 500,000 or more inhabitants (36%). It may be stated that the pattern of consumption of energy carriers in this group turned out to be favorable. In the case of “energy-satisfied” households, the findings of the study have shown the highest expenditure on energy carriers and a relatively low percentage of expenditure on energy carriers in disposable income. This fact results from the highest disposable income achieved by members of these households. The flats of people in the second group were primarily centrally heated. Nearly 97% of the representatives of these households had access to hot running water, and the building standard was assessed at a very high level (over 70%). This has probably contributed to better satisfaction of the needs related to the thermal comfort of the flat/house. The majority of people in the second group pointed out that their level of satisfaction of the needs related to the timely payment of housing fees was good and rather good. Their flats were statistically the smallest of all groups (49.4 m2) and they were located in multi-family buildings (nearly 97%), built in the 1960s or later (Table 5 and Table 6).
The third group (Group III, N = 716), which is referred to as “energy-unsatisfied”, was made up of relatively young people, where the average age was estimated at 58.5 years. More often than in other groups, these people have never been married (over 34%) and relatively often lived in cities with more than 500,000 inhabitants (34%). The pattern of consumption of energy carriers in this group was characterized by the lowest expenditures on energy carriers and these expenditures constituted the smallest share in disposable income in comparison to other groups (10.5%). Their disposable income amounted to slightly more (PLN 2090) than the average for all one-person households (PLN 2059). The comfort related to the temperature in the flat or house was unsatisfactory for a significant share of respondents included in this group. They declared that their homes were too cold in winter (over 63%) and too warm in summer (97.8%). A relatively high percentage of respondents (approximately 17%) indicated that there is no hot running water in their flat/house. More than 82% of the flats/houses were centrally heated and approximately 14% of the survey participants in this group had a fuel stove installed. A slightly higher percentage of people in the third group, compared to the first and second group, declared poor satisfaction of the needs related to timely payment of their housing fees (approximately at the level of 8%). Three quarters of the individuals who were included in this group lived in a multi-family building, and every fifth person lived in a detached single-family house. The presented characteristics suggest that individuals in these households are at risk of energy poverty; however, this assessment is mainly subjective in nature. Although respondents included in this group, i.e., “energy-unsatisfied” (the group which was not satisfied with meeting their energy requirement), achieved incomes at the level which was evaluated as above average, the unmet energy needs (most often related to the low energy efficiency of the building and devices used and/or the experienced high energy prices) caused that they were exposed to energy poverty (Table 5 and Table 6).
On the basis of the characteristics of individuals who make up the energy-satisfied and energy-unsatisfied groups, it can be stated that they are similar in terms of demographic and socio-economic characteristics. Respondents from both groups shared certain characteristics, e.g., related to age, as in both cases, the groups included the highest percentage of people under 30. More often than in other groups, these people have never been married before. In both groups, a relatively high percentage of survey participants lived in the largest cities; although, in the group which was unsatisfied in terms of their energy-related needs, a relatively high percentage of respondents also lived in villages. The characteristic feature which distinguished the group of energetically satisfied households was also a higher share of individuals with a secondary or higher level of education (Table 5 and Table 6). Perhaps the aspirations of people forming the group of energy dissatisfied households were relatively high: the factors related to slightly lower disposable income and a larger size of flats than in the group of energy-satisfied individuals prevented them from achieving the expected standard. This might account for the much lower level of satisfaction of the needs related to the thermal comfort indicated by the respondents making up this group. Studying the influence of housing conditions on the mental well-being of older people, Schwirian et al. [60] found that the subjective assessment of housing conditions is more important for a person’s mental and psychological well-being than the objective characteristics of the house or apartment.
In the fourth group (Group IV, N = 545), known as “energy poor” (the group which was not able to meet their basic energy requirement), the group of young people was relatively the smallest, i.e., less than 7% of respondents were up to 40 years of age. The smallest share, 31%, declared having secondary and higher education, and the largest percentage indicated their education level as lower secondary school or below—40%. The largest share of individuals lived in the countryside—over 40%, and relatively few people, which is nearly every fourth person, lived in large cities with over 200,000 inhabitants. The consumption pattern of energy carriers has shown unfavorable parameters. The households which were energy poor recorded the highest energy expenditure of all groups as well as the highest percentage of this type of expenditure in their disposable income. Nearly a quarter of the household budget was allocated to energy carriers. These households indicated the lowest disposable income and the lowest consumption expenditure. In energy-poor households, many people complained about discomfort related to the temperature in their houses or flats. More than three-quarters of respondents stated that the flat was not warm enough in winter, and every fifth respondent claimed that the flat was not cool enough in summer. About 28% of respondents pointed out that they did not have hot running water. Compared with other groups, the highest share of energy-poor households received a housing allowance (approximately 5% of the group). Over three-quarters of households owned a solid fuel heater, which is perceived as the least convenient way to heat a flat/house. A relatively highest share of examined individuals declared poor or average (nearly 39%) satisfaction of their needs related to the timely payment of housing fees. More than half of the households were staying in multi-family buildings and over 40% in detached single-family houses, i.e., the type of the structure similar to the structure of buildings indicated by the first group. The largest group of these buildings (nearly 58%) was built before 1946, which means that they are relatively old buildings. Some of them (39%) complained about leaking roofs, damp walls or floors, decaying windows or walls. It is important to note at this point that the condition of the apartment can adversely affect people’s health. Krieger and Higgins [61] described the impact of poor housing conditions on health problems. Homes with damp or moldy walls and poor heating are the causes of chronic respiratory illnesses or recurring headaches. Inadequate temperature (too low or too high) contributes to cardiovascular problems. In addition, dissatisfaction with housing conditions can adversely affect the mental condition of individuals exposed to them. The data from Poland [62] suggest that the lack of heating has a particularly negative effect on people who are already weak or sick, while the dampness can also negatively affects healthy people. In comparison with other groups, in the group of energy-poor households, a greater share of respondents expressed dissatisfaction with meeting their health-related needs. Almost every third person assessed the satisfaction of their health needs as low and rather low, while for the total of respondents this share amounted to 15%. Thus, it emerges that the claim that the condition of the apartment affects health is confirmed.
People from the energy-poor group were similar to people from the first group with regard to age, marital status, and place of residence. Both groups consisted of relatively elderly people, widowed, and living in the countryside or in small towns. Both groups included respondents with the lowest disposable income. The feature which distinguished single-person households from both groups was their level of education, as a slightly larger share of better educated people could be found in the first group. In the first group, the residential buildings were newer. More than half of the houses or flats in this group were built in the 1960s and later, while in the fourth group most of residential buildings were built before 1960. In the group of energy poor survey participants, the most common type of heating was a fuel stove, and in the first group the respondents indicated that they used central heating. These differences probably impacted the diversification of expenses and the level of satisfaction with the use of energy carriers in both types of households.
There exist certain institutional indicators that determine the availability of energy that provides minimum living conditions for household members. Every year, in Poland, the Institute of Labor and Social Studies (ILSS) publishes the subsistence level indicator, which includes housing and energy expenses. The minimum subsistence is an indicator of the cost of living of households at risk of poverty. The scope and degree of satisfied needs at a minimum subsistence level should provide such conditions as to enable a person at every stage of their development to regain energy and life forces, have and raise children as well as maintain social relations [63]. In the of minimum subsistence goods and services basket, the level of expenses allocated to maintaining a flat or house and covering the costs of energy carriers for one-person households accounts for approximately 30% of the total subsistence basket. In 2016 the value was established at nearly PLN 340, and in 2019 it was estimated at around PLN 355. Energy expenditure accounts for approximately 20% of the subsistence basket. In energy-unsatisfied households, the level of expenditure on energy carriers was lower than that determined by the ILSS.
Another guideline is related to the requirements regarding housing construction. According to the ordinance of the Polish Minister of Infrastructure and Construction, a flat should have a usable area of at least 25 m2 [64]. In all groups, the average usable area exceeded 25 m2. The results of the analysis for all single-person households indicated that 5.1% of people owned or rented flats which are smaller than 25 m2. An excessive size of a flat may also be a reason for concern, since it leads to high living costs: taking into consideration a low income level achieved by a particular household it can lead to energy poverty. In the entire population of people running one-person households, nearly every tenth person owned an apartment of 100 m2 or more. On the other hand, almost every fourth person owned a flat which was larger than 66 m2. Thus, it emerges that, according to the double criterion of Parker Morris, these households were characterized by excess space.
The minimum conditions for housing are also set by international institutions. A commonly used standard, which is in line with WHO guidelines, is the temperature established at 21 degrees Celsius in the rooms where a particular person is staying, and 18 degrees Celsius in other rooms in the flat, e.g., the hall [65,66,67] as well as the possibility of using lighting and household appliances to the extent which is deemed necessary for every day, normal functioning. The presented data do not provide information on the temperature recorded in residential premises, but the analysis of the satisfaction of needs shows that a significant proportion of people from the energy-unsatisfied and energy poor groups indicate a lack of thermal comfort in their apartments, both in winter and summer. The abovementioned standards are applied to ensure a dignified life for all people in a particular community.

5. Discussion of the Findings

Energy poverty may be influenced by high energy prices, low incomes as well as energy inefficiency of housing or irrational management of energy sources in households [68,69,70]. The author’s own research confirms the strong influence of the income situation on the risk of experiencing energy poverty. The professional circumstances and the income situation associated with it were the most important determinants of energy poverty in the context of Polish one-person households. People with low incomes and those living in older, less energy-efficient properties were more likely to be exposed to energy poverty. This study provided no answer to the question concerning respondents’ attitudes to the use of energy carriers. Among the selected groups of households, some individuals were identified as energy-satisfied. Further research could be carried out to examine the group in terms of efficiency and savings in using the available energy.
It should also be emphasized that, on average, one-person households use more energy per person in comparison to households including more persons. In this context, it is important to note that the growing number of one-person households and their improving income situation may slow down the process of achieving a sustainable pattern of consumption and production [2,71]. This fact emphasizes the necessity to analyze the consumption patterns of energy carriers in one-person households.
Miazga and Owczarek [18] demonstrated that electricity and energy carriers are standard goods, and that their share in the consumption structure decreases with increasing income, which is confirmed by the presented research. The studies carried out by Miazga and Owczarek [18] showed that energy poverty is strongly correlated to prices, income, and housing, and is less dependent on the aging of the population. As mentioned previously, in the study conducted by the author, energy expenditure was primarily influenced by disposable income and professional status of the respondents. However, the impact of changes in prices on the share of energy expenditure in the budgets of single-person households was not shown.
Thus, it emerges that the findings of the research presented in this paper are consistent with the results of the studies carried out by Aristondo and Onaindia [1], who surveyed respondents living in Spain. The researchers were able to demonstrate that the level of energy poverty is higher in sparsely populated areas than in densely populated ones, as well as among individuals with lower education level, unemployed, or working part-time jobs. On the other hand, in contrast to the presented study, which showed that men were more exposed to energy poverty, in Spain women more frequently claimed that they tend to experience discomfort related to energy carriers more acutely. The literature increasingly emphasizes the relationship between sex and energy consumption [72]. On the one hand women have less access to and control over energy, on the other hand women are often presented as being at the forefront of addressing energy related concerns such as climate change [73].
The author’s own study confirmed that the elderly, widowed, and those with a low level of education constituted the group which was the most exposed to energy poverty among the representatives of population forming one-person households. Simcock [74] points out that the risk related to suffering from energy poverty is particularly high in the case of people who are dealing with a combination of the abovementioned factors. In addition, people using private rental services frequently need to face additional challenges as they have limited opportunities to improve the energy efficiency of the building structure, heating system or the equipment which is installed in their flat or house.
The research conducted by Aristondo and Onaindia [1] showed that the highest values related to energy poverty were recorded in the case of people living in terraced and rented houses. The findings of the present study show that no statistically significant correlation was found between the type of building and energy poverty, although in the group of energy poor, terraced houses were slightly more frequently indicated by the respondents as their places of residence than in the group of energy-satisfied survey participants.
The experience of difficulties in covering expenses connected with heating a flat and other necessary energy expenses, related to, e.g., lighting or cooking, may lead to negative health consequences, which are widely described in the literature on the subject [75,76,77]. Spanish researchers [1] noted that people with very poor health are at greater risk of energy poverty. Energy poverty affects people’s health and mental well-being, because it can cause stress, anxiety, and depressed mood [78], poor physical health [79], and in extreme cases, hypothermia of a body or a cold leading to death. In the households with a higher energy poverty rate, people complained about their health more often [80], which is also confirmed by the author’s own research discussed in this article.
The problem and negative consequences of energy poverty may be limited by implementing appropriate policies supporting thermal modernization of buildings [18]. The available EU funds allocated to improving energy efficiency of housing provide financial support to households. The co-financing possibilities offered in Poland with regard to modernizing heating installations, thermal insulation of buildings and photovoltaic micro-installations under the Clean Air programme amount to 60% of investment costs for poorer households, and 30% for wealthier households. The costs of modernization of buildings related to the improvement of thermal efficiency are relatively high compared to the income of the poorest people. The problem of energy poverty is mainly encountered in rural one-person households of elderly residents. The retirement pension obtained from agricultural social insurance in Poland does not exceed PLN 1000. Assuming the cost of an average building renovation investment which is estimated at PLN 25,000 PLN and the costs of co-financing from EU funds at the level of 60%, the household’s own contribution amounts to the equivalent of over 10-fold monthly pension of a potential investor. Unfavorable income situation and difficulties in “making ends meet” [55] often pose an obstacle in the process of relieving individuals from energy poverty. On the other hand, in the case of a group of the so-called energy-unsatisfied individuals, whose incomes were relatively high, the share of expenditure on energy carriers in disposable income was low, and meeting the thermal comfort needs at home is far from satisfactory. Therefore, further research is required to answer the question of what shape the thermal modernization policy should take in order to alleviate energy poverty most effectively.
The issues related poverty and social exclusion are the domain of the governing authorities. Supporting the necessity to liberalize the energy market in Poland, it is important to stress that the state cannot cease to perform regulatory functions in relation to the energy sector. What is more, it should strengthen these regulatory functions, which will allow for the protection of the recipients who are economically weak [81].
There were limitations faced while conducting this study. The presented method uses data available in the databases of the statistical office. The large number of household cases is very valuable to the researcher. However, additional qualitative research could extend the presented research problem and more precisely define people at risk of energy poverty. Secondly, the chosen economic, sociodemographic, and dwelling-related explanatory variables represent a limited subset of the determinants that are likely to influence energy satisfaction. While providing evidence of consumption heterogeneity among similar households at risk of energy poverty, the results do not account for the broad spectrum of the underlying drivers shaping energy satisfaction.

6. Conclusions

In Polish one-person households, the share of expenditure on energy carriers is decreasing every year as a result of the improving income situation. In the poorest single-person households, this situation improves at the slowest rate, and the level of income is the most important determinant impacting the degree of satisfaction of energy needs of members of one-person households. Social factors, such as the level of education and the fact of holding non-manual positions, are strongly related to the level of expenditure on energy carriers and the degree of satisfaction of the needs related to the thermal comfort.
The energy deprivation of Polish one-person households seems to occur mainly among specific socio-professional groups represented by people with a low level of education, farmers, pensioners, people with low income and those living in the countryside. The analyses included in this study, also showed that the possibility to perceive energy poverty only through the prism of income-based indicators can result in the failure to identify all people who are energy poor. The findings of the survey indicated that in some one-person households, despite a low share of energy expenditure in disposable income and a relatively favorable income situation, people reported a high degree of unsatisfied needs related to the thermal comfort in their flat/house.
On the basis of the conducted research, it should be stated that the shaping of the share of expenditure on energy carriers in disposable income in Polish one-person households in the period of 2000–2018 was primarily influenced by an improvement in the income situation. However, the impact of changes in prices on the share of expenditure on energy carriers in disposable income was not indicated. Along with the improvement of the financial situation of Polish one-person households, the relative level of expenditures in disposable income decreases, which may point to the increasing comfort of people in terms of the use of energy carriers. However, as the results of the present study suggest, in the case of the poorest one-person households, the situation in this respect improved at the slowest rate. Thus, the research hypothesis no. 1 was only partially confirmed. The shaping of the share of expenditure on energy carriers in the income of members of one-person households in 2000–2018 was influenced by an improvement in the income situation. However, no correlation was found between the share of expenditure allocated to energy carriers in disposable income and the increase in energy prices.
Building an aggregate index, using three characteristics related to energy carriers (income situation of a household, energy efficiency of buildings, and level of satisfaction in terms of consumption needs), allowed for establishing a hierarchy of Polish one-person households according to the objective and subjective satisfaction of the needs related to energy carriers in their households. The types of one-person households particularly vulnerable to energy poverty were individuals who had a number of different characteristics. The group included individuals who were unemployed, disabled, with low disposable income, with a low education level, living in the rural areas as well as elderly people. In turn, the richest people, with higher education, working in non-manual positions, up to 40 years of age, were characterized by the highest level of objective and subjective satisfaction of the needs related to energy carriers. Hypothesis 2 stated that the socio-economic characteristics of members of one-person households exert the strongest influence on the risk of being included in the sphere of energy poverty.
In general, women running single-person households had higher thermal comfort than men. One-person households run by men were more often qualified to groups with energy discomfort. However, in absolute terms, there were more women who could be at risk of energy poverty.
Polish one-person households can be divided into four groups according to the expenditure on energy carriers and meeting their needs related to thermal comfort. The labels assigned to particular groups were as follows: modest and energy-satisfied, energy-satisfied, energy-unsatisfied and energy-poor. Each of the groups was characterized by a different pattern of consumption of energy carriers. Objectively, elderly persons from rural areas, widowed, those with a low level of education, living in older, large buildings, heating their houses or flats with a solid fuel stove turned out to be a group which was most exposed to the risk of energy poverty. The author also identified another group of people who were characterized by high unmet needs related to thermal comfort. Interestingly, this group was also exposed to energy poverty despite favorable assessments in terms of their disposable income or the share of expenditure on energy carriers in disposable income. If the needs are not satisfied, the quality of life tends to deteriorate, which has a negative effect on both mental and physical health. The conducted research revealed that the assessment of energy poverty based solely on the threshold of 10% of expenditure on energy carriers in disposable income may prove insufficient. People who are energy poor, as subjectively assessed by them, may not be included in this group according to objective parameters. On the basis of the conducted research, it can be stated that the third research hypothesis is correct. Objective and subjective indicators related to the use of energy carriers in a household determine the heterogeneity of consumption patterns of these energy carriers in households run by one person.
The conclusion of the analysis is the indication of the existence of diversified patterns of consumption of energy carriers in Polish one-person households, as well as differences in terms of the reasons for energy poverty among single-person households. The most important factors influencing energy poverty in one-person households, apart from the income situation, are the social and professional characteristics of household members. The presented findings show that energy deprivation tends to occur among the elderly, as well as in rural regions where housing is larger, older, and of a lower standard.
As far as methodology is concerned, it should be stated that the designed aggregate index and the use of regression analysis and cluster analysis in order to identify objective and subjective conditions related to energy carriers (consumption patterns) in single-person households produced promising results. The research findings not only confirmed some of the previous conclusions of other researchers, but they also revealed further problems related to the use of energy carriers in households. The analysis of household budgets also led to the observation that there is no data concerning the insulation of buildings and the airtightness of windows and doors among the data on households collected by statistical offices. It would be reasonable to include questions related to these aspects in questionnaires addressed to household members.
Further research should conduct in depth qualitative analysis to quantify the factors that could possibly affect household energy consumption and could affect energy comfort.
This article covers a new research area as it presents the situation of energy poverty in Polish one-person households for the first time. The findings discussed in this article should have important implications for future activities and best practice in terms of addressing the problem of energy poverty, both in Poland and other developed countries. Considering the fact that one-person households play an increasingly important role in modern societies, the study results should also induce and support further research carried out among the representatives of this part of the population.

Funding

This research was funded by Warsaw University of Technology” and “The APC was funded by Warsaw University of Technology.

Conflicts of Interest

The authors declare no conflict of interest.

References

  1. Aristondo, O.; Onaindia, E. Counting energy poverty in Spain between 2004 and 2015. Energy Policy 2018, 113, 420–429. [Google Scholar] [CrossRef]
  2. United Nations, Department of Economic and Social Affairs, Population Division. Patterns and Trends in Household Size and Composition: Evidence from a United Nations Dataset 2019 (ST/ESA/SER.A/433); United Nations: New York, NY, USA, 2019. [Google Scholar]
  3. Final Consumption Expenditure of Households by Consumption Purpose (COICOP 3 digit) [nama_10_co3_p3], Eurostat. Available online: https://appsso.eurostat.ec.europa.eu/nui/show.do?dataset=hbs_str_t211&lang=en (accessed on 2 July 2020).
  4. Rutkowski, J.; Sałach, K.; Szpor, A.; Ziółkowska, K. Jak Ograniczyć Skalę Ubóstwa Energetycznego w Polsce. (How to Reduce the Scale of Energy Poverty in Poland) Instytut Badań Strukturalnych. 2018 Policy Paper. Available online: http://ibs.org.pl/publications/jak-ograniczyc-skale-ubostwa-energetycznego-w-polsce/ (accessed on 28 February 2018). (In Polish).
  5. Legendre, B.; Ricci, O. Measuring fuel poverty in France: Which households are the most fuel vulnerable? Energy Econ. 2015, 49, 620–628. [Google Scholar] [CrossRef] [Green Version]
  6. Belaïd, F. Exposure and risk to fuel poverty in France: Examining the extent of the fuel precariousness and its salient determinants. Energy Policy 2018, 114, 189–200. [Google Scholar]
  7. Kurowski, P. Ubóstwo energetyczne w Polsce na podstawie badań GUS z 2008 r. (Energy poverty in Poland on the basis of the CSO research from 2008.). Polityka Społeczna 2011, 27, 17–22. [Google Scholar]
  8. Statistics Poland. Household Budget 2018; Statistics Poland: Warsaw, Poland, 2019.
  9. Ortiz-Ospina, E. The Rise of Living Alone: How One-Person Households are Becoming Increasingly Common Around the World. Our World in Data. Available online: https://ourworldindata.org/living-alone (accessed on 30 July 2019).
  10. General, A. Transforming our World: The 2030 Agenda for Sustainable Development. General Assembly; United Nations: New York, NY, USA, 2015. [Google Scholar]
  11. Boardman, B. Fuel Poverty: From Cold Homes to Affordable Warmth; Pinter Pub Limited: London, UK, 1991. [Google Scholar]
  12. Boardman, B. Fixing Fuel Poverty: Challenges and Solutions; Routledge: London, UK; New York, NY, USA, 2013. [Google Scholar]
  13. Charlier, D.; Kahouli, S. Fuel Poverty and Residential Energy Demand: How Fuel-Poor Households React to Energy Price Fluctuations. Energy J. Int. Assoc. Energy Econ. 2018, 40. [Google Scholar] [CrossRef]
  14. Bouzarovski, S.; Petrova, S. A global perspective on domestic energy deprivation: Overcoming the energy poverty–fuel poverty binary. Energy Res. Soc. Sci. 2015, 10, 31–40. [Google Scholar] [CrossRef]
  15. Galvin, R. Inequality and Energy: How Extremes of Wealth and Poverty in High Income Countries Affect CO2 Emissions and Access to Energy; Academic Press/Elsevier: London, UK, 2019. [Google Scholar]
  16. Chaton, C.; Gouraud, A. Simulation of fuel poverty in France. Energy Policy 2020, 140, 111434. [Google Scholar] [CrossRef]
  17. Pyka, M.; Liczka Sz Czajkowski, J.; Kukla, M. Ubóstwo Energetyczne. Wyniki Badania Ankietowego Oraz Propozycje Dotyczące Pomocy Osobom Ubogim Energetycznie. (Energy Poverty. The Results of the Survey and Suggestions for Helping the Energy Poor); Instytut na Rzecz Ekorozwoju, Fundacja na rzecz Efektywnego Wykorzystania Energii: Katowice-Warszawa, Poland, 2014. (In Polish) [Google Scholar]
  18. Miazga, A.; Owczarek, D. Dom zimny, dom ciemny–czyli ubóstwo energetyczne w Polsce. (Cold house, dark house–that is energy poverty in Poland). Instytut Badań Strukturalnych. IBS Work. Pap. 2015, 16, 2–22. (In Polish) [Google Scholar]
  19. Sałach, K.; Lewandowski, P. Pomiar Ubóstwa Energetycznego na Podstawie Danych BBGD–Metodologia i Zastosowanie; IBS Research Report: Warsaw, Poland, 2018; Volume 1. [Google Scholar]
  20. Szamrej-Baran, I. Wybrane Problemy Społeczno-Gospodarcze na Obszarach Wiejskich. In Zrównoważony Rozwój Obszarów Wiejskich Wybrane Aspekty Społeczne, (Selected Socio-Economic Problems in Rural Areas.); Kryk, B., Ed.; Uniwersytet Szczeciński, Wydawnictwo, Economicus: Szczecin, Poland, 2010. (In Polish) [Google Scholar]
  21. Kurowski, P. Wydatki mieszkaniowe gospodarstw domowych i ubóstwo energetyczne. Skala Zjawiska i Grupy Wrażliwe, Materiał na Seminarium Eksperckie w Kancelarii Prezydenta RP, 24. (Household Housing Expenditure and Energy Poverty. The Scale of the Phenomenon and vulnerable Groups, Material for an Expert Seminar at the Chancellery of the President of the Republic of Poland); Institute of Labour and Social Studies: Warsaw, Poland, 2014. (In Polish) [Google Scholar]
  22. Kurowski, P. Ubóstwo energetyczne. In O Polskiej Biedzie w Latach 1990-2015. Definicje, Miary i Wyniki. Wydawnictwo Naukowe; Golinowska, S., Ed.; SCHOLAR: Warszawa, Poland, 2018. [Google Scholar]
  23. Boardman, B. Opportunities and constraints posed by fuel poverty on policies to reduce the greenhouse effect in Britain. Appl. Energy 1993, 44, 185–195. [Google Scholar] [CrossRef]
  24. Myck, M.; Oczkowska, M. Pokolenie 50+ w Polsce na tle Europy: Aktywność, Zdrowie i Jakość Życia. Wyniki na Podstawie Badania SHARE; CenEA: Warsaw, Poland, 2017. [Google Scholar]
  25. Heindl, P.; Schüssler, R. Dynamic properties of energy affordability measures. Energy Policy 2015, 86, 123–132. [Google Scholar] [CrossRef] [Green Version]
  26. Phimister, E.; Vera-Toscano, E.; Roberts, D. The dynamics of energy poverty: Evidence from Spain. Econ. Energy Environ. Policy 2015, 4, 153–166. [Google Scholar] [CrossRef] [Green Version]
  27. Okushima, S. Measuring energy poverty in Japan, 2004–2013. Energy Policy 2016, 98, 557–564. [Google Scholar] [CrossRef] [Green Version]
  28. Pachauri, S.; Mueller, A.; Kemmler, A.; Spreng, D. On measuring energy poverty in Indian households. World Dev. 2004, 32, 2083–2104. [Google Scholar] [CrossRef]
  29. González-Eguino, M. Energy poverty: An overview. Renew. Sustain. Energy Rev. 2015, 47, 377–385. [Google Scholar] [CrossRef]
  30. Sachs, J.D.; Warner, A.M. The curse of natural resources. Eur. Econ. Rev. 2001, 45, 827–838. [Google Scholar] [CrossRef]
  31. Bouzarovski, S.; Tirado Herrero, S. Geographies of injustice: The socio-spatial determinants of energy poverty in Poland, the Czech Republic and Hungary. Post-Communist Econ. 2017, 29, 27–50. [Google Scholar] [CrossRef] [Green Version]
  32. Healy, J.D.; Clinch, J.P. Quantifying the severity of fuel poverty, its relationship with poor housing and reasons for non-investment in energy-saving measures in Ireland. Energy Policy 2004, 32, 207–220. [Google Scholar] [CrossRef]
  33. Liddell, C.; Morris, C.; McKenzie, P.; Rae, G. Defining Fuel Poverty in Northern Ireland: A Preliminary Review; University of Ulster: Coleraine, UK, 2011. [Google Scholar]
  34. Moore, R. Definitions of fuel poverty: Implications for policy. Energy Policy 2012, 49, 19–26. [Google Scholar] [CrossRef]
  35. Fizaine, F.; Kahouli, S. On the power of indicators: How the choice of fuel poverty indicator affects the identification of the target population. Appl. Econ. 2019, 51, 1081–1110. [Google Scholar] [CrossRef]
  36. Gordon, D.; Adelman, L.; Ashworth, K.; Bradshaw, J.; Levitas, R.; Middleton, S.; Pantazis, C.; Patsios, D.; Payne, S.; Townsend, P.; et al. Poverty and Social Exclusion in Britain; Joseph Rowntree Foundation: York, UK, 2000. [Google Scholar]
  37. Thomson, H.; Snell, C. Quantifying the prevalence of fuel poverty across the European Union. Energy Policy 2013, 52, 563–572. [Google Scholar] [CrossRef]
  38. Dubois, U. From targeting to implementation: The role of identification of fuel poor households. Energy Policy 2012, 49, 107–115. [Google Scholar] [CrossRef]
  39. Hills, J. Getting the Measure of Fuel Poverty: Final Report of the Fuel Poverty Review; London School of Economics and Political Science: London, UK, 2012. [Google Scholar]
  40. Nussbaumer, P.; Bazilian, M.; Modi, V. Measuring energy poverty: Focusing on what matters. Renew. Sustain. Energy Rev. 2012, 16, 231–243. [Google Scholar] [CrossRef] [Green Version]
  41. Sadath, A.C.; Acharya, R.H. Assessing the extent and intensity of energy poverty using Multidimensional Energy Poverty Index: Empirical evidence from households in India. Energy Policy 2017, 102, 540–550. [Google Scholar] [CrossRef]
  42. Bouzarovski, S.; Tirado Herrero, S. The energy divide: Integrating energy transitions, regional inequalities and poverty trends in the European Union. Eur. Urban Reg. Stud. 2017, 24, 69–86. [Google Scholar] [CrossRef] [PubMed] [Green Version]
  43. Aristondo, O.; Onaindia, E. Inequality of energy poverty between groups in Spain. Energy 2018, 153, 431–442. [Google Scholar] [CrossRef]
  44. Szamrej-Baran, I. Identyfikacja przyczyn ubóstwa energetycznego w Polsce przy wykorzystaniu modelowania miękkiego. (Identification of the causes of energy poverty in Poland using soft modeling). Prace Nauk. Uniw. Ekon. We Wrocławiu 2014, 23, 343–352. (In Polish) [Google Scholar]
  45. Central Statistical Office. Household Budget 2016. Individual Data; SP: Warsaw, Poland, 2018.
  46. Chatterjee, S.; Hadi, A.S. Regression Analysis by Example; John Wiley & Sons: Hoboken, NJ, USA, 2015. [Google Scholar]
  47. Schroeder, L.D.; Sjoquist, D.L.; Stephan, P.E. Understanding Regression Analysis: An Introductory Guide; Sage Publications: Beverly Hills, CA, USA, 2016; Volume 57. [Google Scholar]
  48. Charu, C.A.; Chandan, K.R. Data clustering. Algorithms and Applications; CRC Press, Taylory & Francis Group: Boca Raton, FL, USA; London, UK; New York, NY, USA, 2014. [Google Scholar]
  49. Brodny, J.; Tutak, M. Analyzing similarities between the European Union countries in terms of the structure and volume of energy production from renewable energy sources. Energies 2020, 13, 913. [Google Scholar] [CrossRef] [Green Version]
  50. Taber, K.S. The use of Cronbach’s alpha when developing and reporting research instruments in science education. Res. Sci. Educ. 2018, 48, 1273–1296. [Google Scholar] [CrossRef]
  51. Melchers, R.E.; Beck, A.T. Structural Reliability Analysis and Prediction; John Wiley & Sons: West Sussex, UK, 2018. [Google Scholar]
  52. Bonett, D.G.; Wright, T.A. Cronbach’s alpha reliability: Interval estimation, hypothesis testing, and sample size planning. J. Organ. Behav. 2015, 36, 3–15. [Google Scholar] [CrossRef]
  53. Cho, E.; Kim, S. Cronbach’s coefficient alpha: Well known but poorly understood. Organ. Res. Methods 2015, 18, 207–230. [Google Scholar] [CrossRef]
  54. Malko, J.; Wilczyński, A.; Wojciechowski, H. Bezpieczeństwo energetyczne, dostępność energii i zrównoważony rozwój a strategia unii energetycznej. (Energy security, energy availability and sustainable development and the strategy of the energy union). Rynek Energii 2015, 2, 10–17. (In Polish) [Google Scholar]
  55. Piekut, M. Jednooosbowe Gospodasrtwa Domowe w Polsce. Uwarunkowania Funkcjonowania, Tendencje Zmian; CeDeWu: Warszawa, Poland, 2019. (In Polish) [Google Scholar]
  56. Lis, M.; Miazga, A.; Sałach, K.; Szpor, A.; Święcicka, K. Ubóstwo Energetyczne w Polsce–Diagnoza i Rekomendacje. (Energy Poverty in Poland–Diagnosis and Recommendations) Policy Brief; Institute for Structural Research (ISB): Warsaw, Poland, 2016. (In Polish) [Google Scholar]
  57. Praum, C. The Myth of Affordability. Rules of Thumb in Housing Policy. German. Available online: https://www.eurozine.com/the-myth-of-affordability/ (accessed on 30 July 2020).
  58. Lis, M.; Ramsza, M.; Miazga, A. Dynamiczne Własności Miar Ubóstwa Energetycznego. (Dynamic Properties of Energy Poverty Measures). IBS Research Report 01/2016; Instytut badań Strukturalnych: Warsaw, Poland, 2016. (In Polish) [Google Scholar]
  59. Department of the Environment. Homes for Today and Tomorrow; Department of the Environment, Her Majesty’s Stationery Office HMSO: Londra, UK, 1961.
  60. Schwirian, K.P.; Schwirian, P.M. Neighboring, residential satisfaction, and psychological well-being in urban elders. J. Community Psychol. 1993, 21, 285–299. [Google Scholar] [CrossRef]
  61. Krieger, J.; Higgins, D. Housing and Health. Time Again for Public Health Action. Am. J. Public Health 2002, 92, 5. [Google Scholar] [CrossRef] [PubMed]
  62. Bazyl, M. The Relationship between Health and Housing Conditions in Poland and other European Countries. Available at SSRN 2436610. 2014. Available online: https://dx.doi.org/10.2139/ssrn.2436610 (accessed on 2 August 2020).
  63. Kurowski, P. Informacja o Poziomie i Strukturze Minimum Socjalnego w 2019 r. (na Podstawie Danych Średniorocznych). Information on the Level and Pattern of Social Minimum in 2019. (Based on the Data of Average); IPISS: Warszawa, Poland, 2020. [Google Scholar]
  64. Rozporządzenie Ministra Infrastruktury i Budownictwa z dnia 14 Listopada 2017 r. Zmieniające Rozporządzenie w Sprawie Warunków Technicznych, Jakim Powinny Odpowiadać Budynki i ich Usytuowanie. (Regulation of the Minister of Infrastructure and Construction of 14 November 2017 amending the regulation on technical conditions to be met by buildings and their location); ISAP: Warsaw, Poland, 2017. (In Polish)
  65. Boardman, B. Fixing Fuel Poverty: Challenges and Solutions; Earthscan: London, UK, 2010. [Google Scholar]
  66. Ormandy, D.; Ezratty, V. Health and thermal comfort: From WHO guidance to housing strategies. Energy Policy 2012, 49, 116–121. [Google Scholar] [CrossRef]
  67. Thomson, H.; Bouzarovski, S.; Snell, C. Rethinking the measurement of energy poverty in Europe: A critical analysis of indicators and data. Indoor Built Environ. 2017, 26, 879–901. [Google Scholar] [CrossRef]
  68. Węglarz, A.; Kubalski, G.; Owczarek, D. Propozycje Mechanizmów Wsparcia Procesu Przeciwdziałania Zjawisku Ubóstwa Energetycznego w Polsce. Instytut na Rzecz Ekorozwoju. 2014. Available online: Ineisd.org.pl/theme/UploadFiles/File/publikacje/broszury/broszura_ine__ubostwo_www.pdf (accessed on 5 August 2020).
  69. Birol, F. Energy economics: A place for energy poverty in the agenda? Energy J. 2007, 28. [Google Scholar] [CrossRef] [Green Version]
  70. Świerszcz, K.; Grenda, B. Poziom ubóstwa energetycznego w wybranych regionach kraju jako miernik poziomu bezpieczeństwa energetycznego w wymiarze społecznym. (The level of energy poverty in selected regions of the country as a measure of the level of energy security in the social dimension). Przedsiębiorczość Zarządzanie 2018, 19, 211–230. (In Polish) [Google Scholar]
  71. Bradbury, M.; Peterson, M.N.; Liu, J. Long-term dynamics of household size and their environmental implications. Popul. Environ. 2014, 36, 73–84. [Google Scholar] [CrossRef]
  72. Räty, R.; Carlsson-Kanyama, A. Energy consumption by gender in some European countries. Energy Policy 2010, 38, 646–649. [Google Scholar] [CrossRef]
  73. Bradshaw, S. Sex disaggregation alone will not energize equality. Nat. Energy 2018, 3, 813–815. [Google Scholar] [CrossRef] [Green Version]
  74. Simcock, N.; Jenkins, K.; Mattioli, G.; Lacey-Barnacle, M.; Bouzarovski SMartiskainen, M. Vulnerability to Fuel and Transport Poverty; Centre for Research into Energy Demand Solutions: Oxford, UK, 2020. [Google Scholar]
  75. Healy, J.D. Housing, Fuel Poverty and Health: A pan-European Analysis; Routledge: London, UK, 2017. [Google Scholar]
  76. Kahouli, S. An economic approach to the study of the relationship between housing hazards and health: The case of residential fuel poverty in France. Energy Econ. 2020, 85, 104592. [Google Scholar] [CrossRef]
  77. Llorca, M.; Rodríguez-Álvarez, A.; Jamasb, T. Objective vs. subjective fuel poverty and self-assessed health. Energy Econ. 2020, 87, 104736. [Google Scholar] [CrossRef] [Green Version]
  78. Liddell, C.H.; Chris, M. Fuel poverty and human health: A review of recent evidence. Energy Policy 2010, 38, 2987–2997. [Google Scholar] [CrossRef]
  79. Day, R.; Walker, G.; Simcock, N. Conceptualising energy use and energy poverty using a capabilities framework. Energy Policy 2016, 93, 255–264. [Google Scholar] [CrossRef]
  80. Bosch, J.; Palència, L.; Malmusi, D.; Marí-Dell’Olmo, M.; Borrell, C. The impact of fuel poverty upon self-reported health status among the low-income population in Europe. Hous. Stud. 2019, 34, 1377–1403. [Google Scholar] [CrossRef]
  81. Figaszewska, I. Ochrona odbiorców słabych ekonomicznie na rynku energii oraz gazu w Polsce na tle państw Unii Europejskiej. (Protection of economically weak customers in the energy and gas market in Poland in comparison to the European Union countries). Prace Nauk. Akad. Ekon. W Katowicach 2007, 225–234. (In Polish) [Google Scholar]
Figure 1. Expenditure on energy carriers and their share in available income by household size in Poland in 2018. Source: own study based on [8].
Energies 13 05699 g001
Figure 2. Changes in prices of energy carriers for households in 2000–2018. Source: own study and calculations based on Central Statistical Office (CSO) data.
Energies 13 05699 g002
Figure 3. Expenditure on energy carriers and their share in available income in one-person households in the years 2000–2018. Comment: level of expenditures on energy carries: p = 0.000, the slope of a trend line = 7.1000, coefficient of determination R2 = 0.8717; share of expenditures on energy carries in available income: p = 0.0000, the slope of a trend line = –0.1479, coefficient of determination R2 = 0.7217. Source: own study and calculations based on CSO data.
Energies 13 05699 g003
Figure 4. Changes in real disposable income and real expenditure on energy carriers in one-person households in 2000–2018. Comment: Real expenditures in energy carriers: p = 0.0584, the slope of a trend line = −0.4064, coefficient of determination R2 = 0.1950; relative available income: p = 0.0540, the slope of a trend line = −0.2437, coefficient of determination R2 = 0.2013. Source: own study and calculations based on Central Statistical Office data.
Energies 13 05699 g004
Figure 5. Share of expenditure on energy carriers in available income in one-person households in selected years 2000–2016 in Poland. Comment: The group of one-person households was divided into five equal groups according to the level of available income. In the 1st quintile group there were 1/5 of one-person households with the lowest level of available income, and in the 5th group 1/5 households with the highest level of available income. Source: own study and calculations based on CSO data.
Energies 13 05699 g005
Figure 6. Distribution of the aggregate indicator for one-person households in 2016. Source: own calculations based on CSO data.
Energies 13 05699 g006
Scheme 1. Hierarchy of types of one-person households determined by the aggregate indicator. Source: own study and calculations based on CSO data.
Energies 13 05699 sch001
Scheme 2. Factors determining energy poverty in one-person households in Poland. Source: own work.
Energies 13 05699 sch002
Table 1. Aggregate index of energy poverty (energy comfort) for one-person households.
VariablesPossible Answers and Evaluative LoadsMaximum Number of Points
Objective variables
Share of expenditure on energy carriers in disposable income (%)Less than 10%—2; 10% to 20%—1; Above 20%—02
Share of expenditure on energy carriers in disposable income (%)Yes—1; No—01
Access to hot running waterYes—1; No—01
The period of construction of the buildingUntil 1960—0; in the years 1961–1995—1; in the years 1996–2011—2; after 2011—3.3
Leaking roof, damp walls, floors, rotting windows or floorsYes—1; No—01
The amount of expenses related to maintaining the apartment above the subsistence level (340 PLN)Yes—1; No—01
The level of disposable income by quintile groups1st quintile group—1; 2nd quintile group—2; ...; 5th quintile group—55
Subjective variables
The apartment is cool enough in summerYes—1; No—01
The apartment is warm enough in winterYes—1; No—01
Assessment of meeting the needs of:
- food
- timely payment of housing fees
- healthcare
Good —4; Rather good—3; On average—2; Rather bad—1; Very bad—012
Subjective assessment of the building standardLuxury—5; Wealthy—4; Middle-class income—3; Modest—2; Poor—1; Very poor—05
Table 2. The impact of available income and changes in the prices of energy carriers on the share of expenditure on energy carriers in Polish one-person households in 2000–2018.
SpecificationStandardized Regression CoefficientsStandard Error of the Standardized Regression CoefficientRegression CoefficientsStandard Error of the Regression Coefficientp
available income−0.3150.1788−0.00170.00040.0009
prices—electricity, gas, and other fuels 0.137550.17880.03430.04450.4528
Free word 11.98615.08730.0316
Comment: R = 0.822; R2 = 0.676; R ¯ 2 = 0.635; F (2,16) = 16.676 (p < 0.0001), Se (estimation standard error) = 0.5917. Source: own calculations based on CSO data.
Table 3. The values of descriptive statistics aggregate index for single-person households.
SpecificationIndicator Values
Means21.76
Median22.0
Standard deviation4.63
Modal23.0
Kurtosis0.45
Minimum4.0
Maximum34.0
The first decile16.0
The ninth decile27.0
Coefficient of variation21.31
Coefficient of asymmetry−0.59
Source: own calculations based on CSO data.
Table 4. The impact of economic and socio-demographic variables of people running one-person households on the aggregate indicator.
VariableVariantStandardized Regression CoefficientsStandard Error of the Standardized Regression Coefficientp
Socio-economic groupHouseholds having income from other sources
Households of retirees0.44664.14170.0000
Households of employees in non-manual labor position0.35344.51920.0000
Households of pensioners0.28413.70170.0000
Households of employees in manual labor position0.20743.48900.0000
Households living on supplementary welfare allowance0.16743.98320.0000
Households of the self employed0.15004.41270.0000
Households of farmers0.08003.62450.0000
Level of education of the personLower secondary, primary or less
Tertiary 0.32093.68500.0000
Post-secondary, upper secondary vocational, upper secondary general0.26002.52160.0000
Basic vocational0.08200.91550.0000
Available income per capitaContinuous variable in PLN0.27620.00090.0000
Marital statusIn separation
Widow, widower0.10170.94470.0000
Households by class of localityRural
Town 20–99 thousand.0.06370.74440.0000
Town less than 20 thousand0.05150.75650.0000
Town 200–499 thousand0.04620.66980.0000
Town 500 thousand and more0.03920.45570.0004
SexWomen
Man−0.0260−0.26450.0100
AgeContinuous variable in years−0.0332−0.00910.0390
A disabled personNo
Yes−0.0683−0.86540.0000
Unemployed personNo
Yes−0.0951−3.22880.0000
Free word 14.09560.0000
Comment: R = 0.604; R2 = 0.365; R ¯ 2 = 0.363; F (20,75) = 216.89 (p < 0.000), Se (standard error of estimation) = 3.69. Source: own study and calculations based on CSO data.
Table 5. Patterns of consumption of energy carriers of the types of one-person households in Poland in 2016.
Characteristics1st Group
Modest, Energy-Satisfied
2nd Group
Energy-Satisfied
3rd Group
Energy Dissatisfied
4th Group
Energy Poor
Total Number
Number of householdsN = 4001N = 2305N = 716N = 545N = 7567
The level of expenditure on energy carriers (PLN)229251182378242
Share of households where expenditure on energy carriers in available income is 13% or more and 20% or more (%)36.538.325.057.82837
The share of expenditure on energy carriers in disposable income (%)14.912.810.524.314.5
The share of expenditure on energy carriers in consumer expenditure (%)15.015.212.123.415.4
Available income per person (PLN)18512493209017152059
Expenditure on consumer goods and services (PLN)15252005170015041686
The share of expenditures on food in available income (%)21.916.418.922.019.6
The apartment is not warm enough in winter (%)2.91.863.377.31033
The apartment is not cool enough in summer (%)8.510.497.820.61392
There is no hot running water in the apartment (%)4.81.316.627.5488
The household receives a housing allowance (%)1.41.93.14.8148
The apartment has a leaky roof, damp walls, floors, rotting windows, or walls (%)7.62.314.938.9676
The total area of the apartment (m2)69.049.450.858.960.6
Usable floor area of the dwelling occupied by the household (%)64.146.547.257.056.7
Number of rooms (mean number)2.42.11.92.02.2
Bad and rather bad satisfaction of health care needs (% from the cluster)13.812.619.130.615.2/1149
The method of heating the apartment (% from the cluster)
Central heating (e.g., from a combined heat and power plant, local, or individual boiler room)81.398.682.38.86161
A solid fuel stove13.80.713.877.41090
Electric stove4.80.73.413.4304
Other heating0.1 *0.0 *0.6 *0.4 *12
Timely payment of housing fees (fixed fees, rent, rental costs, etc.) (% from the cluster)
No need0.70.4 *1.3 *0.7 *49
Bad and rather bad4.52.27.712.3350
Average, neither good nor bad19.114.319.026.41374
Good and rather good75.783.272.160.65794
Building type (% from the cluster)
Multi-family building51.896.675.052.35119
Single-family terraced house6.90.74.56.8360
Detached single-family house41.12.620.340.62070
Other0.30.1 *0.3 *0.4 *18
The period of construction of the building (% from the cluster)
Before 194625.54.420.857.81591
in the years 1946–196017.19.515.623.31142
in the years 1961–198041.144.342.313.93043
in the years 1981–199511.027.113.03.51178
in the years 1996–20063.47.74.31.1 *348
in the years 2007–20111.64.82.40.2 *191
after 20110.32.21.50.2 *74
Building standard (% from the cluster)
very poor and very poor8.02.015.338.5686
modest44.026.939.945.72916
middle-class and wealthy47.870.344.715.83937
luxury0.20.80.10.028
Comment: the percentages for individual clusters are presented horizontally, i.e., the summed results in the rows should give 100%; * statistically insignificant result; Source: own work.
Table 6. Economic and socio-demographic characteristics of the types of one-person households in Poland in 2016 (as a percentage of a given cluster).
Characteristics1st Group
Modest, Energy-Satisfied
2nd Group
Energy-Satisfied
3rd Group
Energy Dissatisfied
4th Group
Energy Poor
Total Number
Number of householdsN = 4001N = 2305N = 716N = 545N = 7567
Sex
Male29.626.233.835.82223
Female70.473.866.264.25344
Age
Below 305.111.812.02.9577
30–404.18.67.73.7437
40–505.46.37.07.0448
50–6015.313.814.919.31140
60–7031.728.229.833.62314
Above 7038.531.328.633.62651
The average age of the person64.158.758.563.7-
Marital status
Unmarried, never married22.331.834.226.12012
Married3.93.23.42.6266
Widow, widower58.646.345.852.53968
Divorced13.918.014.818.01175
In separation1.30,91.80.9 *90
Level of education of the personal
Lower secondary, primary, no formal education26.610.520.339.61668
Basic vocational25.614.521.829.21674
Post-secondary, upper secondary vocational, upper secondary general33.242.033.824.62673
Tertiary14.632.924.26.61552
Socioeconomic groups
Households of employees in manual labor position 9.45.96.612.7627
Households of employees in non-manual labor position 10.525.119.37.71178
Households of farmers1.60.0*1.3 *1.3 *80
Households of self-employed2.13.33.51.8*193
Households of retirees53.248.143.944.83796
Households of pensioners16.810.813.819.51126
Households living on supplementary welfare allowance3.21.95.510.6268
Households having income from other sources3.35.06.31.7 *299
Place of location
Urban area, ≥500,000 inhabitants 9.035.833.514.91505
Urban area, 200,000–499,000 inhabitants9.016.710.99.9875
Urban area, 200,000–499,000 inhabitants 100,000–199,000 inhabitants8.911.210.812.5761
Urban area, 20,000–99,000 inhabitants19.923.012.911.61482
Urban area, <20,000 inhabitants13.09.08.511.0849
Rural area40.24.423.540.22095
Comment: the percentages for individual clusters are presented horizontally, i.e., the summed results in the rows should give 100%; * statistically insignificant result; Source: own work.
Publisher’s Note: MDPI stays neutral with regard to jurisdictional claims in published maps and institutional affiliations.