Abstract
The demand for alternative sources of clean, sustainable, and renewable energy has been a focus of research around the world for the past few decades. Microbial/enzymatic biofuel cells are one of the popular technologies for generating electricity from organic substrates. Currently, one of the promising fuel options is based on glucose due to its multiple advantages: high energy intensity, environmental friendliness, low cost, etc. The effectiveness of biofuel cells is largely determined by the activity of biocatalytic systems applied to accelerate electrode reactions. For this work with aerobic granular sludge as a basis, a nitrogen-fixing community of microorganisms has been selected. The microorganisms were immobilized on a carbon material (graphite foam, carbon nanotubes). The bioanode was developed from a selected biological material. A membraneless biofuel cell glucose/oxygen, with abiotic metal catalysts and biocatalysts based on a microorganism community and enzymes, has been developed. Using methods of laboratory electrochemical studies and mathematical modeling, the physicochemical phenomena and processes occurring in the cell has been studied. The mathematical model includes equations for the kinetics of electrochemical reactions and the growth of microbiological population, the material balance of the components, and charge balance. The results of calculations of the distribution of component concentrations over the thickness of the active layer and over time are presented. The data obtained from the model calculations correspond to the experimental ones. Optimization for fuel concentration has been carried out.
1. Introduction
Biofuel cells (BFCs) are one of the promising areas of modern alternative energy. BFCs are devices for converting the chemical energy of fuel into electrical energy using catalysts, as a rule, of a biological nature (enzymes, microbiological communities, etc.). BFCs use renewable and non-polluting catalysts and are able to work with different types of fuel. Organic liquids are used as a fuel for BFC; alcohol is used most often, but currently glucose is also finding wide application as a fuel.
The interest in the creation of glucose–oxygen fuel cells (FC) is mainly determined by the exceptional properties of glucose, among them: high-energy intensity, renewability, environmental friendliness, low cost (in comparison with hydrogen), and simplicity of transportation. In living organisms, as a result of biocatalytic complete oxidation of glucose, 24 electrons are released, with carbon dioxide (CO2) and water (H2O) being the products of a multi-stage reaction.
As a rule, BFCs are divided according to the type of catalytic system used into enzymatic (EFCs) and microbial (MFCs). The first one uses selective enzymes to promote redox reactions, while the second one uses electroactive microbes inoculated into the anode chamber to extract energy from complex organic mixtures. Enzymes often displays superior electrochemical and catalytic activity, but they are unstable and less durable in comparison to microorganisms. MFCs can use wastewater of cities and enterprises, which makes them highly effective means for generating electric energy. Indeed, pollutants contained in these substrates may serve as a fuel, making wastewater a useful and effective tool for environmental protection, which can be applied as renewable energy sources at distance from the main power lines [1,2].
EFCs are promising for providing energy for portable electronic devices, biosensors (e.g., sensors continuously measuring glucose in the blood of patients with diabetes), medical implantable devices (like pacemaker, artificial kidney, etc.) or other types of biocompatible electrical devices. Currently, the development of EFCs represents a relevant trend in alternative energy [3].
However, despite the progress achieved, cost-effective modular designs that can be safely applied (and being environmentally friendly) have not been implemented yet. An analysis of the state of the art shows that current research is aimed at developing a new generation of fuel cells that are distinguished by desirable characteristics and work resources. Mediators are often used to achieve acceptable electrochemical characteristics in new devices. A separation membrane is a component of the vast majority of designs. However, the usage of mediators as electron carriers increases the toxicity of the device, and the inclusion of a separation membrane significantly complicates the miniaturization of the device. These aspects of construction limit the possibility of implantation into living organism. For using BFCs in real conditions, researchers are faced with high operating costs and low power of devices. Currently, the amount of energy produced by BFC is an order of magnitude lower than the energy produced by traditional chemical FCs. An important aspect in the development of EFCs and MFCs is the immobilization of the enzyme/microorganisms on the electrode. Maintaining of a continuous fuel supply to the active centers and providing an efficient process for transferring electrons from an enzyme/bacterium to an electrode are critical. The development of new methods of immobilization including substrates from nanostructures can provide a significant improvement in both the performance and stability of the devices.
Different approaches for glucose electrooxidation may be applied in BFCs. Initial work on glucose oxidation was performed under model conditions and made it possible to choose the most effective metal catalyst—Gold (Au) for the reaction proceeding in alkaline media [4]. The usage of glucoseoxidase enzyme for the glucose oxidation in BFC (or in a biosensor for glucose determination) is based on the occurrence of an enzymatic reaction (glucose oxidation) in bulk solution and oxidation of the product of the enzymatic reaction at the electrode. However, attempts to use glucoseoxidase or glucose dehydrogenase enzymes in the adsorbed state on the electrode for the direct glucose electrooxidation have not been successful so far. Positive results were observed only in a small number of cases [5,6,7,8,9,10].
A relatively new direction in the creation of a material for effective glucose oxidation is the usage of microorganisms, both in the form of whole cells as well as their fragments. This presupposes the presence of a mediator system for coupling electrode and biocatalytic reactions in the bulk solution. The use of fungal and bacterial communities of aerobic granular sludge (AGS) for testing as part of MFC is considered. AGS is selected under specific conditions in the Sequence Batch (SB) mode; starvation and exposure (treatment) by stressors can contribute to the formation of granules [11]. The microorganism communities selected from such granules are extremely resistant to toxicants (for example, heavy metals), mechanical stress, load differences in chemical oxygen demand (COD), carbon substrate, and concentrations of nitrogen and phosphorus. AGS can include both bacterial and fungal cultures, already proven, to be good producers of metal nanoparticles, and to contain reducing equivalents [12], which makes them attractive as electrogenic (electro-generating) microorganisms in MFC. The microbial communities are more favorable in MFCs compared to pure cultures due to their higher stability.
Communities from AGS are promising for MFC since the granules are able to rebuild their metabolism and successfully function for a long time in an anaerobic environment. In the anaerobic phase of work or under conditions of oxygen limitation, the microorganisms of granular sludge either part of them (optional anaerobes) switch their metabolism to anaerobic mode and use the potential of reserve nutrients and critical components for anaerobiosis produced at the aerobic stage. The advantages of AGS are a high and stable metabolic rate, resistance to mechanical stress and toxins, the long residence time of the biomass, immobilization of the biomass inside the granule and, therefore, the possibility of bioaugmentation [13].
The reports [1,2,3,4,5,6,7,8,9,10] provide clear evidence of the importance of characteristics achieved with both abiotic and biotic systems for developing an effective process of glucose electrooxidation in BFCs. In the latter case, the mediator system is crucial.
Currently, the detailed description of the mechanism of electron transfer between microorganisms and solid electrodes suffers from the difficulties of employing standard visualization techniques to trace complex bioelectrochemical processes in such systems. The reported mathematical models are developed for only specific kinds of systems, and are greatly simplified neglecting the transient characteristics, spatial inhomogeneities, potential distribution, ion migration, fluid flows, heat balance, etc. For viable commercial application, these limitations should be taken into account both in cases of using: as a separate device or in combination with other technologies.
The survey [14] summarizes the data related to mathematical modeling of enzymatic electrodes and fuel cells reported over the past two decades. The discussed mathematical models of biofuel cells are mostly the reaction–diffusion systems based on differential equations derived from the notions of formal kinetics. The reports present various approaches (analytical and numerical) to the modeling of various types of FCs, including EFC [14,15,16,17]. The models can be classified into several types, the main one including those based on the principles of formal and electrochemical kinetics [5,18,19,20]. As a rule, modeling and calculations are performed with commercial software packages (COMSOL Multiphysics, ANSYS FLUENT, CFD-ACE, FEM-LAB and so on.) [21,22,23,24] or using special software (i.e., MATLAB) [25,26].
At the same time, the existing and applied in practice mathematical models of MFC can be classified into two types depending on the relationship to the researched object. Some models treat the MFC as a black box, considering only the input and output characteristics of the system, while others are more or less detailed in regard to the processes occurring within the researched system. The mathematical models of the first type comprise those exploiting the approaches of electrochemical impedance spectroscopy [27], artificial neural networks [28,29], Tafel equations [30], etc. For example, in the study [31] on the effect of hydrodynamic mode on the output characteristics aimed to determine dead zones that reduce the effective volume of the reactor, hydrodynamics was shown to affect only the output characteristics of the cathode. Such approaches are not very popular, obviously, due to their complexity, relatively low information provided, and limited area of application. Interestingly, the mathematical models of the second type dealing with the processes occurring within MFC have been widely used earlier [32], and are actively applied in recent works [33]. The mathematical models of MFC include blocks describing growth of microorganism population, reaction kinetics in the system, transport of the components of MFC processes, and power generation. As a rule, Monod-type equations [34,35] are used to describe the substrate consumption for biomass growth. Some authors use a combination of the electrochemical kinetics equation (Battler–Volmer) and Monod-type equations to determine the rates of the processes occurring in MFC [36,37,38]. Usually, the models take into account the component concentration dynamics in the different parts of MFC due to diffusion, migration, consumption, and production resulted from reactions, etc. The reaction area is also considered a continuously stirred tank reactor [36].
The majority of the described BFC mathematical models operate with the enzyme surface concentration and take it equal to the total amount of enzyme adsorbed on the electrode. This assumption makes it impossible to determine the factors that can affect the final characteristics of the electrodes. Previously, the following have been developed: (1) the method for determination of the amount of laccase enzyme adsorbed on the electrode surface [39] and (2) the mathematical model that takes into account the distribution of the enzyme within the thickness of the active layer of the electrode [40]. Recently, the mathematical models describing the phenomena occurring in the active layers of the electrodes have been presented, i.e., the simulation of glucose oxidation in a weakly acidic medium on carbon black modified by gold on a rotating disk electrode (RDE) [41], and the model describing oxygen bioelectroreduction in a weakly acidic medium on a RDE with the laccase enzyme immobilized on a carbon material [42]. Preliminary results have been reported in [43]. While glucose oxidation occurs on a bioanode with a microbial community immobilized on a carbon material, oxygen reduction occurs on an abiotic catalyst without noble metals. The mathematical models contain the equations of enzymatic and electrochemical kinetics, material, and charge balance. The equations of concentration dynamics take into account diffusion, electromigration (for protons), and the formation/consumption of the component due to reactions.
The aim of this study is to continue experimental and theoretical studies of the catalytic systems involving oxygen cathodic reduction and glucose electrooxidation with abiotic and biotic catalysts of BFC, especially microorganisms (bacterial and fungal communities) and enzymes.
2. Materials and Methods
2.1. Cultivation of Microorganisms
In this work, AGS bacterial and fungal communities were employed. AGS was obtained according to the method described in [11]. Based on 16S and 18S rRNA sequence analysis, the individual community cultures were assigned to Fusarium nivale, Fusarium oxysporum, and Penicillium glabrum (fungal communities), Agrobacterium tumefaciens, Bacillus amiloliqefaciens and Microbacterium oxidans (bacterial nitrogen-fixing community). The bacterial community can play one of the key roles in the initial AGS sample, being efficient at nitrogen fixation and demonstrating active growth in a medium without a nitrogen source; this accumulates a large number of exopolymers and also contributes to the formation of strong sludge granules. All selected cultures are able to grow on depleted nutrient media and form granules, both in the state of pure cultures and in microbial communities as well, which makes them promising for the creation of artificial granules of activated sludge.
The cultivated microbial community is highly resistant to COD fluctuations, and it is stable in anaerobic mode for a long time. The advantage of the components selected from the microbial communities is that they do not accumulate the usually obtained excess biomass (excess activated sludge) in the AGS even in the aerobic mode. The biomass growth stabilizes after a certain level due to the specific interaction of the components of the microbial community as well as for the anaerobic mode where they work as a part of the anode.
The active sludge in the tested MFC was based on three fungal cultures: F. nivale, F. oxysporum, and P. glabrum with the addition of components of the bacterial nitrogen-fixing community. Self-immobilization of the community in a thermally expanded graphite (TEG) occurred during cultivation in flasks with the TEG sample fixed in them.
For deep cultivation, a liquid nutrient medium of the following composition was used—(quantities reported in g/L): starch—0.3–2.5; KNO3—0–0.5; K2HPO4—0.5; MgSO4•7H2O—0.5; FeSO4•7H2O—10–4; CaCl2—0.02; Fedorov micronutrient concentrate. The nutrient medium was sterilized in an autoclave for 30 min at 0.5 atm (technical atmosphere of overpressure).
Cultivation was carried out on a Heidolph Unimax 2010 shaker (Heidolph Instruments GmbH & Co KG, Germany) at 150 rpm and 27 °C for three to four days under diffuse background lighting.
The volume of medium was 100 mL in a 250 mL flask. The seed material was introduced at the rate of 10% of the volume of the nutrient medium. The SB mode described in [11] was used for formation of granules.
The microbial communities consisting of bacterial and fungal cultures were immobilized in graphene-like thermally expanded graphite (TEG) under normal cultivation in flasks. TEG has been synthesized using hydrosulfate technology [44].
Figure 1 shows SEM photos of samples: a—Fungal cultures with bacteria in TEG, b—Predominance of fungal cultures in TEG.
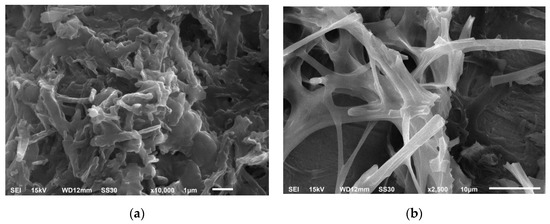
Figure 1.
Microorganisms immobilized in TEG, (a) fungal cultures with bacteria in thermally expanded graphite; (b) predominance of fungal cultures in thermally expanded graphite.
2.2. Method for Preparing Electrodes
Preparation of anodes based on biological materials requires significant modification of preparation methods commonly used for inorganic (abiotic) FC electrodes. Specially, bioanode cannot tolerate the exposure to alcohol-based suspensions either to the temperature of 90–100 °C, ultrasonic homogenization of catalytic suspensions is unsuitable as well. Since biomaterials do not possess their own electronic conductivity, biocatalysts have to be modified with the carbon materials. Besides an ionomer solution (in particular, Nafion) is added to the inorganic catalysts electrodes suspension to ensure ionic conductivity of the active layer. The Nafion ionomere also acts as a binder. Introduction of the Nafion ionomer with pH close to 0 into the active biomaterial can lead to the degradation of enzymes and microorganisms. A preliminary description of the preparation method for bioanode has been partially reported previously [43]. The most effective approach to fabrication of anodes based on biological material (BM) is the preliminary immobilization of microorganisms on a carbon material (CM) (i.e., graphene-like foamed thermally expanded graphite (TEG)), followed by applying of CM + BM mixture on the microcellular side of a gas diffusion layer (GDL). This was done using the following procedures: impregnation of the GDL surface with BM solution (suspension); deposition of BM-impregnated foamed graphite mixture on GDL with a palette knife; impregnation of carbon nanotubes (CNT) or KJ300 black in BM suspension followed by applying CM + BM mixture on GDL. The active layer (AL) of BM-based electrodes with an area of 4 × 4 cm2 or 5 × 5 cm2 was formed. Macroporous and microporous layers are the parts of commercial GDL (39BC). The active layer is formed by applying CM + BM mixture on the microporous layer. The structure of the bioanode is shown in Figure 2.
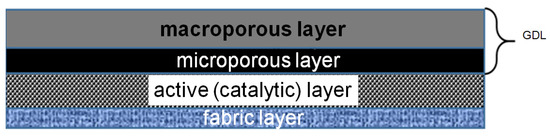
Figure 2.
Scheme of the anode structure based on GDL and BM.
The impregnation time for materials and GDL was as long as 5–7 days, which ensured the effective immobilization of BM on the CM surface. The amount of applied material was monitored visually using, if possible, a minimum volume of CM + BM suspension, sufficient to fully cover the GDL surface. In the case of CNT electrodes, CM amount was about ~0.4 mgC/cm2. Since bioanodes were prepared without adding a binder, a non-conducting fabric was pressed into the bioanode AL, which ensured a good mechanical strength of the electrode and free penetration of electrolyte into the active layer (Figure 2).
Whence anode and cathode areas are separated, immobilization of biomaterial on the anode is not necessary. In a solution, microbiological communities can be in the form of a suspension of particles adsorbed on TEG. Importantly, the same solution should contain a mediator to transfer electrons to an electrode.
Along with biocatalysts for glucose oxidation, carbon materials were studied as well as a gold-based catalyst 20% Au/C. The latter demonstrated the highest activity in glucose oxidation according to model experimental measurements [45]. The 20% Au/C catalyst was prepared by the method of chemical reduction of gold nanoparticles on the surface of a carbon support. Gold (III) hydrochloric acid (HAuCl4) was used as a precursor; the reduction was performed with sodium borohydride in the presence of a stabilizer—Citrate. The carrier was added to the cooled reaction mixture at constant stirring. A solution of sodium citrate and borohydride and HAuCl4 solution were added to a suspension of the support (XC 72 or CNT) in water. After establishing of the solution constant color, stirring was continued until the solution became transparent. With XC72 carbon black usage, the deposition takes 24–32 h. In the case of nanotubes, the deposition time is up to 7 days. The obtained catalyst was thoroughly washed with deionized water to remove remains of sodium borohydride. Then, it was dried in a vacuum oven at 80 °C. The synthesized catalyst was placed in sealed glass containers and stored in a laboratory cabinet.
The gold catalyst loading was 0.4 mgAu/cm2. According to the data of preliminary experiments, it corresponds to the minimum amount of catalyst required to obtain a reproducible anodic potential.
In this research, different cathode catalysts were studied, i.e., laccase enzyme, as well as catalytic systems based on nitrogen-containing carbon materials (nitrogen doped carbon nanotubes CNT-N and CoFe/CNT system obtained by pyrolysis of cobalt porphyrins and iron on the CNT surface) and not containing precious metals. Earlier, the efficiency of laccase [39] and pyrolytic non-platinum catalysts [46,47] in oxygen reduction under model conditions at various pH values has been shown.
To prepare a laccase-based cathode, an aqueous-alcoholic suspension of CNTs and hydrophobized carbon black was preliminarily applied on the GDL (the carbon black content in the mixture with CNTs was 15 wt%, the CNT loading was 0.4 mgC/cm2). Laccase was adsorbed from its solution in a phosphate-acetate buffer on the formed active layer. For the immobilization by spontaneous adsorption, GDL with prepared AL was held on the surface of a solution containing laccase for 24 h in a fridge. Then, the electrode was rinsed with a solution to remove the loosely bound enzyme from the surface and exposed to air for 20–30 min. After that, the electrode was placed in the BFC for testing. As it was shown earlier [39], a monolayer filling of the surface with laccase forms on the surface under these conditions as a result of spontaneous adsorption. It accelerates oxygen reduction by direct bioelectrocatalysis without mediators (electron transfer occurs between the carbon support, enzyme active center, and oxygen molecule).
2.3. Experimental Campaign
The catalytic systems were tested in a laboratory membraneless BFC, which was developed using 3D printing. The cell design and the preparation method are described in more details elsewhere [43,48].
The scheme of the experimental setup is shown in Figure 3. The solid line indicates the electrolyte circuit, while the dashed line indicates the gas (O2) circuit.
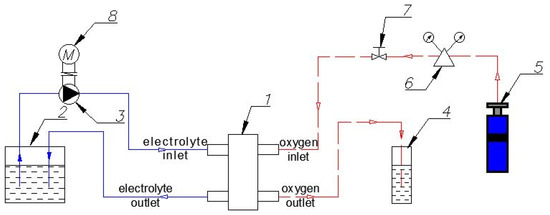
Figure 3.
Scheme of the experimental setup: 1—BFC; 2—Reservoir with electrolyte solution; 3—Circulation pump; 4—Reservoir with water (control of O2 flow through the system); 5—Oxygen cylinder; 6—Reducer with pressure gauges; 7—Fine adjustment valve; 8—Electric engine.
The solution is fed to BFC (1) from the reservoir with the electrolyte (2) through the inlet nozzle with a circulation pump (3) driven by an electric motor (8). Then, the solution is discharged through the outlet nozzle back into the reservoir (2). It can provide a continuous circulation of the electrolyte in a closed loop. Gas enters BFC from the oxygen cylinder (5) through the inlet nozzle and is removed through the outlet nozzle. The reservoir with water (4) affords gas outflow control. A reducer with pressure gauges (6) and a fine adjustment valve (7) serve to supply and adjust the gas flow.
The electrolyte chamber volume was about 7 cm3. The dimensions of the electrodes were 5 × 5 cm2 with an active surface area of 4 × 4 cm2. In tests, FC oxygen (tech.) entered into the cathode space of the cells at a flow rate of ~5 mL/min. After the open circuit voltage (Voc) was stable (stabilization time ~1 h), the anode potential was measured with respect to silver chloride reference electrode immersed in a container at the outlet of the anode space of the cell. The potentials collected with reference to Ag/AgCl were converted to reversible hydrogen electrode (RHE). MFCs were tested using measuring cyclic potentiodynamic polarization technique; cyclic potentiodynamic curves were measured at a scan rate of 0.1–0.3 mV/s from Voc to U = 0.
An acetate-phosphate buffer solution providing 0.2–0.3 M Na2HPO4, 0.2 M glucose, and acetic acid was used as an electrolyte. According to [49], the glucose level can vary within a wide range depending on the experimental conditions (pH of a solution, etc.), and the catalytic system at the anode. The glucose concentration of 0.2 M and 0.5 M was chosen following the previously conducted studies into dependence of the characteristics of the oxidation process of glucose on its concentration in the electrolyte solution under model conditions.
Two types of cell were treated. The first one is a developed membraneless fuel cell (reported in [43,48]), the second one is a commercial cell for FC from Electrochem™ with a separator from a fiberglass between the anode and the cathode. The cathode and anode size was 4 cm2. Active layers were applied to the surface of gas diffusion electrodes (GDE). Oxygen was fed into the cell through a serpentine in the end plate. The electrolyte was pumped through the anode space of the cell using a micropump, while the electrolyte was absorbed by the separator, which ensured ionic conductivity.
2.4. Mathematical Modeling
Here, the modeling of phenomena in the FC biotic anode (community of microorganisms) and abiotic cathode (CoFe) is considered. It is assumed that a weakly alkaline acetate-phosphate buffer solution and glucose are pumped into the electrolyte chamber beforehand.
A full mathematical model has been developed and presented in this section.
Schematic representation of a membraneless MFC is shown in Figure 4. The model considers three areas: the active layer of the anode catalyst (0< × ≤L1), the bulk electrolyte solution (L1< × ≤L2), and the active layer of the cathode catalyst (L2< × ≤L3).
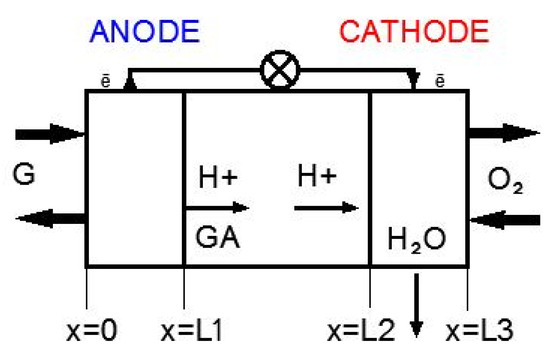
Figure 4.
Schematic representation of the membraneless MFC.
It was assumed that the active layer consisted of two phases: the solid electron conducting phase (carbon particles for the bioanode and carbon and metal particles for the abiotic cathode) and ion conducting phase (electrolyte solution).
Glucose electrooxidation is assumed to take place at the anode with the formation of gluconic acid, protons, and electrons, which then travel to the external electrical circuit:
At the cathode, oxygen electroreduction occurs according to the overall reaction (2) with protons generated at the anode and electrons from the external circuit:
It is assumed that glucose is a nutrient substrate consumed by microorganisms immobilized on a carbon material. The rate of glucose consumption is the rate of exogenous respiration of microorganisms. The dynamics of glucose consumption by active biomass at the anode is described by the Nerst–Monod equation accounting for microorganisms population growth kinetics as well as electro-oxidation of glucose [38]:
where Rexo is the exogenous respiration rate of microorganisms, mol/(m3s); ρb is the active biomass density (amount of biomass per AL volume), kg(BM)/m3(AL); µb is a specific growth rate of active biomass, 1/s; Xb is a volume fraction of active biomass (dimensionless); Yb is the active biomass growth yield, expressed as a dry biomass to consumed oxygen (chemical oxygen demand (COD)) mass ratio, kgdry biomass/kgCOD; γcod is COD equivalence of glucose, expressed as oxygen consumed to glucose ratio, kgCOD/molglucose; [G] is a glucose concentration in the anode AL, mol/m3; KG is the half velocity constant, (Monod) for glucose, mol/m3; α is the anodic charge transfer coefficient; n is the number of electrons participating in the electrochemical reaction; F is the Faraday constant, C/mol; η is overpotential, V; R is the universal gas constant, J/(mol·K); T is temperature, K.
In microorganisms, exogenous respiration occurs in parallel with endogenous respiration, which can lead to a reduction in their mass and abundance. At the same time, microorganisms oxidize their own cellular mass with the generation of additional electrons, formed similarly upon substrate electro-oxidation. The endogenous respiration rate is given by the equation similar to the Nerst–Monod equation:
where Rendo is the rate of microorganisms endogenous respiration, mol/(m3s); bendo is microorganism decay constant, 1/s.
The equation describing the dynamics of oxygen electroreduction reaction at the cathode is written as the Butler–Volmer equation [50]:
where Wc is the rate of oxygen electroreduction at the cathode, mol/(m3 s); kc is oxygen electroreduction rate constant, 1/s; [O2] is the oxygen concentration in the cathode active layer, mol/m3.
Glucose, dissolved oxygen, and proton fluxes in the active layer of electrodes and electrolyte are due to migration in the electric field (for protons) or diffusion caused by concentration gradient, and can be described by the Nernst–Planck equation. The active layer is a carbon material whose characteristics, roughness, porosity, and other irregularities can be described using the mathematical tools developed for fractal structures. Thus, the material balance equation for an element of a small volume of the active layer, analogously to [51], is written in the form of the equation with the time-fractional derivative, taking into account the fractal nature of the active layer, as well as electromigration of charged particles, diffusion of components due to concentration gradient, and their consumption/production upon the reaction.
The glucose concentration dynamics in the active layer of the anode results from diffusion and to glucose consumption by microorganisms in the process of their exogenous respiration:
Here, γ is the material porosity (determines the part of pores, available for electrolyte flow), 0 < γ < 1 [52]; Djγ is the diffusion coefficient of the component within the porous active layer, m2/sγ; related to general diffusion coefficient by Dγ = DγS(1-γ); S is a channel cross-sectional area available for the electrolyte flow, m; Dj is the diffusion coefficient of the particle, m2/c; zj is the particle charge; x is the electrode thickness coordinate, m; t is time, s.
Proton concentration dynamics in the active layer of the anode is due to diffusion, electromigration, and exogenous respiration of the microorganisms (consumption of glucose):
where Фl is the potential of the liquid (ion-conducting) phase, V.
According to [50], overpotential for the electrochemical reactions can be expressed in the following ways: (1) the difference between the potential of the electrode and a reference electrode of the same kind; (2) the difference between the potential of the electrode (relative to the solution) and the value at equilibrium or open-circuit; and (3) the electrochemical potential of electrons in the electrode compared to electrochemical potentials of other participants in the electrode reaction. For example, in works [26,53,54], the overvoltage is the difference between anodic potential and acceptor potential for the half-maximum-rate. The difference between the potential of the electrode and the value at equilibrium was used e.g., in studies [55,56]. Another possibility is to consider the expression of the overpotential as the difference between potentials of electron and ion conducting phases. Such method was reported in the monograph [50], at the modeling of polymer electrolyte fuel cells [57,58,59], simulation with the software ANSYS FLUENT, and, finally, modeling of EFCs [21,25].
Anode overpotential is expressed similarly to [21] as:
where Фs is the potential of the solid (electron-conducting) phase, V.
ηa = Φs − Φl
The relationship between the potential and the current density is expressed by the Poisson equation and for the potentials of the solid and the liquid phases similarly to [26] by the Bruggeman correlation for the difference in the phase conductivity:
where ε is a liquid phase volume fraction in the electrode active layer; κj is a conductivity of electron (s) and ion (l) conducting phases, A/(Vm); i is the local current density, A/m3.
The local current density is related to the electrode reaction rate by the Faraday equation. For the anode, it is written as:
At the cathode:
The total current density was evaluated by spatial integration of the local current density over the thickness of the electrode active layer:
The system of differential Equations (6), (7), (9), and (10) were solved by the finite-difference method. Equations (6) and (7) are parabolic differential equations solved by the sweep method. Equations (9) and (10) are elliptic type equations solved using the method with the addition of a time derivative.
The boundary conditions for Equations (6), (7), (9), and (10) are given below.
The initial condition and boundary conditions for solving the equation describing glucose concentration dynamics in the cell (6) are as follows:
The initial condition and boundary conditions for solving the equation describing protons concentration dynamics at the anode (7) were written assuming the proton concentration at the anode/electrolyte interface equals to proton concentration in the electrolyte solution, since the solution in the cell is a buffer with a constant pH:
Initial condition and boundary conditions for Equation (9) for the potential of the electron-conducting phase at the anode:
Initial condition and boundary conditions for Equation (10) for the potential of the ion-conducting phase at the anode:
The change in the concentration of the oxygen dissolved in the electrolyte and in the active layer of the cathode is due to diffusion and electroreduction:
The change in the proton concentration in the cathode active layer is due to diffusion, electromigration, and oxygen electroreduction:
Initial condition and boundary conditions for the equation describing oxygen concentration dynamics at the cathode (18):
where is the oxygen concentration in the feed flow, mol/m3, and is the modified oxygen mass transfer (from the inlet flow to the cathode active layer) coefficient, m/sγ.
Initial condition and boundary conditions for the Equation (19) for the proton concentration dynamics at the cathode:
Initial condition and boundary conditions for the Equation (9) for the potential of the electron-conducting phase at the cathode:
where Voc is the open circuit voltage, V and Ea is the applied potential, V.
Initial condition and boundary conditions for the Equation (10) for the potential of the ion-conducting phase at the cathode:
Cathode overvoltage is written as:
3. Results and Discussion
3.1. Experimental Results
Figure 5 shows testing data of 20 Au/XC-72 (anode)—laccase (cathode) FCs of various designs. One can see that the developed membraneless cell (cell 2) provides more than 10-fold increase in the device power in comparison to the data obtained in the Electrochem™ cell (cell 1). The observed improvement in the characteristics is due to an increase in the rate of not only the anodic but also the cathodic process (Figure 5b). It should be noted that the functioning of the Electrochem™ cell required constant pumping of electrolyte through the system, which led to the flooding of the cathode. In addition, the usage of a thin fiberglass separator under constant compression in the Electrochem™ cell did not appear to be able to separate effectively the cathode and anode. On the contrary, in the developed membraneless cell, the electrodes were rigidly separated by ~5 mm wide electrolyte chamber. During practically all the experiments, the electrolyte and glucose solution was pumped into the electrolyte chamber beforehand. In this case, the continuous pumping of electrolyte was not required, since a single filling of the chamber was sufficient to obtain at least three reproducible volt–ampere curves.
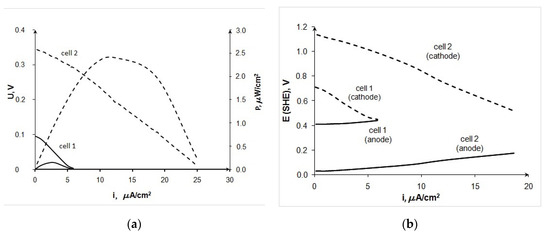
Figure 5.
Comparison of characteristics for BFC 20Au/XC-72 (anode)—laccase (cathode), measured in the Electrochem™ cell (cell 1) and in the developed BFC (cell 2), 0.2 M glucose, pH 4.7, (a) current–voltage curves, (b) partial curves.
The experiments with various catalytic systems with both biotic and abiotic catalysts have been carried out. Table 1 shows the summarized data characterizing the tests of membraneless glucose-oxygen BFC in the cells of the developed design in the mode of measuring current–voltage curves at a voltage sweep rate of 0.3 mV/s. Buffer solution—0.2 M Na2HPO4, pH = 8 (unless otherwise indicated). Pmax (at U, mV) is the maximum power density and voltage at which it is reached, imax is the maximum achievable current density (at U ~ 0). Eanode and Ecathode are stationary potentials of the anode and cathode, respectively. Table 1 shows the average values obtained for each pair of catalytic systems; tests are conducted in triplicate.

Table 1.
Test results of membraneless glucose-oxygen FC * and BFC **.
Since the purpose of this work is to compare FC with abiotic and biotic catalysts, the main attention was paid to BFC, i.e., the use of biological catalysts. For laccase, conditions with a pH of 4.7 are optimal, and for an anode catalyst—Bacterial cultures (BM), the optimum pH is close to 8. The data obtained show that the best results in BFC were obtained at pH 8, owing to the use of a biocathode (laccase) and an abiotic anode (Au/CNT), which is known to have a higher activity at pH 8 [49].
Figure 6 shows the reproducibility interval and the reliability of obtained results. Solid lines indicate the first experiment, while dashed and dotted lines refer to the second and the third experiment, respectively.
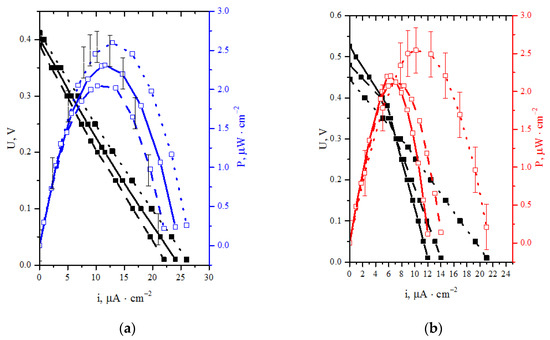
Figure 6.
Discharge and specific power characteristics for two systems: (a) laccase (cathode)—Au/CNT (anode) BFC; (b) laccase (cathode)—BM + TEG (anode) BFC.
Figure 7a shows average data for discharge and specific power characteristics for FCs with phosphate electrolyte (pH 8) containing 0.2 M glucose. The anodes based on the initial GDL with deposited CNTs (0.4 mg/cm2) and GDL with deposited CNTs (at the rate of 0.4 mg/cm2) mixed with biomaterials with different ratios of fungal and bacterial cultures were applied. Here, bio(black)—the prevalence of P. glabrum, up to 75% of fungal cultures, bio(white)—up to 75% of the nitrogen-fixing community, the rest is fungal cultures. Figure 7b shows current–voltage curves and dependencies of the power density on the current density of FCs with phosphate electrolyte (pH 4.7 and 8) containing 0.5 M glucose. The anodes based on the initial GDL with deposited expanded graphite (0.4 mg/cm2) mixed with BM (bio (white)) were applied.
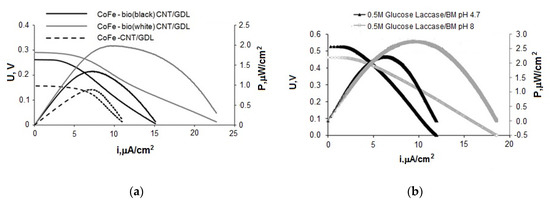
Figure 7.
Current–voltage potentiodynamic curves and dependences of power density on current density, (a) BFC bioanode—CoFe cathode, (b) BFC bioanode—biocathode (laccase).
One can formulate the following conclusions on the base of analysis of the obtained results:
- BFC with the structure CoFe/C (cathode)—20Au/CNT (anode) has the highest characteristics among the tested FCs. The results are achieved with the acetate-phosphate buffer solution at pH 8 and can be further improved by increasing the glucose concentration from 0.2 to 0.5 M. The maximum power density of the system was 137 μW/cm2, which corresponds to the level of the best indicators for fuel cells without a membrane described in the literature [60,61].
- The overvoltage of the electrodes makes comparable contributions to the total voltage drop of the BFC at the application of the laccase-based cathode and Au/C anode in an electrolyte with pH 4.7. At pH 8, the BFC characteristics are limited by the overvoltage increase of the cathodic process. However, with the usage of Au/C anode, the growth of the cathodic overpotential at going from pH 4.7 to pH 8 is compensated by the anode overpotential decrease. This causes an increase in the maximum power density of BFC laccase-Au/CNTs from 2.3 μW/cm2 (pH 4.7) to 42.5 μW/cm2 (pH 8).
- The most effective approach to the formation of an anode based on biological material is the preliminary immobilization of the microorganisms on carbon material (CNT or TEG), followed by applying of CM+ BM mixture on GDL. The maximum power density of the BFC bioanode—CoFe cathode reached 2 µW/cm2 with using BM + CNT anode. The best results obtained at testing FCs with a biocathode and bioanode correspond to 2.75 μW/cm2 in the BFC laccase cathode—BM+TRG in an electrolyte with pH 8 at a glucose concentration of 0.5 M. These characteristics are higher than those obtained in the development of BFC with bioelectrodes [62]. The ratio of bacterial (nitrogen-fixing associate) and fungal cultures in the microbiological community was 75:25.
3.2. Results of Mathematical Modeling
Simulations were performed using a programming module written in C++ for MFC with CNT + BM anode and CoFe cathode, glucose concentration 0.2 M. In this case, the MFC maximum power density reaches 2 μW/cm2. To solve the mathematical model equations, the kinetic parameters were determined. The reactions rates constants were derived using the scanning method.
Initial approximations for the constants were obtained from the literature data. The values of parameters used in calculations are presented in Table 2.
Table 2.
List of simulation parameters.
The dependences of the current density vs. the cell voltage were obtained (Figure 8) as a result of the calculations based on the mathematical model with the found parameters listed in Table 2.
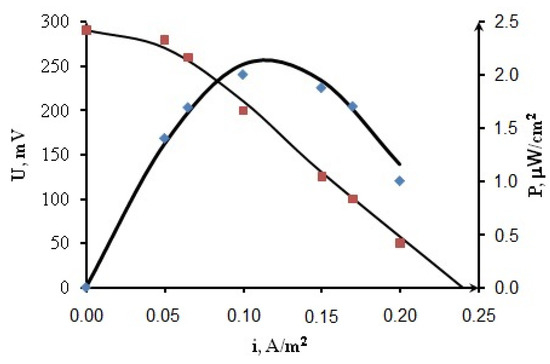
Figure 8.
Current–voltage potentiodynamic curves and dependences of power density on current density for MFC CoFe/CNT + BM.
Figure 8 shows a good agreement between calculation results (lines) and the average experimental data (dots), which indicates the adequacy of the model.
Figure 9 shows simulated glucose concentration vs. carbon material thickness (Figure 9a), and vs. time (Figure 9b). The concentration vs. CM thickness curves in Figure 9a correspond to the time points 1 s, 240 s, and 400 s from the beginning of bioelectrocatalysis process. As seen from Figure 9b, the glucose concentration at the anode decreases with time due to glucose consumption by microorganisms. Figure 9b shows glucose concentration dynamics for different thicknesses of the active layer (CM).
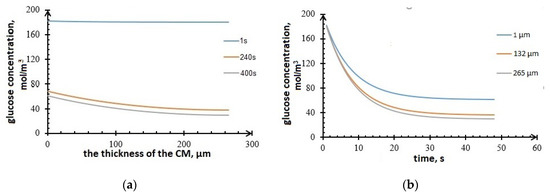
Figure 9.
Glucose concentration in the anode (a) vs. CM thickness; (b) vs. time.
Figure 10 below shows the plots of the profiles’ concentration changes in the anode. It can be seen from the plots that the protons’ concentration increases during the first 100 s as a result of the electrochemical reaction and diffusion. However, protons migrate to the electrolyte within the time.
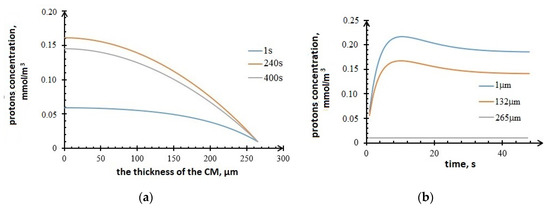
Figure 10.
Profiles of protons concentration in the anode, (a) vs. CM thickness; (b) vs. time.
The values of the components concentrations in the cathode are obtained. Figure 11 shows the profiles of the oxygen concentration changes in the cathode. It can be seen from the plots that the oxygen accumulates in the active layer of the carbon material over time.
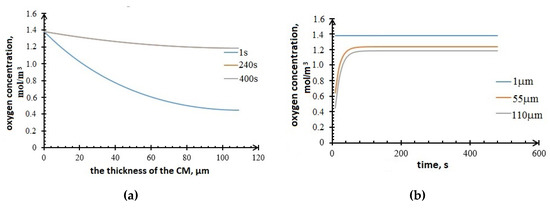
Figure 11.
Profiles of oxygen concentration in the cathode (a) vs. CM thickness; (b) vs. time.
Since the fuel concentration is considered to be an important factor affecting the BFCs performance, a series of calculations with different values of fuel (glucose) concentration in the range of 0.015–1.5 M were carried out in order to optimize the operating modes. It was determined that the optimal glucose concentration equals 0.5 M. Figure 12 shows that a further increase in fuel concentration does not lead to a significant increase in power.
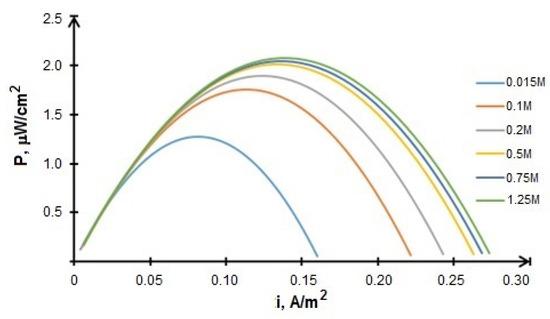
Figure 12.
Calculated power density values vs. current density for MFC CoFe/ CNT + BM at different fuel concentrations.
However, one of the characteristic features of the growth of the microorganisms is the often observed effects of its inhibition by a substrate excess. The microorganisms specific growth rate reaches “saturation” with an increase of the substrate concentration and then, at high substrate concentrations, the rate begins to decrease. Therefore, the population active growth becomes possible only in a narrow range of substrate concentrations. At the same time, the glucose concentration of 0.5 M fully satisfies these conditions.
4. Conclusions
The cell for carrying out the bioelectrocatalysis process has been developed. The advantages of the developed cell over the commercial one, Electrochem™ cell (shown in Figure 5), in terms of BFC operating conditions, are the following: reduced probability of anode and cathode contact, absence of the necessity for continuous electrolyte pumping through the system, and, consequently, a decrease of cathode flooding and an increase in the glucose oxidation rate due to the longer presence of its molecules in the anodic active layer.
Moreover, the maximum power density obtained at pH 8 is much higher than that reported in [62] and references thereto (42.5 μW/cm2 vs. the maximum value of power density obtained in the cited work 5.16 μW/cm2), represents an advantage of the proposed BFC over the commercial cell.
The obtained empirical data agree with the literary reference one for membraneless BFCs with the catalysts of biotic, as well as abiotic nature. Their power depends on the composition of the anode and the cathode and varies in the range from several μW/cm2 to 3–5 mW/cm2. Despite the moderate characteristics, such FCs attract the attention of researchers due to their mild operating conditions and environmental friendliness. In many cases, their advantages are explained by the absence of a membrane. Further research will be aimed at finding new anode catalysts based on microbiological communities and enzymes, as well as methods for microorganisms immobilization.
The mathematical model has been developed. It includes equations for the kinetics of electrochemical reactions and the growth of microbiological population, the material balance of the components, and charge balance. The results of calculations of the distribution of component concentrations vs. active layer thickness, and vs. time have been obtained. The calculated data correspond to the experimental ones.
Optimization for fuel concentration has been carried out. The optimal glucose concentration is 0.5 M.
This study is the basis for conducting further research into the development of efficient MFC pattern integrated with a membrane bioreactor for treatment of a wide range of wastewater (based on the usage of conductive aerobic sludge as an anode biocatalyst). Simultaneous energy accumulation is foreseen. The accumulated energy will be consumed in a resource saving wastewater treatment technological scheme.
Author Contributions
Formal analysis, V.V. and S.K.; Investigation, V.V., I.A., S.K., and M.V.; Methodology, V.V., V.B., G.S., and S.K.; Project administration, E.K.; Software, V.B. and G.S.; Writing—original draft, V.V. and I.A.; Writing—Review and editing, M.V. and E.K. All authors have read and agreed to the published version of the manuscript.
Funding
This research was funded by The Ministry of Education and Science of the Russian Federation, grant number 13.10932.2018/10.11.
Conflicts of Interest
The authors declare no conflict of interest.
References
- Rozendal, R.A.; Hamelers, H.V.; Rabaey, K.; Keller, J.; Buisman, C.J. Towards practical implementation of bioelectrochemical wastewater treatment. Trends Biotechnol. 2008, 26, 450–459. [Google Scholar] [CrossRef] [PubMed]
- Sleutels, T.H.; Ter Heijne, A.; Buisman, C.J.; Hamelers, H.V. Bioelectrochemical systems: An outlook for practical applications. ChemSusChem 2012, 5, 1012–1019. [Google Scholar] [CrossRef] [PubMed]
- Leech, D.; Kavanagh, P.; Schuhmann, W. Enzymatic fuel cells: Recent progress. Electrochim. Acta 2012, 84, 223–234. [Google Scholar] [CrossRef]
- Opallo, M.; Dolinska, J. Glucose Electrooxidation. In Reference Module in Chemistry, Molecular Sciences and Chemical Engineering. Encyclopedia of Interfacial Chemistry. Surface Science and Electrochemistry; Wandelt, K., Ed.; Elsevier: Oxford, UK, 2018; pp. 633–642. [Google Scholar] [CrossRef]
- Retautas, D.; Marcinkevičiene, L.; Meskys, R.; Kulys, J. Mediatorless electron transfer in glucose dehydrogenase/laccase system adsorbed on carbon nanotubes. Electrochim. Acta 2015, 174, 940–944. [Google Scholar] [CrossRef]
- Ramašauskas, L.; Meškys, R.; Ratautas, D. Real-time glucose monitoring system containing enzymatic sensor and enzymatic reference electrodes. Biosens. Bioelectron. 2020, 164, 112338. [Google Scholar] [CrossRef]
- Persson, B.; Gorton, L.; Johansson, G.; Torstensson, A. Biofuel anode based on D-glucose dehydrogenase, nicotinamide adenine dinucleotide and a modified electrode. Enzym. Microb. Technol. 1985, 7, 549–552. [Google Scholar] [CrossRef]
- Yahiro, A.T.; Lee, S.M.; Kimble, D.O. Bioelectrochemistry: I. Enzyme utilizing bio-fuel cell studies. Biochim. Biophys. Acta 1964, 88, 375–383. [Google Scholar] [CrossRef]
- Laane, C.; Pronk, W.; Franssen, M.; Veeger, C. Use of a bioelectrochemical cell for the synthesis of (bio)chemicals. Enzym. Microb. Technol. 1984, 6, 165–168. [Google Scholar] [CrossRef]
- Kuznetsova, L.N.; Tarasevich, M.R.; Bogdanovskaya, V.A. Macrokinetics of processes in glucose oxidase-peroxidase bienzyme systems when assaying glucose by the H2O2 reduction current: Effect of the enzyme ratio on the steady-state potential and H2O2 reduction current in glucose solutions of different concentrations. Russ. J. Electrochem. 2000, 36, 716–720. [Google Scholar] [CrossRef]
- Khokhlachev, N.S.; Kalenov, S.V.; Zanina, O.S.; Tyupa, D.V.; Baurina, M.M.; Kuznetsov, A.Y. The role of stress agents as operating factors in formation and functioning of granular aerobic activated sludge at model domestic wastewater treatment. Bioprocess Biosyst. Eng. 2014, 37, 1771–1779. [Google Scholar] [CrossRef]
- Tyupa, D.V.; Kalenov, S.V.; Baurina, M.M.; Yakubovich, L.M.; Morozov, A.N.; Zakalyukin, R.M.; Sorokin, V.V.; Skladnev, D.A. Efficient continuous biosynthesis of silver nanoparticles by activated sludge micromycetes with enhanced tolerance to metal ion toxicity. Enzym. Microb. Technol. 2016, 95, 137–145. [Google Scholar] [CrossRef]
- Su, K.Z.; Yu, H.Q. Formation and characterization of aerobic granules in a sequencing batch reactor treating soybean-processing wastewater. Environ. Sci. Technol. 2005, 39, 2818–2827. [Google Scholar] [CrossRef] [PubMed]
- Rajendran, L.; Kirthiga, M.; Laborda, E. Mathematical modeling of nonlinear reaction–diffusion processes in enzymatic biofuel cells. Curr. Opin. Electrochem. 2017, 1, 121–132. [Google Scholar] [CrossRef]
- Bavarian, M.; Soroush, M.; Kevrekidis, I.G.; Benziger, J.B. Mathematical modeling, steady-state and dynamic behavior, and control of fuel cells: A review. Ind. Eng. Chem. Res. 2010, 49, 7922–7950. [Google Scholar] [CrossRef]
- Barton, S.C. 1D models for enzymatic biological fuel cells. Electrochem. Soc. Interface 2015, 24, 61–65. [Google Scholar] [CrossRef]
- Ivanov, I.; Vidaković-Koch, T.; Sundmacher, K. Recent advances in enzymatic fuel cells: Experiments and modeling. Energies 2010, 3, 803–846. [Google Scholar] [CrossRef]
- Gallaway, J.W.; Calabrese Barton, S.A. Kinetics of redox polymer-mediated enzyme electrodes. J. Am. Chem. Soc. 2008, 130, 8527–8536. [Google Scholar] [CrossRef]
- Tamaki, T.; Ito, T.; Yamaguchi, T. Modelling of reaction and diffusion processes in a high-surface-area biofuel cell electrode made of redox polymergrafted carbon. Fuel Cells 2009, 9, 37–43. [Google Scholar] [CrossRef]
- Rajendran, L.; Saravanakumar, K. Analytical expression of transient and steady-state catalytic current of mediated bioelectrocatalysis. Electrochim. Acta 2014, 147, 678–687. [Google Scholar] [CrossRef]
- Chan, D.S.; Dai, D.J.; Wu, H.S. Dynamic modeling of anode function in enzyme-based biofuel cells using high mediator concentration. Energies 2012, 5, 2524–2544. [Google Scholar] [CrossRef]
- Song, Y.; Penmatsa, V.; Wang, C. Modeling and simulation of enzymatic biofuel cells with three-dimensional microelectrodes. Energies 2014, 7, 4694–4709. [Google Scholar] [CrossRef]
- Bedekar, A.S.; Feng, J.J.; Krishnamoorthy, S.; Lim, K.G.; Palmore, G.T.R.; Sundaram, S. Oxygen limitation in microfluidic biofuel cells. Chem. Eng. Commun. 2007, 195, 256–266. [Google Scholar] [CrossRef]
- Kjeang, E.; Sinton, D.; Harrington, D.A. Strategic enzyme patterning for microfluidic biofuel cells. J. Power Sources 2006, 158, 1–12. [Google Scholar] [CrossRef]
- Osman, M.H.; Shah, A.A.; Wills, R.G.A.; Walsh, F.C. Mathematical modelling of an enzymatic fuel cell with an air-breath cathode. Electrochim. Acta 2013, 112, 386–393. [Google Scholar] [CrossRef]
- Do, T.Q.N.; Varničić, M.; Hanke-Rauschenbach, R.; Vidaković-Koch, T.; Sundmacher, K. Mathematical modeling of a porous enzymatic electrode with direct electron transfer mechanism. Electrochim. Acta 2014, 137, 616–626. [Google Scholar] [CrossRef]
- Sindhuja, M.; Kumar, N.S.; Sudha, V.; Harinipriya, S. Equivalent circuit modeling of microbial fuel cells using impedance spectroscopy. J. Energy Storage 2016, 7, 136–146. [Google Scholar] [CrossRef]
- Esfandyari, M.; Fanaei, M.A.; Gheshlaghi, R.; Mahdavi, M.A. Neural network and neuro-fuzzy modeling to investigate the power density and Columbic efficiency of microbial fuel cell. J. Taiwan Inst. Chem. Eng. 2015, 58, 84–91. [Google Scholar] [CrossRef]
- Ali, A.H.; Al-Mussawy, H.A.; Hussein, M.J.; Hamadi, N.J. Experimental and Theoretical Study on the Ability of Microbial Fuel Cell for Electricity Generation. Pollution 2018, 4, 359–368. [Google Scholar] [CrossRef]
- Hernandez-Flores, G.; Poggi-Varaldo, H.M.; Solorza-Feria, O.; Ponce Noyola, M.T.; Romero-Castanon, T.; Rinderknecht-Seijas, N. Tafel equation based model for the performance of a microbial fuel cell. Int. J. Hydrog. Energy 2015, 40, 17421–17432. [Google Scholar] [CrossRef]
- Cecconet, D.; Bolognesi, S.; Molognoni, D.; Callegari, A.; Capodaglio, G.A. Influence of reactor’s hydrodynamics on the performance of microbial fuel cells. J. Water Process Eng. 2018, 26, 281–288. [Google Scholar] [CrossRef]
- Zhang, X.C.; Halme, A. Modelling of a microbial fuel cell process. Biotechnol. Lett. 1995, 17, 809–814. [Google Scholar] [CrossRef]
- Lan, T.H.; Wang, C.T.; Sangeetha, T.; Yang, Y.C.; Garg, A. Constructed mathematical model for nanowire electron transfer in microbial fuel cells. J. Power Sources 2018, 402, 483–488. [Google Scholar] [CrossRef]
- Oliveira, V.B.; Simxes, M.; Melo, L.F.; Pinto, A.M.F.R. A 1D mathematical model for a microbial fuel cell. Energy 2013, 61, 463–471. [Google Scholar] [CrossRef]
- Drobotenko, M.I.; Svidlov, A.A. Mathematical modeling of processes in a microbial fuel cell taking into account their spatial heterogeneity. Ecol. Bull. Res. Cent. Black Sea Econ. Coop. 2017, 4, 81–85. [Google Scholar]
- Zeng, Y.; Choo, Y.F.; Kim, B.H.; Wu, P. Modelling and simulation of two-chamber microbial fuel cell. J. Power Sources 2010, 195, 79–89. [Google Scholar] [CrossRef]
- Mardanpour, M.M.; Yaghmaei, S.; Kalantar, M. Modeling of microfluidic microbial fuel cells using quantitative bacterial transport parameters. J. Power Sources 2017, 342, 1017–1031. [Google Scholar] [CrossRef]
- Sirinutsomboon, B. Modeling of a membraneless single-chamber microbial fuel cell with molasses as an energy source. Int. J. Energy Environ. Eng. 2014, 5, 93. [Google Scholar] [CrossRef]
- Bogdanovskaya, V.A.; Arkad’eva, I.N.; Osina, M.A. Bioelectrocatalytic oxygen reduction by laccase immobilized on various carbon carriers. Russ. J. Electrochem. 2017, 53, 1323–1333. [Google Scholar] [CrossRef]
- Arkadeva, I.N.; Bogdanovskaya, V.A.; Vasilenko, V.A.; Fokina, E.A.; Koltsova, E.M. Laccase spontaneous adsorption immobilization: Experimental studies and mathematical modeling at enzymatic fuel cell cathode construction. In IOP Conference Series: Earth and Environmental Science, Proceedings of the 2nd International Conference on Green Energy Technology (ICGET 2017), Rome, Italy, 18–20 July 2017; IOP Publishing Ltd.: Bristol, UK, 2017; Volume 83, pp. 127–134. [Google Scholar] [CrossRef]
- Arkadeva, I.; Fokina, E.; Bogdanovskaya, V.; Koltsova, E. Mathematical modeling of glucose electro-oxidation in a slight acid solution at the biofuel cell anode. In Proceedings of the 18th International Multidisciplinary Scientific GeoConference SGEM, Albena, Bulgaria, 2–8 July 2018; Volume 18, pp. 441–448. [Google Scholar] [CrossRef]
- Vasilenko, V.A.; Arkadeva, I.N.; Bogdanovskaya, V.A.; Fokina, E.A.; Koltsova, E.M. Research and mathematical modelling of direct bioelectrocatalytic oxygen reduction by laccase. Chem. Eng. Trans. 2018, 70, 1609–1614. [Google Scholar] [CrossRef]
- Koltsova, E.; Bogdanovskaya, V.; Vasilenko, V.; Kalenov, S.; Korchagin, O.; Fokina, E. Development of a bioanod, experimental studies and mathematical modelling of membraneless microbial fuel cell. Mater. Sci. Forum 2020, 995, 77–83. [Google Scholar] [CrossRef]
- Reshetilov, A.N.; Kitova, A.E.; Kolesov, V.V.; Yaropolov, A.I. Mediator-free bioelectrocatalytic oxidation of ethanol on an electrode from thermally expanded graphite modified by Gluconobacter oxydans membrane fractions. Electroanalysis 2015, 27, 1443–1448. [Google Scholar] [CrossRef]
- Vassilyev, Y.B.; Khazova, O.A.; Nikilaeva, N.N. Kinetics and mechanism of glucose electrooxidation on different electrode-catalysts: Part II. Effect of the nature of the electrode and the electrooxidation mechanism. J. Electroanal. Chem. 1985, 196, 127–144. [Google Scholar] [CrossRef]
- Bogdanovskaya, V.A.; Beketaeva, L.A.; Rybalka, K.V.; Efremov, B.N.; Zagudaeva, N.M.; Sakashita, M.; Iidzima, T.; Ismagilov, Z.R. Nanosize catalysts based on carbon materials promoted by cobalt tetra(para-methoxyphenyl) porphyrin pyropolymer for oxygen electroreduction. Russ. J. Electrochem. 2008, 44, 293–302. [Google Scholar] [CrossRef]
- Bogdanovskaya, V.A.; Tarasevich, M.R.; Lozovaya, O.V. Kinetics and mechanism of oxygen electroreduction on PtCoCr/C catalyst containing 20–40 wt % platinum. Russ. J. Electrochem. 2011, 47, 846–860. [Google Scholar] [CrossRef]
- Arkadeva, I.; Vasilenko, V.; Bogdanovskaya, V.; Sudarev, G.; Koltsova, E. Glucose-oxygen biofuel cell based on laccase cathode and gold-modified carbon black anode: Experimental research and mathematical modelling. In IOP Conference Series: Earth and Environmental Science, Proceedings of the 3rd International Conference on Green Energy and Environment Engineering (CGEEE 2020), Jeju Island, Korea, 22–24 July 2020; IOP Publishing Ltd.: Bristol, UK, 2020; in press. [Google Scholar]
- Shi, Q.; Diao, G.; Mu, S. The Electrocatalytic oxidation of glucose on the bimetallic Au-Ag particles-modified reduced graphene oxide electrodes in alkaline solutions. Electrochim. Acta 2014, 133, 335–346. [Google Scholar] [CrossRef]
- Newman, J.; Thomas-Alyea, K.E. Electrochemical Systems, 3rd ed.; John Wiley & Sons, Inc.: Hoboken, NJ, USA, 2004; p. 647. [Google Scholar]
- Kol’tsova, E.M.; Vasilenko, V.A.; Tarasov, V.V. Numerical methods for solving transport equations in fractal media. Russ. J. Phys. Chem. A 2000, 74, 848–850. [Google Scholar]
- Vasilenko, V.A.; Kolítsova, E.M.; Tarasov, V.V.; Gordeev, L.S. Methods of fractal geometry in investigation and simulation of mass transfer processes in liquid-liquid systems. Theor. Found. Chem. Eng. 2008, 42, 246–250. [Google Scholar] [CrossRef]
- Kato Marcus, A.; Torres, C.I.; Rittman, B.E. Conduction-based modeling of the biofilm anode of a microbial fuel cell. Biotechnol. Bioeng. 2007, 98, 1171–1182. [Google Scholar] [CrossRef]
- Torres, C.I.; Kato Marcus, A.; Parameshwaran, P.; Rittman, B.E. Kinetic experiments for evaluating the Nernst-Monod model for anode-respiring bacteria (ARB) in a biofilm anode. Environ. Sci. Technol. 2008, 42, 6593–6597. [Google Scholar] [CrossRef]
- Ahluwalia, R.K.; Arisetty, S.; Peng, J.K.; Subbaraman, R.; Wang, X.; Kariuki, N.; Myers, D.J.; Mukundan, R.; Borup, R.; Polevaya, O. Dynamics of particle growth and electrochemical surface area loss due to platinum dissolution. J. Electrochem. Soc. 2014, 161, F291–F304. [Google Scholar] [CrossRef]
- Hiraoka, F.; Kohno, Y.; Matsuzawa, K.; Mitsushima, S. A simulation study of Pt particle degradation during potential cycling using a dissolution/deposition method. Electrocatalysis 2015, 6, 10–108. [Google Scholar] [CrossRef]
- Darling, R.M.; Meyers, J.P. Kinetic model of platinum dissolution in PEMFCs. J. Electrochem. Soc. 2003, 150, A1523–A1527. [Google Scholar] [CrossRef]
- Arvay, A.; Ahmed, A.; Peng, X.-H.; Kannan, A.M. Convergence criteria establishment for 3D simulation of proton exchange membrane fuel cell. Int. J. Hydrog. Energy. 2012, 37, 2482–2489. [Google Scholar] [CrossRef]
- Robin, C.; Gerard, M.; Franco, A.A.; Schott, P. Multi-scale coupling between two dynamical models for PEMFC aging prediction. Int. J. Hydrog. Energy 2013, 38, 4675–4688. [Google Scholar] [CrossRef]
- Christwardana, M.; Kim, K.J.; Kwon, Y. Fabrication of mediatorless/membraneless glucose/oxygen based biofuel cell using biocatalysts including glucose oxidase and laccase enzymes. Sci. Rep. 2016, 6, 30128. [Google Scholar] [CrossRef]
- Santiago, Ó.; Navarro, E.; Raso, M.A.; Leo, T.J. Review of implantable and external abiotically catalysed glucose fuel cells and the differences between their membranes and catalysts. Appl. Energy 2016, 179, 497–522. [Google Scholar] [CrossRef]
- Bollella, P.; Fusco, G.; Stevar, D.; Gorton, L.; Ludwig, R.; Ma, S.; Boer, H. A glucose/oxygen enzymatic fuel cell based on gold nanoparticles modified graphene screen-printed electrode. Proof-of-concept in human saliva. Sens. Actuators B Chem. 2017, 256, 921–930. [Google Scholar] [CrossRef]


Publisher’s Note: MDPI stays neutral with regard to jurisdictional claims in published maps and institutional affiliations. |
© 2020 by the authors. Licensee MDPI, Basel, Switzerland. This article is an open access article distributed under the terms and conditions of the Creative Commons Attribution (CC BY) license (http://creativecommons.org/licenses/by/4.0/).