Article

Power Exchange Prices: Comparison of Volatility in European Markets

1
Department of Industrial Engineering, Faculty of Technical Sciences, University of Novi Sad, 21000 Novi Sad, Serbia
2
NIS j.s.c., 21000 Novi Sad, Serbia
3
The Management Faculty, Czestochowa University of Technology, 42-201 Czestochowa, Poland
4
Entrepreneurship Education, College of Business and Economics, University of Johannesburg, Johannesburg 2006, South Africa
*
Author to whom correspondence should be addressed.
Energies 2020, 13(21), 5620; https://doi.org/10.3390/en13215620
Submission received: 22 September 2020 / Revised: 16 October 2020 / Accepted: 23 October 2020 / Published: 27 October 2020
(This article belongs to the Special Issue Management and Technology for Energy Efficiency Development)

Abstract

:
Power exchanges in Europe have been operating since the 1990s, while in the region of Southeast Europe (SEE) they are only a few years old. Volatility is considered to be one of the indicators that define the level of market development. In this paper, the authors examine 15 power markets in Europe with the novelty of special attention dedicated to the SEE markets, in terms of their volatility. The aim of this paper is to investigate volatility on SEE markets, and their correlation with developed European markets. Power price volatility is measured by price velocity concepts, the daily velocity based on daily/monthly/quarterly/yearly and overall average power prices. The outcomes reveal that power price volatility is higher in new SEE markets than in more mature European markets. The least volatile market is the Greek pool, followed by Switzerland and Austria. The Bulgarian market is the most volatile, followed by that of Romania, and these markets are nearly twice as volatile as the ones previously mentioned. A correlation matrix is carried out and confirms positive correlation between all markets in terms of their average prices. However, a correlation matrix of measured volatilities depicts a negative correlation, in some cases, between SEE and Central European (CE) markets.

Graphical Abstract

1. Introduction

Electricity provides humanity with light and warmth, representing an essential good and a basic element of any industrial activity. It can be bought or sold in deregulated electricity markets and traded as any other commodity [1]. On the other hand, historically, electricity and gas network industries across the world were usually regulated by governments and often operated as natural monopoly [2]. Reforms of liberalizing power industry started in Norway, United Kingdom, United States, and Chile in the late 1980s [3]. Technology advancement in the generation and in power networks, have enabled a separation of what had previously been a natural monopoly [4]. Borenstein and Bushnell in 2015 [5] as well as Newbery in 2004 [6] concluded that restructuring of electricity sector did not fulfill all expectations as costs overweighed the benefits. This process includes breaking up vertically integrated and privatizing state-owned power utilities and requiring them to operate under commercial and corporate principles [7], liberalizing power generation and allowing the entrance of independent power producers, forming independent regulatory agencies, and introducing competitive wholesale and retail markets [8]. In previous years, EU electricity liberalization remained a formidable energy reform program, unmatched in scale and depth in any other major region of the world [9].
In order to unify its internal market and achieve price convergence among all European economies, integration of power markets is one of the European Union’s main priorities with regard to electricity policy. As mentioned previously, restructuring the electricity sector has led to the liberalization of electricity markets and the introduction of competition in this area. Higher economic efficiency and lower electricity prices are results of a deregulated electric industry, enabling a balance to supply demand from flexible coal generators and partially unpredictable renewable energy sources [10]. With the treatment of electricity as a commodity, markets and power exchanges have emerged, similar to trade in other commodities. In accordance, power exchanges provide a competitive environment for the benefit of the consumers and ensuring greater liquidity by shaping the price at the market under the law of supply and demand. Other benefits are trading based on standardized characteristics, forming neutrality, lower transaction costs, elimination of counterparty risk, price reference, providing clearing and settlement services.
Electricity traders are very important market players to strengthen market mergers and minimize the cost of the entire electricity system. Traders strive for economic benefits by identifying their strategy based on price signals from interconnected electricity markets [11]. Electricity prices are very volatile, they vary hourly, even minute by minute in some markets, due to constant changes in supply and demand, and they are affected by several parameters, e.g., weather, time of day, interruption of supply, maintenance, transmission system restrictions, etc. These characteristics suggest the necessity of having energy storage. However, Taljan et al., 2008 [12] proved the uneconomical use of storage for electricity with higher wholesale prices. Authors Nyamdash and Denny, 2013 [13] concluded the same, but they reviled that storage units stabilize the hourly electricity price. They analyzed reduction in the standard deviation of the electricity price from 10 euros to 6 euros during the night and from 11 euros to 10 euros in day. Day-ahead prices can also vary between different geographical locations. These price differences between countries are mostly related to production technologies, i.e., nuclear or hydro energy, coal, gas, wind, solar etc.
Over the past decades, the role and design of power exchanges received great attention since this is a marketplace where demand and supply offers meet. Power exchanges are usually designed as continuous trading or discrete auctions where market participants submit bids that are used to obtain supply and demand curves [14]. Power exchanges are important part of energy sector both in terms of physical and financial trading [15]. The oldest power exchanges in Europe are formed in Northern counties (Netherlands, United Kingdom, Scandinavian countries) while the youngest are in SEE (Croatia, Serbia, Bulgaria). Not all SEE markets are new, e.g., Greek and Romanian markets are rather mature. The main difference between these exchanges is a lower liquidity level on new markets. For that matter, a basic research question of this analysis is to examine whether lower liquidity is inherent only to new markets, or not. Are all SEE markets volatile, or only the new ones?
The rest of the present paper is organized as follows. Section 2 includes a literature review, offers a relevant scientific background. Section 3 presents the materials and methods. The data subsection refers to power prices that are collected from official websites of examined power exchanges and they represent market clearing prices on hourly basis. The methodology subsection describes a process of measuring price volatility on the basis of price velocity, with descriptive statistics. Section 4 focuses on results and the models that are applied in order to compare the least and the most volatile markets including correlation matrices. Section 5 refers to discussion, while Section 6 summarizes the main findings of this paper.

2. Literature Review

Electricity reform effects in EU [16,17], and SEE markets [18,19] have been analyzed in various studies. Deitz et al. described creation of a regional energy market between the EU and SEE partners in Ref. [20]. Developments towards a regional energy market in SEE are reviewed by Ref. [21]. Hooper and Medvedev [22] examined historic power supply mix of 10 countries in SEE during 1995–2004 was examined, with conclusion that an efficient regional energy market would help the stability of electricity supply across the region. Additionally, it was concluded that SEE region was dominated by fossil, nuclear and hydro power generation. Infrastructural transmission assets in the SEE region and the importance of establishing SEE regional electricity market in order to allow more cost-effective electricity production are described in Ref. [23]. Višković et al. [24] described liberalization and reforms of electricity sector in SEE countries for Croatia and Bosnia and Herzegovina, Slovenia [25], North Macedonia [26] and Romania [27]. It is possible to witness a significant integration among energy markets due to ongoing coupling of various regions in Europe. Authors in Ref. [28] explain the importance of a good market design and benefits of integrating the markets. Market coupling is the most efficient method of the integration of individual European markets enabling price convergence and energy transfer from a country with a surplus to the one with a deficit. In addition, key findings in Ref. [29] reveal that renewables generation in Italy, drives the spot prices in Greece via commercial schedules, while spot price fluctuations do not affect the commercial schedules of energy trading between Greece and Bulgaria. Focusing on SEE markets is important from several points of view. Firstly, most of Scandinavian countries have long history in power trading and growing their business implies expansion to new markets. Secondly, SEE region plays vital role due to geographical location when it comes to sourcing energy from (and to) Central Western Europe to (and from) Turkey and even including Georgia. Thirdly, emerging markets, like Croatia, Serbia, and Bulgaria, can enhance the competition and contribute to price convergence among European markets.
Due to the non-storable feature of electricity, power prices tend to be more volatile than prices of other commodity markets [30]. Prior to liberalization, price fluctuations were minimal and controlled. After the liberalization of energy sector, it became important to model and forecast price development [31]. Understanding the dynamics of prices is important because they are usually used as a reference price for financial contracts [32]. In the literature, price volatility has been measured quite often as the standard deviation of logarithmic [33], or arithmetic returns. However, one single extreme upward or downward spike could fully dominate the standard deviation. If only one day is eliminated, there can be a huge effect on the first six and last two hours [34].
Volatility is one of the price features that defines the behavior of the price process. “Volatility price problem” [35] was one of the problems most discussed in financial economy. In non- storage commodity markets, such as electricity, trading mechanisms must continually provide market clearing. Day-ahead prices are determined by using a single price auction so that all electricity is sold and bought at the market price [36]. Volatility processes are key elements in risk management, as they present price fluctuations over a period, and when evaluated properly they can be used in portfolio optimization and asset allocation [37]. Uncertainty measure of the future prices is determined by the spread of these fluctuations.
Existing literature is more focused on forecasting [38,39,40] and modeling [41,42,43] electricity spot prices, rather than evaluating their volatility. Relevant literature can be found for the USA [44,45,46,47], Canadian [48], Australian [49], British [31,50], Scandinavian [34,51,52], and European [53,54,55] markets, while for SEE markets, nothing has been done yet. To the best of the author’s knowledge, no previous studies have been reported in the literature that quantifies price volatility taking into consideration both CE and SEE power exchanges. This study is going to fulfill a gap of measuring volatility in SEE markets and comparing it to the rest of the European markets. The need for gaining insight into SEE market development provides the motivation for this research, thus contributing to the existing literature.
In this paper, the authors examine volatility of power prices, with a focus on the hourly rate of price change for 15 European power markets. By using a daily velocity index, price differences are divided by the daily average price, which reduces the impact of a single extremely low or high price level. Although this impact is softened, prices deviate from the average level, which must reflect a volatility index. The intention in this paper is to illustrate volatility in mature markets and markets that are still developing. In general, this study offers useful information and insight into both the EU and SEE power markets.

3. Materials and Methods

3.1. Power Prices

There are two ways in which electricity can be traded in wholesale markets: bilateral trading, in which seller and buyer directly negotiate and agree on the price of electricity; and trading at power exchanges or organized trading platforms. Electricity markets are generally divided into two groups: spot and power derivatives. The importance of spot markets arises from the day-ahead balance requirement of the entire bidding zone. They are used for matching electricity demands to supplies one day prior to delivery date [56]. Spot prices are more strongly affected by very short run demand and supply fluctuations [57,58]. By harmonizing day-ahead operations of different markets, decreases electricity price in the region and increases efficiency and liquidity which is the main idea of market coupling. On the other hand, power derivatives serve market participants as a tool for reducing their exposure to the price fluctuation on spot markets. Mastro [59] posited the underlying theory and various technical insights on how financial derivatives are initially structured and traded in power exchanges. Shore [60] examined the trading on spot and future markets. Also, Cavallo and Termini [61] explained the role of futures as an explanatory factor on the behavior of spot market prices.
Trading on a wholesale market refers to day-ahead transactions during each calendar day, where electricity supply contracts are auctioned for each time unit (1 h) of physical delivery on the next day. These trading products are hourly contracts with €/MWh value and size in MWh. Usually, bids in power exchanges are hourly bids and information required on each bid includes following characteristics: price in €/MWh, quantity in MWh, type of bid (sale or purchase), participant’s details and the hour of the day. The quantity and price that each seller is willing to gain is specified by each sale bid, on the other side, each purchase bid contains the desired quantity and the maximum price at which buyers are willing to pay [15]. Supply and demand bids form a curve intersection which is called the market clearing price. This price represents the data that have been examined from 15 power markets in Europe. It is worth mentioning that, due to transmission constraints, these markets represent local markets with individual features depending on generation mix and climate. Table 1 presents website references for each power market.
In order to achieve data equality and avoid possible differences in comparison, the data source starts from 18th of February 2016 as this is the first day of trading on the youngest power exchange, Southeast European Energy Exchange (SEEPEX). Additionally, hourly prices for 23 January 2017 have been excluded from this analysis for all power exchanges, since this date did not have trading prices published on Croatian Power Exchange (CROPEX). Accordingly, the sample period of this analysis ranges from 18 February 2016 until the end of 2019, which is until the 31 December 2019. This period is defined in a way that common trading days are valid for all power exchanges. The number of data points covers 1412 days, and 33,884 hourly day-ahead prices in €/MWh, per exchange.

3.2. Price Volatility Methodology

Li and Flynn [62] measured electricity price volatility by the price velocity, the daily average of the absolute value of price change per hour. Zareipour [48] used daily velocity based on the overall average price (DVOA) and daily velocity based on daily average power price (DVDA):
  DVOA i = 1 M { [ ( j = 1 M 1 | p i , j + 1 p i j | ) + | p i 1 , M p i , 1 | ] / p ¯ . , . } ,       i = 1 , 2 , ,   N .
  DVDA i = 1 M { [ ( j = 1 M 1 | p i , j + 1 p i j | ) + | p i 1 , M p i , 1 | ] / p ¯ i , . } ,       i = 1 , 2 , ,   N .
where p ¯ . , . is overall average price in the studied period and p ¯ i , . is the average daily price in the ith day, as follows [63]:
p ¯ . , . = 1 M × N i = 1 N j = 1 M p i , j   i = 1 , 2 , ,   N .
p ¯ i , . = 1 M j = 1 M p i , j   i = 1 , 2 , ,   N .
Mathematically, N is the number of days in the corresponding time period, i is the index of the day i = 1, 2…, N; j is the index of time period j = 1, 2,… M; M is the number of time periods during one day and for hourly prices M = 24; p i j is power price at the jth time period in the ith day and p 0 , M is the power price at the time spot proceeding the studied period.
As mentioned before, volatility is affected by the non-storability feature of electricity requiring a constant balance between production and consumption, the dependence of electricity demand on the weather and the intensity of business and everyday activities [64]. Accordingly, there are several parameters affecting volatility, and it should be pointed out that market size does not appear as volatility driver in this research. The authors in this paper introduced daily velocity based on monthly (DVMA), quarterly (DVQA), and yearly (DVYA) average price, in accordance with the model from Refs. [62,63]. Mathematical definition of DVMA is as follows:
  DVMA i = 1 M { [ ( j = 1 M 1 | p i , j + 1 p i , j | ) + | p i 1 , M p i , 1 | ] p ¯ } ,       i = 1 , 2 , ,   N .
where i is the index of the day and N is the number of days in the corresponding time period. In the case of DVMA, the number of days in the corresponding period is the number of days in the corresponding month. Respectively, for DVQA, N is the number of days for the corresponding quarter of the year and the number of days for the corresponding year in DVYA. Accordingly, j is the index of time period, and M the number of time periods for one day. In this paper, the authors considered hourly price change, so the number of time periods during one day M equals 24. The average price in the observed period is:
p ¯ = i = 1 N j M p i , j M × N
The authors extend this model [39,53] by using:
DVQA = Quarterly   average   of   δ t Quarterly   average   of   P t ,   δ t = | P t P t Δ t |
  DVYA = Yearly   average   of   δ t Yearly   average   of   P t ,   δ t = | P t P t Δ t |

4. Results

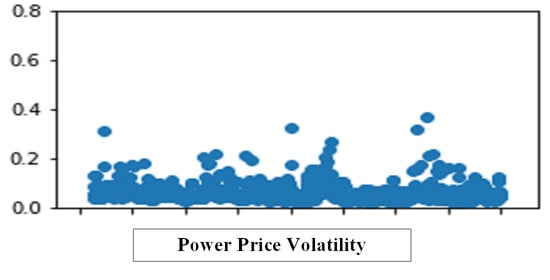
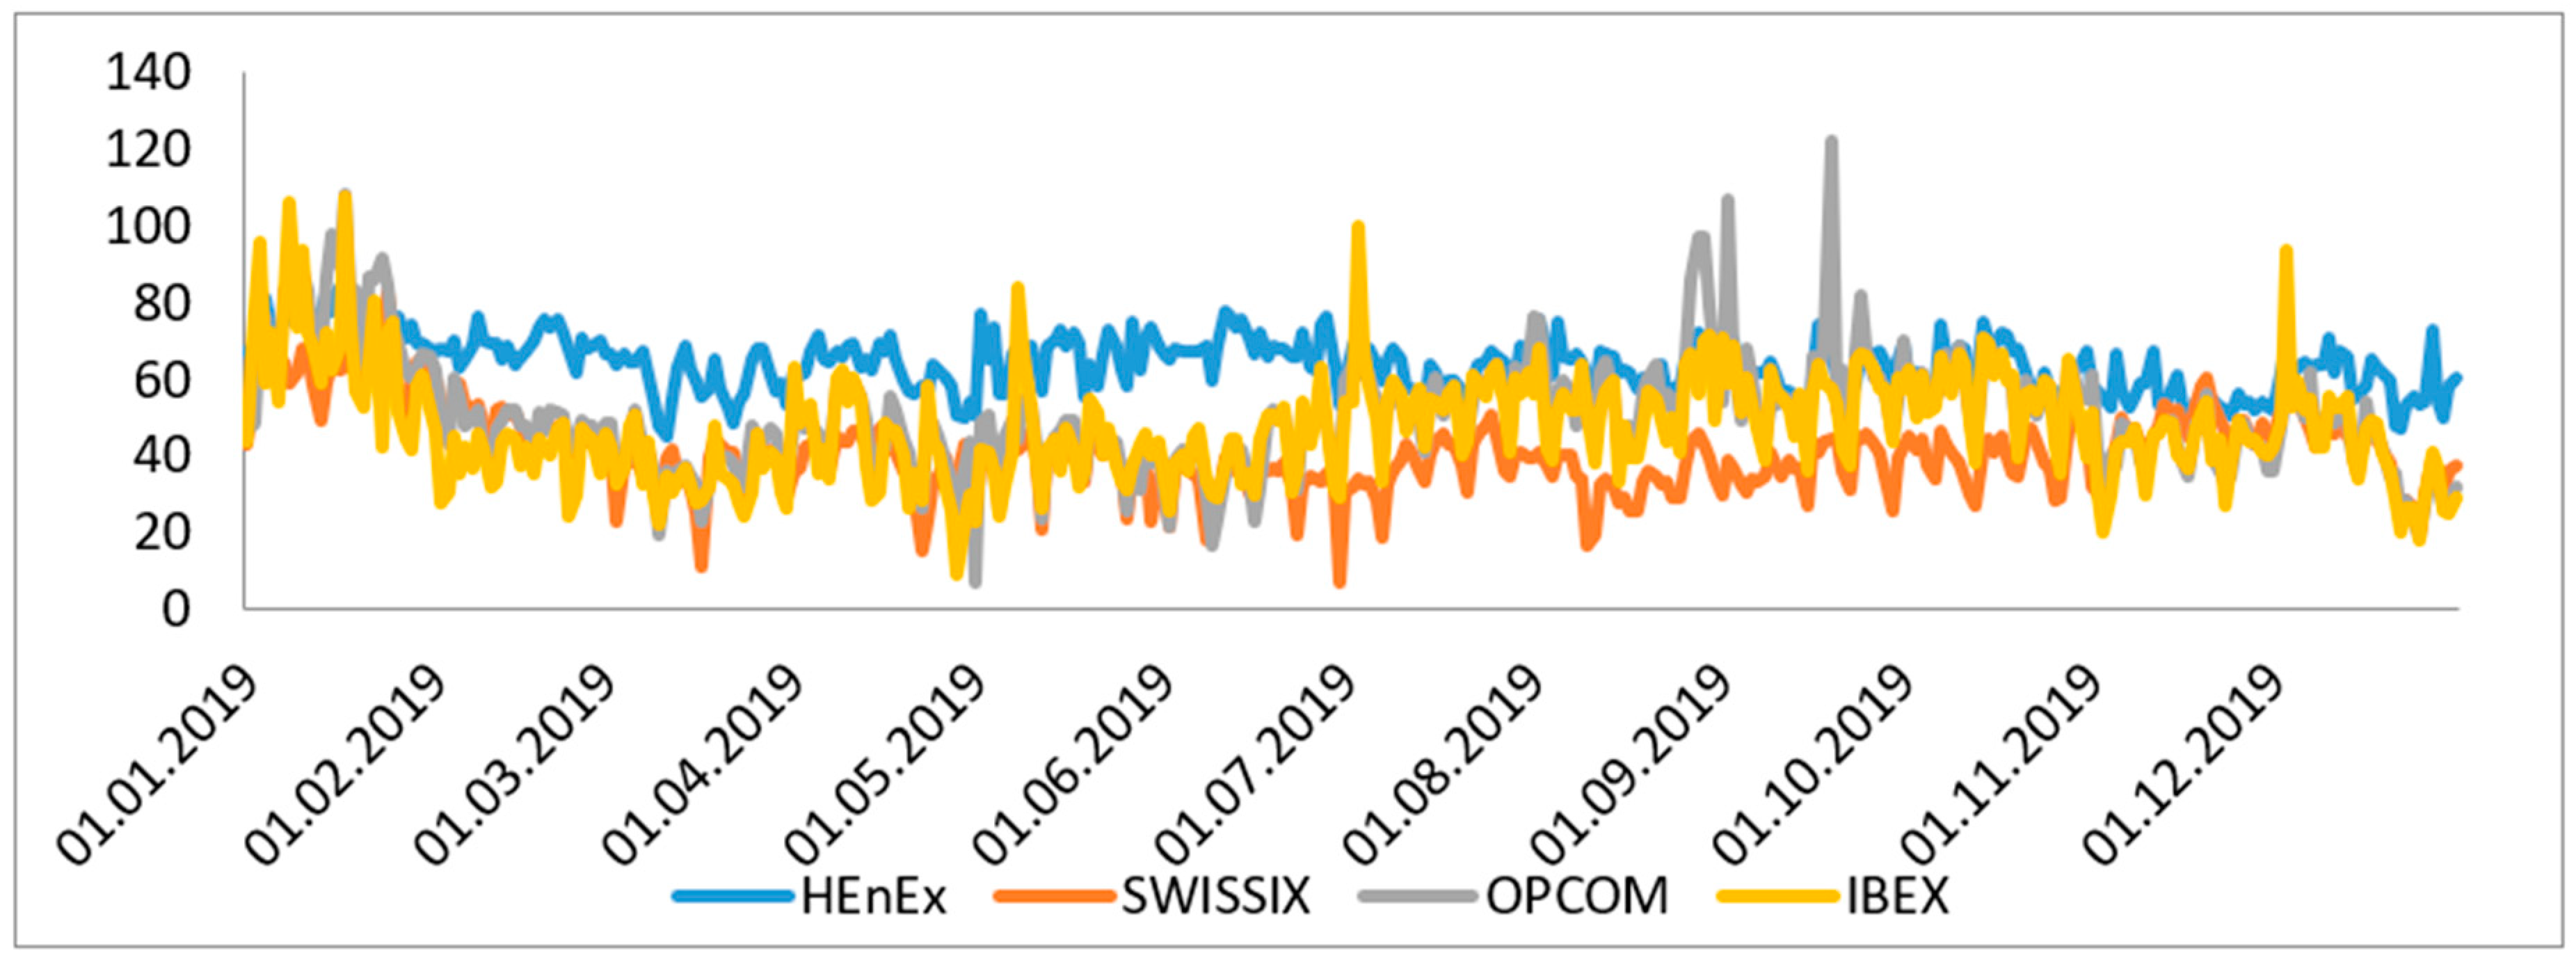
4.1. Volatility Results

According to the previous methodology, results are presented in Table 2. From Table 2, it is possible to conclude that DVDA has the highest minimum values on PHELIX, EXAA, and SWISSIX. As mentioned before, electricity prices are driven by supply and demand, which are affected by several factors. In some circumstances, negative wholesale power prices occur when a high inflexible power generation meets low demand. Power generation on these markets count in renewables that are dependent on external factors (wind, sun) and cannot be shut down and restarted in a quick and cost-efficient manner. These prices send signals to generators to reduce output and avoid overloading the grid and help maintain the required balance. The highest minimum values on the German, Austrian, and Swiss markets is the result of negative prices for several consecutive hours in one day, which occurred in the winter and spring for the aforementioned exchanges, respectively. However, more consecutive negative hours occurred on 17 March 2019, on PHELIX, but with less value, and with a sharp rise in prices on the same day, that results in the largest maximum for DVDA. Hence, a maximum of DVDA amounting to 13.67 means that approximately each hour, the power price changed by 13.670% of the daily average price on PHELIX, for that day. Consequently, the coefficient of variation (CV; quotient of the standard deviation divided by the mean) has the highest value for PHELIX and EXAA, followed by OTE and SWISSIX. Accordingly, the higher CV means a larger continuous volatility. If this indicator varies across pricing areas, this is due to their different production sources or limitations in transmission capacities. In that case, the generation mix of each pricing area becomes important.
As presented also in Table 2, previously mentioned models of large price fluctuations do not recur with seasonal patterns like DVQA, and accordingly with DVMA, DVYA and DVOA. For this reason, the authors dedicate further analysis to the evaluation of average volatility values shown in Table 3, with a particular focus on DVDA. Power exchanges in Table 3 are ordered in increasing number so that the least and the most volatile markets can be easily detected. It can be concluded that the markets of Greece and Switzerland have the lowest average values of DVOA, DVYA, DVQA, DVMY, and DVDA, and the Bulgarian and Romanian markets display the highest values.
Figure 1 depicts volatilities for Greek, Swiss, Romanian, and Bulgarian power markets. Volatility values for the observed period from 2016 until 2020, as presented in the graph, indicate trends in volatilities between power exchanges from the bottom and top of Table 3. For example, a large range of average DVDA values of 0.0574 for SWISSIX and 0.1153 for IBEX at the bottom of the scale proves that the Swiss market is approximately two times less volatile than the Bulgarian market.
As a simple illustration, if DVOA = 0.0496 for HEnEx, than changes in prices over subsequent days were 4.96% of the average in the observed period. Hence, if the average price for the same period was 55.70 €/MWh, then the average change in subsequent days could be up to 2.76 €/MWh. On the other hand, considering that DVOA for IBEX equals 0.1168, and the average price is 39.86 €/MWh, then the day-ahead price in subsequent days could change up to 4.65 €/MWh. This is almost double the value seen on HEnEx.

4.2. Correlation between Power Markets

In terms of average prices and volatility, all exchanges are compared by using the correlation matrix presented by Meloun and Militky, 2011 in Ref. [65]. Correlation measures the strength and direction of the linear relationship between two variables.
Table 4 shows that there is a positive correlation at all levels in terms of average prices for the observed period and power exchanges. Also, this could be confirmed by the graph presented in Figure 2, where average prices of the most and the least volatile markets in 2019 are depicted. Data in Table 4 show that the highest correlation of average prices has a geographical pattern and exists among neighboring countries. Thus, a high correlation is visible in the interconnected markets of Germany, Austria, the Czech Republic, and Slovakia. The southern region of Italy is mostly correlated with the northern region, and northern Italy with Switzerland and France. The same principle is present in exchanges in the SEE region. Namely, when looking at the SEE markets, primarily the newly formed IBEX, CROPEX and SEEPEX exchanges, they have the highest correlation with HUPX, BSP, and OPCOM, and the lowest with EXAA, SWISSIX, and FRANCE.

5. Discussion

In Greece, the marginal price setting plant for all hours of the day is usually gas or lignite. Over the past few years, the variable costs of those two types of generation have been quite similar, so traders bid into the pool on an hourly basis at quite similar levels all throughout the day. Naturally, one might get a more expensive bid setting the price in the early evening peak hours when demand is higher, or if the price is set by exports to Italy sometimes where they had high evening hourly price, but generally this keeps the hourly curves very flat on a daily basis.
When it comes to Bulgaria, electricity volumes are concentrated within a few power trading companies that gain access to long-term contracts with the Kozloduy nuclear power plant, so this leaves a less varied generation mix to be offered on IBEX on a day-ahead basis. Also, traditionally, the large generators would just sell onto IBEX around the same price each day without any consideration of renewable energy sources (RES). For example if on a certain day there was no wind and sun, traders would sell all of their volumes at quite a high price, higher than the regional prices, and the next day all the traders would import power to sell it at a very low price, and as a result the clearing price drops significantly hitting the first low-price steps set by the large generators, and the next day vice versa. The regulated market is also a factor. In cold winters in particular, the national electricity company EAD (NEK), as part of state-owned Bulgarian Energy Holding (BEH), sometimes has to use its output to supply the regulated market.
When looking at the DVDA volatility correlation matrix, negative values emerge between SEE and the CE markets. Table 5 shows the negative correlation between SEEPEX, IBEX and OPCOM on one hand, and EXAA and SWISSIX on the other. CROPEX and IBEX have a negative correlation, which means that the increase in volatility on CROPEX is accompanied by a decrease in volatility on IBEX and vice versa. However, there is no physical interconnection between these two markets. Additionally, it should be emphasized that, although the Bulgarian market is approximately twice as volatile as the Greek market, this difference in numbers equals 6.44%, when looking at the DVDA.

6. Conclusions

In this paper, the most commonly used volatility index is extended in order to quantify the volatility of European power markets, with special attention to SEE markets. Obtained results showed that some SEE markets are on average twice as volatile in comparison with more mature European markets. The Greek mandatory pool has the lowest volatility, followed by Switzerland. Conversely, the Bulgarian and Romanian markets are the most volatile in comparison to the examined group. The employed volatility indices were than applied to the correlation matrix. Studied markets were compared in terms of average prices, which showed high correlation between neighboring countries. This geographical pattern in some cases could be explained with market coupling. Coupled markets can potentially enhance liquidity by bringing new market participants, expanding the geographic scope of the market, and therefore help to reduce price volatility. A correlation matrix of conducted volatility index DVDA demonstrated several cases of negative correlation. This occurred between the Serbian, Romanian and Bulgarian markets on one side, and the Austrian and Swiss markets on the other. It should be highlighted that Serbian SEEPEX is the youngest power exchange in the examined group, and the results depicted lower volatility than the German and French markets. This could be explained by the fact that German electricity market is characterized by a series of large price jumps due to instabilities in wind power production, and French power market is still highly concentrated.
Estimating volatility is very important when evaluating the liberalization process. Volatility is the key element for the participants of markets involving uncertainty, when making decisions in risk management. In order to decrease price volatility and enchase price convergence, it is necessary to enchase market coupling through extended transmission capacities and increased cross-border flows. Changes in volatility and correlation are likely caused by various factors affecting the market environment and structure, such as changes in oil and gas prices, increasing market size, introducing new technologies, entrance of new participants and introduction of new products. When knowing the process of volatility, measuring it helps in forecasting future spot prices, modeling prices of energy futures and derivatives necessary for risk transfer and valuing energy assets. This means that further research must incorporate parameters which consider the SEE markets and find a way to bridge this lag with respect to other markets. This could include questioning implemented trading platforms, measuring the potential of expanding the market coupling and transmission capacities, or conducting correlation between price and load.

Author Contributions

Conceptualization, Z.B. and D.D.; methodology, Z.B. and D.D.; software, Z.B. and J.A.; validation, Z.B., D.D., and M.R.; formal analysis, Z.B. and D.D.; investigation, Z.B.; resources, Z.B. and D.D.; data curation, Z.B., D.D., and J.A.; writing—original draft preparation, Z.B.; writing—review and editing, Z.B., D.D., M.R., and B.Ś.; visualization, J.A.; project administration, D.D., M.R., and B.Ś. All authors have read and agreed to the published version of the manuscript.

Funding

This research received no external funding.

Conflicts of Interest

The authors declare no conflict of interest.

References

  1. Monteiro, C.; Fernandez-Jimenez, L.A.; Ramirez-Rosado, I.J. Predictive Trading Strategy for Physical Electricity Futures. Energies 2020, 13, 3555. [Google Scholar] [CrossRef]
  2. Haar, L.N.; Marinescu, N. Energy policy and European utilities’ strategy: Lessons from the liberalisation and privatisation of the energy sector in Romania. Energy Policy 2011, 39, 2245–2255. [Google Scholar] [CrossRef]
  3. Dertinger, A.; Hirth, L. Reforming the electric power industry in developing economies evidence on efficiency and electricity access outcomes. Energy Policy 2020, 139, 111348. [Google Scholar] [CrossRef]
  4. Cerjan, M.; Petričić, A.; Delimar, M. HIRA Model for Short-Term Electricity Price Forecasting. Energies 2019, 12, 568. [Google Scholar] [CrossRef] [Green Version]
  5. Borenstein, S.; Bushnell, J. The U.S. Electricity Industry after 20 Years of Restructuring. Annu. Rev. Econ. 2015, 7, 437–463. [Google Scholar] [CrossRef] [Green Version]
  6. Newbery, D. Issues and Options for Restructuring Electricity Supply Industries. CMI Working Paper. 2004. Available online: https://www.repository.cam.ac.uk/handle/1810/308 (accessed on 20 August 2020).
  7. Bacon, R. Taking Stock of the Impact of Power Utility Reform in Developing Countries: A Literature Review; The World Bank: Washington, DC, USA, 2018; p. 8460. [Google Scholar]
  8. Joskow, P.L. Lessons Learned from Electricity Market Liberalization. Energy J. 2008, 29, 9–43. [Google Scholar] [CrossRef]
  9. Pollitt, M.G. Electricity Liberalisation in the European Union: A Progress Report; University of Cambridge: Cambridge, UK, 2009. [Google Scholar]
  10. Kanagaraj, A.; Pandu, K.D.R. Investigations of Various Market Models in a Deregulated Power Environment Using ACOPF. Energies 2020, 13, 2354. [Google Scholar] [CrossRef]
  11. Dagoumas, A.S.; Koltsaklis, N.E.; Panapakidis, I.P. An integrated model for risk management in electricity trade. Energy 2017, 124, 350–363. [Google Scholar] [CrossRef]
  12. Taljan, G.; Fowler, M.; Canizares, C.; Verbič, G. Hydrogen storage for mixed wind–nuclear power plants in the context of a Hydrogen Economy. Int. J. Hydrogen Energy 2008, 33, 4463–4475. [Google Scholar] [CrossRef]
  13. Nyamdash, B.; Denny, E. The impact of electricity storage on wholesale electricity prices. Energy Policy 2013, 58, 6–16. [Google Scholar] [CrossRef] [Green Version]
  14. Beus, M.; Pavić, I.; Stritof, I.; Capuder, T.; Pandzic, H. Electricity Market Design in Croatia within the European Electricity Market—Recommendations for Further Development. Energies 2018, 11, 346. [Google Scholar] [CrossRef] [Green Version]
  15. Ioannidis, F.; Makridou, G.; Kosmidou, K.; Andriosopoulos, K. Market design of an energy exchange: The case of Greece. Energy Policy 2019, 133, 110887. [Google Scholar] [CrossRef]
  16. Ringler, P.; Keles, D.; Fichtner, W. How to benefit from a common European electricity market design. Energy Policy 2017, 101, 629–643. [Google Scholar] [CrossRef]
  17. Karova, R. Regional electricity markets in Europe: Focus on the Energy Community. Util. Policy 2011, 19, 80–86. [Google Scholar] [CrossRef]
  18. Pollitt, M. Evaluating the evidence on electricity reform: Lessons for the South East Europe (SEE) market. Util. Policy 2009, 17, 13–23. [Google Scholar] [CrossRef] [Green Version]
  19. Vailati, R. Electricity transmission in the energy community of South East Europe. Util. Policy 2009, 17, 34–42. [Google Scholar] [CrossRef]
  20. Deitz, L.; Stirton, L.; Wright, K. South East Europe’s electricity sector: Attractions, obstacles and challenges of Europeanisation. Util. Policy 2019, 17, 4–12. [Google Scholar] [CrossRef]
  21. Sakellaris, K. SEE regional wholesale market design: Recommendations, available options and implementation. In Proceedings of the 8th International Conference on the European Energy Market (EEM), Zagreb, Croatia, 25–27 May 2011. [Google Scholar]
  22. Hooper, E.; Medvedev, A. Electrifying integration: Electricity production and the South East Europe regional energy market. Util. Policy 2009, 17, 24–33. [Google Scholar] [CrossRef] [Green Version]
  23. Kristiansen, T. Cross-border transmission capacity allocation mechanisms in South East Europe. Energy Policy 2007, 35, 4611–4622. [Google Scholar] [CrossRef]
  24. Višković, A.; Franki, V.; Valentić, V. Effect of regulation on power-plant operation and investment in the South East Europe Market: An analysis of two cases. Util. Policy 2014, 30, 8–17. [Google Scholar] [CrossRef]
  25. Hrovatin, N.; Pittman, R.; Zorič, J. Organisation and reforms of the electricity sector in Slovenia. Util. Policy 2009, 17, 134–143. [Google Scholar] [CrossRef]
  26. Taleski, R. Electricity reform in the Republic of Macedonia. Util. Policy 2009, 17, 88–101. [Google Scholar] [CrossRef]
  27. Kennedy, D. South-East Europe regional energy market: Challenges and opportunities for Romania. Energy Policy 2005, 33, 2202–2215. [Google Scholar] [CrossRef]
  28. Newbery, D.; Strbac, G.; Viehoff, I. The benefits of integrating European electricity markets. Energy Policy 2016, 94, 253–263. [Google Scholar] [CrossRef] [Green Version]
  29. Papaioannou, G.; Dikaiakos, C.; Kaskouras, C.; Evangelidis, G.; Georgakis, F. Granger Causality Network Methods for Analyzing Cross-Border Electricity Trading between Greece, Italy, and Bulgaria. Energies 2020, 13, 900. [Google Scholar] [CrossRef] [Green Version]
  30. Weron, R. Energy price risk management. Phys. A Stat. Mech. Its Appl. 2000, 285, 127–134. [Google Scholar] [CrossRef] [Green Version]
  31. Tashpulatov, S.N. Estimating the volatility of electricity prices: The case of the England and Wales wholesale electricity market. Energy Policy 2013, 60, 81–90. [Google Scholar] [CrossRef] [Green Version]
  32. Huisman, R.; Huurman, C.; Mahieu, R. Hourly electricity prices in day-ahead markets. Energy Econ. 2007, 29, 240–248. [Google Scholar] [CrossRef] [Green Version]
  33. Simonsen, I. Volatility of power markets. Phys. A Stat. Mech. Its Appl. 2005, 355, 10–20. [Google Scholar] [CrossRef]
  34. De Jonghe, C.; Meeus, L.; Belmans, R. Power exchange price volatility analysis after one year of trilateral market coupling. In Proceedings of the 5th international conference on the european electricity market, Lisbon, Portugal, 28–30 May 2008. [Google Scholar]
  35. Mandelbrot, B. The Variation of Some Other Speculative Prices. J. Bus. 1967, 40, 393–413. [Google Scholar] [CrossRef]
  36. Sapio, A. Modeling the distribution of day-ahead electricity returns: A comparison. Quant. Financ. 2012, 12, 1935–1949. [Google Scholar] [CrossRef]
  37. Ignatieva, K. A nonparametric model for spot price dynamics and pricing of futures contracts in electricity markets. Stud. Nonlinear Dyn. Econ. 2014, 18, 483–505. [Google Scholar] [CrossRef]
  38. Lago, J.; De Ridder, F.; Vrancx, P.; De Schutter, B. Forecasting day-ahead electricity prices in Europe: The importance of considering market integration. Appl. Energy 2018, 211, 890–903. [Google Scholar] [CrossRef]
  39. Ziel, F.; Steinert, R.; Husmann, S. Forecasting day ahead electricity spot prices: The impact of the EXAA to other European electricity markets. Energy Econ. 2015, 51, 430–444. [Google Scholar] [CrossRef] [Green Version]
  40. Raviv, E.; Bouwman, K.E.; Van Dijk, D. Forecasting day-ahead electricity prices: Utilizing hourly prices. Energy Econ. 2015, 50, 227–239. [Google Scholar] [CrossRef] [Green Version]
  41. Malo, P. Modeling electricity spot and futures price dependence: A multifrequency approach. Phys. A Stat. Mech. Its Appl. 2009, 388, 4763–4779. [Google Scholar] [CrossRef]
  42. Weron, R. Electricity price forecasting: A review of the state-of-the-art with a look into the future. Int. J. Forecast. 2014, 30, 1030–1081. [Google Scholar] [CrossRef] [Green Version]
  43. Voronin, S.; Partanen, J. Price Forecasting in the Day-Ahead Energy Market by an Iterative Method with Separate Normal Price and Price Spike Frameworks. Energies 2013, 6, 5897–5920. [Google Scholar] [CrossRef]
  44. Bailey, E.M. Electricity Markets in the Western United States. Electr. J. 1998, 11, 51–60. [Google Scholar] [CrossRef]
  45. Joskow, P.L.; Kohn, E. A quantitative analysis of pricing behavior in California’s wholesale electricity market during summer 2000. Energy J. 2000, 23, 1–36. [Google Scholar]
  46. Borenstein, S. The Trouble with Electricity Markets: Understanding California’s Restructuring Disaster. J. Econ. Perspect. 2002, 16, 191–211. [Google Scholar] [CrossRef] [Green Version]
  47. Garcia, R.C.; Contreras, J.; Van Akkeren, M.; Garcia, J. A GARCH forecasting model to predict day-ahead electricity prices. IEEE Trans. Power Syst. 2005, 20, 867–874. [Google Scholar] [CrossRef]
  48. Zareipour, H.; Bhattacharya, K.; Canizares, C.A. Electricity market price volatility: The case of Ontario. Energy Policy 2007, 35, 4739–4748. [Google Scholar] [CrossRef]
  49. Higgs, H.; Worthington, A. Systematic features of high-frequency volatility in Australian electricity markets: Intraday patterns, information arrival and calendar effects. Energy J. 2005, 26, 23–42. [Google Scholar] [CrossRef] [Green Version]
  50. Green, R.J.; Newbery, D.M. Competition in the British Electricity Spot Market. J. Political Econ. 1992, 100, 929–953. [Google Scholar] [CrossRef]
  51. Dong, S.; Hailong, L.; Wallin, F.; Avelin, A.; Zhang, Q.; Yu, Z. Volatility of electricity price in Denmark and Sweden. Energy Procedia 2019, 158, 4331–4337. [Google Scholar] [CrossRef]
  52. Nomikos, N.K.; Soldatos, O.A. Modelling short and long-term risks in power markets: Empirical evidence from Nord Pool. Energy Policy 2010, 38, 5671–5683. [Google Scholar] [CrossRef]
  53. Erdogdu, E. Asymmetric volatility in European day-ahead power markets: A comparative microeconomic analysis. Energy Econ. 2016, 56, 398–409. [Google Scholar] [CrossRef] [Green Version]
  54. Bosco, B.; Parisio, L.P.; Pelagatti, M.M. Deregulated Wholesale Electricity Prices in Italy: An Empirical Analysis. Int. Adv. Econ. Res. 2007, 13, 415–432. [Google Scholar] [CrossRef]
  55. Cuaresma, J.C.; Hlouskova, J.; Kossmeier, S.; Obersteiner, M. Forecasting electricity spot-prices using linear univariate time-series models. Appl. Energy 2004, 77, 87–106. [Google Scholar] [CrossRef]
  56. Nakamura, M.; Nakashima, T.; Niimura, T. Electricity markets volatility: Estimates, regularities and risk management applications. Energy Policy 2006, 34, 1736–1749. [Google Scholar] [CrossRef]
  57. Sadorsky, P. Risk factors in stock returns of Canadian oil and gas companies. Energy Econ. 2001, 23, 17–28. [Google Scholar] [CrossRef]
  58. Boyer, M.M.; Filion, D. Common and fundamental factors in stock returns of Canadian oil and gas companies. Energy Econ. 2007, 29, 428–453. [Google Scholar] [CrossRef] [Green Version]
  59. Mastro, M. Financial Derivative and Energy Market Valuation: Theory and Implementation in Matlab; John Wiley & Sons: Hoboken, NJ, USA, 2013. [Google Scholar]
  60. Shore, S.; Muermann, A. Spot Market Power and Future Market Trading. Financ. Mark. Group 2005, 531. [Google Scholar] [CrossRef]
  61. Cavallo, L.; Termini, V. Electricity Derivatives and the Spot Market in Italy. Mitigating Market Power in the Electricity Market. SSRN Electron. J. 2005. [Google Scholar] [CrossRef] [Green Version]
  62. Li, Y.; Flynn, P.C. Deregulated power prices: Comparison of volatility. Energy Policy 2004, 31, 1591–1601. [Google Scholar] [CrossRef]
  63. Li, Y.; Flynn, P.C. Deregulated power prices: Comparison of diurnal patterns. Energy Policy 2004, 32, 657–672. [Google Scholar] [CrossRef]
  64. Auer, B.R. How does Germany’s green energy policy affect electricity market volatility? An application of conditional autoregressive range models. Energy Policy 2016, 98, 621–628. [Google Scholar] [CrossRef]
  65. Meloun, M.; Militky, J. Statistical Data Analysis: A Practical Guide; Woodhead Publishing: Cambridge, UK, 2011. [Google Scholar]
Figure 1. Price volatility DVOA, DVYA, DVQA, DVMA and DVDA for four selected markets.
Energies 13 05620 g001
Figure 2. Average hourly prices in 2019.
Energies 13 05620 g002
Table 1. Websites for power pools/markets.
MarketNameShort NameWebsite
HungaryHungarian power exchangeHUPXhttps://hupx.hu/en/
SloveniaBSP SouthPool Energy ExchangeBSPhttps://www.bsp-southpool.com/home.html
CroatiaCroatian power exchangeCROPEXhttps://www.cropex.hr/en/
AustriaEnergy exchange AustriaEXAAhttps://www.exaa.at/de
GermanyEPEX SPOTPHELIXhttps://www.epexspot.com/en
SwitzerlandEPEX SPOTSWISSIXhttps://www.epexspot.com/en
FranceEPEX SPOTFRANCEhttps://www.epexspot.com/en
Italy: NorthGestoreMercatiEnergeticiGME Northhttps://www.mercatoelettrico.org/En
Italy: SouthGestoreMercatiEnergeticiGME Southhttps://www.mercatoelettrico.org/En
GreeceHellenic Energy ExchangeHEnExhttp://www.enexgroup.gr/en
SerbiaSEE Power ExchangeSEEPEXhttp://seepex-spot.rs/sr/
Czech RepublicCzech electricity and gas OTEhttps://www.ote-cr.cz/en/
BulgariaIndependent Bulgarian Energy ExchangeIBEXhttp://www.ibex.bg/en/
RomaniaRomanian electricity and gasOPCOMhttps://www.opcom.ro/pp/home.php
SlovakiaSlovak short-term marketOKTEhttps://www.okte.sk/en
Table 2. Descriptive statistics of power exchanges for DVOA, DVYA, DVQA, DVMA and DVDA.
Power MarketDVOADVYADVQADVMADVDA
Std. Dev.CVMinMaxStd. Dev.CVMinMaxStd. Dev.CVMinMaxStd. Dev.CVMinMaxStd. Dev.CVMinMax
HUPX0.040.460.030.660.040.420.030.620.040.390.030.530.030.350.030.380.050.470.030.68
BSP0.050.550.020.510.050.520.030.480.050.50.020.480.050.480.020.420.080.8−1.341.27
CROPEX0.050.520.030.580.050.480.030.530.050.460.030.460.040.440.030.370.111.1−3.41.22
PHELIX0.040.460.030.350.040.460.030.430.040.450.020.510.040.470.020.560.768.51−23.5913.67
EXAA0.030.410.030.420.030.440.030.380.030.410.030.290.030.410.030.320.57.54−17.682.68
GME North0.030.480.020.310.030.480.020.30.030.440.010.280.030.420.020.260.020.350.020.21
GME South0.030.430.010.280.030.440.010.310.030.450.020.350.030.450.020.340.040.490.010.39
HEnEx0.040.8300.380.040.8400.50.040.8200.460.040.7900.410.040.8300.34
SEEPEX0.030.420.030.430.030.370.030.40.030.360.030.350.030.350.030.240.040.50.030.91
OTE0.040.420.030.350.040.420.030.30.030.40.030.260.030.390.030.270.363.48−3.6510.04
IBEX0.070.5700.480.070.5700.480.060.5400.480.060.5200.40.050.4400.71
OPCOM0.040.410.030.420.040.360.030.370.040.350.040.320.040.340.040.310.060.510.040.78
OKTE0.050.490.030.320.040.480.030.320.040.450.030.310.040.440.030.290.363.22−3.6510.04
SWISSIX0.030.460.010.280.030.460.010.270.020.40.010.240.020.390.010.260.23.47−6.772.1
FRANCE0.090.990.031.630.091.090.031.870.060.720.031.170.060.660.031.080.090.940.032.28
Table 3. Average price volatility for DVDA.
PXDVOAPXDVYAPXDVQAPXDVMAPXDVDA
HEnEx0.0496HEnEx0.0497HEnEx0.0498HEnEx0.0499HEnEx0.0509
SWISSIX0.0567SWISSIX0.0572SWISSIX0.0585SWISSIX0.0586SWISSIX0.0574
GME North0.0675GME North0.0678GME North0.0684GME North0.0682EXAA0.0657
GME South0.0725GME South0.0733GME South0.0738GME South0.0743GME North0.0676
EXAA0.0746SEEPEX0.077EXAA0.0782EXAA0.0785GME South0.0756
SEEPEX0.0775EXAA0.0773SEEPEX0.0784SEEPEX0.0792SEEPEX0.0816
OTE0.0845OTE0.0851OTE0.0861OTE0.0864PHELIX0.0896
FRANCE0.0865FRANCE0.0873FRANCE0.0867FRANCE0.0867FRANCE0.0926
PHELIX0.0906PHELIX0.0913PHELIX0.0921HUPX0.0929HUPX0.0963
HUPX0.0919HUPX0.0918HUPX0.0927PHELIX0.0931CROPEX0.101
OKTE0.0923OKTE0.0927OKTE0.0937OKTE0.0938BSP0.1031
BSP0.0981BSP0.0983BSP0.0992BSP0.0995OTE0.1034
CROPEX0.0988CROPEX0.0987CROPEX0.0996CROPEX0.1001OKTE0.1113
OPCOM0.1053OPCOM0.1047OPCOM0.106OPCOM0.1068OPCOM0.114
IBEX0.1168IBEX0.1175IBEX0.1168IBEX0.1168IBEX0.1153
Table 4. Correlation matrix of average power prices between markets.
MarketsHUPXBSPCROPEXPHELIXEXAAGME NorthGME SouthHEnExSEEPEXOTEIBEXOPCOMOKTESWISSIXERANCE
HUPX1
BSP0.931
CROPEX0.960.931
PHELIX0.660.660.631
EXAA0.570.560.520.71
GME North0.740.80.740.620.491
GME South0.680.70.670.570.490.831
HEnEx0.720.690.670.540.660.630.661
SEEPEX0.960.90.920.630.560.740.680.731
OTE0.770.760.730.920.720.710.640.60.741
IBEX0.710.680.660.470.510.530.510.580.710.561
OPCOM0.930.860.880.580.540.640.60.70.90.670.731
OKTE0.840.830.810.850.650.750.670.630.810.930.610.761
SWISSIX0.660.70.650.680.490.850.680.530.660.730.450.560.731
FRANCE0.650.70.650.710.480.840.660.490.650.740.450.550.720.951
Table 5. Correlation matrix of DVDA between markets.
MarketsHUPXBSPCROPEXPHELIXEXAAGME NorthGME SouthHEnExSEEPEXOTEIBEXOPCOMOKTESWISSIXERANCE
HUPX1
BSP0.441
CROPEX0.190.211
PHELIX0.030.120.171
EXAA−0.070.020.05−0.051
GME North0.310.270.130.040.051
GME South0.250.180.110.030.030.571
HEnEx0.280.190.140.080.020.360.371
SEEPEX0.620.40.140.04−0.030.30.250.31
OTE0.160.230.20.1200.040.020.060.081
IBEX0.310.24−0.160.04−0.070.150.130.140.230.091
OPCOM0.670.340.120.02−0.040.270.260.340.520.10.211
OKTE0.170.240.20.1100.050.030.060.090.990.090.11
SWISSIX−0.19−0.030.1600.150.050.060.06−0.09−0.22−0.18−0.09−0.221
FRANCE0.52−0.060.10.07−0.040.240.160.090.25−0.050.070.330.030.081
Publisher’s Note: MDPI stays neutral with regard to jurisdictional claims in published maps and institutional affiliations.

