Article

Event-Driven Coulomb Counting for Effective Online Approximation of Li-Ion Battery State of Charge †

by
Saeed Mian Qaisar
Communications & Signal Processing Research Lab, Energy & Technology Research Center, College of Engineering, Effat University, Jeddah 21478, Saudi Arabia
This paper is an extension of the conference paper presented at IEEE EEEIC 2020, Madrid, Spain, 9–12 June 2020.
Energies 2020, 13(21), 5600; https://doi.org/10.3390/en13215600
Submission received: 6 October 2020 / Revised: 20 October 2020 / Accepted: 22 October 2020 / Published: 26 October 2020

Abstract

:
Lithium-ion batteries are deployed in a range of modern applications. Their utilization is evolving with the aim of achieving a greener environment. Batteries are costly, and battery management systems (BMSs) ensure long life and proper battery utilization. Modern BMSs are complex and cause a notable overhead consumption on batteries. In this paper, the time-varying aspect of battery parameters is used to reduce the power consumption overhead of BMSs. The aim is to use event-driven processing to realize effective BMSs. Unlike the conventional approach, parameters of battery cells, such as voltages and currents, are no longer regularly measured at a predefined time step and are instead recorded on the basis of events. This renders a considerable real-time compression. An inventive event-driven coulomb counting method is then presented, which employs the irregularly sampled data information for an effective online state of charge (SOC) determination. A high energy battery model for electric vehicle (EV) applications is studied in this work. It is implemented by using the equivalent circuit modeling (ECM) approach. A comparison of the developed framework is made with conventional fixed-rate counterparts. The results show that, in terms of compression and computational complexities, the devised solution surpasses the second order of magnitude gain. The SOC estimation error is also quantified, and the system attains a ≤4% SOC estimation error bound.

Graphical Abstract

1. Introduction

Effective and green power sources are strongly needed in the context of ongoing global warming and environmental pollution. In this sense, the development of environmentallyfriendly power sources and systems is growing. A prominent group of researchers are working on the enhancement of electrochemical solutions to successfully replace existing power sources, with the aim of reducing greenhouse gas emissions. Governmental agencies and industries are also playing their part within this framework.
The level of pollution in the urban environment can be reduced by evading the use of voluminous batteries and the oil-powered vehicles. This can be achieved by realizing and deploying long life and economical renewable energy sources and rechargeable and compact high power batteries, which can be effectively used in the industrial and transportation sectors [1]. An improvement is also possible by using such batteries for off-peak energy storage in conventional grids. Going forward, these charged batteries can power electric hybrid vehicles (EHVs) to reduce the amount of greenhouse emissions [2].
The use of electric vehicle (EVs) and EHVs is growing, with the aim of creating a greener environment. EVs have been a catalyst for reducing greenhouse emissions [3]. According to [3], one of the key determinants of climate change is the transportation industry, which produces around 23% of greenhouse gases in the atmosphere and is the second-highest greenhouse gas emitter after the industrial sector. In order to maximize the use of EVs, it is necessary to reduce their purchase price to an amount similar to that of existing combustion engine vehicles. Currently, the most costly component of an electric car is the battery. Depending on the equipment used, it accounts for 25% to 50% of the price of an electric vehicle [1]. As reported in [1], a decline in battery prices is projected to reach a price of approximately 225 euros/kWh by 2025. This will result in a dramatic drop in the selling price of EVs, allowing them to achieve a value similar to the price of conventional combustion engine vehicles. Another important issue to tackle is the enhancement of existing EV charging protocols. Innovative solutions have been reported in this framework by using machine learning techniques [4].
The lithium-ion (Li-ion) battery is the most used among the available variety of rechargeable batteries [5,6,7]. It is favored because of its appealing benefits compared to other counterparts, which mainly include a deeper discharge depth, higher count of charge–discharge cycles, higher energy density, more compact and lower weight, lower self-discharge and lower maintenance requirements. However, the complexity of effectively integrating a Li-ion battery pack in an intended system is relevant as hundreds of cells are used to construct a single battery pack, and the state of each cell needs to be monitored. As a result, high-complexity battery management systems (BMSs) must be deployed with Li-ion batteries. One reason for using BMSs in contemporary power systems is to effectively monitor and control the system [8]. It allows a timely recognition of power outages by observing the status of every cell in the battery [9]. Therefore, BMSs are commonly used in modern devices, such as EHVs, EVs and drones [10,11].
The principal battery cell parameters are estimated and monitored by BMSs, which includes the state of health (SOH) and remaining useful life (RUL) of each cell in the battery pack. By calculating these parameters, the BMS can perform cell balancing and fault detection. It also ensures the battery stability and allows correct counting of the charge–discharge cycles at cell level [10,11].
A battery state of charge (SOC) is similar to a traditional vehicle’s fuel gauge and shows the available power of a functional battery that can be drained out of it. Various researchers have suggested several methods for estimating the SOC of batteries [12,13]. These SOC estimation approaches can be categorized as direct measurements, model-based techniques and data-driven machine learning techniques [14,15]. Direct measurement techniques include open-circuit voltage, electromotive force, coulomb counting, internal resistance and impedance spectroscopy. The major model-based approaches are Kalman filter, extended Kalman filter, unscented Kalman filter, sigma-point Kalman filter, particle filter, nonlinear observer, sliding mode observer, proportional integral observer and Luenberger-based observer [5,9]. Frequently used data-driven techniques are multivariate adaptive regression splines, support vector machine, neural network, fuzzy logic, particle swarm optimization, bacterial foraging algorithm and genetic algorithm [5,9]. The selection of each of these approaches is made as a function of the BMS specifications and the targeted application [16,17,18,19,20].
Superior accuracy of SOC estimation can be attained by model-based and data-driven methods. However, they are costly in terms of storage requirements for training datasets and computational and realization complexities. Consequently, they render higher latencies and power consumption overheads [20,21]. On the other hand, direct evaluation methods are effective in terms of the complexities of computation and execution. Therefore, they can contribute to efficient real-time implementations while maintaining sufficient accuracies.
Hundreds of cells are used to form a single battery pack, and the state of each cell needs to be monitored [20,22,23], propelling the development of high-complexity BMSs with notable overhead battery power usage. This study contributes to enhancing the data processing chain of contemporary BMSs to effectively diminish the overhead consumption. This paper devises an efficient and moderate precision online SOC approximation method. It enhances the conventional coulomb counting based direct assessment method, applicable for online realizations required for electric vehicles and drones [24]. Additionally, it allows for simple and power-efficient realization, which is carried out by using the linear operations and functions [25]. The contribution of this work is to improve the computational effectiveness of the traditional coulomb counting approach, which is realized by intelligently incorporating the methodology of event-driven processing in the proposed solution. Event-driven analog to digital converters (EDADCs) effectively record the intended battery cell parameters, such as current and voltage. This significantly decreases the computational cost of the post SOC estimation process. This is realized through varying the sampling and processing rates by observing the incoming time-varying signal [12,16,17,22].

2. Materials and Methods

The system modules are shown in Figure 1. In the following subsections, these modules are described.

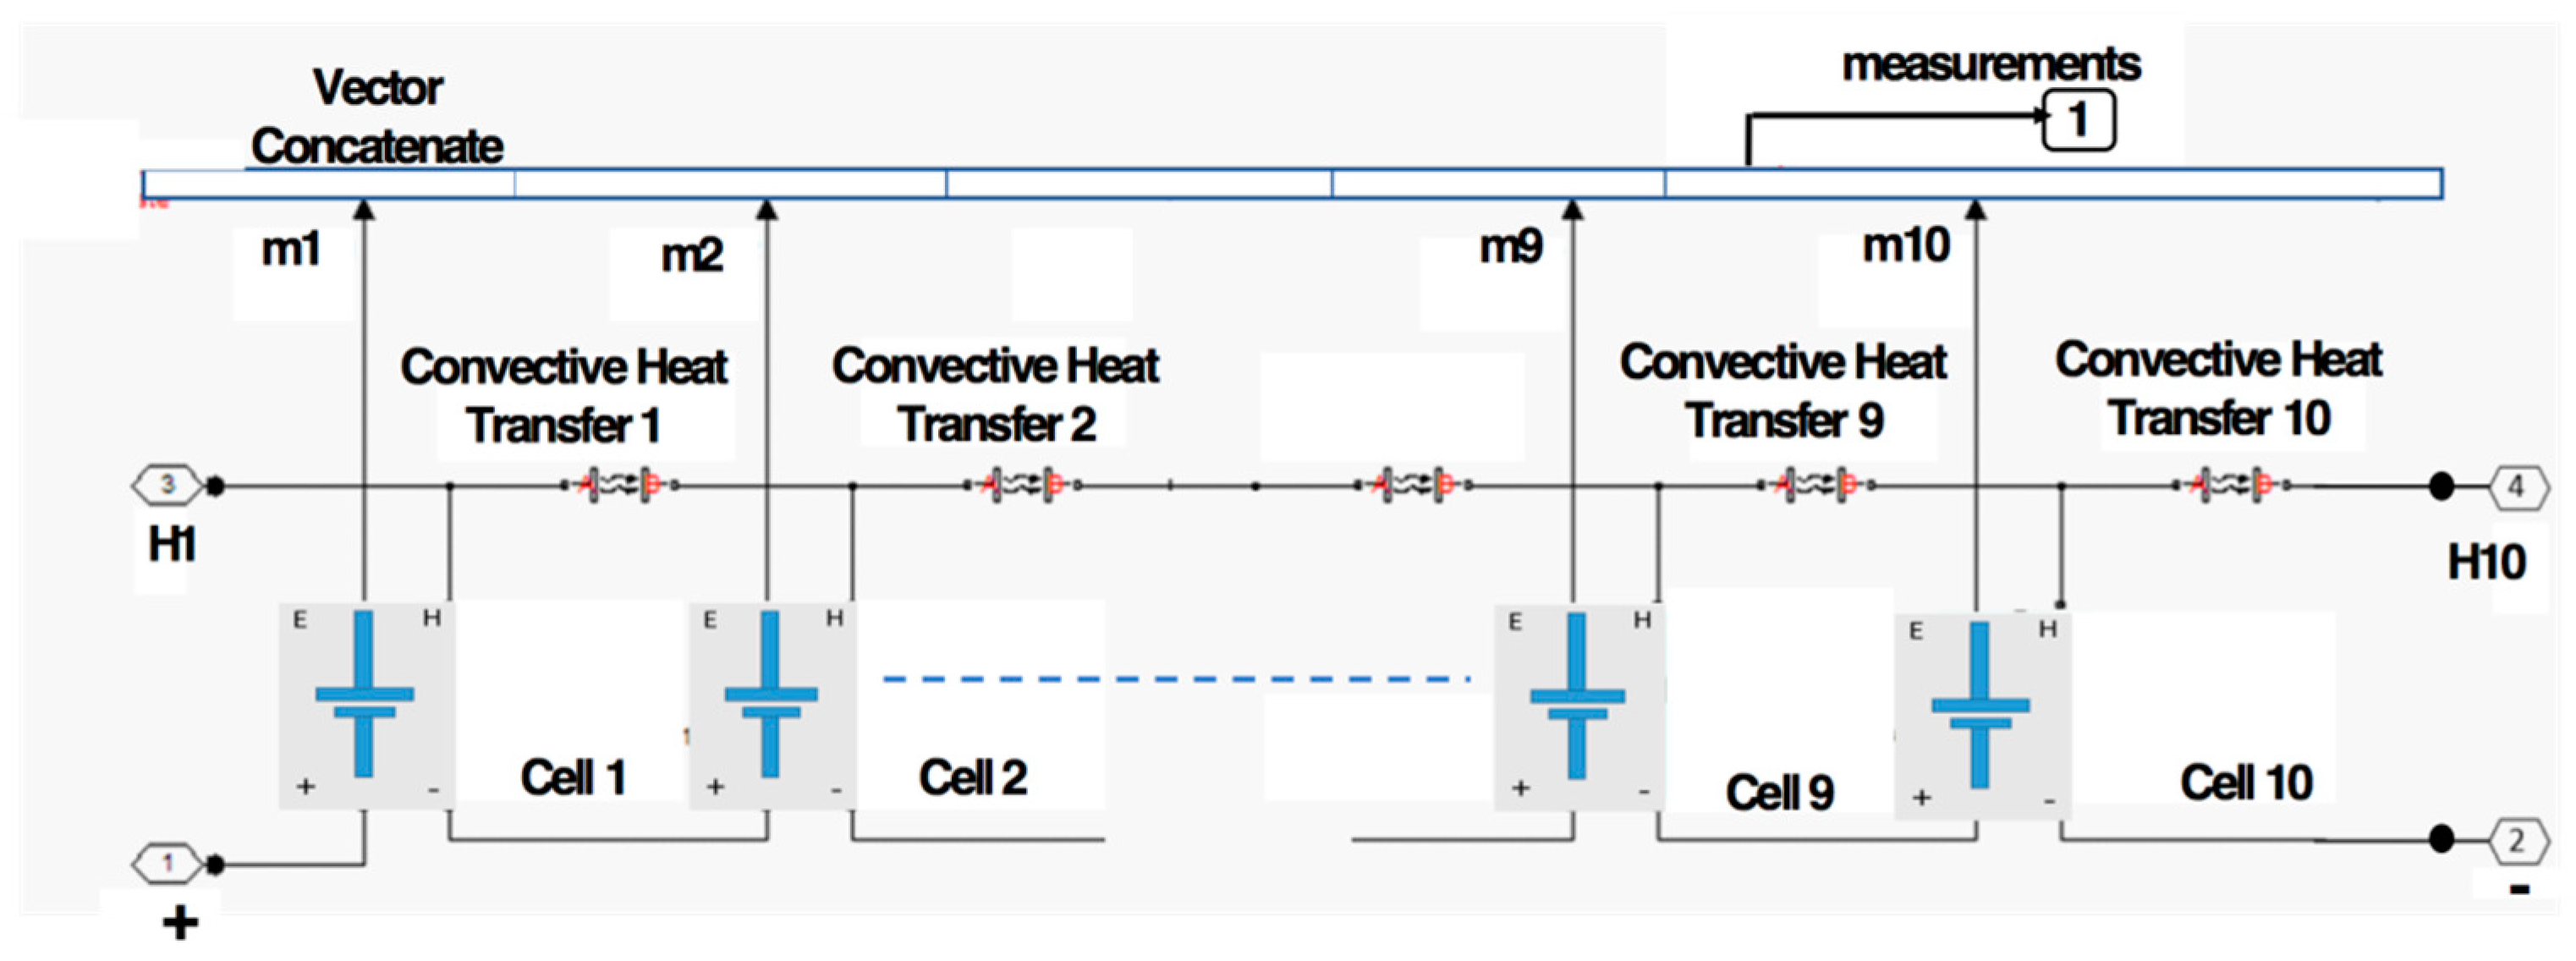
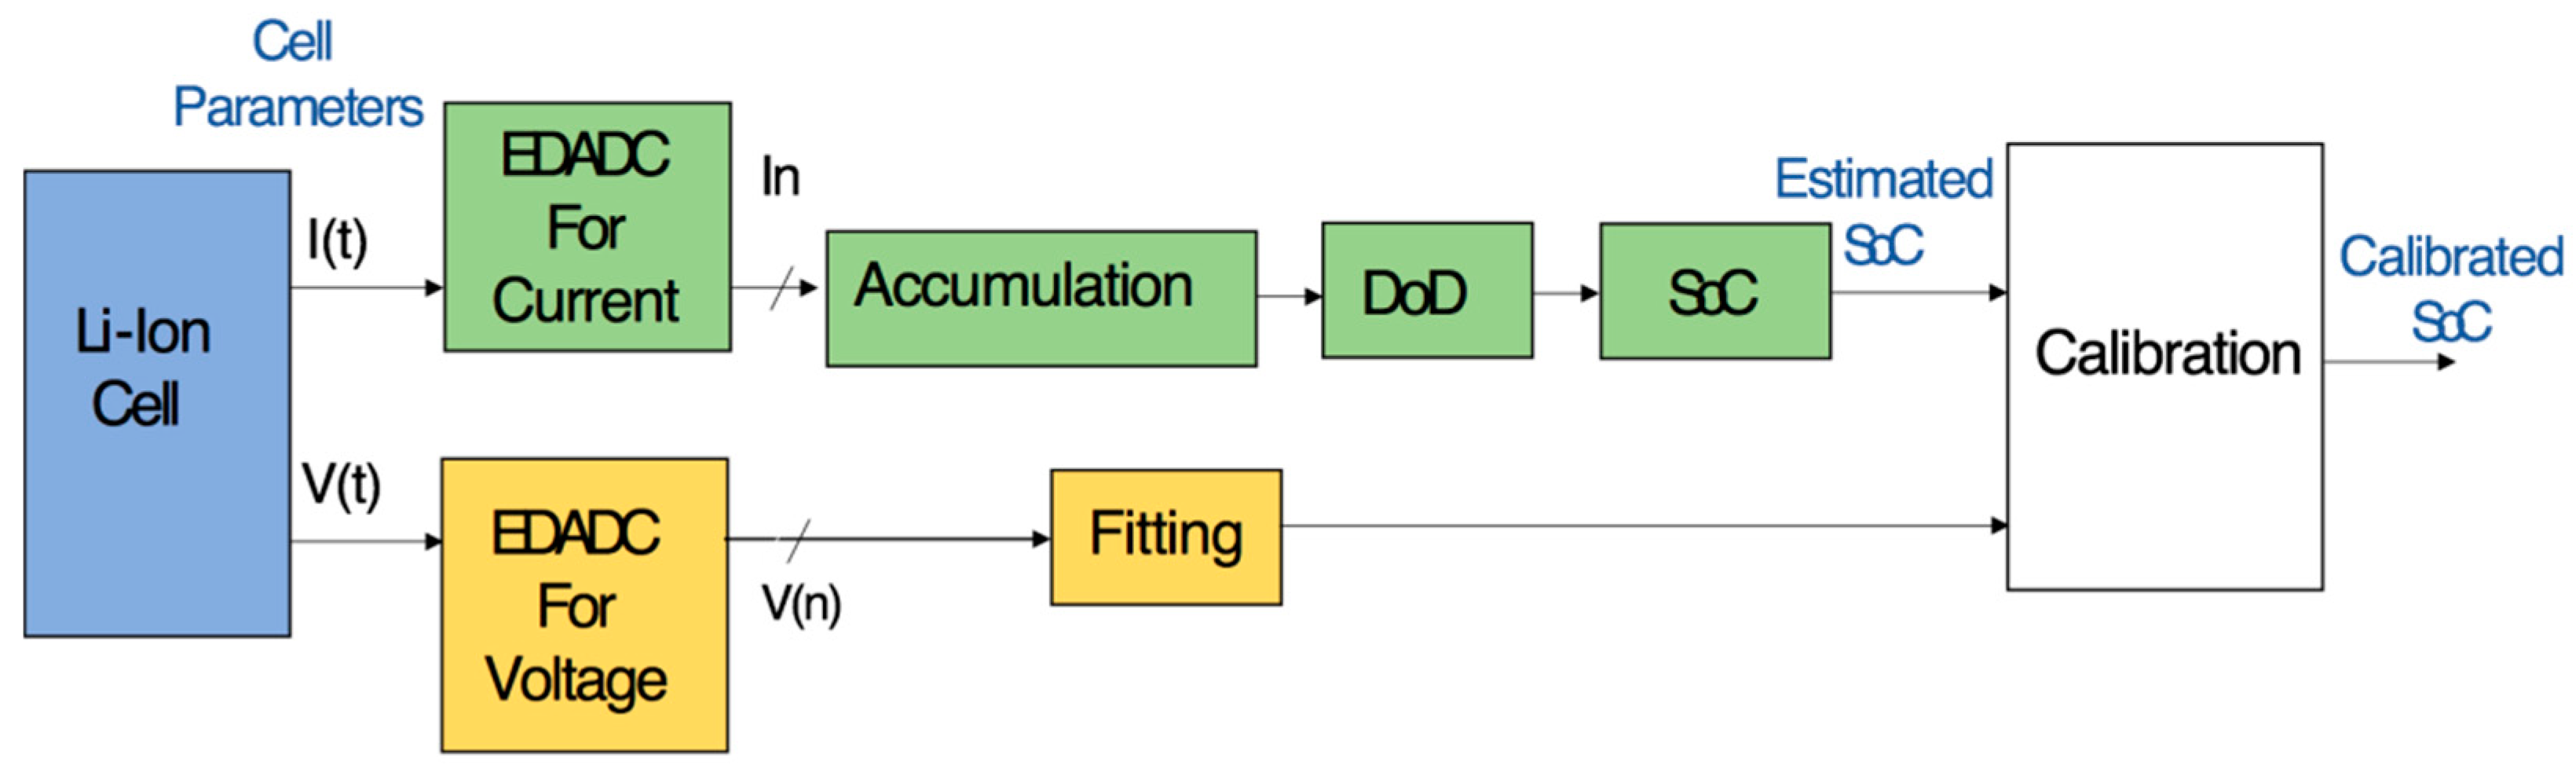
2.1. Li-Ion Battery Model

In this study, the employed dataset is generated by using the high-power Li-ion battery model presented in [18]. For reliable numerical modeling of batteries, equivalent circuit modeling (ECM) is a known technique [11]. As per [19], a single resistance-capacitance (RC) block is adequate to characterize all of the Li-ion cell’s dynamic properties. Therefore, in this work, a similar cell model is parametrized and used. Parameters are calculated by using the procedure described in [18]. The model elements are shown in Figure 2.
In Figure 2, Vb is the cell terminal voltage. The ECM elements are a function of the cell SOC and temperature, which are observable during the process of estimating the ECM elements [26]. Therefore, these elements values are implemented as lookup tables for a range of SOC and temperature values [26].
By using independent experimental results, the model parameters are verified. The fitting method primarily consists of evaluating four variables, namely Em, C1, R0 and R1. The electromotive force of the principal branch is Em. In the main branch, Ib is the charging/load current. The intrinsic ohmic resistance is R0. The RC element capacitive and resistive components are C1 and R1. For simulation, the parameterized model is used. Its output, such as voltages and currents, are used for evaluating the suggested SOC estimation method.
The model is parametrized to effectively simulate the cell model of lithium nickel manganese cobalt oxide (LiNixMnyCozO2)-(NMC) chemistry [18,27]. It is a suitable choice for EVs and has the lowest self-heating rate. Due to its high energy density, this technology powers a number of modern EVs, such as the Renault Twizy, Tesla Roadster and Smart Fortwo electric drive (ED) [1]. Its rated capacity Crated at ambient temperatureis31 Ah. This battery technology has a long lifetime and costs approximately US $400 per kWh, with an energy density of approximately 650 Wh/kg [27]. The MATLAB based SimscapeTM blocks and SimscapeTM language are used to build the ECMs [28,29]. The EDADCs, fitting module, SOC estimation and calibration processes are implemented in MATLAB [29].
The use of EVs is evolving to address the aims of reducing global warming and greenhouse gas emissions. In this context, a case study is performed for a battery that is designed for use in EVs. Initially, a battery pack of 9.92 kWh rated capacity is modeled. This battery capacity is suitable for contemporary electric vehicles and can provide a range of 110 km while driving a Renault Twizy at a maximum speed of 45 km per hour in real life conditions [1,30]. The battery pack is first realized by assembling ten cells in series to form a cell pack of 1.24 kWh rated capacity. The process is illustrated in Figure 3. Afterward, 8 cell packs are combined in series to realize a battery pack of 9.92 kWh rated capacity. The process can be seen in Figure 4.

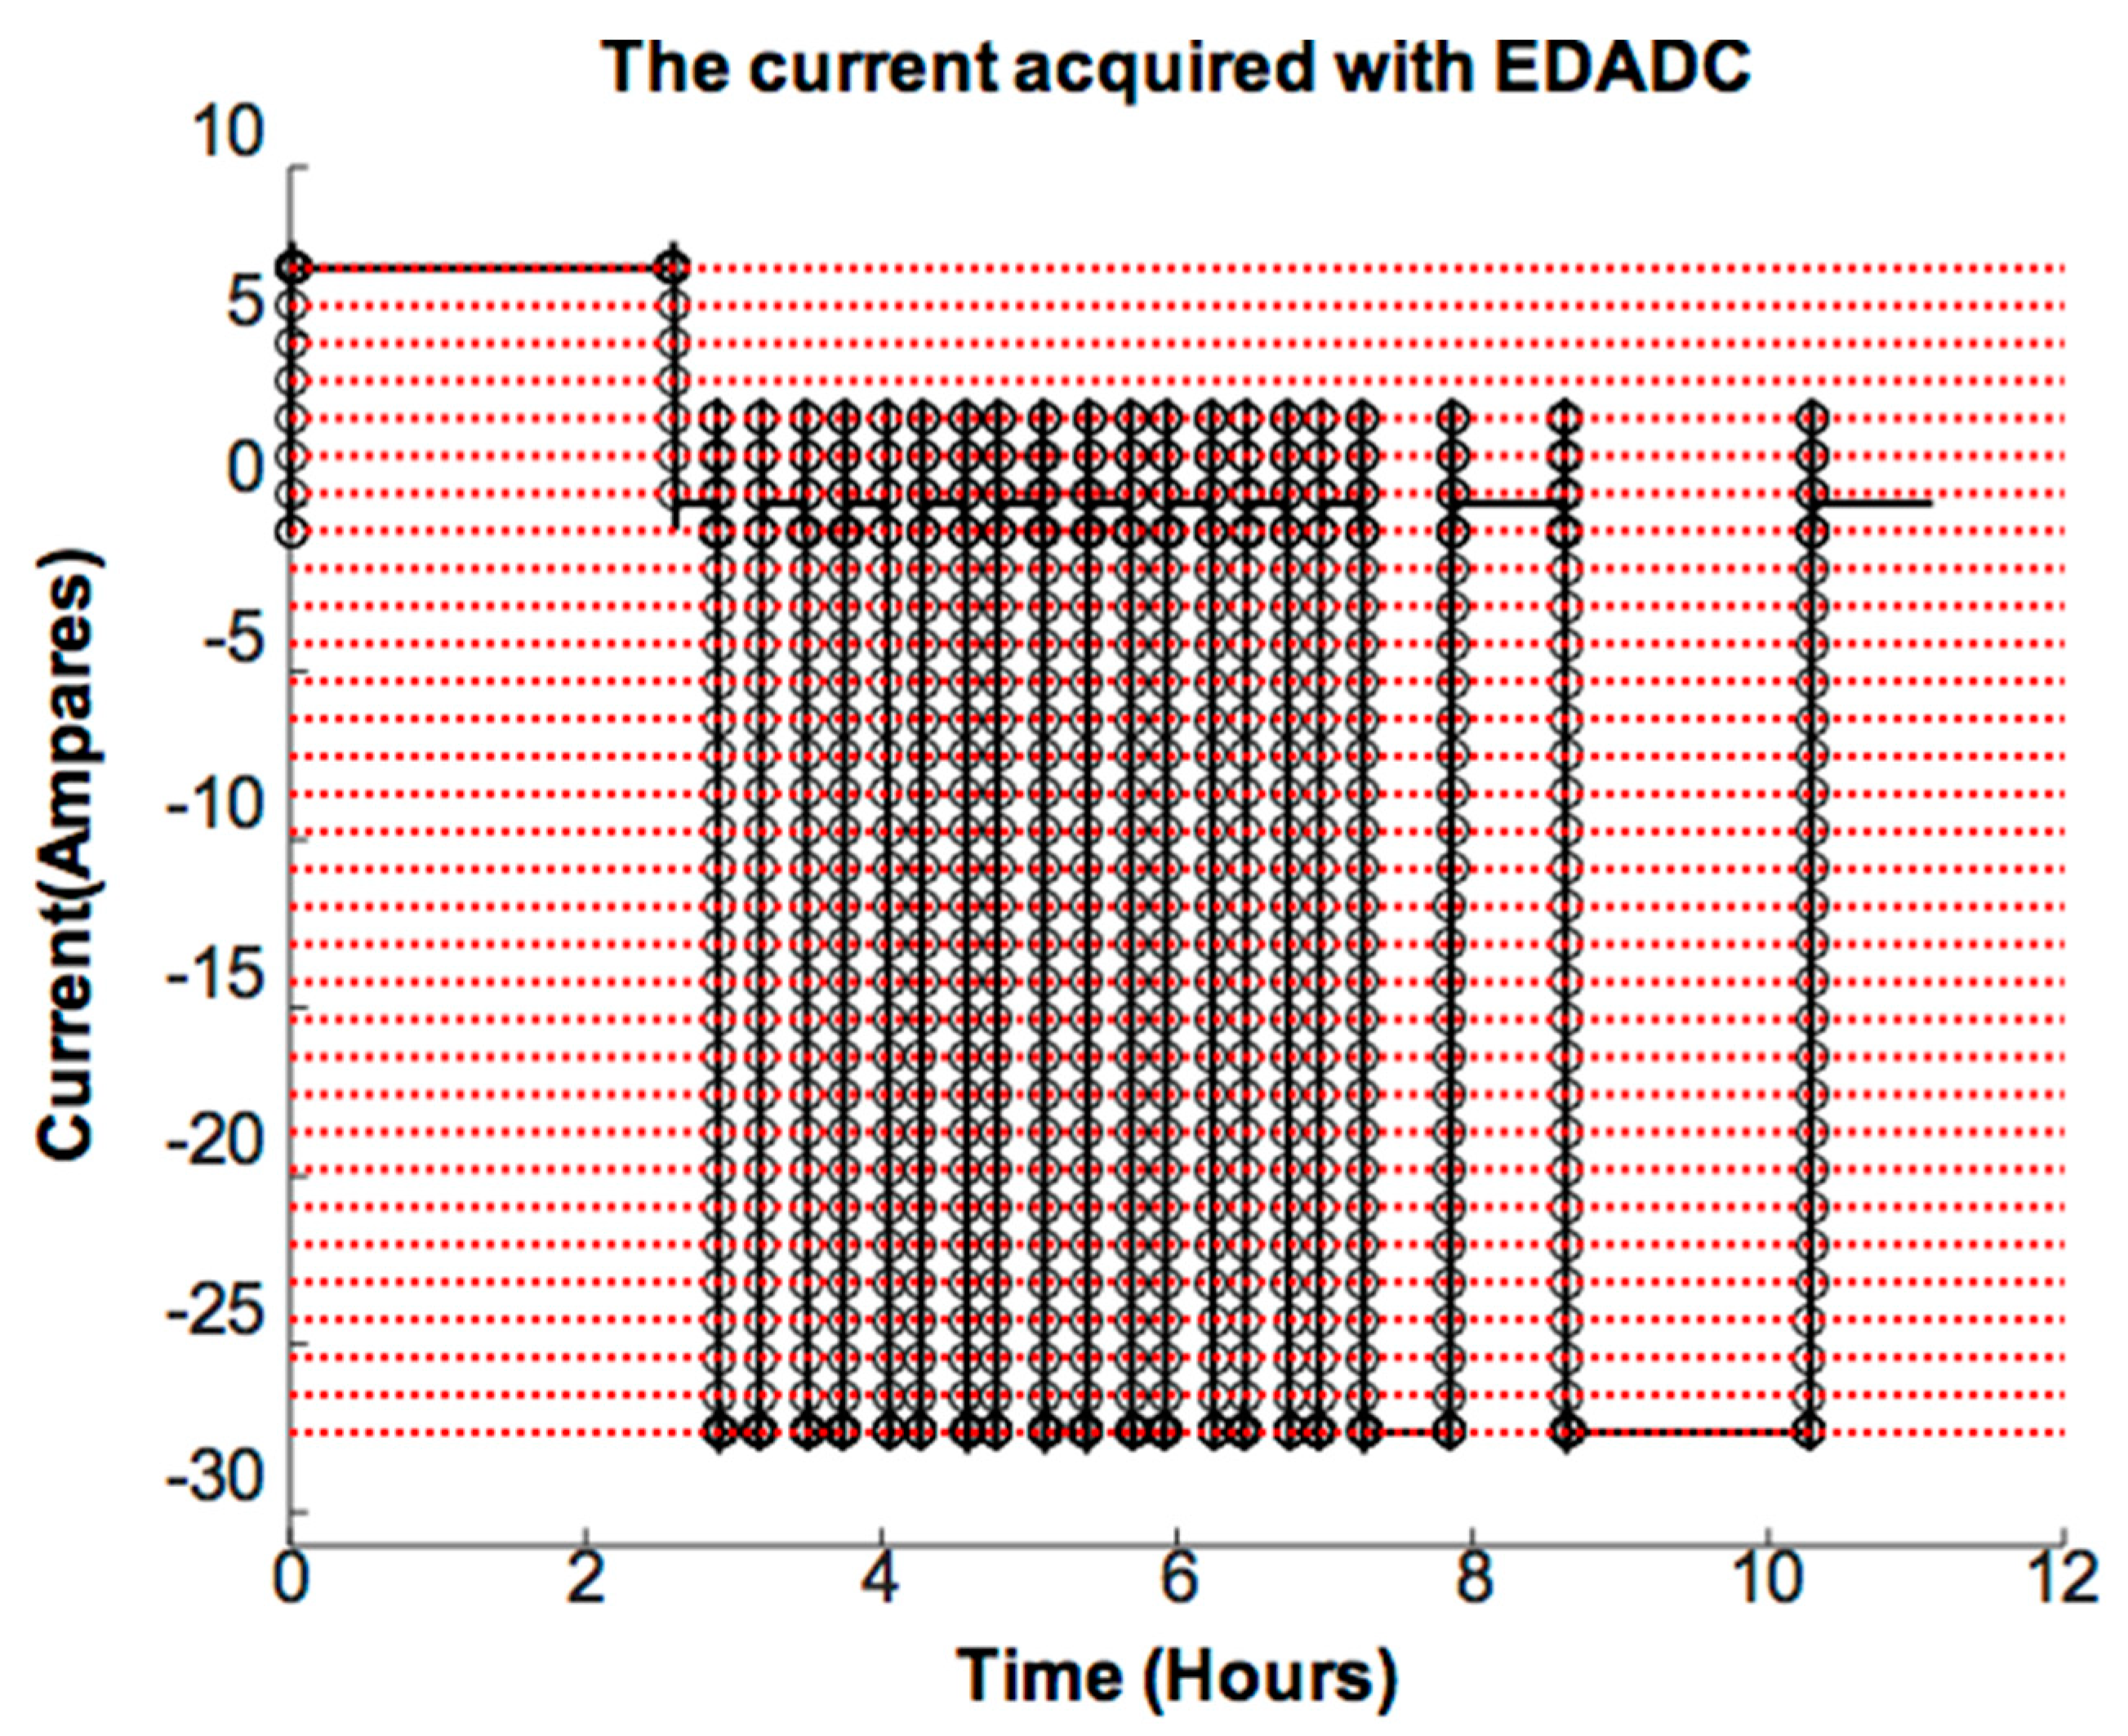
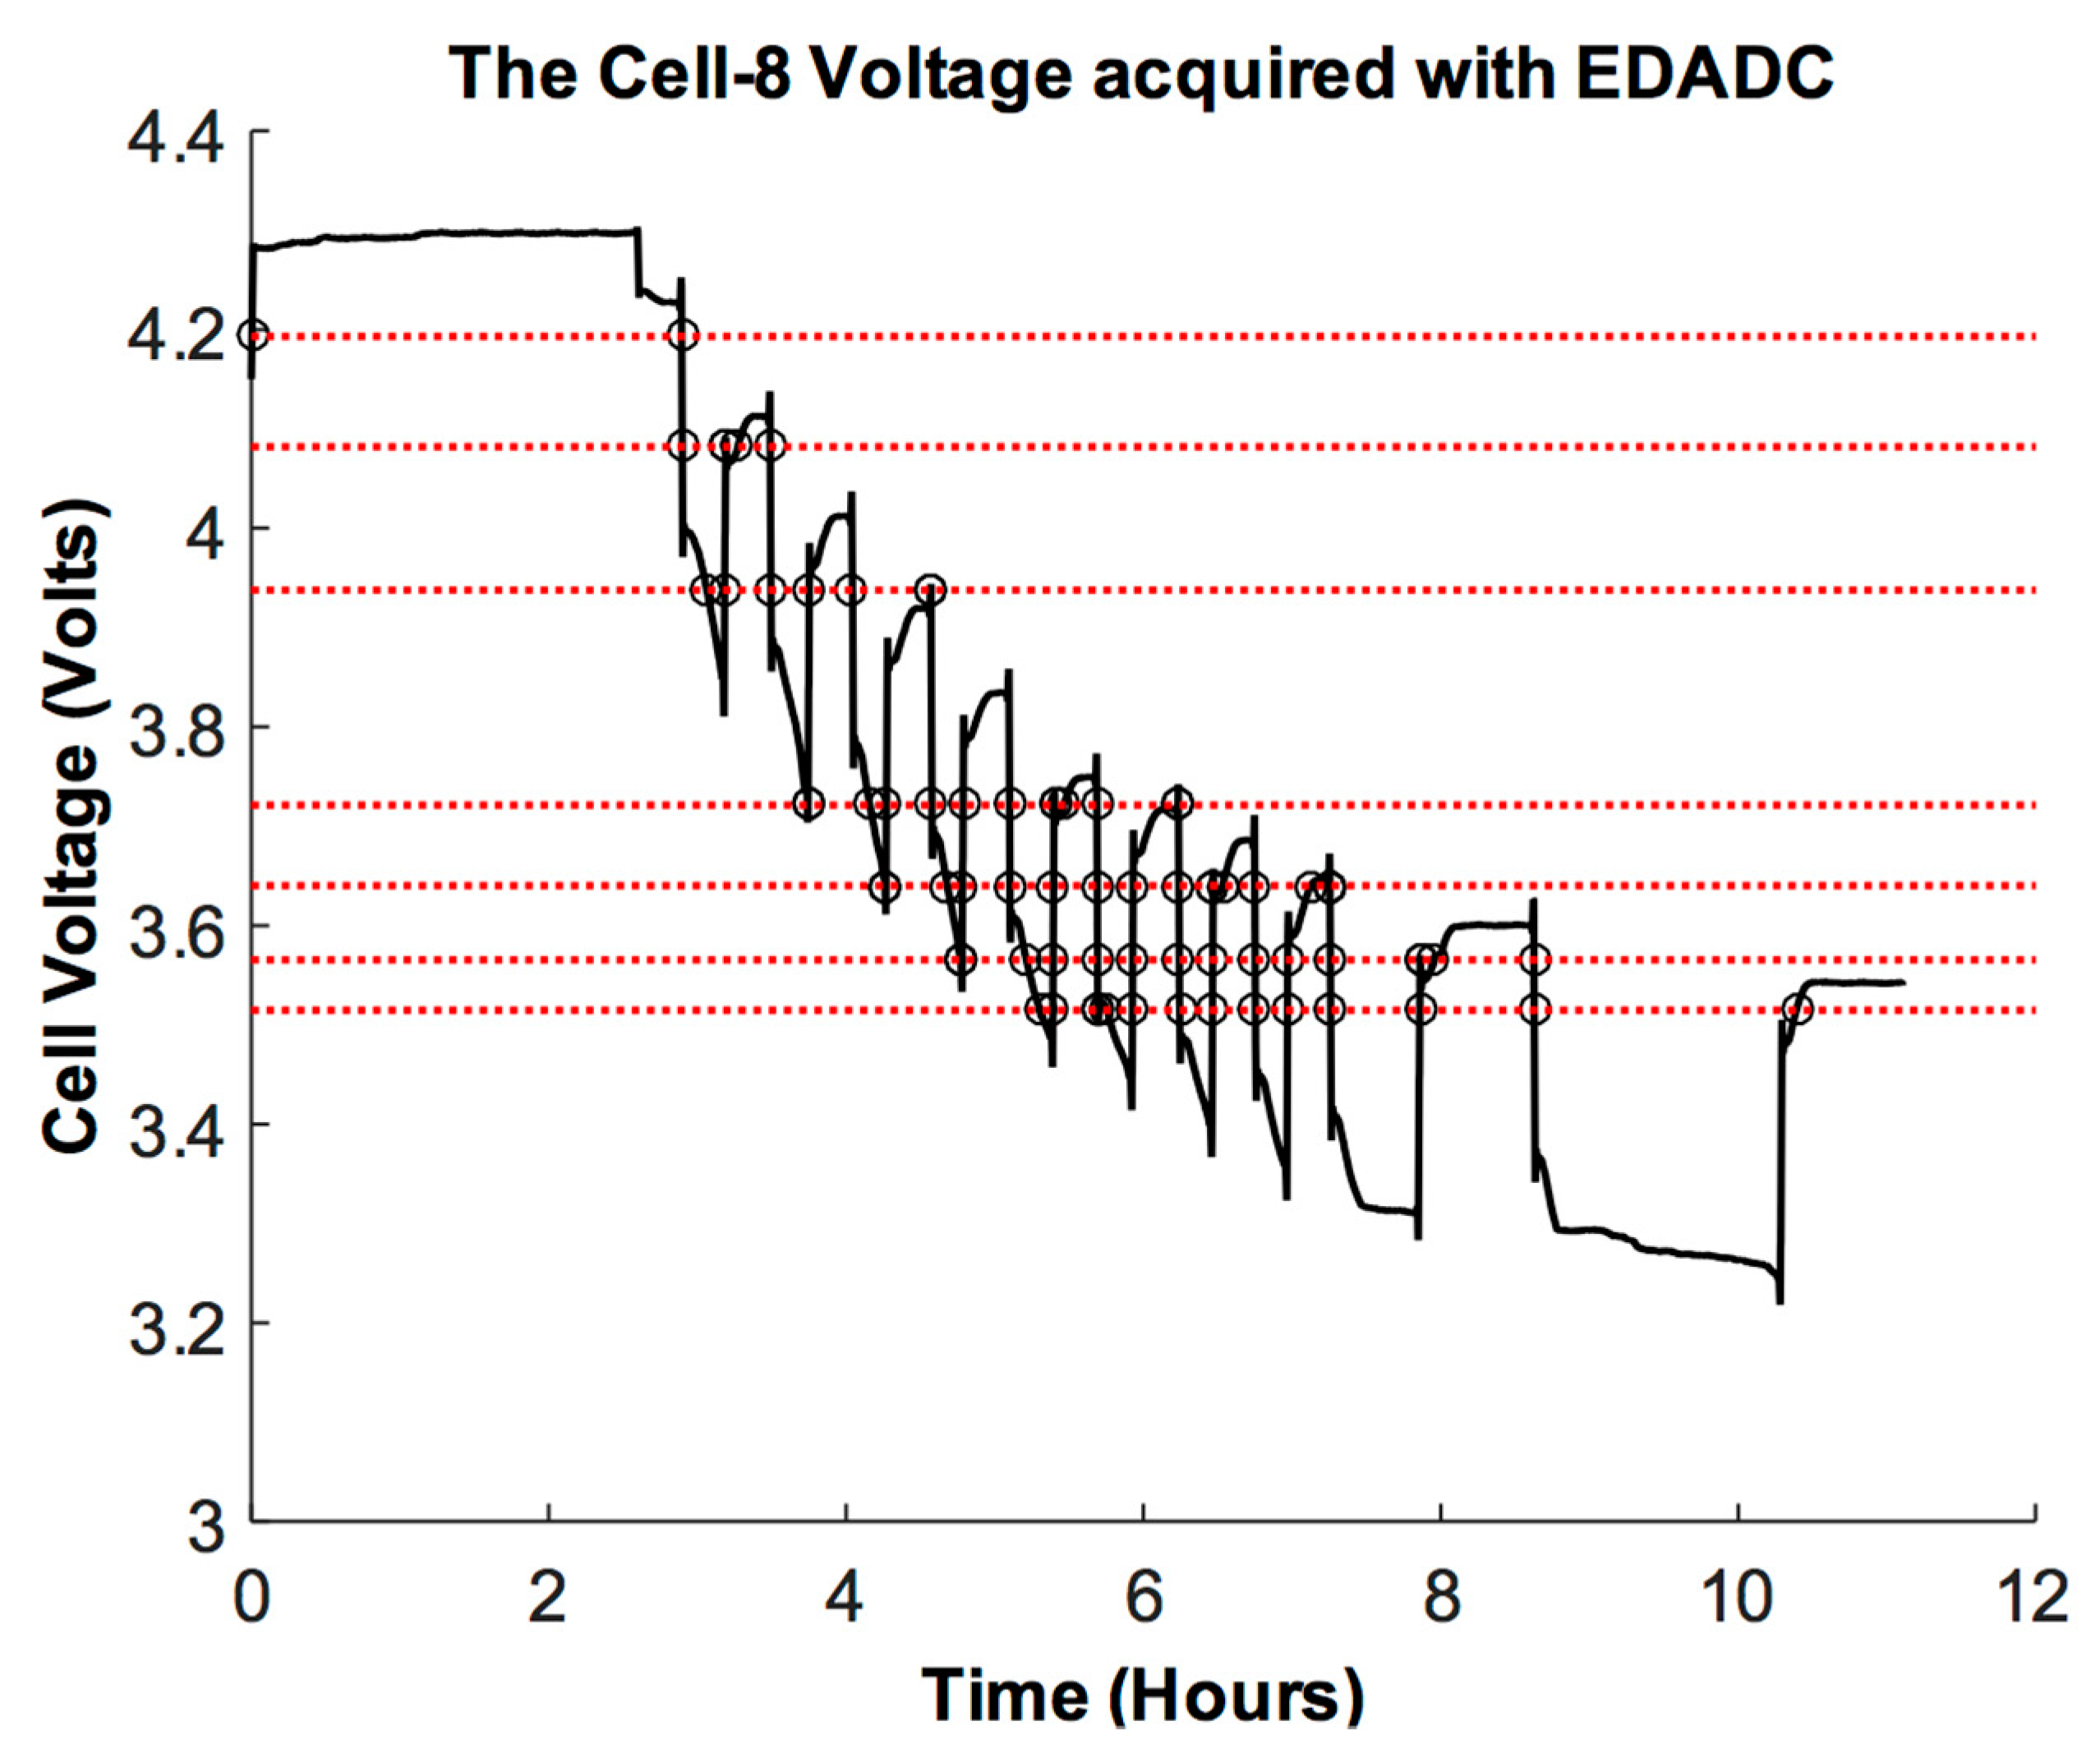
2.2. Event-Driven Data Acquisition

Fixed-rate analog-to-digital converters (ADCs) are integrated into conventional BMSs. Nyquist sampling and rules-based processing is used in traditional BMSs [12,16,21]. Therefore, the architectural parameters of these structures are configured for the worst scenario. In this sense, such devices are not effective in the case of arbitrary movement signals, such as battery voltage and current [12]. As such, event-driven ADCs (EDADCs) are used in this work [6,21]. They are realized via the rules of event-driven sampling (EDS) and can vary their sampling rate depending on the incoming signal disparities. Therefore, in the case of intermittent signals with reduced activity, tactful use of EDADCs can result in a substantial reduction in the number of samples obtained relative to traditional ADCs [6,21].
t n = t n 1 + d t n
In the case of EDADCs, a data point is only recorded once the incoming analog signal x(t) traverses one of the prefixed thresholds. Therefore, samples are irregularly distributed in time. The acquisition rate varies depending on the variations in x(t) [21]. The process is given by Equation (1).
Where dtn is the step of time among the nth tn and the n−1th tn−1 samples. Every sample is a pair (xn, tn), and here, tn is time, and xn is amplitude. xn is equal to one of the thresholds, and a timer circuit is used to record tn.
The solution that is proposed in this article is the use of EDADCs to acquire battery parameters, and depends on the event-driven sampling (EDS) phenomenon. In event-driven sampling, one takes a sample as soon as the input analog signal x(t) traverses a given threshold. Samples are collected depending on the time when x(t) crosses the given threshold; hence they are not distributed at even intervals (cf. Figure 5).
When choosing the set of levels, it is important to ensure that the levels span the analog signal amplitude range Δx(t). Figure 5 shows the case of equally spaced thresholds, spaced via a unique quantum q. Nonetheless, it is also possible to space the thresholds logarithmically or to use any other distribution [21]. Moreover, it is possible to realize time-varying threshold placement schemes [6].
The A/D conversion is mainly based on two operations, namely sampling and quantization [6]. The EDADCs are based on an A/D conversion principle, which is different in nature from the one used in conventional ADCs. In a conventional case, the instances of sampling are ideally precisely known, while the sample amplitudes are quantized. Therefore, the sole error is the quantization error, which depends on the ADC resolution R [21]. R is measured in numbers of bits. This error is quantified by measuring the signal to noise ratio (SNR) [21], given by Equation (2).
S N R d B = 1.76 + 6.02 R
For EDADCs, amplitudes of the samples are ideally known. However, the sampling instants are approximated by a timer circuit of step T t i m e r = 1 F t i m e r . Ftimer is the operating frequency of this timer circuit. According to [21], in this case, the SNR is given by Equation (3). Where Px and Px′ are powers of x(t) and of its derivative, respectively. The SNR is independent of R and can be improved by 6.02 dB by halving the Ttimer.
In classical cases, 12-bit resolution uniform ADCs are used for the acquisition of intended cell voltages and currents [12,18]. It allows the attainment of precise SOC estimation [31,32,33,34,35,36,37]. In this study, a 5-bit resolution uniform EDADC is used for the battery pack current acquisition. The choice of resolution is made in an incremental fashion in order to attain the best precision and computational complexity tradeoff. Each segment of the battery current waveform is considered equally important. Therefore, a uniform mid-raised quantization approach is used for the acquisition of the battery current. However, 2.8-bit resolution non-uniform EDADCs are used for the acquisition of cell voltages. The placement of threshold levels is decided as a function of the used reference SOC-OCV lookup table (cf. Section 2.3). Here, OCV stands for open-circuit voltage. The EDADCs are employed with 32-bit resolution timers, which operate at F T i m e r = 40 kHz. These parameters permit accurate recording of the intended cell signals for a duration of around 30 h. Additionally, for these parameter selections, the theoretical EDADC SNR is around 73 dB, which is closer to the theoretical SNR of a 12-bit resolution ADC and validates the selected system parameters for the targeted application.
S N R d B = 10 . log ( 3 . P x P x ) 20 . l o g ( T t i m e r )

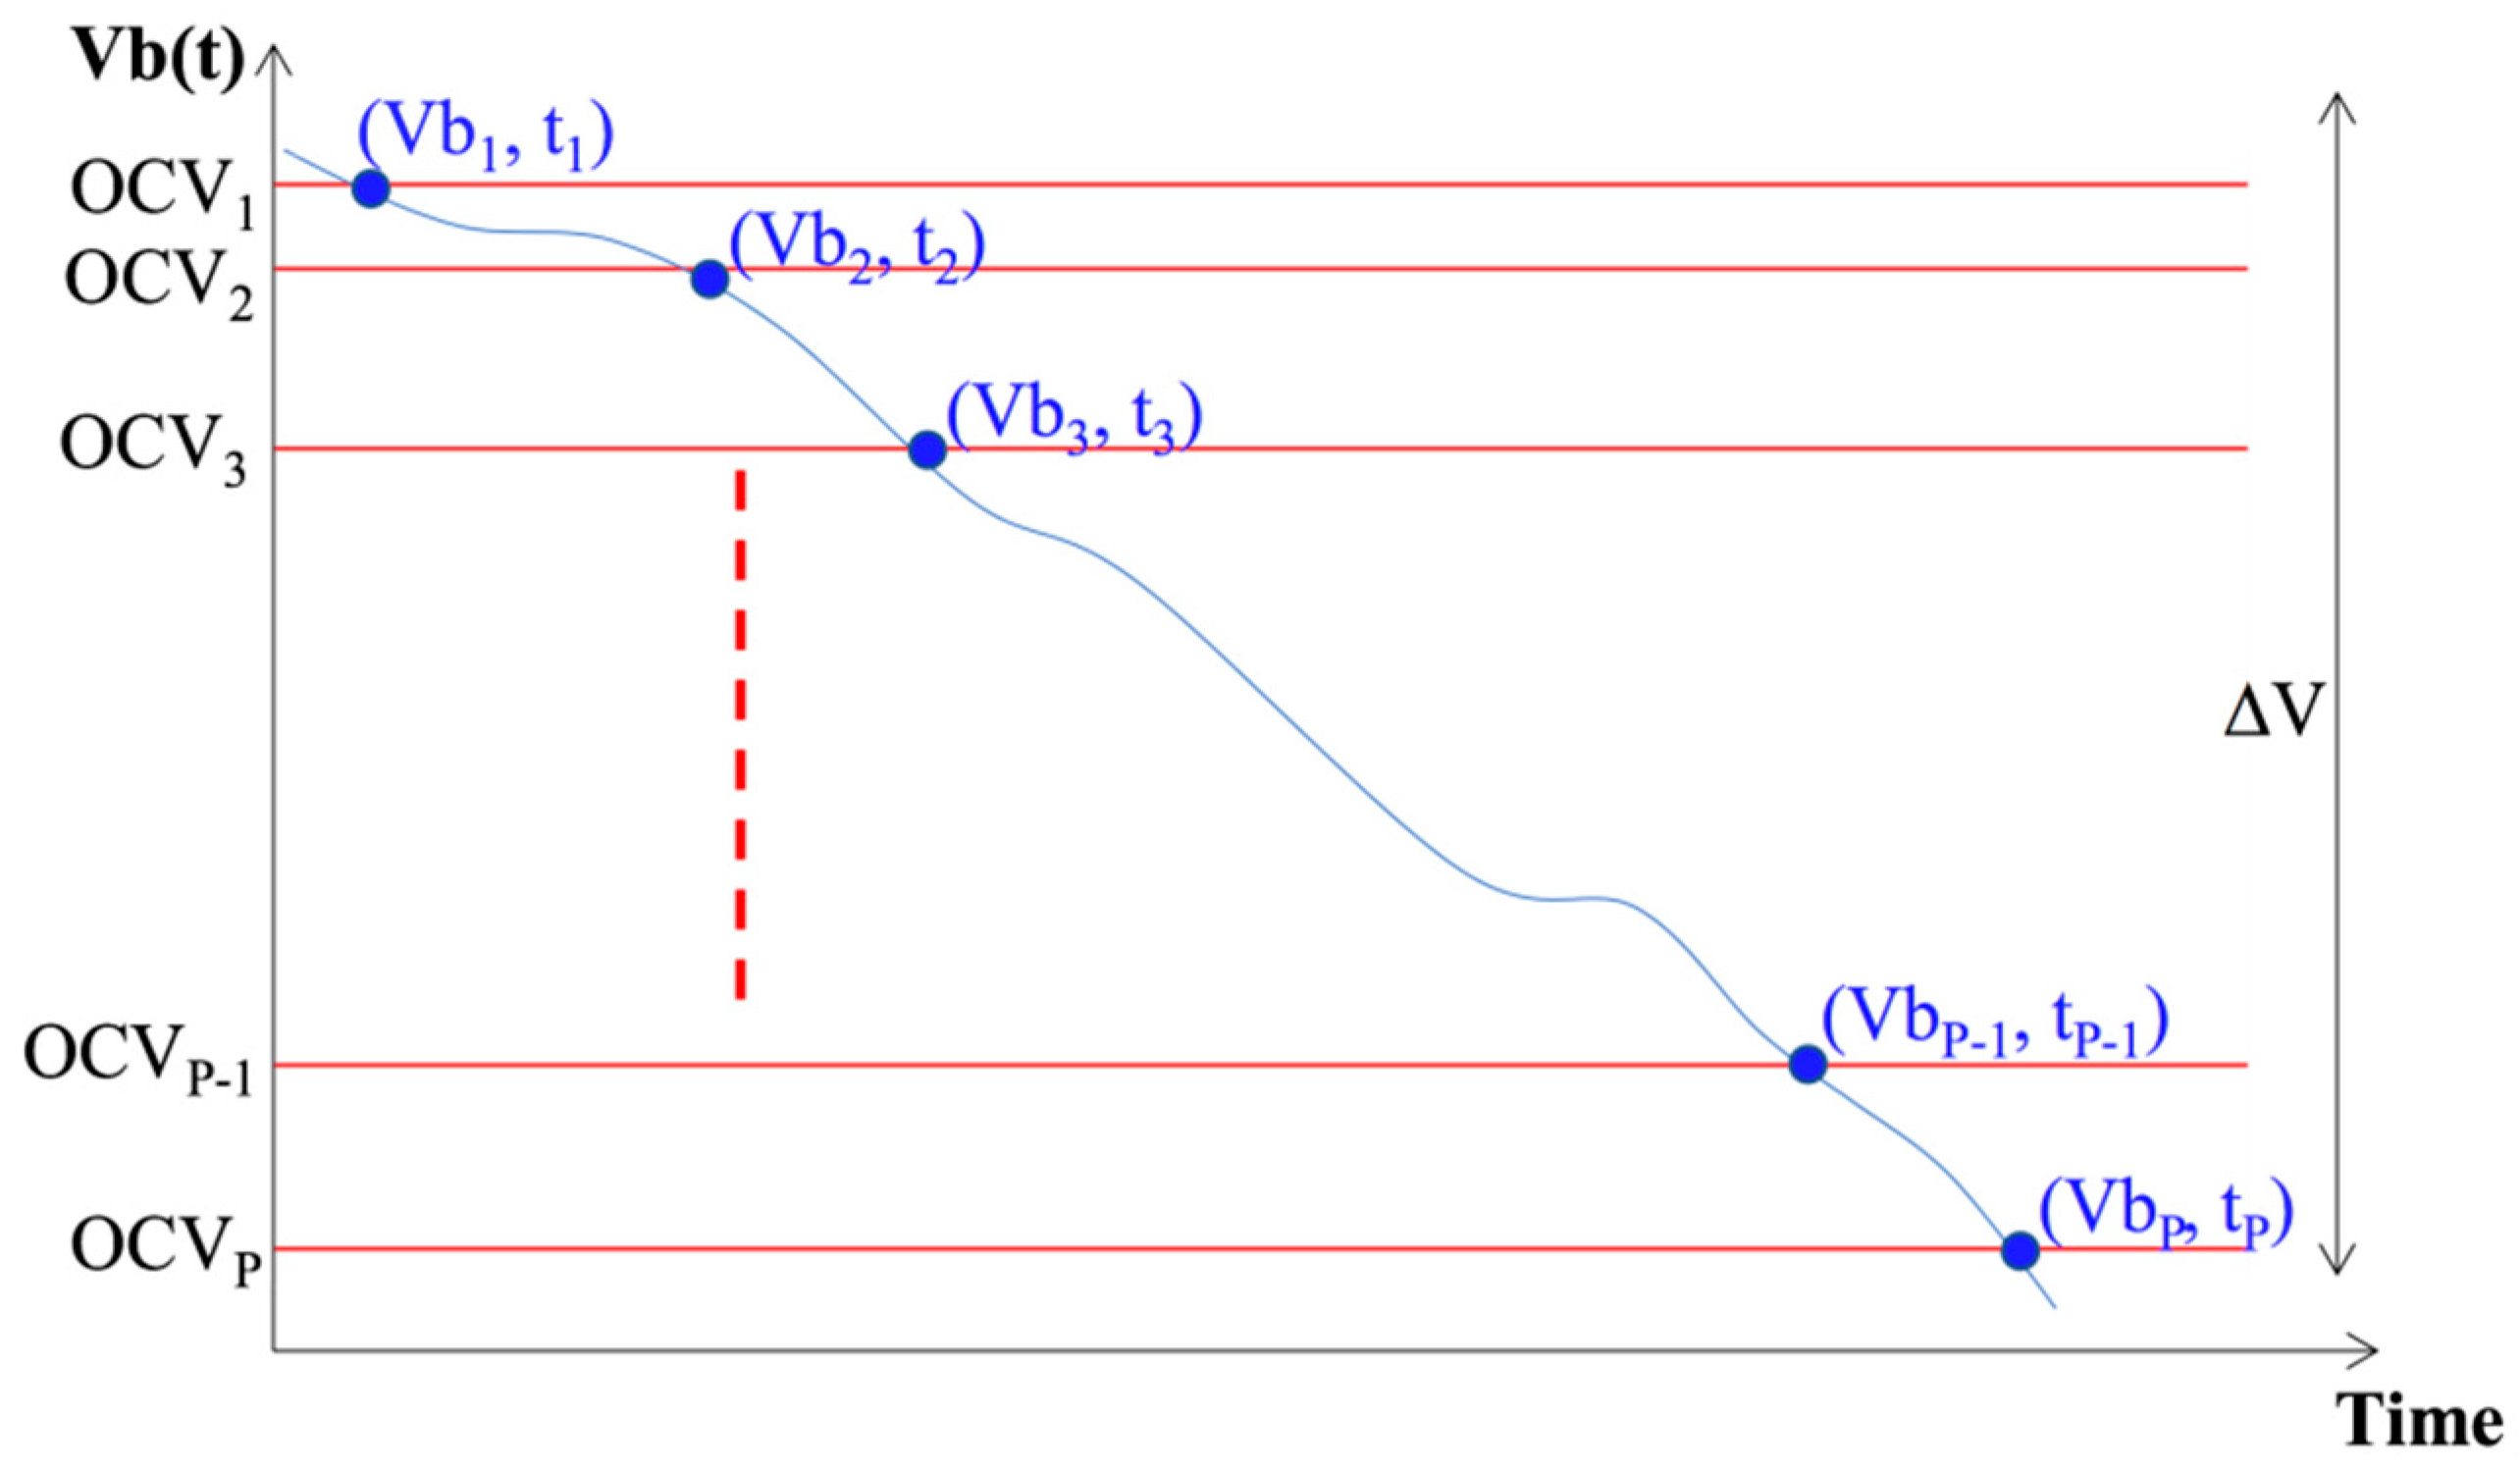
2.3. Event-Driven Coulomb Counting

Coulomb counting is the most appropriate and computationally efficient methodology for online SOC determination [38]. It mainly accumulates sample magnitudes of the intended cell’s current and uses it for the SOC approximation. Self-discharge currents and parasitic losses are not taken into account by this simple technique. Consequently, calculation errors are accumulated with time, and, therefore, periodic error correction is required [26,38]. SOC correction approaches based on SOC-OCV have been employed for this purpose [24,25,38].
Recent technological advancements have revolutionized the usage of digital real-time SOC estimation algorithms [38,39]. The main advantages of over the counter analog approaches are the configurability, precession and availability of mature computer-aided design (CAD) tools. In this sense, in contemporary BMSs, battery parameters, like voltage, temperature and current, are no longer processed in the analog domain and are instead digitized and processed later on with available state-of-the-art digital processing algorithms [39].
A novel event-driven coulomb counting method is introduced in this paper. The principle for one cell is depicted in Figure 6.

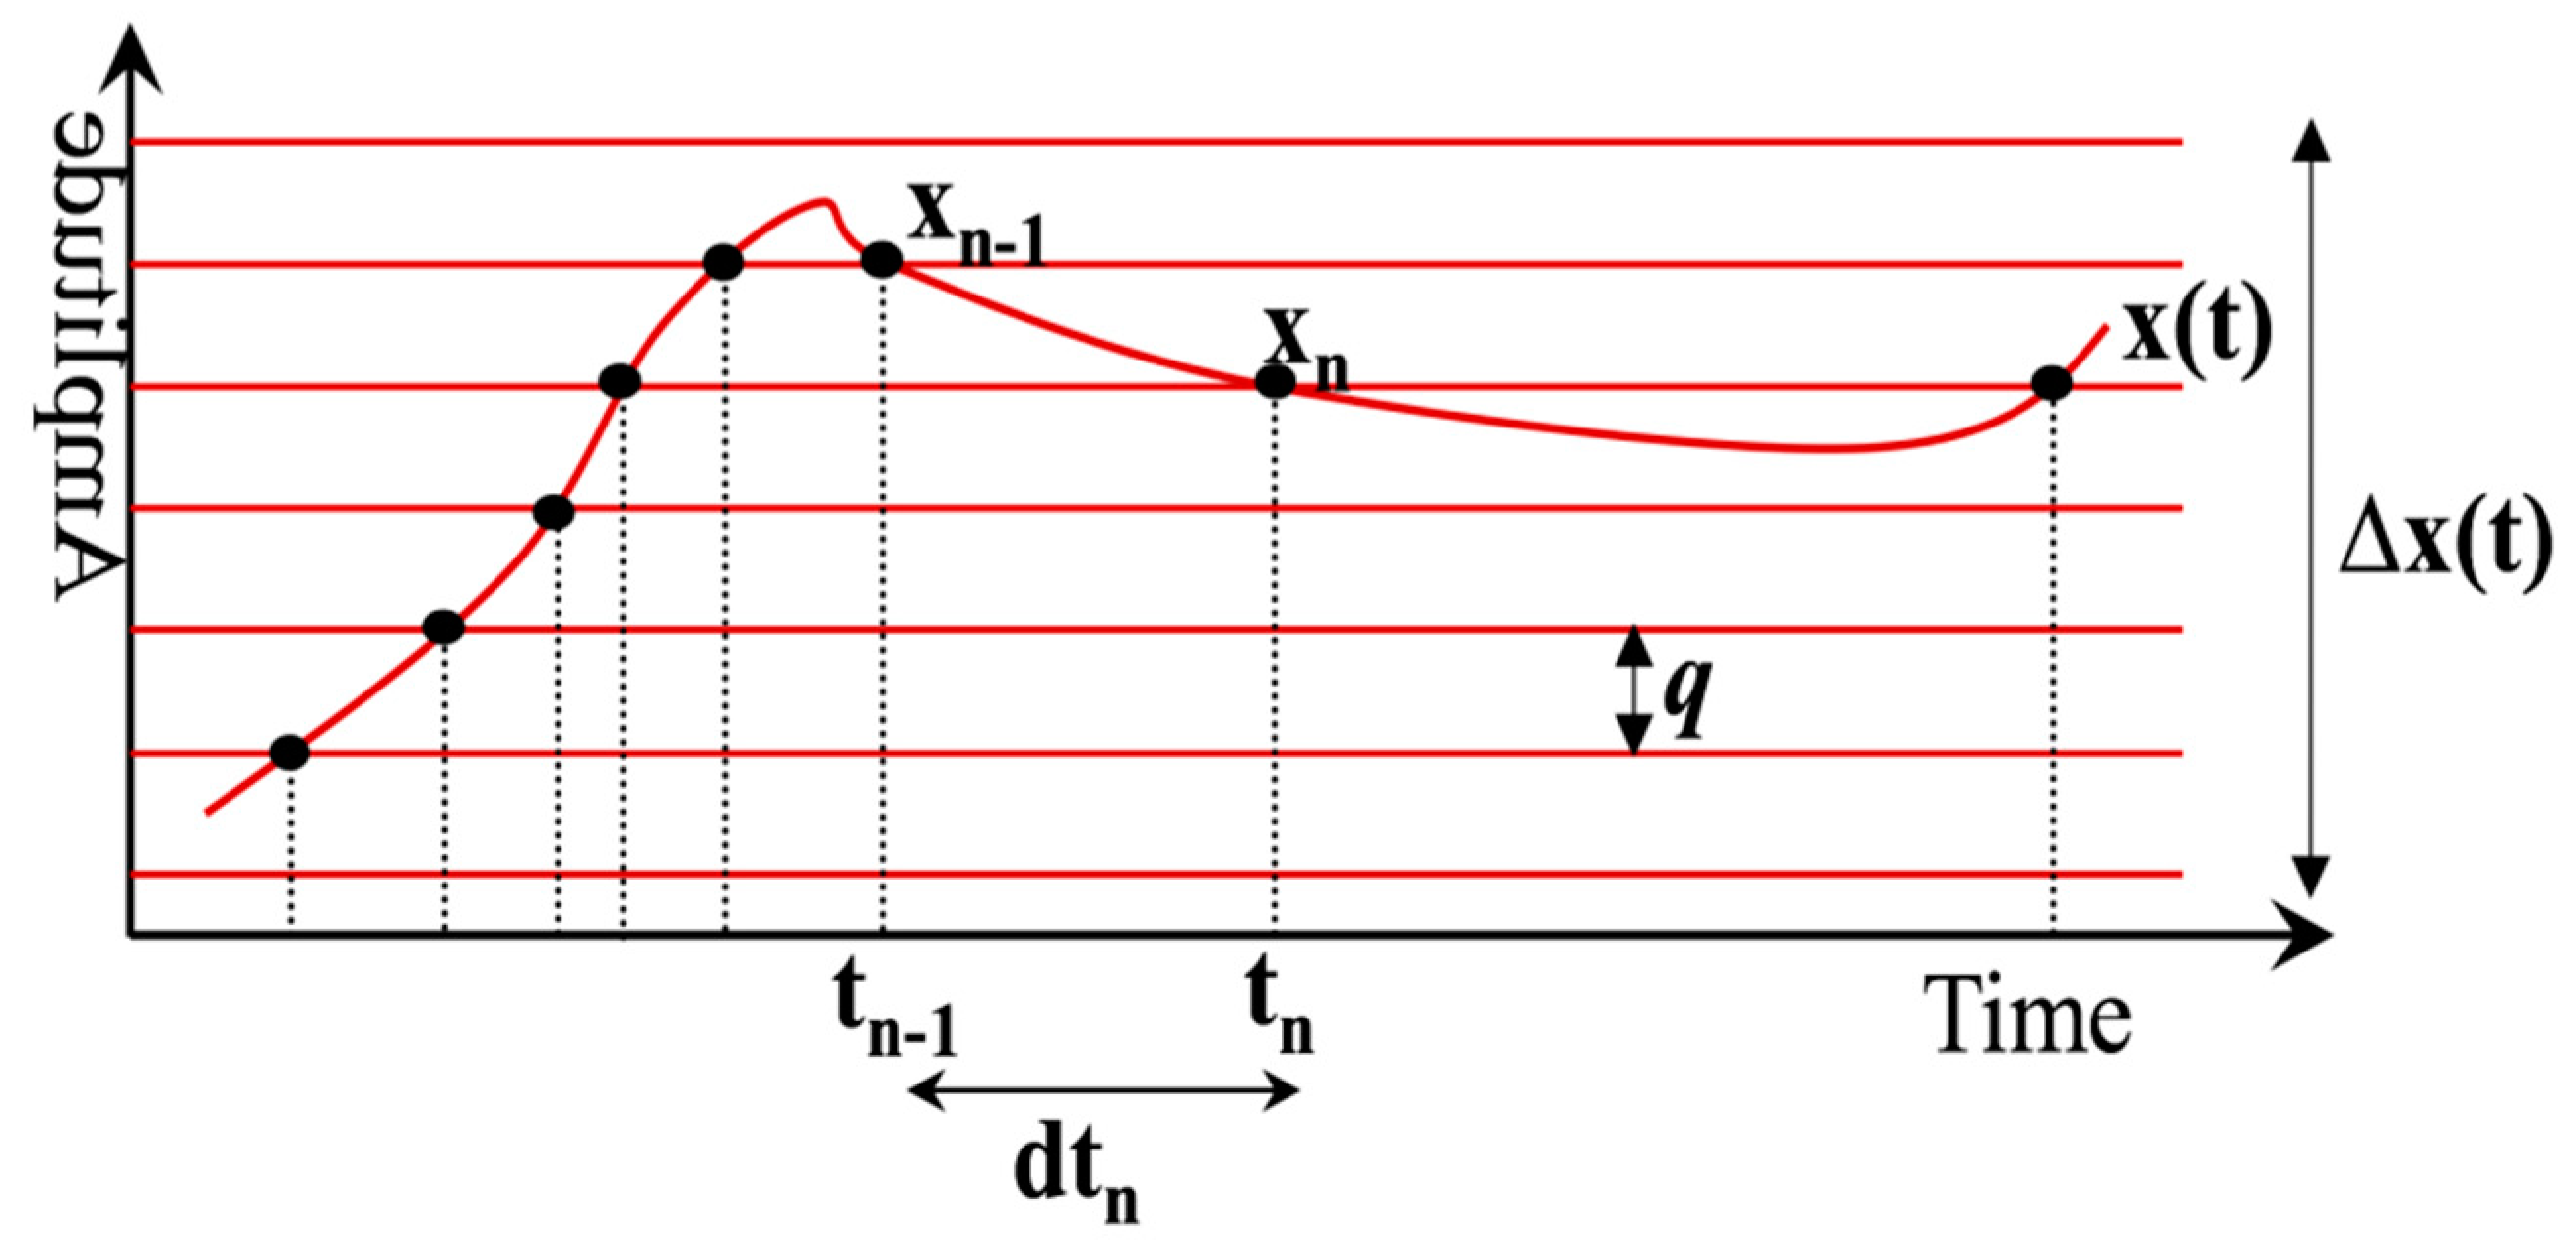
2.3.1. Conventional Approach

Let Crated be the full charge capacity of a cell, which depends on the discharge and storage time and cell temperature. Firstly, the released charge Creleased is calculated by integrating the Ib(t) for a considered time interval. Digitally, it is attained by the summation of the sampled version of Ib(t). Creleased is the extracted charge from the cell in ampere hours (Ah) [38].
The sampled version of Ib(t) is obtained, in the conventional case, by multiplying Ib(t) with the uniform sampling function S ( t ) = n = 0 N δ ( t n L s ) [39]. The process is given by Equation (4). Where δ ( t ) is the Dirac function, L s = 1 F s is the sampling step and F s is the sampling frequency [39]. The choice of F s is made by following the Nyquist criterion. N is the total number of current samples acquired during the considered observation time interval (t0; t1) hours.
I b s ( t ) = n = 0 N I b ( t ) . δ ( t n L s ) = n = o N I b ( n L s )
The Creleased between the time interval (t0; t1) hours is given by Equation (5). Where I b n is the sampled version of charging/load current.
C r e l e a s e d = n = t 0 × F s n = N = t 1 × F s I b ( n L s )
The depth of discharge (DOD) can be calculated by using Equation (6). The DOD is expressed as the ratio between the amount of charge released to the rated capacity of the cell. Finally, the SOC can be estimated by using Equation (7). The SOC in percentage is given by Equation (8).
D O D = C r e l e a s e d C r a t e d
S O C = 1 D O D
S O C P = ( 100 ( D O D × 100 ) ) %
The calibration of estimated SOC is performed by using a reference SOC-OCV correlation curve, obtained by performing high precision experimentations in the laboratory [11,18,38]. Samples of this SOC-OCV curve are stored in memory as a lookup table. Equal length OCV and SOC sets are used, which are respectively OCV-V={OCV1, OCV2, …, OCVP} and SOC-V={SOC1, SOC2, …, SOCP}. The length of both sets is P.
During online operation, the battery terminal voltage Vb(t) is sampled, and the process is given by Equation (9).
V b s ( t ) = n = 0 M V b ( t ) . δ ( t n L s ) = n = o M V b ( n L s )
Due to the Li-ion cell hysteresis phenomenon, the online measured values of V b ( t ) can lead to erroneous SOC calibration [27]. In this context, curve fitting and Kalman filtering techniques are frequently used [27,40]. Each coming sample V b n is first fitted to generate V b F n . The complexity of the fitting process depends on the fitting algorithm used [27,40]. Each sample V b F n is subsequently compared with elements of the set OCV-V, and P magnitude comparisons are performed for each incoming fitted sample. The calibration operation depends on the comparator outcome. The calculated SOC value is calibrated as SOC1 if V b F n = OCV1. If V b F n = OCV2, then the calculated SOC value is calibrated as SOC2. The procedure for the remaining OCV-V elements is identical.

2.3.2. Proposed Approach

Figure 6 shows that the system starts measuring current and voltage for the Li-ion cell. Different EDADC architectures are used for current and voltage measurements. We accumulate the current samples in real-time and use the output to compute the depth of discharge (DOD), which is then used to estimate the SOC.
The EDADC introduces non-uniformity in the sampling process (cf. Equation (1)). Unlike the classical sampling scheme, we do not have an a priori knowledge of the sampling instants in this case. Each time the sampling process is triggered, the corresponding sampling instant is recorded using a timer circuit [21]. The sampled version of Ib(t) is given by Equation (10), where I b n is the nth current sample magnitude, t n is the corresponding instance of the nth current sample and NED-Current is the current samples, acquired during the considered observation time interval (t0; t1) hours.
In the proposed system, Ib(t) is acquired by using an M = 5-bit resolution and uniform quantization based EDADC. The selected levels span the analog signal amplitude range ΔI. The uniform quantization scheme leads to a unique quantum q = Δ x ( t ) 2 M 1 [22]. The choice of EDADC resolution is made in an incremental fashion to obtain the optimal solution in terms of system complexity and precision.
I b s ( t ) = n = 0 N E D C u r r e n t 1 I b ( t ) . δ ( t t n ) = n = o N E D C u r r e n t 1 ( I b n , t n )
In this case, the Creleased between the time interval (t0; t1) hours is given by using Equation (11). n is an adaptive multiplication coefficient, adjusted for the nth current sample as a function of d t n (cf. Equation (1)). It allows an appropriate approximation of the area under the curve while compensating the impact of non-uniform repartitioning of the sampling instants. Afterward, the DOD, SOC and SOCP are respectively computed by employing Equations (6)–(8).
C r e l e a s e d = n = 0 n = N E D C u r r e n t I b n × n
In the proposed solution, an original event-driven SOC-OCV based calibration mechanism is devised. The EDADC with non-uniform quantization is used. The reference threshold levels are placed by following the values of the reference OCV-V elements. P thresholds are positioned within the magnitude dynamics Δ V of Vb(t). The principle is shown in Figure 7. In the proposed solution, an OCV-V with 7 elements is used, resulting in the realization of 2.807-bit resolution EDADC for the Vb(t) measurement.
In this case, the Vb(t) sampling process is given by Equation (12), where V b n is the nth voltage sample magnitude, t n is the corresponding instance of the nth current sample and NED-Voltage is the number of event-based voltage samples acquired during the considered observation time interval (t0; t1) hours.
V b s ( t ) = n = 0 N E D - V o l t a g e V b ( t ) . δ ( t t n ) = n = 0 N E D - V o l t a g e ( V b n , t n )
A proper OCV measurement requires that the battery is kept static without load for an appropriate time. It is necessary to avoid any hysteresis impact for the measured OCV [27]. Such latencies are not affordable in online SOC estimation methods required in practical applications [27,40]. To overcome this bottleneck, the terminal voltage Vb(t) measurements are used in place of OCV [27,40]. In order to avoid errors, the Vb(t) data is collected during the constant current based charging and discharging cycles. The obtained SOC-OCV curves, calculated during charging and discharging cycles, are then averaged. In the next step, the averaged curve is fitted to the reference SOC-OCV correlation curve by using a 3rd order polynomial. The reference SOC-OCV correlation curve is computed by performing high-precision laboratory experiments, where the reference OCV is measured after keeping the considered Li-ion cell static to achieve a stable condition [27,40]. During online operation, an acquired sample of terminal voltage V b n is fitted to obtain V b F n . The process is given by Equation (13). Where coefficient vector A = { a 3 , a 2 , a 1 , a 0 } is obtained during the curve fitting process, given by Equation (14). Where X R e f is the reference SOC-OCV coefficient vector and X m e a s u r e d is the average of SOC-OCV vectors coefficients calculated during constant current charging and discharging cycles.
V b F n = a 3 V b n 3 + a 2 V b n 2 + a 1 V b n + a 0
A = [ X R e f T . X R e f ] 1 × X R e f T . X M e a s u r e d
Unlike the standard calibration operation, in the devised solution, it is not required to regularly sample the Vb(t) and fit and compare each V b n with the OCV-V elements for calibration. The mechanism of calibration only triggers on the basis of events. Here, an event points towards the occurrence of predefined threshold crossing by the Vb(t). In this case, P thresholds are realized by employing P discriminators. Sample magnitudes are predefined since they can be equal to one of the thresholds established depending on the SOC-OCV reference curve. On the occurrence of every event, a terminal voltage sample is generated and fitted. The fitted sample V b F n is then compared with elements of the set OCV-V. P magnitude comparisons are performed for each incoming fitted sample. The approximated SOC value is adjusted as SOC1 for the case when V b F n = OCV1. Similarly, the approximated SOC value is adjusted as SOC2 for the case when V b F n = OCV2. The process for the remaining OCV-V elements is the same.

2.4. Evaluation Measures

2.4.1. Compression Ratio

Compression ratio measures the performance of the designed solution in terms of the amount of collected information. The assessment is made while comparing with the conventional fixed-rate approach. The compression ratios for the battery current and cell voltages can be respectively calculated by using Equations (15) and (16). In Equation (15), N and N E D - C u r r e n t are current samples acquired for a considered time span of L T -hours in the conventional and proposed cases, respectively. In Equation (16), M and N E D - V o l t a g e are voltage samples acquired for a considered time span of L T -hours in the conventional and proposed cases, respectively.
R C o m p I = N N E D - C u r r e n t
R C o m p V = N N E D - V o l t a g e

2.4.2. Computational Complexity

It is straightforward to calculate the arithmetical complexity of the classical coulomb counting method. Let FsI be the sampling frequency for sampling of the cell current. Therefore, it remains unique and time-invariant. The whole considered signal span is thus sampled at FsI. By using Equation (17), the acquired number of current samples N can be determined for a considered time length LT. If FsV is the sampling rate for the acquisition of the cell terminal voltage, then it remains unique and time-invariant. Thus, the whole considered signal span is sampled at FsV. Therefore, it is possible to measure the acquired number of voltage samples M for a time length LT by using Equation (18).
N = F s I × L T
M = F s V × L T
In this case, N additions are carried out by the classical coulomb counting method to compute Creleased for a single battery cell. N divisions and N subtractions are needed to measure DOD and SOC, respectively. For each acquired terminal voltage sample, the fitting operation is realized by performing eight multiplications and three additions (cf. Equation (13)). The fitted voltage sample is then used for the calibration judgment. This decision of calibration is made by conducting P comparisons. Equation (19) gives the overall numerical complexity for the classical case.
C c l a s s i c = N + 3 × M A d d i t i o n + N D i v i s i o n + N S u b t r a c t i o n + 8 × M M u l t i p l i c a t i o n + P × M C o m p a r i s o n
The sampling frequency is not fixed in the case of the designed method and is updated as a function of the input signal variations [21]. Consequently, the count of samples obtained for LT-Hours can be specific for each cell. Current and voltage samples, obtained in the case of the suggested method, are NED-Current and NED-Voltage, respectively. Then, NED-Current additions and NED-Current multiplication are performed by the event-driven coulomb counting algorithm to compute Creleased.
The DOD and SOC calculations involve NED-Current divisions and NED-Current subtractions, respectively. The fitting process is performed by executing eight multiplications and three additions for each acquired terminal voltage sample. The fitted voltage sample is used for the calibration judgment, which is made by conducting P comparisons. Finally, Equation (20) gives the total numerical cost of the devised event-driven coulomb counting method.
C E v e n t - D r i v e n = N E D - C u r r e n t + 3 × N E D - V o l t a g e A d d i t i o n + N E D - C u r r e n t + 8 × N E D - V o l t a g e M u l t i p l i c a t i o n + N E D - C u r r e n t D i v i s i o n + N E D - C u r r e n t S u b t r a c t i o n + P × N E D - V o l t a g e C o m p a r i s o n

2.4.3. Effectiveness of Fitting

For online SOC calibration, each voltage sample is fitted by using a 3rd order polynomial. The polynomial coefficients are computed by using the curve fitting approach [41]. The effectiveness of the curve fitting process is evaluated in terms of the sum of squares due to error (SSE) and the ratio of the sum of squares of regression (SSR) and the total sum of squares (SST), which is denoted as R-squared. The SSE, SSR, SST and R-squared are given by Equations (21)–(24). Where x n is the nth reference observation, x n ^ is the nth approximated observation and x ¯ is the mean of K reference observations.
For SSE, a value closer to zero provides a good model with lower random error and good online fitting and vice versa. R-squared can have any value between (0; 1). A higher value will provide a better model performance and vice versa.
S S E = n = 1 K ( x n x n ^ ) 2
S S R = n = 1 K ( x n ^ x ¯ ) 2
S S T = n = 1 K ( x n x ¯ ) 2
R S q u a r e = S S R S S T

2.4.4. SOC Estimation Error
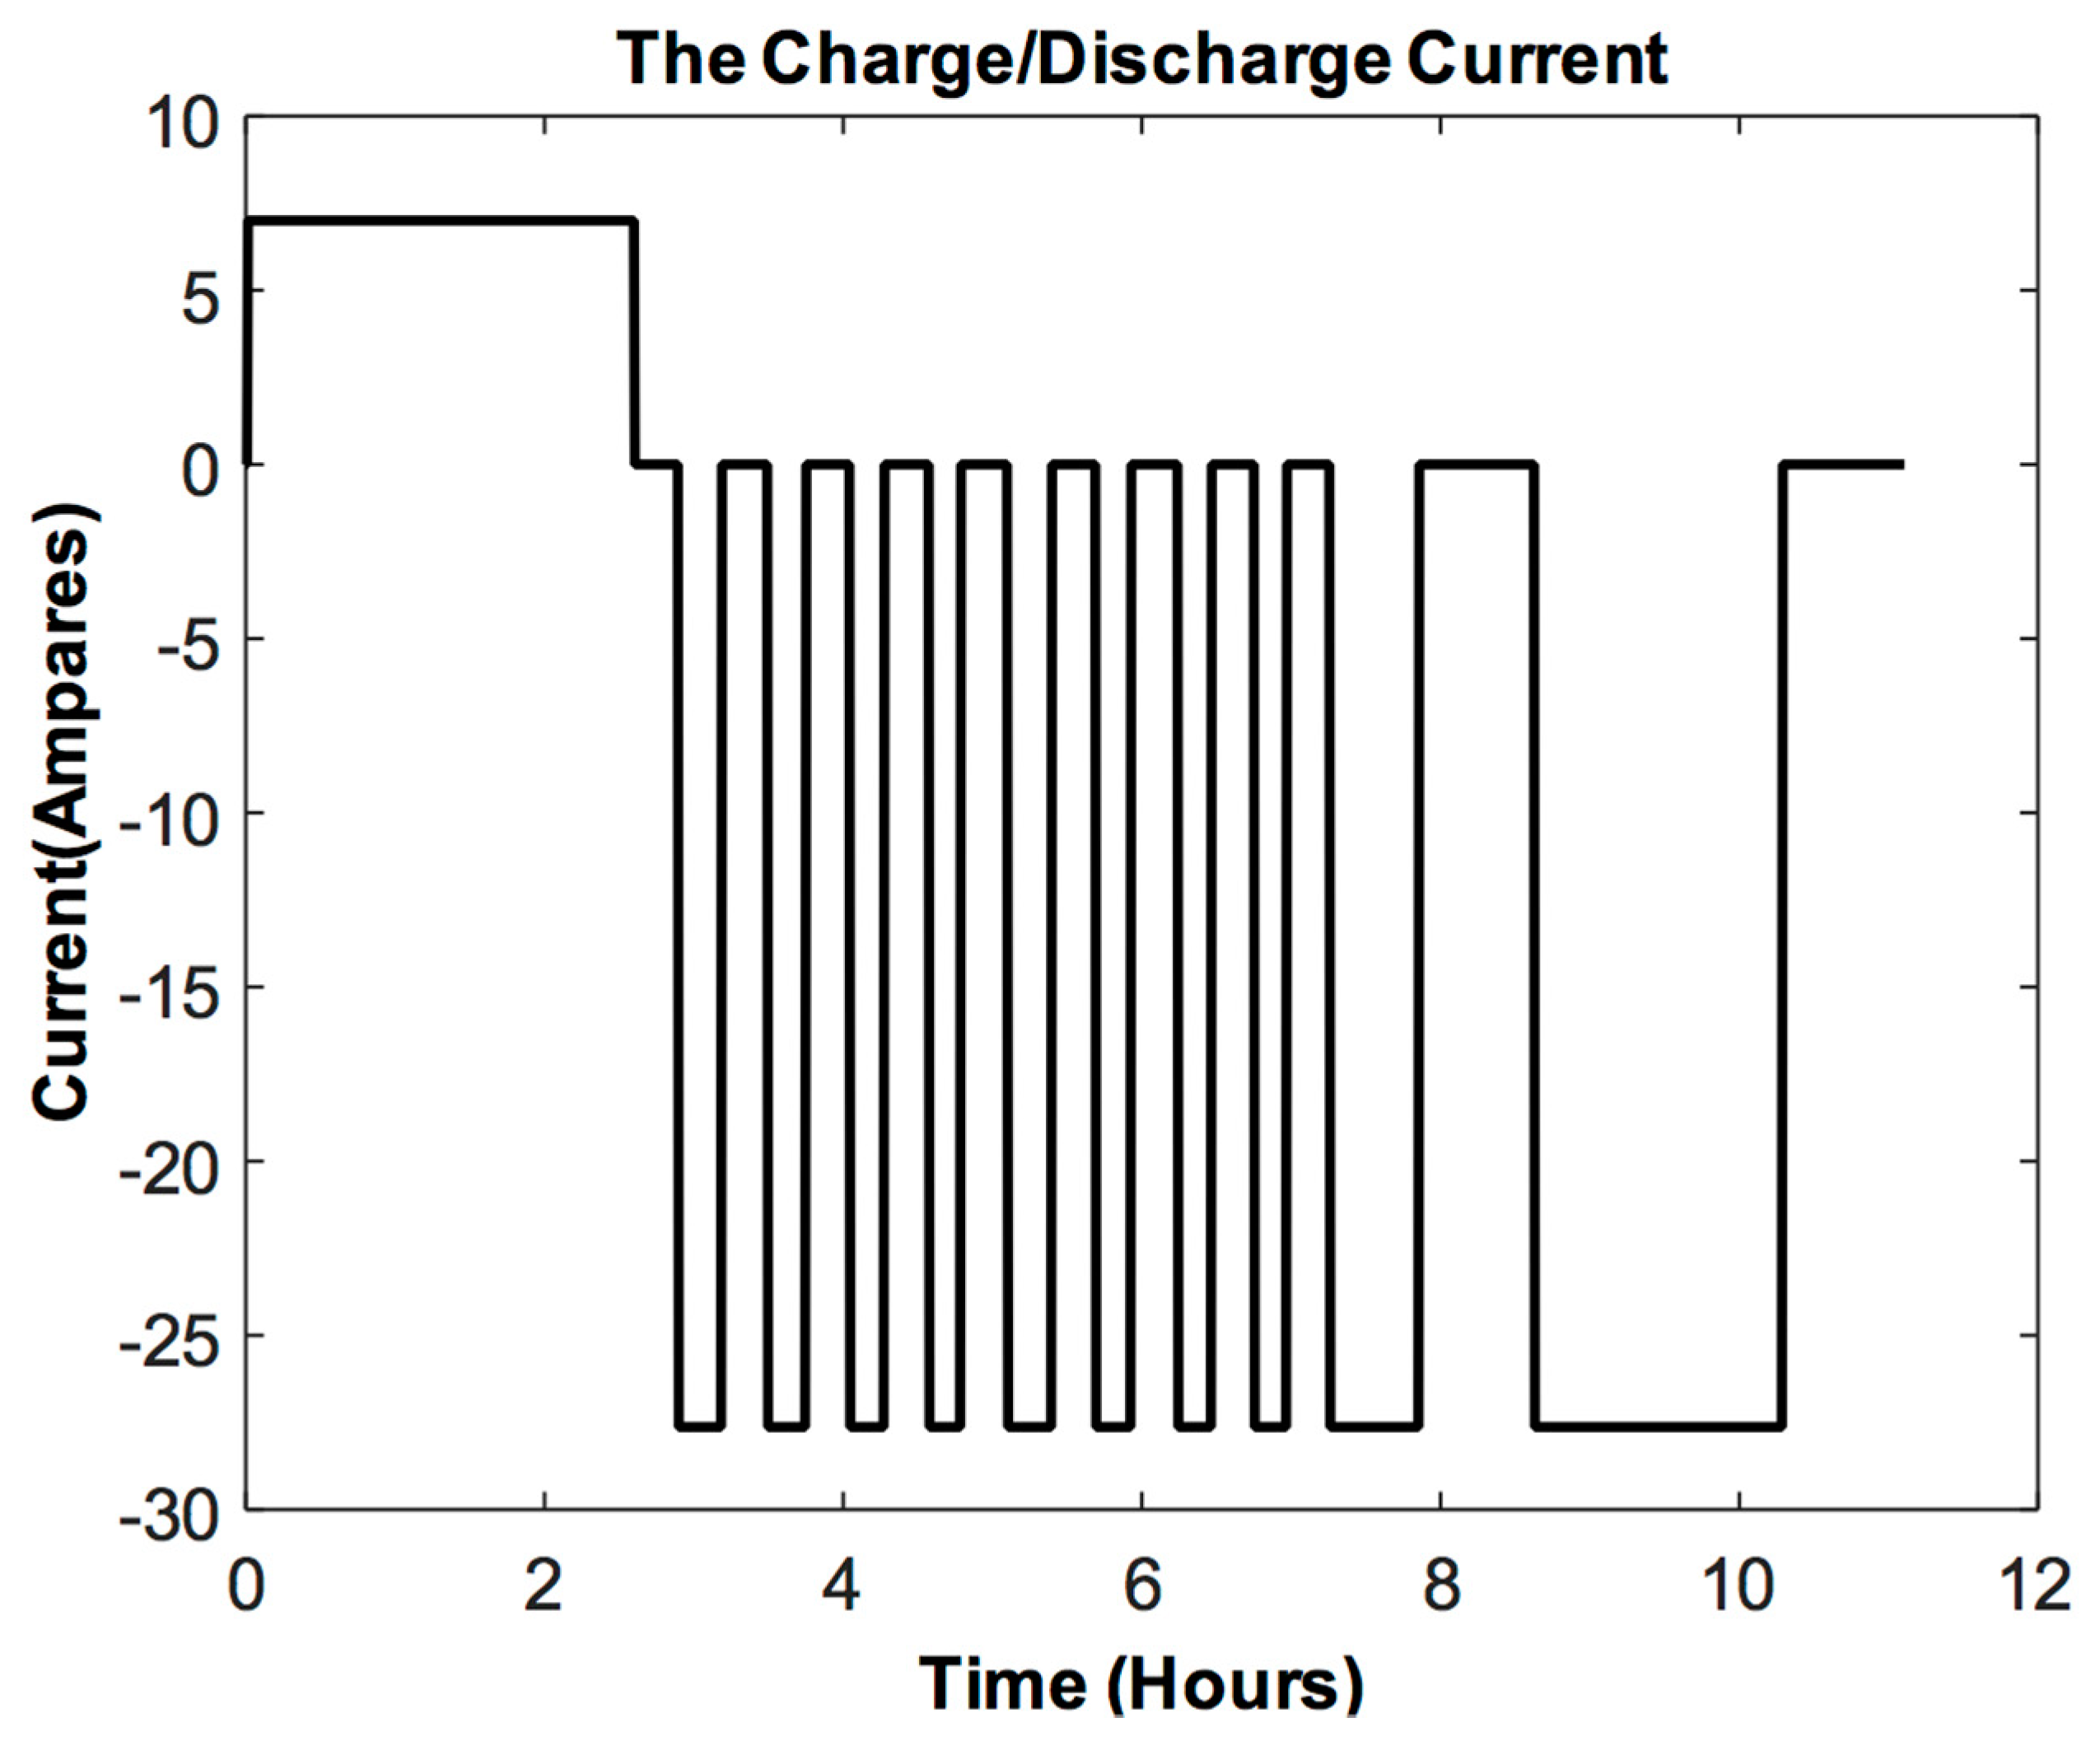
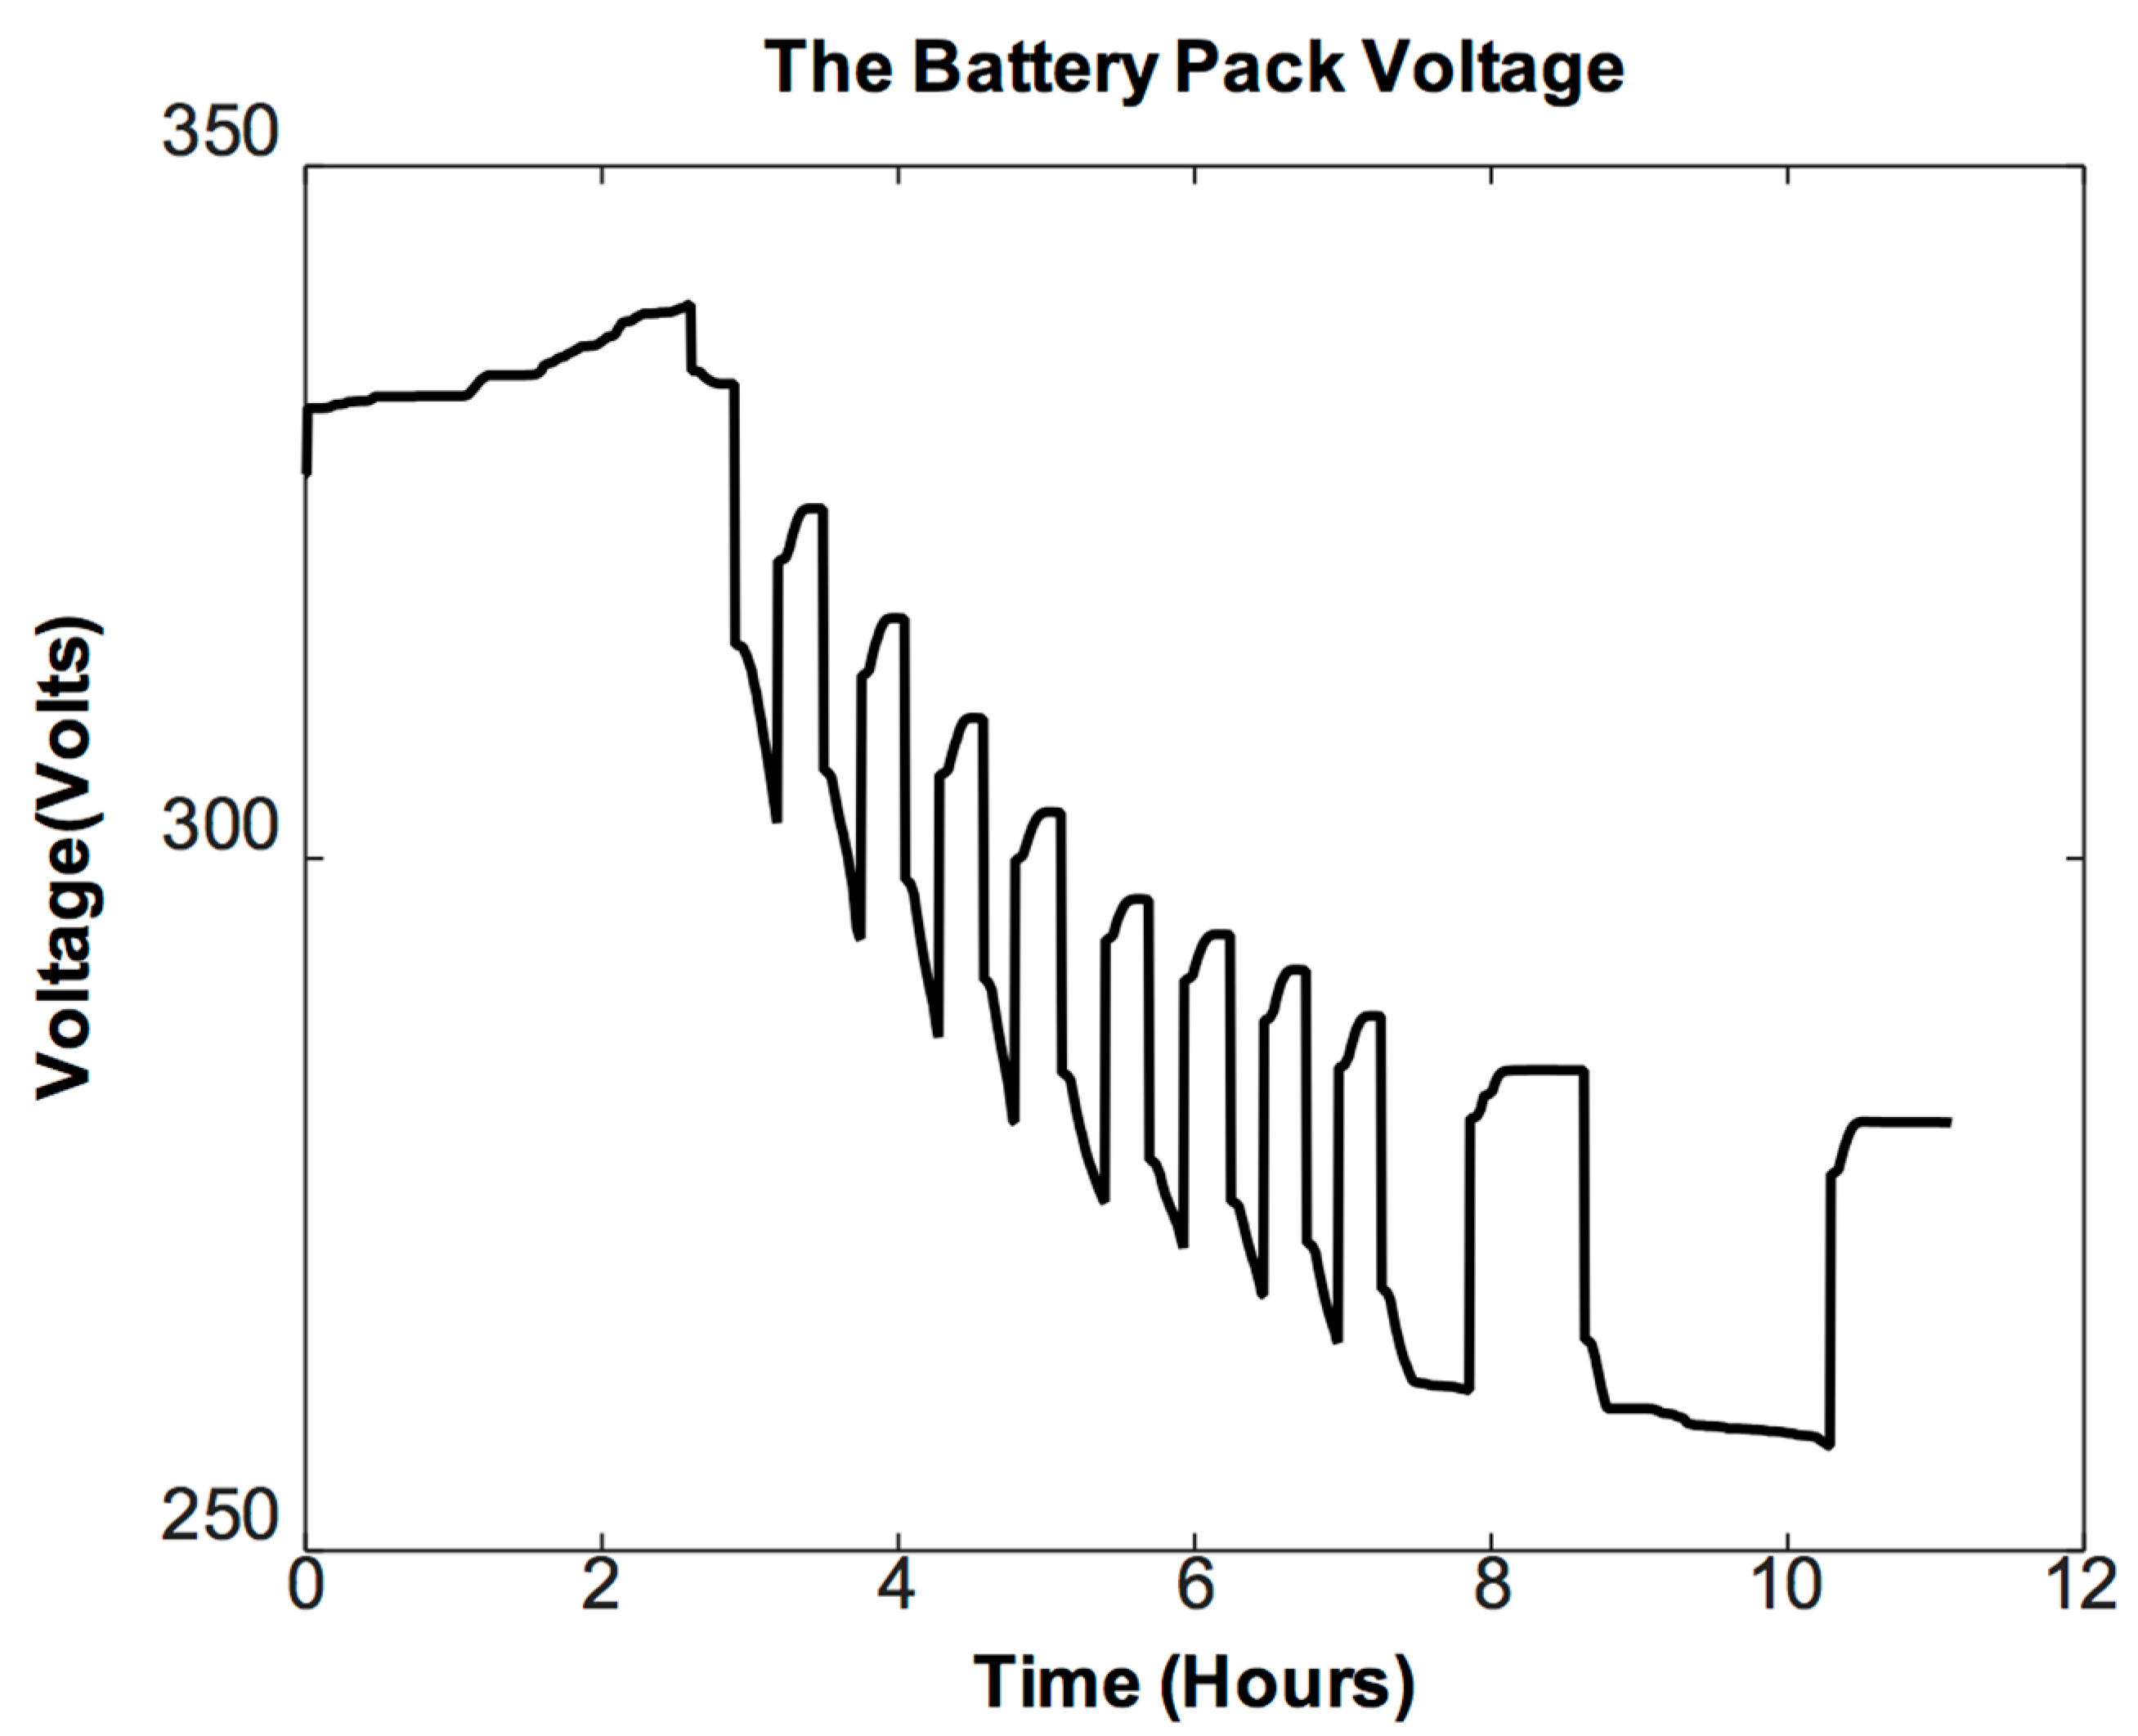
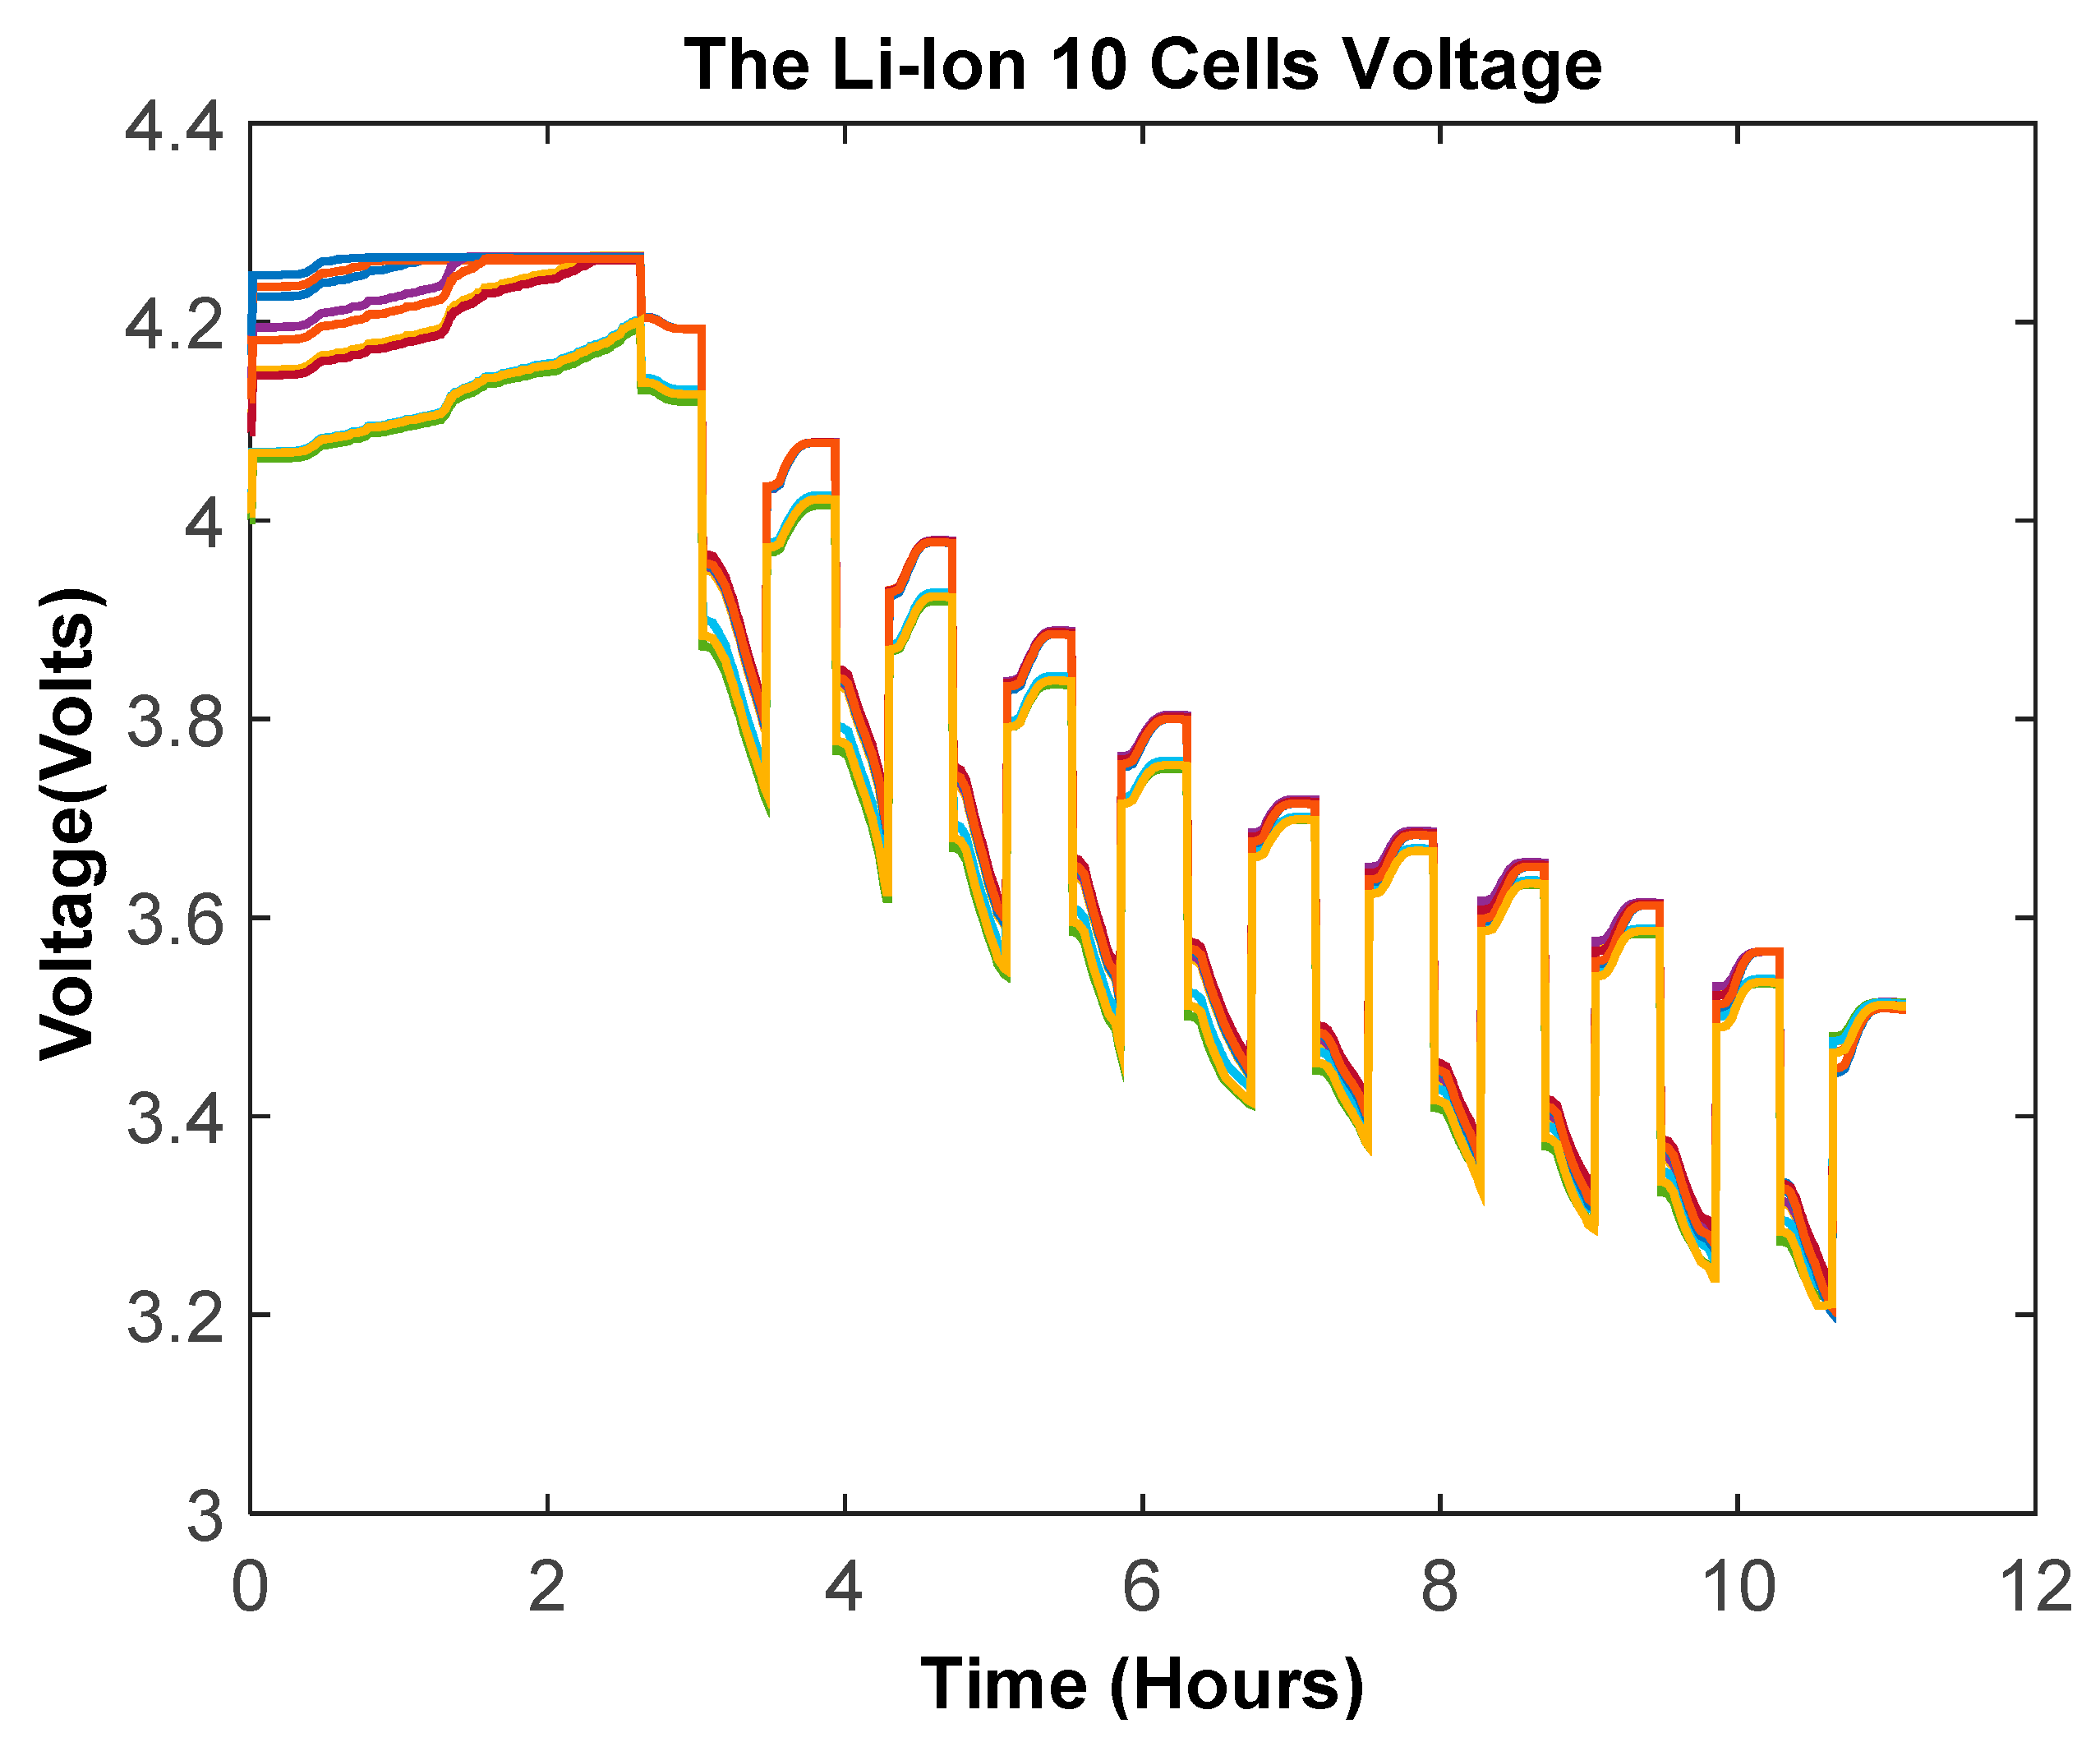
A time-domain approach is used for the SOC prediction error calculation, which is made by the proposed solution. In this scenario, an accurate fixed-rate SOC estimator based on coulomb counting is used as a benchmark. It uses 16-bit resolution ADCs for acquiring the Li-ion cell voltages and currents at a sampling rate of ≥1 kHz. This choice of parameters achieves reasonably high SOC estimation precision [12]. The nth SOC values predicted respectively by the devised, and the reference estimators are S O C E D n and S O C n . Then, Equation (25) can be used to compute the mean percentage SOC prediction error (MPSOCE).
M P S O C E = [ 1 N E D C u r r e n t n = 1 N E D c u r r e n t | S O C n S O C E D n S O C n | ] × 100 %

3. Results

A Li-ion battery pack model, consisting of 80 (LiNixMnyCozO2)-(NMC) chemistry-based cells, was used [27]. An impulsive charge/discharge current profile was used for the considered battery pack. This choice was made in compliance with the load profiles of electric vehicles [42]. In the beginning, a charge current was applied to mitigate any SOC loss due to internal losses and cell aging [30,43]. An impulsive profiled discharge current was then applied to progressively discharge the battery pack [20] (cf. Figure 8). Figure 9 shows the corresponding battery output voltage.
The battery cells were connected in series; therefore, similar charge/discharge current flowed through all of them. However, voltages across cells could be specific depending on their temperature and SOC [18,43]. The voltage curves of the first 10-cell pack are shown in Figure 10. These voltage curves can also be employed for the cell balancing of the battery pack [18,43]. However, in this study, these voltage curves are used for monitoring the SOC of each cell.
Figure 8 and Figure 9 indicate that the charge/discharge current and the related cell voltages are observed for a period of 11.11 h. This choice of duration was made depending on the used current profile and the battery pack to obtain a complete discharge of a fully charged battery pack.
The current was acquired by employing a 5-bit resolution EDADC. It was composed of 32 discriminators and a 5-bit output priority encoder-based encoding logic [44]. The amplitude dynamics of the current-acquiring EDADC was chosen between (−28.1; 7.6) amperes. Therefore, a fixed value quantum, q = 1.12 ampere, was obtained. The output of the EDADC is shown in Figure 11. The EDADC gathers 700 current samples for the considered observation time of 11.11 h.
The reference SOC-OCV values are contained in the lookup table. These were recorded through precise experimentation. In this case, each vector, SOC-V and OCV-V, consisted of seven elements, as presented in Table 1. The employed elements of SOC-V and OCV-V were spaced with a bias toward the minimum and maximum SOC values [18]. This allowed for tracking of the extreme SOC states of the intended battery cells with a superior resolution and could lead to effective safety decisions [12].
In compliance with the SOC-OCV lookup table, the voltage of each cell was sampled with a non-uniform EDADC, resulting in a varying quantum as a function of the used OCV-V. The process is presented in Section 2.3 using 2.8-bit resolution EDADCs. Each EDADC is composed of seven discriminators and a 3-bit priority encoder based output logic [39]. The EDADC output for cell-8 of the battery pack is shown in Figure 12. In this case, 73 voltage samples are acquired for the considered time period of 11.11 h.
The voltage samples recorded by EDADCs were analyzed for each cell, resulting in the minimum and maximum count of collected samples of 71 and 74, respectively, with an average and standard deviation of 72.61 and 1.037, respectively.
The SOC of each cell in the battery pack was estimated and calibrated using the acquired current and voltage signals. The SOC estimation was made by accumulating the acquired samples of battery current and then estimating DOD and finally SOC. The SOC of each cell was then calibrated by using the suggested event-driven calibration process. In this context, each acquired cell voltage sample was fitted by using a 3rd order polynomial. Values of used polynomial coefficients were a 3 = 0.1955 , a 2 = 2.249 , a 1 = 7.556 and a 0 = 10.77 . The selection of used polynomial order was made in an incremental fashion in order to achieve an optimal compromise among system precision and complexity. The effectiveness of fitting was measured in terms of SSE and R-squared by using Equations (21) and (24). The designed curve-fitting approach attained SSE = 0.002299 and R-squared = 0.997.
The system’s effectiveness was contrasted with the traditional coulomb counting approach. By pursuing the work described in [45], the current and voltage of each cell were recorded with 12-bit resolution conventional ADCs for the classical fixed-rate approach. It promised a proper SOC estimation while intended battery parameters were acquired at an appropriate rate [8,45], and F s I = 10 Hz was used [45]. For the calibration purpose, the voltage was acquired at the rate of F s V = 16.66 MHz, meaning a sample was acquired every minute [16].
For F s I = 10 Hz and F s V = 16.66 MHz, cell voltages and current measurement time span of 11.11 h respectively resulted in N = 400 k-samples for the current and M = 667 samples for each cell voltage. However, in the suggested method, the total count of sampled data points was inferior, with N E D - C u r r e n t = 700 for the current and N E D - V o l t a g e = 72.61 on average for intended cell voltages. For the considered battery pack, R C o m p I and R C o m p V were respectively computed by using Equations (15) and (16), resulting in R C o m p I = 571.43-fold for the whole battery pack. The R C o m p V was also calculated for each cell in the intended battery pack, resulting in minimum and maximum values of R C o m p V of 9.01-fold and 9.39-fold, respectively. With a standard deviation of 0.13, the average R C o m p V for all intended cells in the battery pack was 9.19-fold. For the whole battery pack, the cumulative value of R C o m p V was 735.01-fold. The results illustrated a dramatic real-time compression advantage and a decrease in the number of gathered samples relative to the standard equivalents. It confirmed the suggested solution’s decreased circuit-level activity and power consumption overhead relative to the traditional fixed-rate equivalents.
By using Equations (19) and (20), the computational advantage of the designed solution over the standard equivalent was also determined. For the studied battery pack, unique current flows through all serially connected cells. However, the voltage across each cell can be specific as a function of its temperature and SOC [43]. Therefore, the acquired count of current samples was fixed for the whole battery pack. The acquired number of voltage samples N E D - V o l t a g e can also be specific for each intended cell. The computational gains were calculated in terms of a reduction in the count of operations, such as additions, subtractions, multiplications, divisions and comparisons. Gains in subtractions and divisions are uniquely based on the count of current samples. Therefore, they remained fixed for the studied case and were equal to 571.43-fold. Gains in additions, multiplications and comparisons involve the count of voltage samples. Therefore, they can be specific for each cell. A summary of gains in additions, multiplications and comparisons is presented in Table 2, where STD stands for the standard deviation.
Table 2 shows that the proposed system secures the lowest and the highest gains in additions of 436.01-fold and 440.31-fold. The average gain of additions for all cells is 437.99-fold, with a standard deviation (STD) of 1.49. The overall reduction in the count of additions for the whole battery pack is 35.03 × 10³-fold. The lowest and the highest gains in multiplications of the proposed system are respectively 4.13-fold and 4.21-fold. The mean gain of multiplications for all cells is 4.17-fold, with a standard deviation (STD) of 0.03. The overall reduction in the count of multiplications for the whole battery pack is 333.28-fold. The minimum and the maximum gains in comparisons of the proposed system are respectively 9.01-fold and 9.39-fold. The average gain of comparisons for all cells is 9.19-fold, with a standard deviation (STD) of 0.13. The overall reduction in the count of comparisons for the whole battery pack is 735.01-fold.
Compared with the classical one, the above findings indicate a major compression gain and enhanced processing performance of the suggested solution. It is accomplished by using event-driven sensing and processing, along with an effective positioning of application-dependent voltage reference thresholds. It enables only appropriate information to be collected and, therefore, results in a significant decrease in the acquired samples and, thus, a notable reduction in the complexity of the processing.
The SOC estimation error of the suggested approach is determined by following the process described in Section 2.4. In this study, the reference SOC estimator is based on 16-bit resolution ADCs. F s I = 1 kHz and F s V = 1 Hz are selected. Examples of the SOC curves obtained for cell-8 are displayed in Figure 13.
The MPSOCE is calculated for cell-8 as 2.4% for the classical estimator and 3.8% MPSOCE for the proposed estimator. The MPSOCEs are calculated for each cell of the employed battery pack and results are summarized in Table 3.
Table 3 shows that the classical case results in the minimum and maximum MPSOCE values for the considered 80 cells, which are 2.3% and 2.8%, respectively. The average MPSOCE for all cells is 2.51%, with a standard deviation (STD) of 0.21. For the proposed event-driven system, the MPSOCE calculations result in the minimum and maximum MPSOCE values for the considered 80 cells, which are 3.6% and 4.0%, respectively. The average MPSOCE for all cells is 3.77%, with a standard deviation (STD) of 0.17.

4. Discussion

The results, as discussed in Section 3, show the favorable features of the proposed solution. These results indicate a substantial compression gain and processing effectiveness of the suggested solution compared to the traditional technique. The event-driven acquisition and the non-uniform positioning of reference thresholds are the main factors behind this accomplishment [12,13]. It allows an intelligent adaptive-rate acquisition of the concerned information. Thus, the count of collected samples is reduced, and it renders a notable reduction in the computational load of the suggested solution. The overall compression gains of R C o m p I = 571.43-fold and R C o m p V = 735.01-fold are obtained for the whole battery pack. The overall computational gains of 35.03 × 10³-fold, 333.28-fold, 571.43-fold, 735.01-fold and 571.43-fold are secured respectively in terms of additions, multiplications, subtractions, comparisons and divisions. Besides these benefits, such a method can compromise the accuracy of the SOC calculation. In this context, for each cell, the SOC approximation errors of the proposed solution and the traditional equivalent are computed. The SOC prediction errors for the analyzed case are limited by 2.8% and 4%, respectively, for the classical sampling-based approach and the suggested event-driven approach. It implies that in addition to attaining more than a second order of magnitude gain compared to the over the counter classical solution in terms of data compression and computational cost, the precession of the suggested solution’s SOC approximation is indeed analogous to the classical estimator. In addition, the EDADCs used in the proposed solution have significantly lower resolutions of 5-bit and 2.8-bit for the acquisition of the cell currents and voltages, respectively. In the standard case, however, 12-bit resolution ADCs are used to obtain the battery cells currents and voltages. Compared to the conventional equivalents, it guarantees a dramatic reduction in the hardware complexity, cost and power usage overhead of the devised system.
For the studied case, the state of charge estimation error of the suggested method is bounded by 4%. The integration of model-based or data-driven SOC estimation algorithms could improve the proposed system precision at an increased computational and implementation complexity. The system parameters, such as the resolution of EDADCs and the choice between uniform and logarithmic quantization schemes and online fitting methods, should be effectively adjusted in this framework in order to attain the best compromise between the system precision and computational cost.
A lower sampling rate and resolution can also be used in the conventional counterparts. However, it will result in a higher quantization step and will decrease the system SNR because the SNR is inversely proportional to the used quantization step in the case of conventional ADCs [21]. On the other hand, the SNR of EDADCs is not influenced by the quantum value and is a function of the used timer circuit [21]. This is the reason that the suggested method attains an analogous SOC estimation accuracy even by using low-resolution EDADCs.
The realization of event-driven processing based BMSs is an original and novel concept [12,16,17]. Comparing the proposed strategy with state-of-the-art tactics is not obvious because they are developed on the principle of standard-fixed rate data acquisition and processing based concepts. Moreover, these techniques employ a variety of battery models or datasets with various preprocessing and SOC estimation methods. In addition to all mentioned factors, a comparison is made with the conventional fixed-rate processing based counter SOC estimators [31,32,33,34,35,36,37], and the upper bounds on the percentage of SOC estimation errors are summarized in Table 4.
Table 4 confirms that the devised method secures an analogous or better SOC estimation precision as compared to fixed-rate counterparts [31,32,33,34,35,36,37], while assuring a noticeable reduction in the count of acquired samples, computational complexity, hardware complexity and the power consumption overhead. Similar gains can be achieved by integrating the suggested solution into other state-of-the-art solutions [31,32,33,34,35,36,37].

5. Conclusions

A novel and effective event-driven coulomb counting based online state of charge estimator was devised in this work. The system was developed on the theory of data processing driven by events. In this sense, original methods for the acquisition of battery cells current and voltages were suggested. The suggested acquisition of data based on events offered the possibility to focus on the relevant information. Thus, an interesting association was developed between the incoming signal information content and the computational load of the proposed system. Based on the event-driven nature, the system could organize its processing load in compliance with the time-varying incoming signal.
The system obtained overall compression gains of 571.43-fold and 735.01-fold in current and voltage sample counts, respectively, demonstrating its computational efficacy. More than a second order of magnitude gain over the traditional counterpart was obtained by the suggested scheme. The method reached an upper limit of 4% on the state of charge estimation error. The proposed method is thus equivalent to current state-of-the-art approaches and, in some cases, superior. The main advantage is the gain in compression, computational effectiveness and hardware simplicity, along with notable cost-effectiveness, size compactness and power consumption overhead reduction. This ensures the value of incorporating the proposed approach within modern battery management systems.
Future work should concentrate on the analysis of the proposed method’s performance for other battery technologies and models. Investigating the feasibility of using the suggested solution for cell balancing is another prospect. The proposed system is designed for an online state of charge estimation. Its embedded realization and integration in state-of-the-art battery management systems is another axis to explore.

Funding

The project was funded by the Effat University under the grant number UC#9/29 April.2020/7.1-22 (2)4.

Acknowledgments

The author is thankful to anonymous reviewers for their valuable feedback.

Conflicts of Interest

The author declares no conflict of interest.

Ethical Approval

This article does not contain any studies with human participants or animals performed by the author.

References

  1. Nykvist, B.; Nilsson, M. Rapidly falling costs of battery packs for electric vehicles. Nat. Clim. Chang. 2015, 5, 329–332. [Google Scholar] [CrossRef]
  2. Li, M.; Lu, J.; Chen, Z.; Amine, K. 30 years of lithium-ion batteries. Adv. Mater. 2018, 30, 1800561. [Google Scholar] [CrossRef] [Green Version]
  3. Heubaum, H.; Biermann, F. Integrating global energy and climate governance: The changing role of the International Energy Agency. Energy Policy 2015, 87, 229–239. [Google Scholar] [CrossRef]
  4. Attia, P.M.; Grover, A.; Jin, N.; Severson, K.A.; Markov, T.M.; Liao, Y.-H.; Chen, M.H.; Cheong, B.; Perkins, N.; Yang, Z. Closed-loop optimization of fast-charging protocols for batteries with machine learning. Nature 2020, 578, 397–402. [Google Scholar] [CrossRef] [Green Version]
  5. Xiong, R.; Li, L.; Tian, J. Towards a smarter battery management system: A critical review on battery state of health monitoring methods. J. Power Sources 2018, 405, 18–29. [Google Scholar] [CrossRef]
  6. Qaisar, S.M. Efficient mobile systems based on adaptive rate signal processing. Comput. Electr. Eng. 2019, 79, 106462. [Google Scholar] [CrossRef]
  7. Seh, Z.W.; Sun, Y.; Zhang, Q.; Cui, Y. Designing high-energy lithium–sulfur batteries. Chem. Soc. Rev. 2016, 45, 5605–5634. [Google Scholar] [CrossRef]
  8. Dendouga, A. Conventional and Second Order Sliding Mode Control of Permanent Magnet Synchronous Motor Fed by Direct Matrix Converter: Comparative Study. Energies 2020, 13, 5093. [Google Scholar] [CrossRef]
  9. Ali, M.U.; Zafar, A.; Nengroo, S.H.; Hussain, S.; Junaid Alvi, M.; Kim, H.-J. Towards a smarter battery management system for electric vehicle applications: A critical review of lithium-ion battery state of charge estimation. Energies 2019, 12, 446. [Google Scholar] [CrossRef] [Green Version]
  10. Roscher, M.A.; Assfalg, J.; Bohlen, O.S. Detection of utilizable capacity deterioration in battery systems. IEEE Trans. Veh. Technol. 2010, 60, 98–103. [Google Scholar] [CrossRef]
  11. Hannan, M.A.; Lipu, M.H.; Hussain, A.; Mohamed, A. A review of lithium-ion battery state of charge estimation and management system in electric vehicle applications: Challenges and recommendations. Renew. Sustain. Energy Rev. 2017, 78, 834–854. [Google Scholar] [CrossRef]
  12. Qaisar, S. Electronic Management System for Rechargeable Battery has Measuring Circuit Measuring Parameter Determining Variation of Parameter Transmitting Data to Electronic Processing Unit if Variation is Higher than Predetermined Threshold. France Patent FR2959066A1, 2011. Available online: https://worldwide.espacenet.com/patent/search/family/042763477/publication/FR2959066A1?q=pn%3DFR2959066A1 (accessed on 25 October 2020).
  13. Zou, Z.; Xu, J.; Mi, C.; Cao, B.; Chen, Z. Evaluation of model based state of charge estimation methods for lithium-ion batteries. Energies 2014, 7, 5065–5082. [Google Scholar] [CrossRef] [Green Version]
  14. Ng, M.-F.; Zhao, J.; Yan, Q.; Conduit, G.J.; Seh, Z.W. Predicting the state of charge and health of batteries using data-driven machine learning. Nat. Mach. Intell. 2020, 2, 161–170. [Google Scholar] [CrossRef] [Green Version]
  15. Severson, K.A.; Attia, P.M.; Jin, N.; Perkins, N.; Jiang, B.; Yang, Z.; Chen, M.H.; Aykol, M.; Herring, P.K.; Fraggedakis, D. Data-driven prediction of battery cycle life before capacity degradation. Nat. Energy 2019, 4, 383–391. [Google Scholar] [CrossRef] [Green Version]
  16. Qaisar, S.M. A Proficient Li-Ion Battery State of Charge Estimation Based on Event-Driven Processing. J. Electr. Eng. Technol. 2020, 15, 1871–1877. [Google Scholar] [CrossRef]
  17. Qaisar, S.M.; Alshaiban, A. An Event Driven Approach for the Power Systems Energy Storage Monitoring. In Proceedings of the 2019 IEEE International Conference on Environment and Electrical Engineering and 2019 IEEE Industrial and Commercial Power Systems Europe (EEEIC/I&CPS Europe), Genova, Italy, 10–14 June 2019; pp. 1–4. [Google Scholar]
  18. Huria, T.; Ceraolo, M.; Gazzarri, J.; Jackey, R. High fidelity electrical model with thermal dependence for characterization and simulation of high power lithium battery cells. In Proceedings of the 2012 IEEE International Electric Vehicle Conference, Greenville, SC, USA, 4–8 March 2012; pp. 1–8. [Google Scholar]
  19. Yang, D.; Wang, Y.; Pan, R.; Chen, R.; Chen, Z. State-of-health estimation for the lithium-ion battery based on support vector regression. Appl. Energy 2018, 227, 273–283. [Google Scholar] [CrossRef]
  20. Wang, W.; Wang, D.; Wang, X.; Li, T.; Ahmed, R.; Habibi, S.; Emadi, A. Comparison of Kalman Filter-based state of charge estimation strategies for Li-Ion batteries. In Proceedings of the 2016 IEEE Transportation Electrification Conference and Expo (ITEC), Dearborn, MI, USA, 27–29 June 2016; pp. 1–6. [Google Scholar]
  21. Mian Qaisar, S. Échantillonnage et traitement conditionnés par le signal: Une approche prometteuse pour des traitements efficaces à pas adaptatifs. Ph.D. Thesis, Grenoble INPG, Grenoble, France, 2009. [Google Scholar]
  22. Qaisar, S.M.; AlQathami, M. Level-Crossing Sampling for Li-Ion Batteries Effective State of Health Estimation. In Proceedings of the 2020 19th International Conference on Harmonics and Quality of Power (ICHQP), Dubai, UAE, 22–25 March 2020; pp. 1–4. [Google Scholar]
  23. Zhang, R.; Xia, B.; Li, B.; Cao, L.; Lai, Y.; Zheng, W.; Wang, H.; Wang, W.; Wang, M. A study on the open circuit voltage and state of charge characterization of high capacity lithium-ion battery under different temperature. Energies 2018, 11, 2408. [Google Scholar] [CrossRef] [Green Version]
  24. Barillas, J.K.; Li, J.; Günther, C.; Danzer, M.A. A comparative study and validation of state estimation algorithms for Li-ion batteries in battery management systems. Appl. Energy 2015, 155, 455–462. [Google Scholar] [CrossRef]
  25. Miao, Z.; Xu, L.; Disfani, V.R.; Fan, L. An SOC-based battery management system for microgrids. IEEE Trans. Smart Grid 2013, 5, 966–973. [Google Scholar] [CrossRef]
  26. Weng, C.; Feng, X.; Sun, J.; Peng, H. State-of-health monitoring of lithium-ion battery modules and packs via incremental capacity peak tracking. Appl. Energy 2016, 180, 360–368. [Google Scholar] [CrossRef] [Green Version]
  27. Phillip, N.D.; Westover, A.S.; Daniel, C.; Veith, G.M. Structural Degradation of High Voltage Lithium Nickel Manganese Cobalt Oxide (NMC) Cathodes in Solid-State Batteries and Implications for Next Generation Energy Storage. ACS Appl. Energy Mater. 2020, 3, 1768–1774. [Google Scholar] [CrossRef]
  28. Esfandiari, R.S.; Lu, B. Modeling and Analysis of Dynamic Systems; CRC Press: Boca Raton, FL, USA, 2018; ISBN 1-351-75164-6. [Google Scholar]
  29. Hahn, B.; Valentine, D. Essential MATLAB for Engineers and Scientists; Academic Press: Cambridge, MA, USA, 2016; ISBN 0-12-805271-6. [Google Scholar]
  30. Warner, J.T. The Handbook of Lithium-Ion Battery Pack Design: Chemistry, Components, Types and Terminology; Elsevier: Amsterdam, The Netherlands, 2015; ISBN 0-12-801668-X. [Google Scholar]
  31. Zhang, Y.; Song, W.; Lin, S.; Feng, Z. A novel model of the initial state of charge estimation for LiFePO4 batteries. J. Power Sources 2014, 248, 1028–1033. [Google Scholar] [CrossRef]
  32. He, H.; Zhang, X.; Xiong, R.; Xu, Y.; Guo, H. Online model-based estimation of state-of-charge and open-circuit voltage of lithium-ion batteries in electric vehicles. Energy 2012, 39, 310–318. [Google Scholar] [CrossRef]
  33. Tian, Y.; Xia, B.; Sun, W.; Xu, Z.; Zheng, W. A modified model based state of charge estimation of power lithium-ion batteries using unscented Kalman filter. J. Power Sources 2014, 270, 619–626. [Google Scholar] [CrossRef]
  34. Bi, Y.; Choe, S.-Y. An adaptive sigma-point Kalman filter with state equality constraints for online state-of-charge estimation of a Li (NiMnCo) O2/Carbon battery using a reduced-order electrochemical model. Appl. Energy 2020, 258, 113925. [Google Scholar] [CrossRef]
  35. Wang, L.; Lu, D.; Liu, Q.; Liu, L.; Zhao, X. State of charge estimation for LiFePO4 battery via dual extended kalman filter and charging voltage curve. Electrochim. Acta 2019, 296, 1009–1017. [Google Scholar] [CrossRef]
  36. Hu, X.; Jiang, H.; Feng, F.; Liu, B. An enhanced multi-state estimation hierarchy for advanced lithium-ion battery management. Appl. Energy 2020, 257, 114019. [Google Scholar] [CrossRef]
  37. Ning, B.; Cao, B.; Wang, B.; Zou, Z. Adaptive sliding mode observers for lithium-ion battery state estimation based on parameters identified online. Energy 2018, 153, 732–742. [Google Scholar] [CrossRef]
  38. How, D.N.T.; Hannan, M.A.; Lipu, M.S.H.; Ker, P.J. State of Charge Estimation for Lithium-Ion Batteries Using Model-Based and Data-Driven Methods: A Review. IEEE Access 2019, 7, 136116–136136. [Google Scholar] [CrossRef]
  39. Meher, P.K.; Stouraitis, T. Arithmetic Circuits for DSP Applications; John Wiley & Sons: New York, NY, USA, 2017; ISBN 1-119-20677-4. [Google Scholar]
  40. Baccouche, I.; Jemmali, S.; Manai, B.; Omar, N.; Amara, N.E.B. Improved OCV model of a Li-ion NMC battery for online SOC estimation using the extended Kalman filter. Energies 2017, 10, 764. [Google Scholar] [CrossRef] [Green Version]
  41. Lei, H.; Han, Y.Y. The measurement and analysis for Open Circuit Voltage of Lithium-ion Battery. J. Phys. Conf. Ser. 2019, 1325, 012173. [Google Scholar] [CrossRef]
  42. Wu, K.; Niu, X.; Wang, J.; Wu, K.; Jia, S. Electric Vehicle Load Characteristic Analysis and Impact of Regional Power Grid. In Proceedings of the 2nd International Conference on Electronic & Mechanical Engineering and Information Technology, Shenyang, China, 7 September 2012. [Google Scholar]
  43. Bø, T.I.; Johansen, T.A. Battery power smoothing control in a marine electric power plant using nonlinear model predictive control. IEEE Trans. Control Syst. Technol. 2016, 25, 1449–1456. [Google Scholar] [CrossRef] [Green Version]
  44. Ndjountche, T. Data Converters, Phase-Locked Loops, and Their Applications; CRC Press: Boca Raton, FL, USA, 2018; ISBN 0-429-93904-3. [Google Scholar]
  45. Gu, P.; Zhou, Z.; Qu, S.; Zhang, C.; Duan, B. Influence Analysis and Optimization of Sampling Frequency on the Accuracy of Model and State-of-Charge Estimation for LiNCM Battery. Energies 2019, 12, 1205. [Google Scholar] [CrossRef] [Green Version]
Figure 1. The system block diagram.
Energies 13 05600 g001
Figure 2. Block diagram of the cell model.
Energies 13 05600 g002
Figure 3. The 10 cell battery pack.
Energies 13 05600 g003
Figure 4. The 80 cell battery pack.
Energies 13 05600 g004
Figure 5. The event-driven sampling (EDS) process.
Energies 13 05600 g005
Figure 6. The block diagram of event-driven coulomb counting based method.
Energies 13 05600 g006
Figure 7. The principle of Vb(t) acquisition.
Energies 13 05600 g007
Figure 8. The battery pack charge/discharge current.
Energies 13 05600 g008
Figure 9. The battery pack voltage.
Energies 13 05600 g009
Figure 10. The voltages of the 10 cell pack.
Energies 13 05600 g010
Figure 11. The current, acquired with 5-bit resolution uniform EDADC.
Energies 13 05600 g011
Figure 12. The cell-8 voltage acquired with non-uniform EDADC.
Energies 13 05600 g012
Figure 13. The cell-8 SOC curves.
Energies 13 05600 g013
Table 1. The reference SOC-OCV calibration values.
SOC-VSOC1SOC2SOC3SOC4SOC5SOC6SOC7
(%)10090755025100
OCV-VOCV1OCV2OCV3OCV4OCV5OCV6OCV7
Volts (V)4.20 4.103.903.703.603.503.45
Table 2. The summary of the proposed system computational gains.
OperationMinimum GainMaximum GainAverage GainSTDTotal Gain
Additions436.01440.31437.991.4935.04 × 103
Multiplications4.134.214.170.03333.28
Comparisons9.019.399.190.13735.01
Table 3. The summary of MPSOCEs.
SolutionMinimumMaximumAverageSTD
Classical2.3%2.8%2.51%0.21
Event-Driven3.6%4.0%3.77%0.17
Table 4. Comparison with contemporary techniques.
StudySOC Estimation MethodUpper Bound on Error
[31]Coulomb counting≤4%
[32]Recursive least squares algorithm≤5%
[33]Unscented Kalman filter≤4%
[34]Adaptive sigma-point Kalman filter and state equality constraints≤2%
[35]Dual extended Kalman filtering≤3%
[36]Modified moving horizon estimation≤3%
[37]Adaptive sliding mode observer≤2%
Proposed solutionEvent-driven coulomb counting≤4%
Publisher’s Note: MDPI stays neutral with regard to jurisdictional claims in published maps and institutional affiliations.

