Abstract
The residential, commercial, and public sectors consume between 20% and 30% of final energy demand worldwide. Due to the intensive use of fossil fuels and conventional electricity, they also have an important participation in the emission of greenhouse gases (GHG). Taking Mexico as a case study, this article develops an alternative scenario that considers that in these sectors, buildings can generate energy for self-consumption or to supply it to the power network—for which four solar energy options are analyzed. In addition, to manage and rationalize the energy demand of these buildings, eight energy efficiency measures are studied. These options were selected on the basis that they are technically and economically feasible to implement in buildings in Mexico. The results reveal that by 2030, in relation to the GHG trend scenario, this mitigation scenario reduces 23.5 million tons of carbon dioxide equivalent (MtCO2e) in the residential (19 MtCO2e), commercial (2.6 MtCO2e), and public services sectors (1.9 MtCO2e), while by 2035 it reaches 45 MtCO2e; which far exceed the avoided emissions goals established in Mexico’s nationally determined contributions (NDC) for 2030 (5 MtCO2e) for the residential and commercial sectors. Therefore, it is possible to increase the ambition for mitigation in these sectors, as well as including the public sector, in a renewed Mexico’s NDC. This mitigation scenario generates a total economic benefit of $7.7 billion, which means that it does not generate an overall incremental cost, but requires an incremental investment of over $9 billion USD, which is a financing challenge to achieve this scenario.
1. Introduction
This article considers that a building can generate energy for self-consumption or to supply it to the power network, through options that reduce greenhouse gas (GHG) emissions from conventional systems. For example, by installing an interconnected photovoltaic system (IPVS) on a building roof, it is possible to avoid a certain amount of the electricity that is supplied to the building from the power network, and that is generated within power plants that burn fossil fuels and produce significant amounts of GHG emissions. Likewise, the electricity demand of a building can be managed by implementing energy efficiency measures that substantially reduce such emissions. According to the above, in a conceptual way, certain measures can develop an energy supply for buildings, while others can rationalize and manage the demand for energy consumed within buildings, but in the same way, both reduce GHG emissions. From this point of view, these measures are analyzed in this article as comparable and relevant measures for the fight against climate change, and that can empower the users of buildings, especially since these measures can be implemented in parallel.
The residential, commercial, and public services sectors (RCPS), as a whole, have one of the highest final energy consumption in the world, and in turn, are those that directly satisfies the basic needs of the population, such as cooking and food preservation, lighting and environmental conditioning of homes and businesses, as well as public lighting and pumping of drinking water, among others. In 2017, these sectors represented 31% (128 Exajoules—EJ) of world total final consumption [1]. In that year, of the total consumption of the RCPS sectors, electricity was the most consumed energy source, with 32.2%, followed by bioenergy with 25.1% (being 85% traditional biomass, which has important repercussions on the health of the users), natural gas with 21.8%, oil products with 10.5% and coal with 4.2%; being the less consumed the renewable energies, such as solar, wind, biogas, that accounting only 1.4% of the final energy consumption of these sectors [1]. It is important to note that heat generation in buildings, represents 4.8% (6.1 EJ) of the total energy consumption of the RCPS sectors, where coal and natural gas are the most consumed energy sources, with 42% each, while only 10.5% is produced by renewable energy source and the rest is produced by other energy sources [2]. This consumption structure, based mainly on fossil energy, has an important impact on greenhouse gas emissions generated directly, by burning fossil fuels, or indirectly through the consumption of electricity. Considering these direct and indirect emissions, the RCPS sectors are responsible for 28% of the emissions from energy use [3]. If we follow the path of current policies, according to Reference [1], the consumption of these sectors is expected to increase to 170 EJ by 2040, which would represent 30% of the final energy consumption for that year, a similar percentage to the one currently available. In addition, in this trajectory, electricity increases its participation in the final energy consumption of the RCPS sectors, since it would go from 32% in 2017 to 43% in 2040 [1], so the way in which this energy is produced will be key in mitigating climate change.
According to the International Energy Agency and Gielen et al. [4,5], mitigation in the RCPS sectors is important to reach a low carbon scenario that limits the increase in the global average temperature towards 2100 of 2 °C in relation to the levels of the preindustrial era. According to the International Renewable Energy Agency [6], in 2018, there were 135 countries that mentioned these sectors in their nationally determined contributions (NDCs), but only 51 specifically mention the use of renewable energy to reduce their GHG emissions. Likewise, Reference [6] indicates that only 29% of the world countries have mandatory energy efficiency standards for energy uses or part of the building sector, reflecting that 60% of energy use in buildings is consumed in the absence of energy efficiency policies. That is why it is necessary to promote renewable energy and energy efficiency in these sectors to mitigate GHG emissions.
Renewable energy, in particular solar energy (SE) in countries with the abundant solar resource, together with energy efficiency (EE), are considered technically viable and competitive to reduce GHG in the RCPS sectors [7,8,9,10,11]. On the other hand, in the rural and peri-urban sectors in a large part of developing countries, the use of clean and efficient technologies for the use of local firewood (such as the use of efficient wood-burning stoves (Patsari type) that have a chimney that expels the combustion gases outside the home) would have the advantage of improving the air quality in homes [12,13] and reducing millions of premature annual deaths [14].
In the case of Mexico, the RCPS sector participates significantly in energy consumption, representing 18% of final energy demand nationwide in 2017 [15]. Moreover, it is expected that this consumption, and therefore, its GHG emissions, will increase [16]. Emission reduction is a fundamental part of Mexico’s national climate change policy. On the one hand, there are the indicative goals established in the General Climate Change Law (LGCC for its acronym in Spanish) [17] to reduce GHG emissions by 30% in 2020 compared to a baseline, and 50% in 2050 in relation to the emissions from 2000. On the other hand, Mexico established in the mitigation commitments [Intended Nationally Determined Contribution (INDC)], presented in the 21st Conference of the Parties (COP21) an unconditional goal of reducing its GHG emissions by 22% by 2030, and a conditioned goal of 36% in the same year, in relation to an official baseline [18]. In July 2018, the unconditional contributions of the aforementioned 22% were established as part of the LGCC [19].
It should be noted that, to meet the general unconditional goal, for the residential and commercial sectors, a specific goal of reducing only five million tons of carbon dioxide equivalent (MtCO2e) in 2030 is established in the INDCs. To achieve this, a recent study of the National Institute of Ecology and Climate Change [20] (the governmental body that gives scientific and technical support to the implementation of the national climate change policy) analyzes only two mitigation options, namely efficient gas heaters and the use of solar collectors, for the aforementioned sectors, to meet this sectoral objective. On the other hand, indirect emissions from electricity consumption in these sectors are not considered in the INDCs, nor are they included in the goals for the public services sector included.
Given the low climate ambition of this goal, it is necessary to develop and analyze ambitious mitigation scenarios for the RCPS sectors where the EE and the SE contribute on a larger scale, and more importantly, in Mexico’s international mitigation commitments and in accordance with the goals established in the LGCC, especially with the ambitious goal set for 2050. Greater participation of EE and SE is justified in the realization of several studies for Mexico that have analyzed these mitigation options in the residential, commercial, and public sectors, such as References [21,22]. Although these studies have been more focused on treating the entire energy system, they have revealed that energy consumption and GHG emissions can be significantly reduced with EE and SE. These options include efficient lighting, cooling, and air conditioning equipment, as well as thermal insulation, solar collectors for water heating, efficient wood-burning stoves (EWS), and efficient public lighting. More recently, Reference [23] studied sustainable bioenergy options proposes for the residential sector, and the use of EWS to mitigate GHG emissions, while Reference [24] focused on analyzing the impact of EE standards to reduce electricity consumption and emissions in this sector.
These works show that there is indeed a significant opportunity to increase the climate ambition in the RCPS sectors that goes beyond 5 MtCO2e for 2030 that Mexico has set as a specific goal for the residential and commercial sector as already mentioned. For this reason, this article builds an alternative scenario for 2035, consisting of twelve EE and SE mitigation options in the RCPS sectors and that includes the reduction of GHG emissions in the public services sector, as well as indirect emissions related to electricity consumption, due to related EE and SE options, GHG reductions that have not been part of Mexico’s INDCs in the Paris Agreement.
In this article, four solar energy options were selected for power generation in buildings and eight energy efficiency options for the rationalization and management of energy demand in these buildings, which were considered to have technical-economic viability to be installed in buildings in Mexico. Other renewable energy sources were not considered, assuming that they didn’t have a significant potential that was technically and economically feasible to generate energy in the RCPS sectors in Mexico. The main purpose of this scenario is to show that this alternative scenario is technically and economically feasible to meet the INDCs of the Paris agreement by 2030, and to increase the climate ambition of the RCPS sectors in its renegotiation in 2021.
2. RCPS Sectors Current Situation
The RCPS sectors have historically represented an important consumption in Mexico. In 2010 they consumed 919 Petajoules (PJ), meaning 20% of the final energy consumption. This energy consumption had an annual increase rate of 0.4% towards 2017, reaching 944 PJ; consumption that represented 18% of the total consumption of that year [15].
Following the global trend, the most important energy source in 2017 for these sectors was electricity with 34.3%, while the second most important was liquefied petroleum gas (LPG) with 32.9%, followed by firewood with 26.5% (consumed in the residential sector mainly in rural areas by exclusive users and in urban areas by mixed users in conjunction with other energy sources, such as LPG), while natural gas (NG) and solar energy, are the energy sources that occupy the lowest proportion of energy consumption in those sectors with 5.2 and 1.1%, respectively in that year [15]. This energy consumption structure has a substantial impact on the GHG emissions generated by these sectors; in 2015, they contributed 8.8% of total energy consumption emissions (62.8 MtCO2e) [25].
Regarding the issue of official Mexican standards (NOMs for its acronym in Spanish), the Ministry of Energy, through the National Commission for the Efficient Use of Energy, has issued 34 standards, of which 22 are of efficiency on the equipment used in the RCPS sectors. A sector in which the application of the NOMs has permeated the most has been the residential sector, since the effect of this regulation in EE for household appliances has generated significant energy savings, estimated at 100 Terawatt-hour (TWh) during the period 1996–2014, representing a cumulative savings of approximately 20 billion dollars [26].
Although efforts at the national level in EE (EE norms and programs) have permeated mainly in the residential sector, they need to permeate even more in the commercial, and public services sectors, so that the RCPS sectors are a component important in the mitigation of climate change, and that these efforts can also materialize in benefits, such as the reduction of fuel and energy bills, reduction of environmental pollution, and especially, a better quality of life in their homes for people that use solid biomass as an energy source. As will be seen below, the EE options that are simulated in the alternative scenario call for a strengthening in the application and extension of this regulatory framework in the RCPS sectors.
In the case of the use of solar energy in the RCPS sectors, it is still small, despite being a country with an abundant solar resource, in this sense, according to the 2017 National Energy Balance [15], there are 3.9 million square meters of solar water heating systems that represent about 11.3 PJ of final consumption energy, which is equivalent to almost half a million solar water heating systems. Regarding the use of photovoltaic systems (PVS) nationwide, the same reference establishes that there were almost 245 Megawatt (MW) of PVS in distributed generation in 2017, of which 90% were interconnected to the electricity grid (220.5 MW), generating only 0.73 PJ. As can be seen, the use of SE is still small, so it is necessary to drastically increase its use in Mexico.
This article develops a much more ambitious GHG mitigation scenario in the use of EE and SE for the RCPS sectors in Mexico, considering eight EE options and four SE options that are used on a large scale in these sectors, showing that these 12 Mitigation options are technically and economically feasible so that these sectors can contribute substantially to increase climate ambition in the Paris Agreement and be on track to meet the ambitious mitigation goal established in the General Climate Change Law by 2050.
3. General Methodology
The development of this work was carried out through the following steps:
- The year 2010 was established as a reference year, and a trend scenario was created based on information from official outlooks [27,28,29,30] on the evolution of energy consumption by end-use type in the residential, commercial, and public services sectors, for a prospective period of 25 years. The year 2010 was used as the reference year, due to the following reasons: (1) 2010 is a year prior to the entry of the official Mexican energy efficiency standards that are analyzed in various mitigation options in this article, such as the standard for general use lamps (NOM-028-ENER-2010), the standard for luminaires with light-emitting diodes (LED) for public lighting (NOM-031-ENER-2012), the standard for refrigerators (NOM-015-ENER-2012), the standard for air conditioning equipment (NOM-023-ENER-2010), the standard for thermal insulators for buildings (NOM-018-ENER-2011) and the standard for gas-based heaters (NOM-003-ENER-2011). These standards and their application in the mitigation scenario are explained in Section 5.1. Furthermore, it is the reason for this article to evaluate the potential impact of these energy efficiency standards as GHG gas mitigation measures in the RCPS sector; and (2) the technical and economic information related to the equipment of the RCPS sector for the construction of the reference year was available and as complete as possible for 2010, unlike more recent years where it is not possible to have enough information to represent the reference year.
- The trend scenario proposed in this article does not consider structural changes in equipment or in the use of materials that affect energy consumption in the RCPS sectors.
- An alternative mitigation scenario was created from the representation of 12 mitigation options, eight energy efficiency options, and four options with solar energy (thermal and photovoltaic). These options are described in Section 5.1.
- For the construction of the trend and alternative scenarios, direct and indirect GHG emissions (due to electricity consumption) were considered.
- Finally, a cost-benefit and mitigation costs analysis according to the economic calculation model developed in Section 5.2, was carried out to define the feasibility of the mitigation scenario with respect to the trend scenario.
The representation and simulation of the trend scenario and the mitigation scenario were carried out in the LEAP (Long Range Energy Alternative Planning System) software [31].
Methodological Development in LEAP Software
The LEAP model was an important tool for the representation and simulation of the trend scenario and the mitigation scenario, which is a bottom-up model developed by the Stockholm Environment Institute [31]. This model makes it possible to match the demand and supply of energy annually, for an established period, at different levels of aggregation, and develops specific scenarios that represent different policies or mitigation measures and then add them and formulate a global alternative scenario. LEAP is also an accounting framework that uses exogenous economic and technical data, but also contains a technology and environment database (TED) that includes, among others, Intergovernmental Panel on Climate Change (IPCC) GHG emission factors. All these characteristics allow LEAP to carry out scenario analyses (trend and mitigation) in energy, economic and emissions terms. Therefore, given these characteristics, in this article, the LEAP model was used as follows:
- A sector called RCPS was built in the LEAP model with three subsectors: (1) residential, (2) commercial, and (3) public services.
- For the reference year, in each of the aforementioned subsectors, energy consumption was represented in the LEAP model, according to the National Energy Balance [27].
- The trend scenario was built in LEAP representing an energy consumption projection for each of the subsectors (residential, commercial, and public services) based on information from official projections [28,29,30]. For the case of firewood consumption in the residential sector, the projection of Reference [23] was used, and the main assumptions can be seen in Table 1.
 Table 1. Main assumptions by sector for the trend scenario.
 - Based on information on future energy consumption, GHG emissions were calculated for the reference year, and the trend scenario using emission factors from the LEAP TED database, except in the case of the electricity emission factor, which was taken from Reference [32].
- For the alternative scenario, first, an Excel calculation model was generated for each of the mitigation options, the description of which is shown in Section 5. The calculation model estimates, for the energy efficiency options, the diffusion of efficient devices, that replace the inefficient ones, the annual unit consumption per device, and the energy used. In the case of solar energy options, for the interconnected photovoltaic systems option, the diffusion of the capacity and the energy avoided from the grid was estimated. Moreover, for the solar collectors’ option, the diffusion of devices and the avoided energy of LPG and natural gas were estimated. The results, in terms of the new energy demands, were imported into the LEAP software to develop a scenario for each of the mitigation options, in such a way that each mitigation scenario was represented in each of the subsectors and energy sources involved in mitigation measure. By last, from the sum of the eight mitigation scenarios, the global mitigation scenario was created, which integrates the results of each of the aforementioned scenarios and calculates the new total energy demand for each of the subsectors and energy sources involved.
- Finally, once the new energy demands of the alternative scenario were estimated, the GHG emissions were calculated using the LEAP TED database.
4. Reference Year Establishment and Trend Scenario Construction
For the reference year establishment, the equipment and energy consumption for 2010 was considered for each sector based on official information for that year, and the energy consumption by end-use was estimated, as shown in Figure 1. For the construction of the trend scenario, several general assumptions were used per sector analyzed, which are shown in Table 1.
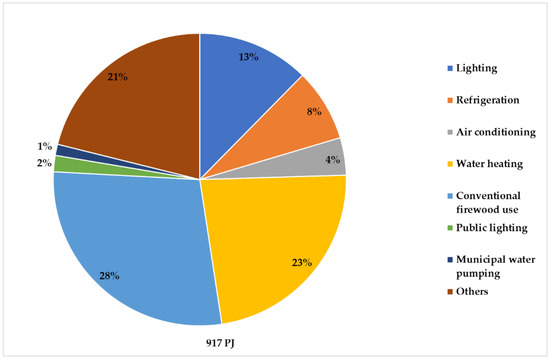
Figure 1.
Structure of end-use of energy RCPS sectors. Source: Own calculation based on References [27,33,36,37].
The consumption structure of the RCPS sectors presented in Section 2 and the projection of the trend scenario with the assumptions in Table 1, led us to consider the following method to estimate emissions:
- (i)
- For LPG, NG, kerosene, and diesel, the direct GHG emissions generated in conventional gas-based devices that are used in buildings in Mexico were considered and which were estimated using the following emission factors: 55.92 kg of carbon dioxide equivalent per Gigajoule (kgCO2e/GJ), 72.94 kgCO2e/GJ, 72.83 kgCO2e/GJ and 72.96 kgCO2e/GJ for the NG, LPG, kerosene, diesel, respectively. These emission factors were obtained from the TED Database (Technology Environmental Database) of the LEAP Model [31].
- (ii)
- Regarding firewood, the direct N2O and CH4 emissions generated in traditional 3-stone woodstoves are quantified, however, in relation to CO2 emissions, it was considered that 80% of direct emissions are biogenic while the rest are considered anthropogenic emissions, due to a non-renewability factor of the firewood [44]. Therefore, an emission factor for firewood of 11.23 kgCO2e/GJ was used, based on Reference [45].
- (iii)
- Regarding electricity, indirect GHG emissions generated in the national set of power plants were considered, where more than 80% of the power generated is produced with fossil fuels in conventional plants, for which the emission factor used for the base scenario goes from 0.485 ton of carbon dioxide equivalent per kilowatt-hour (tCO2e/kWh) in 2010 to 0.440 tCO2e/kWh in 2035 according to Reference [32].
5. Construction of Mitigation Scenarios
The mitigation scenario was constructed considering 12 mitigation options classified in EE options and SE options (thermal and photovoltaic).
5.1. Mitigation Measures Description
Due to the motivation of this article to estimate the mitigation potential of the energy efficiency standards analyzed, an ambitious replacement of conventional equipment is proposed to reduce GHG emissions in the RCSP sectors, in such a way that substitutions are projected of equipment with the new regulations up to 100%, especially for efficient lighting and thermally insulated air conditioning options. The results section discusses what public policies would be necessary to achieve these highly ambitious mitigation measures. Regarding the solar energy options analyzed, the substitutions are considered less ambitious, due to the high initial investment cost that they represent for users of the analyzed sectors.
5.1.1. Energy Efficiency Measures
1. Efficient lighting in the residential sector. It is considered that 100% of the incandescent bulbs still existing in 2010 (77% of the total lighting devices) are replaced by compact fluorescent lamps (CFL) and light-emitting diode light bulbs (LED-LB) by 50% for each type of efficient bulb by 2035. To carry out this measure, an average of 7.6 million incandescent bulbs are replaced annually. It is assumed that the norm NOM-028-ENER-2010 [46] is fully applied, which obliges to cease gradually the commercialization of incandescent bulbs to facilitate its complete replacement by an efficient lamp, such as CFL and LED-LB. This option represents an average saving per substituted focus of 79% in unit consumption.
2. Efficient refrigerators in the residential sector. This option assumes the progressive replacement of the total of the inefficient refrigerators for equipment that complies with NOM-015-ENER-2012 [47] that establishes the limits of the annual consumption of electric energy for refrigerators up to 39 cubic feet. This measure implies the replacement of just over 49 million refrigerators with more efficient equipment through the analyzed period. The saving by efficient equipment, on average, is 55% in the annual unit consumption.
3. Efficient air conditioning and thermal insulation in the residential sector. This option involves the replacement of the existing (100%) air conditioning (AC) systems and devices with efficient AC systems, along with implementing thermal insulation in ceilings. The application of standards NOM-023-ENER-2010 [48] that establishes the energy efficiency ratio limit (net cooling effect/electric power) for AC equipment, and NOM-018-ENER-2011 is strengthened [49] that establishes the limit of heat gain allowed for a building or house. This combined measure produces a 40% [38] saving in annual consumption per home and is progressively implemented in 21 million homes in the analyzed period. For this measure, it is considered that by 2035, this measure represents 70% of the buildings with concrete slab roof or joists with vault and 51% of the total buildings. For this, only the universe of buildings in the residential sector with this type of roof is considered, which according to Reference [33] in 2010 were 20.8 million, of which 11 million had AC. Considering that the relationship between houses and ceilings is maintained, estimated at 73% according to data from Reference [33], and a growth of 1.5% of buildings in the residential sector according to Reference [34] by 2035, there would be a total of 30.2 million buildings with concrete roofs or joists with a vault.
4. Efficient water heating in the residential sector. This measure assumes the progressive replacement of existing LPG and natural gas heating equipment with new, more efficient equipment, according to the NOM-003-ENER-2011 [50], which establishes the maximum thermal efficiency limit for domestic gas heaters. This measure replaces 17.7 million inefficient heaters and represents a 35% savings in annual consumption per heater.
5. Efficient woodstoves. It is considered [23] that 90% of the traditional wood-burning stoves that are used in the rural sector are replaced by efficient wood-burning stoves by 2035, which reduce the consumption of firewood by 50% [23,38] in comparison with traditional stoves. This measure involves the installation of about four million efficient wood-burning stoves.
6. Efficient lighting in the commercial sector. It is assumed that 100% of the existing lamps (38.5 million in the reference year) are replaced by 2035 through the strengthening of the application of the mentioned NOM-028-ENER-2010 standard.
7. Air conditioning and thermal insulation in the commercial sector. The existing air conditioning equipment and systems are replaced in the commercial sector by more efficient equipment together with thermal insulation. In total, more than half a million inefficient equipment is replaced by 2035. Through the strengthening of the application of the standards NOM-023-ENER-2010 and the NOM-018-2011 mentioned.
8. Efficient public lighting. It is assumed that 100% of existing lamps in public lighting (12.6 million lamps) are replaced with Light-emitting diode (LED) lamps by 2035 through compliance with the NOM-031-ENER-2012 standard [51] that establishes the luminous efficacy specifications for LED luminaires, intended for roads and public outdoor areas. This measure represents almost 50% energy savings on the average per lamp.
5.1.2. Solar Energy Measures
9. Distributed interconnected photovoltaic systems (DIPVS) in net metering for municipal pumping. The installation of DIPVS of 9.6 kilowatt-peak (kWp) [52] in net metering is assumed to produce and to inject electricity to the grid during the hours of insolation for municipal pumping. We assume an annual growth of 19.7% of these DIPVS in such a way that in 2035 1.2 Gigawatt (GW) of DIPVS have been installed nationwide in this final use.
10. DIPVS in net metering for municipal public lighting. In this measure it is considered the installation of DIPVS of 2.6 kWp [52] in a net metering scheme at the national level to cover the consumption of public lighting with LED that has been aforementioned. We assume an annual growth of 28.4% of these DIPVS in such a way that in 2035 about 3.8 GW of these DIPVS have been installed nationwide, representing a 49% reduction in grid electricity consumption in this end-use.
11. DIPVS in the residential sector. It is considered that all users of high consumption in residential tariff 1, which has no subsidy, install DIPVS by 2035. It is considered a monthly electricity consumption for these users of 353 kWh and the installation of 1 kW of DIPVS [53]. Therefore, it is expected that a capacity of 667 MW will be installed by 2035.
12. Solar collectors in the residential sector. The progressive replacement of 2.1 million gas-based heater equipment by solar collectors is assumed. This represents 12% of the total conventional equipment used for water heating nationwide, as well as an installed area of 8.6 million square meters by 2035.
Table 2 and Table 3 show the progression of these options in the mitigation scenario in terms of the alternative equipment they represent, as well as their diffusion rate in the analysis period, while Table 4 shows the costs of investment, operation and maintenance (O&M) and energy for each of the EE and SE options analyzed.
Table 2.
Specific assumptions of the energy efficiency options in the mitigation scenario.
Table 3.
Specific assumptions of solar energy options in the mitigation scenario.
Table 4.
Incremental costs of the EE and SE options in the mitigation scenario.
Similar studies on mitigation measures with great ambition have been considered as an alternative scenario of this article, and have been analyzed for different countries according to the scientific literature.
For the residential sector, the Center for Clean Air Policy [65] proposes various energy efficiency options in its Advance Options Scenario (AOS); For India, it proposes replacing incandescent lamps by CFLs and the adoption of more energy efficient refrigerators and air conditioners, by 100% in the period 2016–2036, which are goals similar to those proposed in this article. While for Brazil, it analyzes as an option that 100% of the new gas-based equipment (stoves and heaters) are efficient by 2036, derived from an efficient labeling program, a measure that is very similar to what is proposed in this article about 100% replacement of existing water heaters with newer, more efficient equipment. Likewise, another study considers it feasible to replace 82% of inefficient woodstoves with improved and more efficient woodstoves in Guatemala by 2030 [66].
In the case of solar energy options for this same sector, the study by Reference [67] proposes for Brazil in its Low-Carbon Scenario that 0.7% of electricity consumption comes from SFV installed in the residential sector in 2030, a goal very similar to the one considered in this article of 1% in 2035. As for the option of solar heaters, the study by Reference [11] proposes in its Advanced Technology scenario that in California, 15% of residential water heating is carried out with solar heaters in 2035 and 44% in 2050. The proposal, analyzed in this article, considers that this value is 12% in 2035 with average annual growth rate of 18% for the period 2011–2035, a rate lower than the 22% achieved by China, during the period 1998–2009, according to Reference [68], which has been one of the most successful dissemination of this technology worldwide.
Regarding commercial sector efficiency measures, the study [65], in its AOS, assumes that 75% of commercial lighting in India will be made with CFL in 2036, an ambition very similar to the one proposed in this article, where it is considered that 100% of the commercial lighting will be efficient, with the use of fluorescent and LED lamps.
Finally, in relation to the public sector, in the case of the efficient public lighting option, the study by Reference [69] proposes for India, in its LED Lighting Scenario, that 100% of inefficient luminaires are replaced by LEDs in 2020. While for Brazil, the study by Reference [65] in its AOS proposes a 100% penetration of its RELUZ program (Program to retrofit public lighting and buildings). Regarding the pumping of municipal water with PVS, a study carried out for Namibia [70], estimates that the application of this measure in 58% of the drinking water wells registered in the country, could contribute 66% (as they are mostly not interconnected) of the water capacity supplied by the well. Said percentage is similar to the assumption in this article, in which 100% of the municipal drinking water pumping systems in Mexico can be equipped with PVS to provide 24% of the energy required by the pumping system. For the option of public lighting with PVS, Reference [71] with the study of two cities in Uganda (Kampala and Jingja), estimates a potential reduction of 40% in electricity consumption from the network for public lighting at level national, which is similar to the 49% proposed in this article for this type of measure. As the reader can see, the goals before cited are very similar to those proposed in this article, for the final uses of the energy of the RCPS sectors.
5.2. Economic Calculation Model
The following Cost-Benefit (CB) model was applied to estimate the costs and benefits of the options analyzed in the mitigation scenario in relation to the trend scenario.
where:
| Investment incremental costs in present value for the 12 mitigation options of the mitigation scenario. | |
| Operation and maintenance incremental costs in present value for the 12 mitigation options of the mitigation scenario. | |
| Avoided energy costs from the conventional supply in present value for the 12 mitigation options of the mitigation scenario. |
With:
where:
where:
where:
| Incremental investment annual costs in relation to the implementation of the mitigation option i for any year y of the period p; | |
| y | year; |
| p | Analysis period (25 years); |
| n | Number of mitigation options (12 options); |
| r | Discount rate (10%) |
| Operation and maintenance incremental costs for the mitigation option i in the year y of the period p. |
| Cumulative annual costs from the energy savings of the conventional energy supply e of the mitigation option i in the year y for the period p. |
To calculate the mitigation cost of each of the measures, the following equation was used:
where:
| Total incremental cost in net present value for mitigation option i. | |
| Total GHG emissions avoided by the measure i. |
With:
CO2e emissions are given by the equation:
where:
| Total energy avoided from the conventional energy supply e in the analysis period related to the implementation of mitigation option i; | |
| Emission factor for the conventional energy supply e. |
6. Results
6.1. Trend Scenario
In the trend scenario, the energy demand of the RCPS sectors grows at an annual rate of 2.5% and goes from 917 PJ in 2010 to 1705 PJ in 2035, which almost doubles the energy demand in those sectors in the analyzed period (see Figure 2). It is noteworthy that electricity is the energy that is most used in 2035, representing 48.1%, followed by LPG with 27.6%. Other energy sources that are used to a lesser extent, but that are also important are the consumption of firewood (mainly in the residential sector) with 14.1% and natural gas that represents 9.3% of the energy demand in those sectors. While the least used energy is a diesel with 0.5%, kerosene with 0.1%, and solar energy with 0.3%. The latter because it is considered in our assumptions that solar energy is not promoted in the trend scenario (see Table 1).
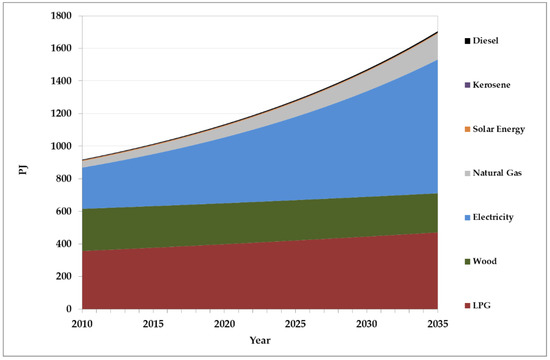
Figure 2.
Energy consumption by source in the trend scenario for the RCPS sectors, 2010–2035. Source: Own elaboration.
This scenario of energy demand trend in the RCPS sectors has an important impact on the increase of GHG emissions (direct and indirect), since they rise from 65.5 MtCO2e in 2010 to 148 MtCO2e in 2035, meaning an increase of 227%. In 2035, electricity is the one that provides the most (indirect) emissions from the trend scenario, since it represents 68.6%, followed by emissions from the use of LPG representing 23.1%, natural gas whose consumption represents 6%, wood fuel with 1.8%, and finally, the two sources of energy that contribute with the lowest amount of emissions are diesel with 0.4% and kerosene with 0.1% (see Figure 3).
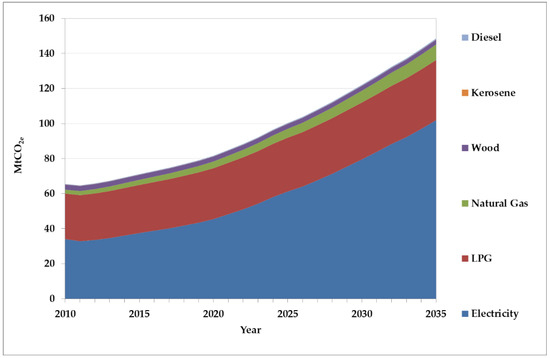
Figure 3.
GHG emissions by source in the trend scenario for RCPS sectors, 2010–2035. Source: Own elaboration.
6.2. Mitigation Scenario
The results of the application of the 12 mitigation measures in the RCPS sectors (eight of energy efficiency and four of solar energy), show that, in the mitigation scenario, GHG emissions are increased at an annual rate of 1.8%, which is lower than the 3.3% trend scenario rate. It should be noted that this mitigation scenario shows that in 2035 a reduction of 30.3% is achieved with respect to emissions from the trend scenario (see Figure 4).
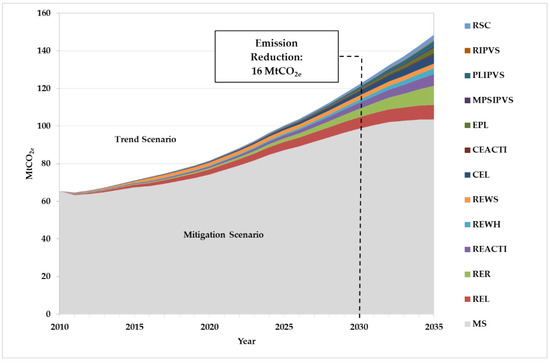
Figure 4.
Avoided emissions by mitigation options in the RCPS sectors. Source: Own elaboration.
The 12 options of the mitigation scenario reach a cumulative reduction potential of 364.5 MtCO2e during the analyzed period, which represents a 15% reduction of the total cumulative emissions generated for that period in the trend scenario. It should be noted that this scenario avoids 23.5 MtCO2e in 2030, which is 4.7 times more than the emissions that are avoided to comply with the NDCs in the residential and commercial sectors [20], while in 2035, our scenario mitigates 45 MtCO2e.
According to the results, of the total GHG emissions avoided, efficient lighting within the residential sector is the option that mitigates the greatest amount of GHG emissions, representing a 26.2% reduction of the total; followed by the options of efficient refrigerators, efficient air conditioning with thermal insulation and efficient wood-burning stoves with reductions of 17.8%, 13.3%, and 11.7%, respectively. Efficient lighting within the commercial sector, as well as the use of efficient water heaters and solar collectors in the residential sector, generate lower reductions, representing 8.9%, 6.2%, and 5.3% of the total emissions avoided, respectively. Finally, the proposed measures with the lowest mitigation potential are those corresponding to public lighting with SFV, public lighting with LED, air conditioning, and thermal insulation in the commercial sector, municipal pumping with IPVS, and finally, IPVS in the residential sector with 3.3%, 3.2%, 1.8%, 1.5%, and 0.7%, respectively. In sum, the energy efficiency options together represent 89% of the mitigation potential (325.4 MtCO2e) while the solar energy options the remaining 11% (39.1 MtCO2e).
Figure 5 shows the results of the mitigation options for each sector. As can be seen, the GHG emissions for the residential sector in the trend scenario for 2035 are 106 MtCO2e, while for the mitigation scenario, it reaches almost 73 MtCO2e, which represents a reduction of 33 MtCO2e, which is equivalent to 33% mitigation of GHG emissions in 2035. This mitigation is achieved by considering the implementation of six options, namely: Efficient lighting, efficient refrigeration, air conditioning, and thermal insulation, efficient woodstoves, efficient heaters, solar collectors, and interconnected photovoltaic systems. In relation to the commercial sector, this reaches 33 MtCO2e in 2035 in the trend scenario, while in the mitigation scenario, it decreases to 28 MtCO2e, which means a reduction of 6.5 MtCO2e at the end of the period, representing a 17% mitigation of GHG. For this sector, only two options were analyzed to be carried out, namely efficient lighting and air conditioning and thermal insulation. Finally, for the public services sector, the trend scenario reaches 9.4 MtCO2e, while in the mitigation scenario, emissions are reduced to 3.2 MtCO2e, which means a significant reduction of 66% by 2035. This reduction is achieved by implementing the following three options: Efficient public lighting, public lighting with photovoltaic systems, and municipal pumping with interconnected photovoltaic systems.
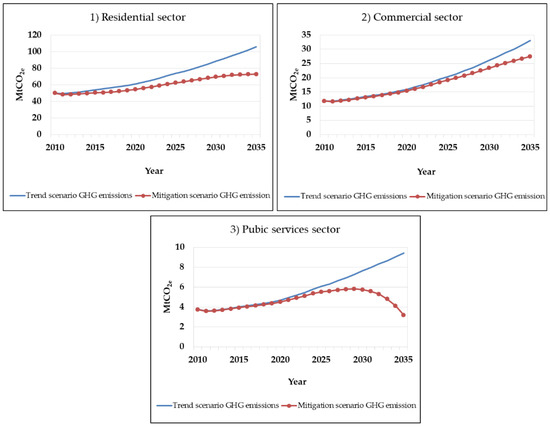
Figure 5.
GHG emissions in the trend scenario and in the alternative scenario by sector. Source: Own elaboration.
6.3. Mitigation Costs
The mitigation costs, as well as the mitigation potential of each of the energy efficiency and solar energy options in the RCPS sectors for the mitigation scenario, are shown in Figure 6. The mitigation cost is represented on the y-axis and in the x-axis the reductions of GHG emissions accumulated in the period by mitigation measure and ordered from lower to higher cost. As can be seen, almost all energy efficiency options, except for the option of public lighting with LED, have negative costs, that is, economic benefits are obtained from their application, while almost all solar energy options (except collectors solar in the residential sector) have costs. Of all the options, efficient lighting in the residential sector is the measure that has the greatest benefit and a significant reduction in emissions, while the option with the highest cost is that of public lighting with IPVS interconnected to the power network in the sector of public services.
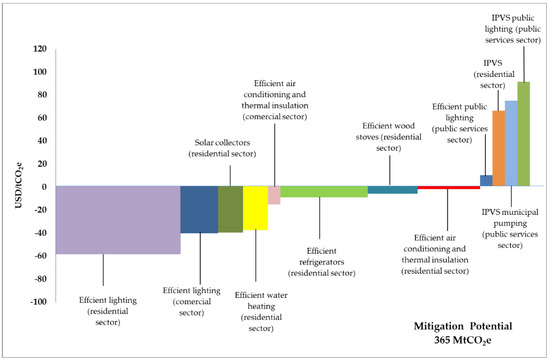
Figure 6.
The mitigation cost curve for energy efficiency and solar energy options in the RCPS sectors. Source: Own elaboration.
6.4. Cost-Benefit Analysis
As can be seen in Table 5, in the mitigation scenario, global benefits of the order of $7665 million USD (MUSD) are obtained throughout the 25 years of analysis. Benefits of the order of $8582 MUSD are obtained from measures of energy efficiency, which offset the total costs of solar energy options that are of the order of $917 MUSD. It should be noted that this mitigation scenario has a significant global investment cost of the order of $9007 MUSD (which includes $83 MUSD of O&M costs), and in this area, the energy efficiency measures represent 70% and the rest the solar energy options (30%). Therefore, the aspiration that this mitigation scenario will be achieved represents significant financing challenges. It is also noteworthy that the implementation of this scenario has benefits for energy savings in the order of $16,672 million USD, where 89.5% are generated on the side of energy efficiency options and the remaining 10.5% on the side of energy options solar energy.
Table 5.
Cost-benefit and avoided emissions by energy efficiency and solar energy options in the mitigation scenario.
Overall, the mitigation scenario for the RCPS sectors mitigates a cumulative total of 365 MtCO2e, which results in an average mitigation cost of–$21 dollar per ton of carbon dioxide equivalent (USD/tCO2e) that indicates that there is no overall cost for implementing this scenario that significantly mitigates GHG emissions for these sectors.
Both in the trend scenario and in the mitigation scenario, the growth of the corresponding equipment, shown in Table 2, materializes due the fact that in both scenarios, the per capita income grows at an annual rate of 2.7% in the analyzed period, a product of an annual GDP growth of 3.6% and a population growth of 0.9% per year (see Table 1). However, in the trend scenario, an increase in energy consumption by 2035 of 52% is considered for conventional equipment compared to the reference year for the analyzed end-uses in RCPS sectors, while in the mitigation scenario, this energy consumption is reduced by 46% compared to the trend scenario in 2035.
As can be seen, the mitigation measures analyzed are mostly cost-effective, especially in the residential and commercial sectors; however, a barrier is the investment costs required to install the new equipment and/or materials of the different mitigation measures. Therefore, public policies are required to facilitate the financing of these measures, such as, for example, establishing financial mechanisms with low interest rates and/or the application of tax incentives to promote the change of less efficient equipment by those that comply with the regulations of the alternative scenario. Therefore, to implement the mitigation measures of the RCPS sectors studied in this article, it is necessary to have adequate public policies, especially fiscal and financing.
7. Conclusions
Under the conditions of the trend scenario, the energy required to meet the demand of the RCPS sectors is 1705 PJ in 2035, which is 186% greater than the energy demand in 2010. As a consequence of these trends, the volume of emissions from GHG, reaches a total of 148.6 MtCO2e in 2035, increasing by 226% in relation to 2010. These emissions come mainly from the demand for electricity, due to the indirect emissions followed by LPG.
The reduction of GHG emissions in the RCPS sectors in the mitigation scenario comes from the application of eight energy efficiency mitigation options and four solar energy options. This set of options offers an emission reduction potential of 364.5 MtCO2e in the analysis period, of which 325.4 MtCO2e corresponds to the energy efficiency options and 39.1 MtCO2e to the solar energy options. Together these options reduce 15% of the cumulative emissions in the trend scenario in the analysis period.
According to our results, in the mitigation scenario, the energy efficiency options mostly represent benefits; however, the solar energy options mostly have costs. Together, all the mitigation options that make up the mitigation scenario have the result that the benefits of $16,672 MUSD exceed the costs of $9007 MUSD so that a mitigation scenario is achieved at no global cost and with a net global economic benefit of $7665 MUSD.
The results also show that the mitigation scenario far exceeds the goal of reducing 5 MtCO2e established for the residential and commercial sectors in the INDCs in the unconditional version, and that it is possible to increase the mitigation ambition significantly in renegotiations of the climate ambition of the Paris Agreement in 2021.
Although there are benefits in the mitigation scenario, the results reveal that implementing this scenario has an important financing challenge since the incremental global investment costs amount to over $9000 MUSD (over $360 MUSD annually) in the entire analyzed period. Therefore, it would be necessary to have greater sources of financing, international and national, and to design adequate financing mechanisms for each type of mitigation measure. In particular, for photovoltaic solar energy, it is essential to establish mechanisms and incentives to support its large-scale dissemination in the RCPS sectors.
This article establishes that buildings are active entities in the management and generation of the energy that they consume and not only passive entities in meeting their energy needs through external purchases. That is, they can modify their energy demand using efficient equipment and generating, partially or totally, the energy they require. The scope of this work has been to explore part of that potential for the RCSP sector, which is given by different options that are economically viable and ambitious in mitigating GHG emissions, so that they allow buildings to be active in their energetic needs. For future research, it is necessary to consider other options, from the perspective of energy saving, such as smart systems, passive and geothermal solar systems, or other efficient equipment, such as LED screens, washing machines, heat pumps, etc., that contribute to modifying the energy demand and its management. In addition to options for energy generation in buildings, such as the production of biogas with its waste, the use of small wind systems, solar cooking appliances, among others. These new investigations could reveal the possibility of having buildings with little or no external energy requirements and with neutral emissions that contribute significantly to the fight against climate change.
Author Contributions
Conceptualization, G.K.G.-A. and J.M.I.-S.; Methodology, J.M.I.-S.; Software, G.K.G.-A.; Validation, G.K.G.-A. and J.M.I.-S.; Formal Analysis, J.M.I.-S.; Investigation, G.K.G.-A. and J.M.I.-S.; Resources, J.M.I.-S.; Data Curation, G.K.G.-A.; Writing—Original Draft Preparation, G.K.G.-A.; Writing—Review & Editing, G.K.G.-A. and J.M.I.-S.; Visualization, G.K.G.-A.; Supervision, J.M.I.-S.; Project Administration, J.M.I.-S.; Funding Acquisition, J.M.I.-S. All authors have read and agreed to the published version of the manuscript.
Funding
This research was funded by Energy Sustainability Fund through SENER-CONACYT projects 2009-117808 and 2014-246911.
Acknowledgments
The authors thank María de Jesús Pérez Orozco for the technical support granted and to Mariano O. Birlain Escalante for his editorial support.
Conflicts of Interest
The authors declare no conflict of interest.
Nomenclature
| AAGR | Average annual growth rate |
| AC | Air conditioning |
| ACE | Annual consumption per equipment |
| AOS | Advance Options Scenario |
| CB | Cost-Benefit |
| CEACTI | Air conditioning and thermal insulation in the commercial sector |
| CEL | Efficient lighting in the commercial sector |
| CFL | Compact fluorescent lamps |
| CH4 | Methane |
| COP21 | 21st Conference of the Parties |
| DIPVS | Distributed interconnected photovoltaic systems |
| EE | Energy efficiency |
| EJ | Exajoules |
| EPL | Efficient public lighting in the public services sector |
| EWS | Efficient wood-burning stoves |
| GDP | Gross domestic product |
| GHG | Greenhouse gases |
| GJ/year | Gigajoule per year |
| GW | Gigawatt |
| INDC | Intended Nationally Determined Contribution |
| IPVS | Interconnected photovoltaic system |
| kgCO2e/GJ | Kilogram of carbon dioxide equivalent per Gigajoule |
| kWh | Kilowatt-hour |
| kWp | Kilowatt-peak |
| LEAP | Long Range Energy Alternative Planning System |
| LED | Light-emitting diodes |
| LED-LB | Light-emitting diode light bulbs |
| LGCC | General Climate Change Law |
| LPG | Liquefied petroleum gas |
| MPSIPV | Municipal pumping with interconnected photovoltaic systems in the public services sector |
| MtCO2e | Million tons of carbon dioxide equivalent |
| MUSD | Million USD |
| MW | Megawatt |
| MW | Megawatt |
| N2O | Nitrous oxide |
| NDC | Nationally determined contributions |
| NG | Natural gas |
| NOM-023-ENER-2010 | Standard for air conditioning equipment |
| NOM-003-ENER-2011 | standard for gas-based heaters |
| NOM-018-ENER-2011 | Standard for thermal insulators for buildings |
| NOM-028-ENER-2010 | Standard for general use lamps |
| NOM-031-ENER-2012 | Standard for luminaires with light-emitting diodes |
| NOMs | Official Mexican standards |
| O&M | Operation and maintenance |
| PLIPVS | Public lighting with interconnected photovoltaic systems in the public services sector |
| PVS | Photovoltaic systems |
| RCPS | Residential, commercial, and public services |
| REACTI | Efficient air conditioning and thermal insulation in the residential sector |
| REL | Efficient lighting in the residential sector |
| RELUZ program | Program to retrofit public lighting and buildings in Brazil |
| RER | Efficient refrigerators in the residential sector |
| REWH | Efficient water heating in the residential sector |
| REWS | Efficient woodstoves |
| RIPV | Interconnected photovoltaic systems in the residential sector |
| RSC | Residential solar collectors |
| SE | Solar energy |
| tCO2e/kWh | Ton of carbon dioxide equivalent per kilowatt-hour |
| TED | Technology and environment database |
| TWh | Terawatt-hour |
| USD | American dollars |
| USD/tCO2e | American dollars per ton of carbon dioxide equivalent |
References
- International Energy Agency (IEA). World Energy Outlook 2018; IEA Publications: Paris, France, 2018; ISBN 978-92-64-30677-6. [Google Scholar]
- International Energy Agency (IEA). World Energy Balances 2018; IEA Publications: Paris, France, 2018; ISBN 978-92-64-30156-6. [Google Scholar]
- International Energy Agency (IEA). Perspectives for the Clean Energy Transition. Available online: https://webstore.iea.org/download/direct/2496?fileName=Perspectives_for_the_Clean_Energy_Transition_2019.pdf (accessed on 31 July 2020).
- International Energy Agency (IEA). World Energy Outlook 2016; IEA Publications: Paris, France, 2016; ISBN 978-92-64-26495-3. [Google Scholar]
- Gielen, D.; Boshell, F.; Saygin, D.; Bazilian, M.D.; Wagner, N.; Gorini, R. The role of renewable energy in the global energy transformation. Energy Strateg. Rev. 2019, 24, 38–50. [Google Scholar] [CrossRef]
- REN21 Secretariat. Renewables 2019 Global Status Report. Available online: https://www.ren21.net/gsr-2019/ (accessed on 31 July 2020).
- Belussi, L.; Barozzi, B.; Bellazzi, A.; Danza, L.; Devitofrancesco, A.; Fanciulli, C.; Ghellere, M.; Guazzi, G.; Meroni, I.; Salamone, F.; et al. A review of performance of zero energy buildings and energy efficiency solutions. J. Build. Eng. 2019, 25, 100772. [Google Scholar] [CrossRef]
- Patiño-Cambeiro, F.; Armesto, J.; Bastos, G.; Prieto-López, J.I.; Patiño-Barbeito, F. Economic appraisal of energy efficiency renovations in tertiary buildings. Sustain. Cities Soc. 2019, 47, 101503. [Google Scholar] [CrossRef]
- Mateus, R.; Silva, S.M.; de Almeida, M.G. Environmental and cost life cycle analysis of the impact of using solar systems in energy renovation of Southern European single-family buildings. Renew. Energy 2019, 137, 82–92. [Google Scholar] [CrossRef]
- Gaglia, A.G.; Dialynas, E.N.; Argiriou, A.A.; Kostopoulou, E.; Tsiamitros, D.; Stimoniaris, D.; Laskos, K.M. Energy performance of European residential buildings: Energy use, technical and environmental characteristics of the Greek residential sector—Energy conservation and CO₂ reduction. Energy Build. 2019, 183, 86–104. [Google Scholar] [CrossRef]
- Raghavan, S.V.; Wei, M.; Kammen, D.M. Scenarios to decarbonize residential water heating in California. Energy Policy 2017, 109, 441–451. [Google Scholar] [CrossRef]
- Lucon, O.; Ürge-Vorsatz, D.; Zain Ahmed, A.; Akbari, H.; Bertoldi, P.; Cabeza, L.F.; Eyre, N.; Gadgil, A.; Harvey, L.D.D.; Jiang, Y.; et al. Chapter 9. Buildings. In Climate Change 2014: Mitigation of Climate Change. Contribution of Working Group III to the Fifth Assessment Report of the Intergovernmental Panel on Climate Change; Cambridge University Press: Cambridge, UK; New York, NY, USA, 2016; pp. 671–738. [Google Scholar]
- Winijkul, E.; Bond, T.C. Emissions from residential combustion considering end-uses and spatial constraints: Part II, emission reduction scenarios. Atmos. Environ. 2016, 124, 1–11. [Google Scholar] [CrossRef]
- International Energy Agency (IEA). Energy and Air Pollution. World Energy Outlook Special Report. Available online: https://webstore.iea.org/download/summary/343?fileName=English-WEO-Air-Pollution-ES.pdf (accessed on 31 July 2020).
- Secretaría de Energía (SENER). Balance Nacional de Energía 2017. Available online: https://www.gob.mx/cms/uploads/attachment/file/414843/Balance_Nacional_de_Energ_a_2017.pdf (accessed on 31 July 2020).
- International Energy Agency (IEA). Mexico Energy Outlook. World Energy Outlook Special Report. Available online: https://webstore.iea.org/download/direct/321 (accessed on 31 July 2020).
- Diario Oficial de la Federación (DOF). Decreto Por el Que se Expide la Ley General de Cambio Climático. Available online: http://dof.gob.mx/nota_detalle.php%3Fcodigo%3D5249899%26fecha%3D06/06/2012 (accessed on 31 July 2020).
- Gobierno de la República. México. Intended Nationally Determined Contribution. Available online: https://www.gob.mx/cms/uploads/attachment/file/162973/2015_indc_ing.pdf (accessed on 31 July 2020).
- Diario Oficial de la Federación (DOF). Decreto Por el Que se Reforman y Adicionan Diversas Disposiciones de la Ley General de Cambio Climático. Available online: http://dof.gob.mx/nota_detalle.php?codigo=5531463&fecha=13/07/2018 (accessed on 31 July 2020).
- Instituto Nacional de Ecología y Cambio Climático (INECC). Costos de las Contribuciones Nacionalmente Determinadas de México. Medidas Sectoriales No Condicionadas. Available online: https://www.gob.mx/cms/uploads/attachment/file/330857/Costos_de_las_contribuciones_nacionalmente_determinadas_de_M_xico__dobles_p_ginas_.pdf (accessed on 31 July 2020).
- Quadri, G. El cambio Climático en México y el Potencial de Reducción de Emisiones Por Sectores, México; Secretaría de Medio Ambiente y Recursos Naturales: Mexico City, Mexico, 2008; p. 100. [Google Scholar]
- Johnson, T.; Alatorre, C.; Romo, Z.; Liu, F. México: Estudio para la Disminución de Emisiones de Carbono (MEDEC), 1st ed.; World Bank; Mayol Ediciones, S.A.: Washington, DC, USA, 2009; ISBN 978-958-8307-75-6. [Google Scholar]
- García, C.A.; Riegelhaupt, E.; Ghilardi, A.; Skutsch, M.; Islas, J.; Manzini, F.; Masera, O. Sustainable bioenergy options for Mexico: GHG mitigation and costs. Renew. Sustain. Energy Rev. 2015, 43, 545–552. [Google Scholar] [CrossRef]
- Martínez-Montejo, S.A.; Sheinbaum-Pardo, C. The impact of energy efficiency standards on residential electricity consumption in Mexico. Energy Sustain. Dev. 2016, 32, 50–61. [Google Scholar] [CrossRef]
- Instituto Nacional de Ecología y Cambio Climático (INECC). Inventario Nacional de Emisiones de Gases y Compuestos de Efecto Invernadero 1990–2015. Available online: https://www.gob.mx/inecc/acciones-y-programas/inventario-nacional-de-emisiones-de-gases-y-compuestos-de-efecto-invernadero (accessed on 31 July 2020).
- Comisión Nacional para el Uso Eficiente de Energía (CONUEE). Análisis de la Evolución del Consumo Eléctrico del Sector Residencial Entre 1982 y 2014 e Impactos de Ahorro de Energía Por Políticas Públicas. Cuadernos de la CONUEE No. 1. Available online: https://www.gob.mx/cms/uploads/attachment/file/98316/CuadernosConueeNo1.pdf (accessed on 31 July 2020).
- Secretaría de Energía (SENER) Balance Nacional de Energía 2010. Available online: http://www.cie.unam.mx/~rbb/ERyS2013-1/BalanceNacionaldeEnergia2010_2.pdf (accessed on 31 July 2020).
- Secretaría de Energía (SENER). Prospectiva del Sector Eléctrico 2010–2025; Secretaría de Energía: Mexico City, Mexico, 2010; p. 227.
- Secretaría de Energía (SENER). Prospectiva de Petrolíferos 2010–2025; Secretaría de Energía: Mexico City, Mexico, 2010; p. 227.
- Secretaría de Energía (SENER). Prospectiva del Mercado de Gas Natural 2010–2025; Secretaría de Energía: Mexico City, Mexico, 2010; p. 204.
- Heaps, C. Long-Range Energy Alternatives Planning System (LEAP); Software Version 2008.0.0.33; Environment Institute: Stockholm, Sweden, 2008. [Google Scholar]
- Grande-Acosta, G.; Islas-Samperio, J. Towards a low-carbon electric power system in Mexico. Energy Sustain. Dev. 2017, 37, 99–109. [Google Scholar] [CrossRef]
- Instituto Nacional de Estadística y Geografía (INEGI). Encuesta Nacional de Ingreso y Gasto en Los Hogares 2010. Available online: https://www.inegi.org.mx/programas/enigh/tradicional/2010/ (accessed on 31 July 2020).
- Consejo Nacional de Población (CONAPO). Proyecciones de la Población 2010–2050. Available online: http://www.conapo.gob.mx/work/models/CONAPO/Resource/1529/2/images/DocumentoMetodologicoProyecciones2010_2050.pdf (accessed on 31 July 2020).
- Instituto Nacional de Geografía y Estadística (INEGI). PIB y Cuentas Nacionales. Producto Interno Bruto Trimestral. Available online: https://www.inegi.org.mx/temas/pib/default.html#Tabulados (accessed on 30 September 2020).
- United Nations Environment Program (UNEP). Greenhouse Gas Emissions Baselines and Reduction Potentials from Buildings in Mexico. A Discussion Document. Available online: https://www.unenvironment.org/resources/report/greenhouse-gas-emission-baselines-and-reduction-potentials -buildings-mexico (accessed on 31 July 2020).
- Ríos Fraustro Mario, A. Evaluación Económica y Ambiental de Escenarios de la Energía Solar en el Sector Residencial de México 2030. Master’s Thesis, Programa de Maestría y Doctorado en Ingeniería, UNAM, Mexico City, México, 2010. [Google Scholar]
- Comisión Nacional de Fomento a la Vivienda (CONAFOVI). Guía para el Uso Eficiente de la Energía en la Vivienda; Comisión Nacional de Fomento a la Vivienda: Mexico City, Mexico, 2006; ISBN 968-7729-34-1.
- Department of Energy, U.S. (DOE). 2010 U.S. Lighting Market Characterization. Navigant Consulting. Available online: https://www.energy.gov/sites/prod/files/2014/05/f16/2010-lmc-final-jan-2012.pdf (accessed on 31 July 2020).
- Deutsche Gesellschaft für Internationale Zusammenarbei (GIZ). Recomendación Estratégica Sobre Tecnologías y Subsectores Como Orientación para Sustentar Acciones de Eficiencia Energética en el Sector PyME. Available online: http://iki-alliance.mx/recomendacion-estrategica-sobre-tecnologias-y-subsectores-para-sustentar-acciones-de-eficiencia-energetica-en-el-sector-pyme/ (accessed on 31 July 2020).
- Department of Energy (U.S. DOE). Industrial Electric Motor Systems Market Opportunities Assessment. Available online: https://www.energy.gov/sites/prod/files/2014/04/f15/mtrmkt.pdf (accessed on 31 July 2020).
- Comisión Federal de Electricidad (CFE). Estadísticas 2010; Comisión Federal de Electricidad: Mexico City, Mexico, 2011; p. 111. [Google Scholar]
- Comisión Nacional para el Uso Eficiente de la Energía (CONUEE). Guía Iluminación Eficiente en Alumbrado Público. Available online: https://www.gob.mx/cms/uploads/attachment/file/200253/alum_publico.pdf (accessed on 31 July 2020).
- Ghilardi, A.; Guerrero, G.; Masera, O. Spatial analysis of residential fuelwood supply and demand patterns in Mexico using the WISDOM approach. Biomass Bioenergy 2007, 31, 475–491. [Google Scholar] [CrossRef]
- Johnson, M.; Edwards, R.; Alatorre Frenk, C.; Masera, O. In-field greenhouse gas emissions from cookstoves in rural Mexican households. Atmos. Environ. 2008, 42, 1206–1222. [Google Scholar] [CrossRef]
- Diario Oficial de la Federación (DOF). Norma Oficial Mexicana NOM-028-ENER-2010, Eficiencia Energética de Lámparas para Uso General. Límites y Métodos de Prueba. Available online: http://dof.gob.mx/nota_detalle.php?codigo=5169747&fecha=06/12/2010 (accessed on 31 July 2020).
- Diario Oficial de la Federación (DOF). Norma Oficial Mexicana NOM-015-ENER-2012, Eficiencia Energética de Refrigeradores y Congeladores Electrodomésticos. Límites, Métodos de Prueba y Etiquetado. Available online: http://dof.gob.mx/nota_detalle.php?codigo=5234117&fecha=16/02/2012 (accessed on 31 July 2020).
- Diario Oficial de la Federación (DOF). Norma Oficial Mexicana NOM-023-ENER-2010, Eficiencia Energética en Acondicionadores de Aire Tipo Dividido, Descarga Libre y Sin Conductos de Aire. Available online: http://www.dof.gob.mx/nota_detalle.php?codigo=5171765&fecha=20/12/2010 (accessed on 31 July 2020).
- Diario Oficial de la Federación (DOF). Norma Oficial Mexicana NOM-018-ENER-2011, Aislantes Térmicos para Edificaciones. Características y Métodos de Prueba. Available online: http://dof.gob.mx/nota_detalle.php?codigo=5224248&fecha=14/12/2011 (accessed on 31 July 2020).
- Diario Oficial de la Federación (DOF). Norma Oficial Mexicana NOM-003-ENER-2011, Eficiencia Térmica de Calentadores de Agua para Uso Doméstico y Comercial. Límites, Método de Prueba y Etiquetado. Available online: http://www.dof.gob.mx/normasOficiales/4458/sener/sener.htm (accessed on 31 July 2020).
- Diario Oficial de la Federación (DOF). Norma Oficial Mexicana NOM-031-ENER-2012, Eficiencia Energética para Luminarios Con Diodos Emisores de Luz (Leds) Destinados a Vialidades y Áreas Exteriores Públicas. Especificaciones y Métodos de Prueba. Available online: http://dof.gob.mx/nota_detalle.php?codigo=5276652&fecha=06/11/2012 (accessed on 22 October 2019).
- Organización de las Naciones Unidas para el Desarrollo Industrial (ONUDI). Potencial de Los Sistemas Fotovoltaicos en México. Análisis de Los Sectores Residencial, Público e Industrial Por Entidad Federativa. Available online: http://www.renenergyobservatory.org/uploads/media/Anexo_26._Libro.Potencial.Energia.Solar.Mexico.pdf (accessed on 31 July 2020).
- Grande, G.; Islas, J.; Ríos, M. Technical and economic analysis of Domestic High Consumption Tariff niche market for photovoltaic systems in the Mexican household sector. Renew. Sustain. Energy Rev. 2015, 48, 738–748. [Google Scholar] [CrossRef]
- Secretaría de Energía (SENER). Estudio de Mercado Sobre Diodos Emisores de Luz (LED’s). Available online: https://www.gob.mx/cms/uploads/attachment/file/315524/5_LED.pdf (accessed on 31 July 2020).
- Comisión Nacional para el Uso Eficiente de Energía (CONUEE). Consejos Sobre Ahorro de Energía en tu Casa—Iluminación. Available online: https://www.gob.mx/conuee/acciones-y-programas/consejos-sobre-ahorro-de-energia-en-tu-casa-iluminacion (accessed on 31 July 2020).
- Malfavón, S. Potencial de Ahorro de Energía por el Cambio de Calentadores de Agua y Estufas Más Eficientes en el Sector Residencial Mexicano. Master’s Thesis, Programa de Maestría y Doctorado en Ingeniería, UNAM, Mexico City, México, 2006. [Google Scholar]
- Llumor. Iluminación LED. Bombillas de LED. Tubos LED T5 y T8. Available online: https://llumor.es/tubo-led/ (accessed on 20 October 2019).
- Organización Lationamericana de Energía (OLADE). Análisis de Tecnologías y Normatividad de Iluminación Eficiente en Alumbrado Público. Available online: http://biblioteca.olade.org/opac-tmpl/Documentos/old0411.pdf (accessed on 31 July 2020).
- Procuraduría Federal del Consumidor (PROFECO). Electrodomésticos y la Eficiencia Energética. Comparativo de Precios de Lavadoras, Pantallas y Refrigeradores. Available online: https://www.gob.mx/profeco/documentos/electrodomesticos-y-la-eficiencia-energetica-comparativo-de-precios-de-lavadoras-pantallas-y-refrigeradores-pdf (accessed on 31 July 2020).
- Procuraduría Federal del Consumidor (PROFECO). Cómo Comprar Aires Acondicionados. Available online: https://www.gob.mx/profeco/documentos/como-comprar-aires-acondicionados (accessed on 31 July 2020).
- Procuraduría Federal del Consumidor (PROFECO). Estudio de Calidad de Impermeabilizantes. Available online: https://www.gob.mx/cms/uploads/attachment/file/100479/56-67RC422Laboratorio_Impermeabilizantes.pdf (accessed on 31 July 2020).
- Procuraduría Federal del Consumidor (PROFECO). Estudio de Calidad: Calentadores de Agua de Uso Doméstico. Available online: https://www.gob.mx/cms/uploads/attachment/file/119180/Estudio_Calentadores_de_agua_48-65_Noviembre _2011.pdf (accessed on 31 July 2020).
- Energy Information Administration (EIA). Cost and Performance Characteristics of New Generating Technologies, Annual Energy Outlook 2019. Available online: https://www.eia.gov/outlooks/archive/aeo19/assumptions/pdf/table_8.2.pdf (accessed on 31 July 2020).
- Comisión Reguladora de Energía (CRE). Lista de Permisos y Autorizaciones Otorgados en Materia de Electricidad 2020. Available online: https://www.gob.mx/cre/acciones-y-programas/micrositio-de-permisos-en-materia-de-generacion-de-energia-electrica (accessed on 31 July 2020).
- Center for Clean Air Policy. Greenhouse Gas Mitigation in Brazil, China and India: Scenarios and Opportunities through 2025. Available online: https://ccap.org/resource/greenhouse-gas-mitigation-in-brazil-china-india-scenarios-opportunities-through-2025/ (accessed on 30 September 2020).
- Global Alliance for Clean Cookstoves. Plan de Acción Nacional de Guatemala para Estufas y Combustibles Limpios. Available online: https://www.cleancookingalliance.org/resources_files/guatemala-plan-de-accion-anexos.pdf (accessed on 30 September 2020).
- González-Mahecha, R.E.; Lucena, A.F.P.; Garaffa, R.; Miranda, R.F.C.; Chávez-Rodriguez, M.; Cruz, T.; Bezerra, P.; Rathmann, R. Greenhouse gas mitigation potential and abatement costs in the Brazilian residential sector. Energy Build. 2019, 184, 19–33. [Google Scholar] [CrossRef]
- Yuan, X.; Wang, X.; Zuo, J. Renewable energy in buildings in China—A review. Renew. Sust. Energy Rev. 2013, 24, 1–8. [Google Scholar] [CrossRef]
- Johnson, A.; Phadke, A.; de la Rue du Can, S. Energy Savings Potential for Street Lighting in India; Lawrence Berkeley National Laboratory: Berkeley, CA, USA, 2014; Volume 1, p. 86. [Google Scholar]
- Ministry of Mines and Energy Feasibility Assessment for the Replacement of Diesel Water Pumps with Solar Water Pumps. Available online: https://sswm.info/sites/default/files/reference_attachments/EMCON%202006%20Feasibility%20Assessment%20for%20the%20Replacement%20of%20Diesel%20Water%20Pumps%20with%20Solar%20Water%20Pumps.pdf (accessed on 30 September 2020).
- Gillard, R.; Oates, L.; Kasaija, P.; Sudmant, A.; Gouldson, A. Sustainable Urban Infrastructure for All: Lessons on Solar-Powered Street Lights from Kampala and Jinja, Uganda. Available online: https://newclimateeconomy.report/workingpapers/workingpaper/sustainable-urban-infrastructure-for-all-lessons-on-solar-powered-street-lights-from-kampala-and-jinja-uganda/ (accessed on 19 September 2020).


Publisher’s Note: MDPI stays neutral with regard to jurisdictional claims in published maps and institutional affiliations. |
© 2020 by the authors. Licensee MDPI, Basel, Switzerland. This article is an open access article distributed under the terms and conditions of the Creative Commons Attribution (CC BY) license (http://creativecommons.org/licenses/by/4.0/).