Article

Online Evaluation for the Accuracy of Electronic Voltage Transformer Based on Recursive Principal Components Analysis

1
College of Electrical Engineering & New Energy, China Three Gorges University, Yichang 443002, China
2
Hubei Provincial Key Laboratory for Operation and Control of Cascaded Hydropower Station, China Three Gorges University, Yichang 443002, China
3
Discipline of Electrical and Computer Engineering, Curtin University, Perth, WA 6000, Australia
4
School of Electrical and Electronic Engineering, Huazhong University of Science and Technology, Wuhan 430074, China
*
Author to whom correspondence should be addressed.
Energies 2020, 13(21), 5576; https://doi.org/10.3390/en13215576
Submission received: 19 September 2020 / Revised: 20 October 2020 / Accepted: 21 October 2020 / Published: 25 October 2020
(This article belongs to the Section F: Electrical Engineering)

Abstract

:
The electronic voltage transformer (EVT) has received much attention with the recent global trend to establish smart grids and digital substations. One of the main issues of the EVT is the deterioration of its performance with long-term operation which affects the control and protection systems it is employed for and hence the overall reliability of the power grids. This calls for the essential need for a reliable technique to regularly assess the accuracy of operating EVT in real-time. Unfortunately, traditional calibration methods cannot detect the incipient EVT performance change in real-time. As such, this paper presents a new online method to evaluate the accuracy of the EVT. In this regard, the Q-statistic is calculated based on the recursive principal components analysis (RPCA) using the output data of EVT to map up the changes of metering error on the electric–physics relationship. By employing the output data of the EVT along with the power grid characteristics, the performance of the EVT is evaluated without the need for a standard transformer, as per the current industry practice. Results show that the proposed method can assess the EVT with a 0.2 accuracy class.

1. Introduction

The electronic voltage transformer (EVT) is a metering device that comprises a sensing element and data processing unit. Compared with the traditional electromagnetic transformer, the EVT has the advantages of better insulation, less cost, and reduced volume which make it a suitable candidate for future smart grids and digital substations [1,2,3,4,5]. The main issue of the EVT is its poor stability over a long-term operation which calls for further improvement. EVT performance is also affected by some environmental and operating conditions such as temperature, humidity, vibration, and the surrounding magnetic field [6,7,8]. Measurement accuracy is the most important index to judge the EVT. Therefore, the EVT performance should be assessed on a regular basis to maintain its measurement accuracy at a satisfactory level.
Generally, there are two methods to assess the performance of the EVT, namely: off-line and online calibration techniques. The former is conducted based on a fixed maintenance cycle, usually every one or two years, using equipment containing a standard transformer [9,10]. This offline calibration method calls for the disconnection of the operating EVT which causes an interruption to the power grids. The current EVT online calibration technique also utilizes a standard transformer to evaluate the EVT measurement error. For instance, an online calibration system was designed for evaluating electronic current transformers by employing a remote-controlled hoisting unit and standard transformer [11]. A 110 kV on-site calibration system for an EVT that includes a standard capacitor and an analog integrating circuit to reconstruct the primary voltage signal was proposed in [12]. However, in the expected harsh operating environment of high voltage and strong magnetic field, the issue of accuracy degradation of the calibration system itself may arise due to its electromagnetic or capacitance-based structure. This has motivated researchers to come up with new calibration systems without using a standard voltage transformer. In [13], the relationship between the fault mode of the electronic transformer and the voltage data of the primary system has been analyzed using the wavelet theory. The characteristic parameters of fault modes of an optical voltage transformer were used as input data to an artificial neural network model to predict various faults [14]. Ref. [15] proposed a condition monitoring technique for a capacitor voltage transformer based on a nonlinear simplified Volterra model. However, the methods proposed so far in the literature [13,14,15] can detect faults within the electronic transformers after their occurrence without the ability of evaluating the device measurement accuracy in real-time, which should be of more concern with the long-term operation of the electronic transformers.
The EVT is an important piece of equipment for connecting the power grid with the measurement and protection system. The output data of the EVT can reflect the correlation between the main physical signals of the power grid. For the nonlinear problems caused by the hysteresis characteristics of the current transformer, a nonlinear regression correction algorithm is proposed for reducing a part of the metering error [16]. Generally, the metering error of an EVT is irregular and nonlinear. Suppose that the error can be separated from the output data and represented by the characteristic variables, the accuracy of EVT can be analyzed in time.
In this article, a method for evaluating the accuracy of the EVT is provided based on recursive principal components analysis (RPCA). The method is applied to separate the normal fluctuation of the power grid and the metering error of the EVT. The correlation between the power grid characteristics and the output data of the EVT is investigated and a new online evaluation technique without using a standard voltage transformer is developed.

2. Correlation Analysis

In this section, the correlation between the EVT output data and the power grid characteristics is investigated.
In theory, the three-phase voltages of a balanced power grid should satisfy the below equation:
U ˙ A + U ˙ B + U ˙ C = 0
The frequency fluctuation of a power grid affects the balance of the three-phase voltages, i.e., resulting in a non-zero sum of the three-phase voltages [17]. Under the normal operation of an EVT, there is a deviation between the primary and secondary output data. This deviation is usually small and steady by field verification and it meets the standard of Class 0.2. The EVT error can be divided into two parts: systematic error s t , which is due to the structure of EVT and free error v t . Thus, the output of the EVT x t can be expressed as:
x t = k u t + s t + v t
where u t is the primary voltage signal and k is the sensing coefficient.
Because of the influence of power grid frequency, primary voltage, and operating environment, the free error and systematic errors are not constants and they exhibit dynamic change. As a result, the EVT measurement of the primary voltage will be inaccurate. According to physics, the measurement errors can be classified into:
  • Periodic error: for instance, the error of the EVT with a capacitive or resistive voltage divider, which changes because of the temperature-dependent characteristics of the capacitive and resistive components.
  • Inherent error: for example, after a broken or damaged capacitive element of the EVT, a significant ramp in the ratio error is taking place.
  • Other error: some parts of the EVT may undergo electrical and thermal aging, leading to inevitable error.
As can be seen from (2), the output of the EVT includes the data of the power grid ( u t ) which is linearly correlated with x t along with the EVT measurement errors that are nonlinearly correlated with x t . By separating the linear and nonlinear parts in (2), the status of the EVT can be evaluated in real-time.

3. Online Evaluation Using RPCA

Variance, cluster, regression and associative are among the common data analysis methods. However, these methods cannot separate the unrelated parts from association. To obtain effective information from a metering device, PCA (Principal Components Analysis) is employed to analyze the correlation of the output data [18,19]. This method can reduce the dimension of the extracted features of a large data set and transform a set of related variables to a set of linearly unrelated variables. The Q-statistic which is related to the non-linear part of the data and T2-statistic are calculated from the principal component model. The primary voltage of the power grid while Q-statistic is calculated based on the nonlinear errors of the EVT. Based on the value of Q-statistic, the operating condition of the EVT can be evaluated. After the process monitoring model based on traditional PCA is established, it will not be changed anymore, so it is not suitable for monitoring an EVT with time-varying characteristics. Therefore, RPCA is applied in the article, which can be obtained on the basis of PCA [20].

3.1. Tradition PCA

The normalized form of the sample data matrix is denoted as X R n × m , where n is the number of samples, m is the number of process variables. Suppose the number of principal components is r, the standard data matrix is:
X = T P r T + T e P e T
where T = [ t 1 , t 2 , t r ] is the principal component score matrix, T e = [ t r + 1 , t r + 2 , , t m ] is the residual score matrix, P = P r + P e is the load matrix and P r = [ p 1 , p 2 , , p r ] is the principal component load matrix.
Covariance matrix R of the standard data matrix is:
R = X T X n 1 = P Λ P T
where Λ = d i a g ( λ 1 , λ 2 , , λ m ) is the eigenvalues of the covariance matrix.

3.2. Recursive Principal Components Analysis

Suppose the number of data blocks is k and the blocks composed in the original data matrix X k 0 R N k × m , where N k = i = 1 k n i , n i is the length of the block. When a new data block is collected, the model of RPCA is updated as below:
b k = 1 N k ( X k 0 ) T l n k
where l n k = [ 1 , 1 , , 1 ] T R n k
When the k + 1 data block N n k + 1 0 R n k + 1 × m is collected, the raw data matrix becomes:
X k + 1 0 = [ X k 0 X n k + 1 0 ]
The parameters of the RPCA model are defined in Table 1.
The vector of mean and sample variance are expressed as follow:
b k + 1 = N k N k + 1 b k + 1 N k + 1 ( X n k + 1 0 ) T l n k + 1
( N k + 1 1 ) σ k + 1 , i 2 = ( N k 1 ) σ k , i 2 + N k Δ b k + 1 2 ( i ) + X n k + 1 0 ( : , i ) l n k + 1 b k + 1 ( i ) 2
where X n k + 1 0 ( : , i ) is the i t h column of the k + 1 data block, b k + 1 ( i ) is the i t h element of the corresponding variable, Δ b k + 1 = b k + 1 b k , l n k + 1 = [ 1 , , 1 ] T R n k + 1 .
The k + 1 data block matrix calculated recursively is standardized to
X k + 1 = [ X k + 1 0 l k + 1 b k + 1 T ] k + 1 1 = [ X k 0 l k b k + 1 T X n k + 1 0 l n k + 1 b k + 1 T ] · k + 1 1 = [ X k k k + 1 1 l k Δ b k + 1 T k + 1 1 X n k + 1 ]
where
{ X k = ( X k 0 l k b k + 1 T ) k 1 X n k + 1 = ( X n k + 1 0 l n k + 1 b k + 1 T ) k + 1 1 j = d i a g ( σ j , 1 , , σ j , m ) , j = k , k + 1
Covariance matrix with recursive calculation is:
R k + 1 = 1 N k + 1 1 X k + 1 T X k + 1 = N k 1 N k + 1 1 k + 1 1 k R k k k + 1 1 + N k N k + 1 1 k + 1 1 Δ b k + 1 Δ b k + 1 T k + 1 1 + 1 N k + 1 1 X n k + 1 T X n k + 1
In the online evaluation, assuming the interval between two recursive updates of the principal component model is too long, then it cannot reflect the time-varying characteristics of the system in real-time. The recursive updates need to keep the high frequency and the data block used for updating should be a small sample. Each time a new sample count is collected N k + 1 = N k + 1 = k + 1 , and the principal component model is recursively updated. The sample data of variables collected at the k + 1 time x k + 1 , so the Equation (11) can be simplified to:
R k + 1 = k 1 k k + 1 1 k R k k k + 1 1 + k + 1 1 Δ b k + 1 Δ b k + 1 T k + 1 1 + 1 k x k + 1 T x k + 1

3.3. Evaluation Indicator

The measurement accuracy of the EVT exhibits abnormal changes, leading to the projection of EVT output data in the residual subspace. The Q-statistic is calculated by the residual matrix as follows:
Q = ( X P e P e T ) ( X P e P e T ) T = X P e P e T X
where P e is the residual load matrix.
The limit of the Q-statistic with the significance level α is given by the below formula:
Q c = θ 1 [ C α 2 θ 2 h 0 2 θ 1 + 1 + θ 2 h 0 ( h 0 1 ) θ 1 2 ] 1 h 0
where θ i = j = α + 1 3 λ i j ,   ( i = 1 , 2 , 3 ) , h 0 = 1 2 θ 1 θ 3 / 3 θ 2 2 , C α is the value of Gaussian distribution with the significance level α.
The abnormal phase can be assessed by the contribution rate:
Q i = ( T e P e T ) i 2 = ( X i ( T P r T ) i ) 2
where i is the sequence number of the variable.

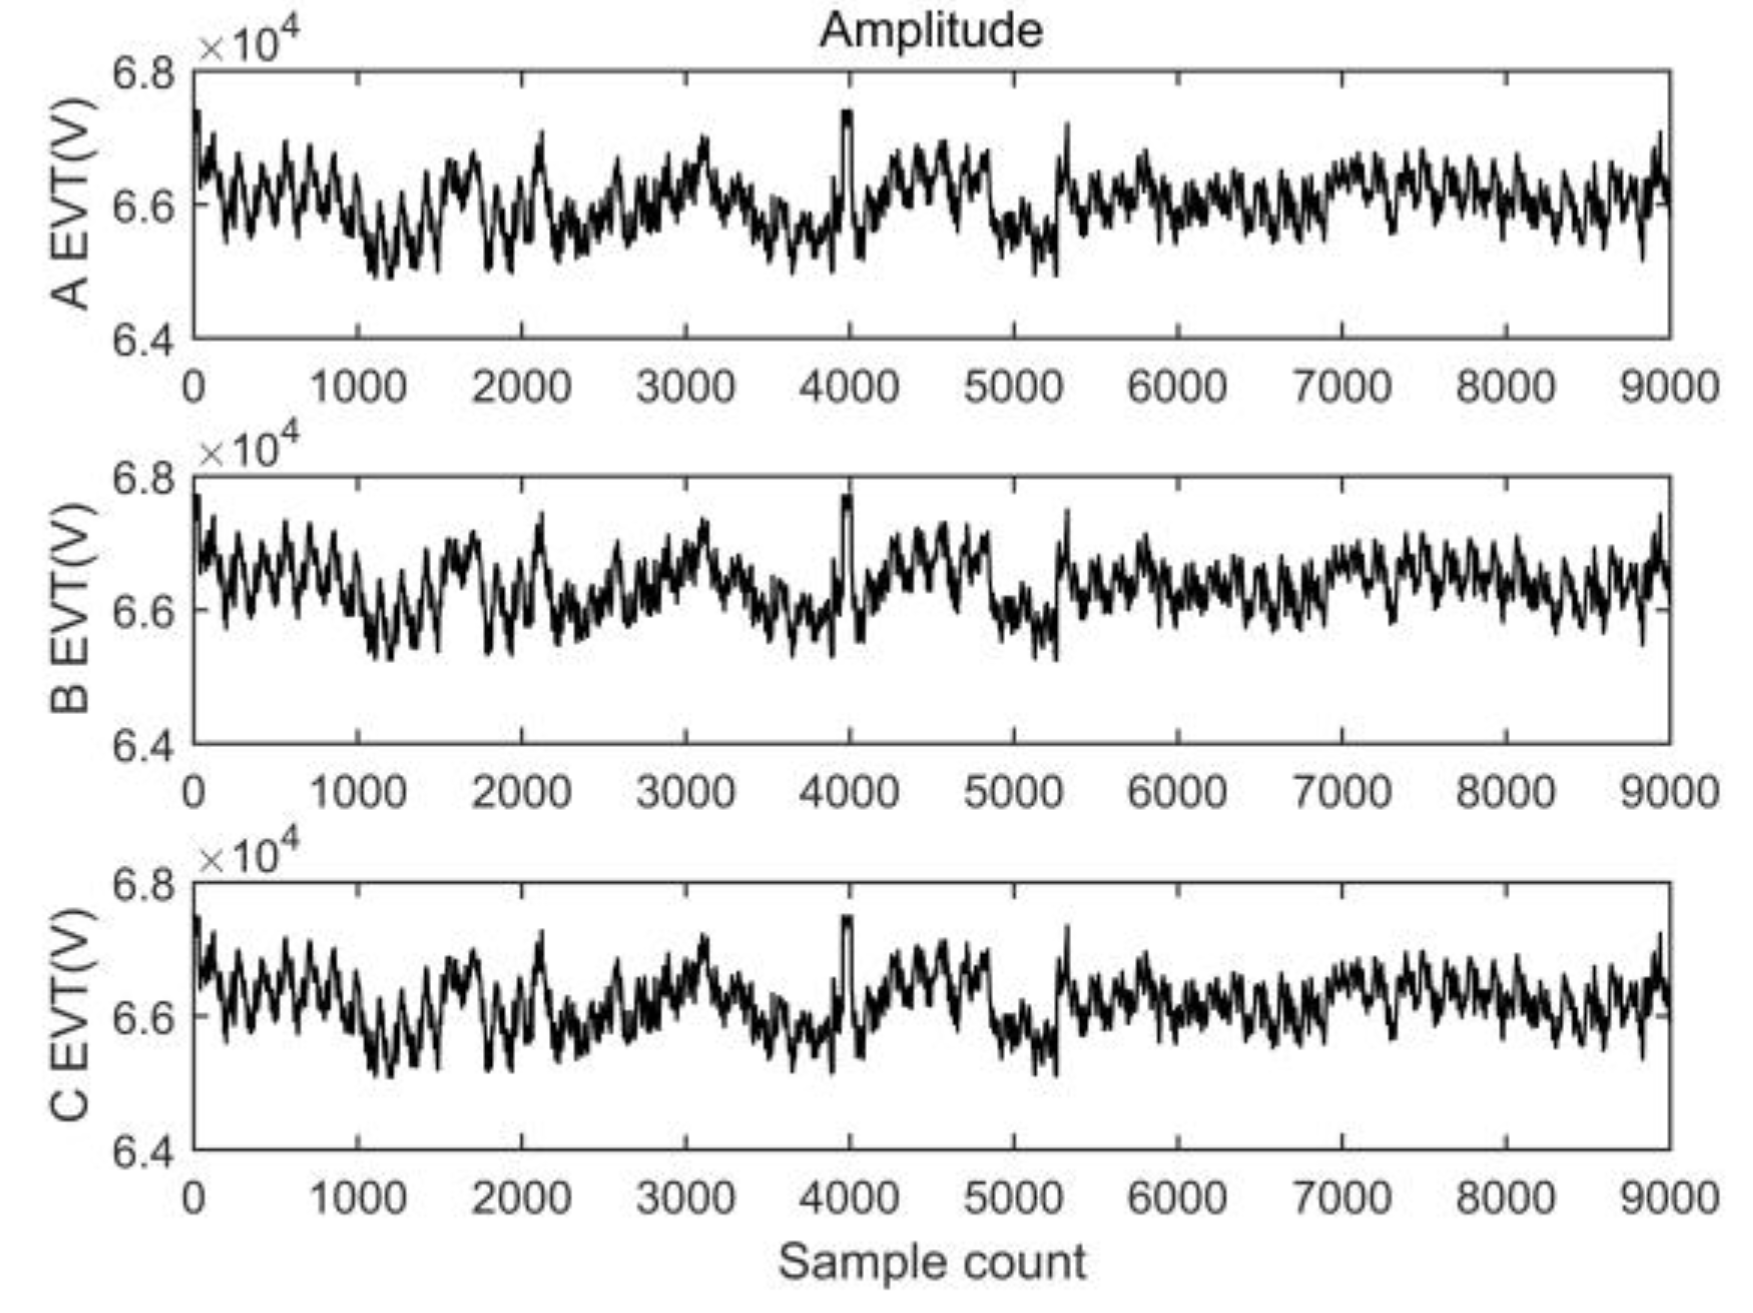
4. Experimental Analysis

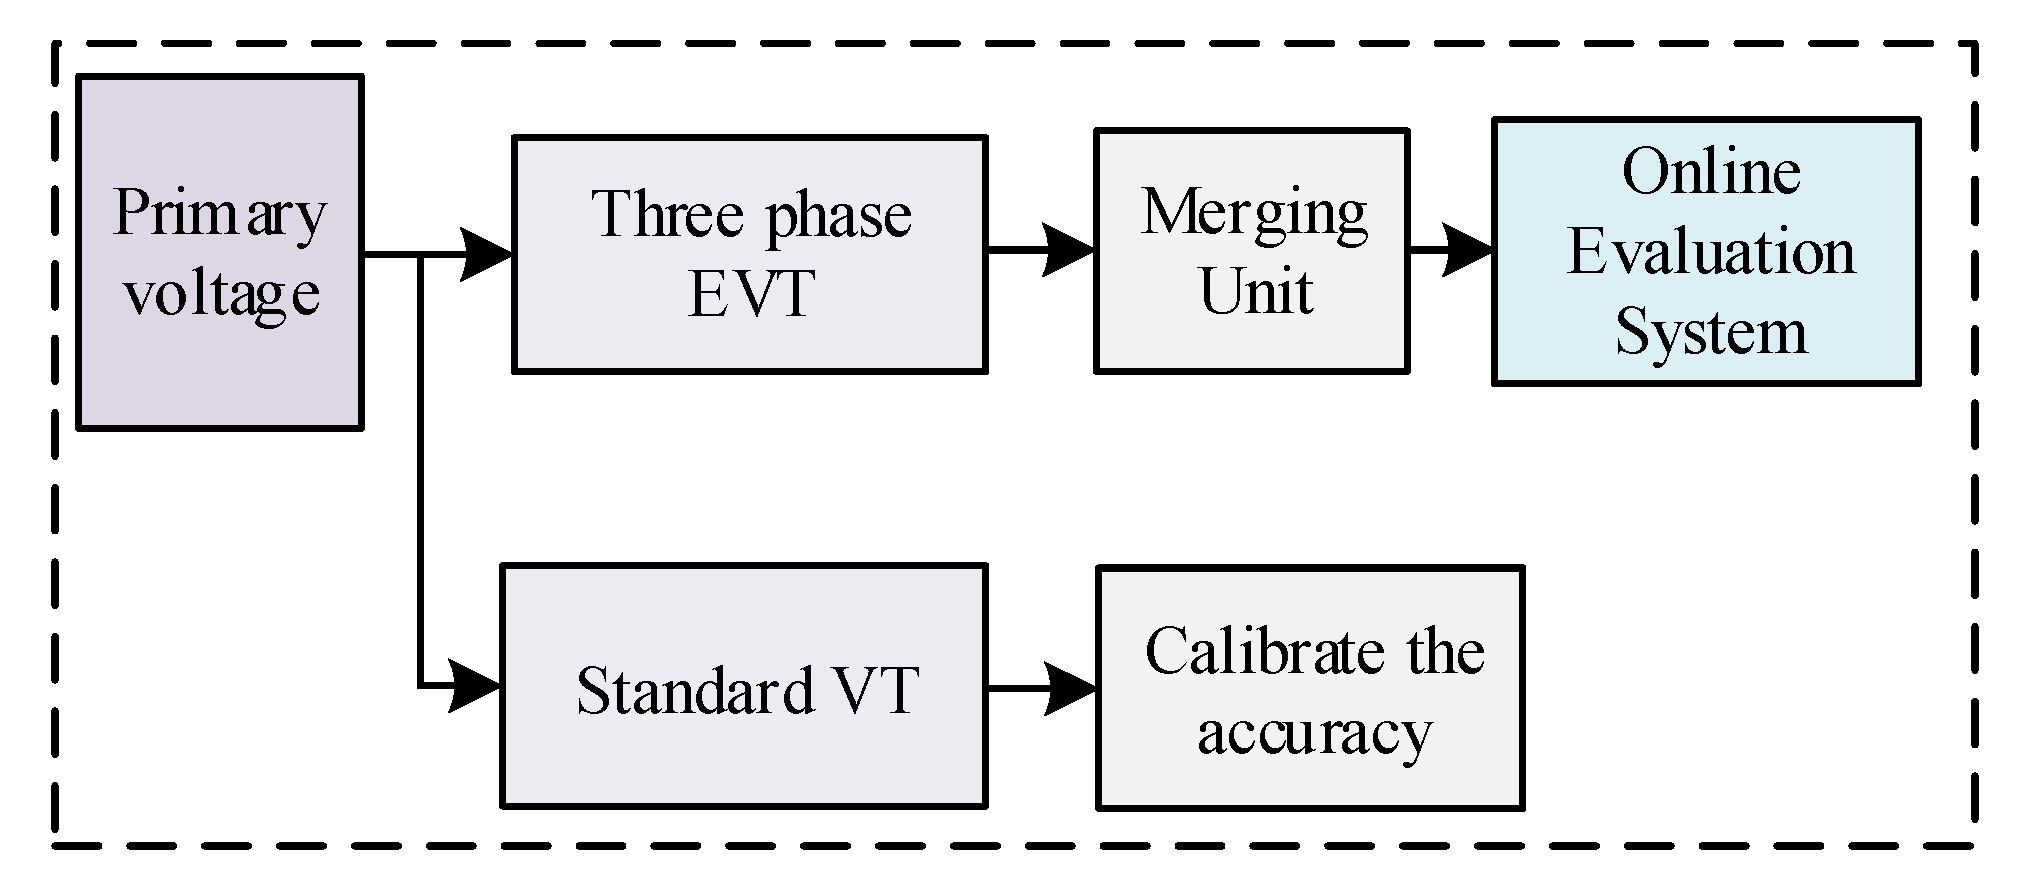
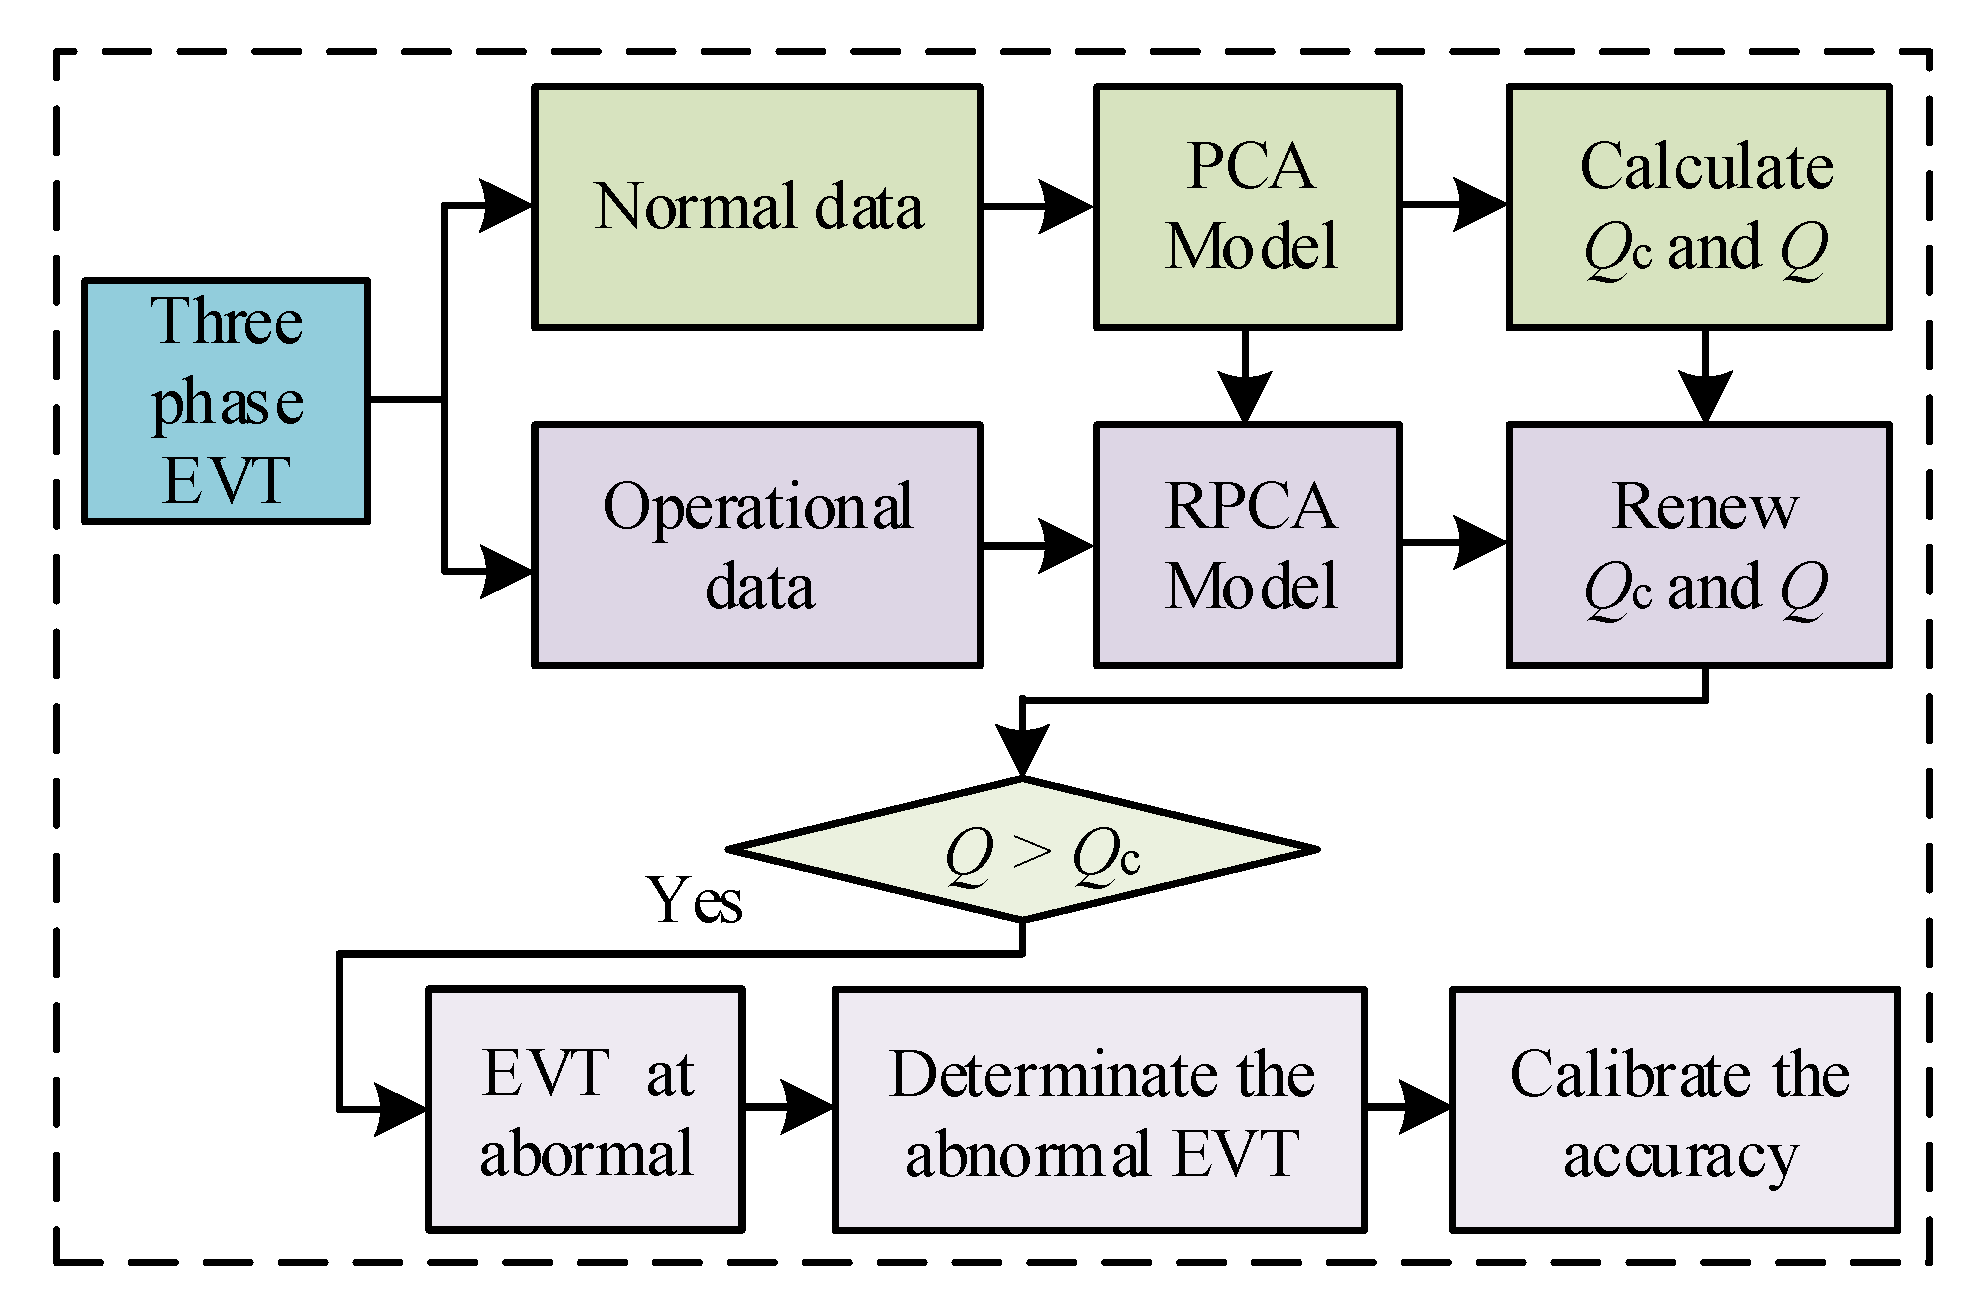
4.1. Design of Experiment

The measurement error of the EVT with Class 0.2, shown in Figure 1, is evaluated based on the RPCA.
In the proposed evaluation method, the output of the EVT is fed into a merging unit. The ratio error of the EVT is calculated using a standard transformer operating in parallel with the EVT, as shown in Figure 1. The process of the proposed online evaluation of the EVT is divided into offline learning using PCA and online learning through RPCA, as shown in Figure 2. The initial principal component model is established by PCA, and then the model is recursively updated by RPCA. The tasks of the two developed models are briefly elaborated below:
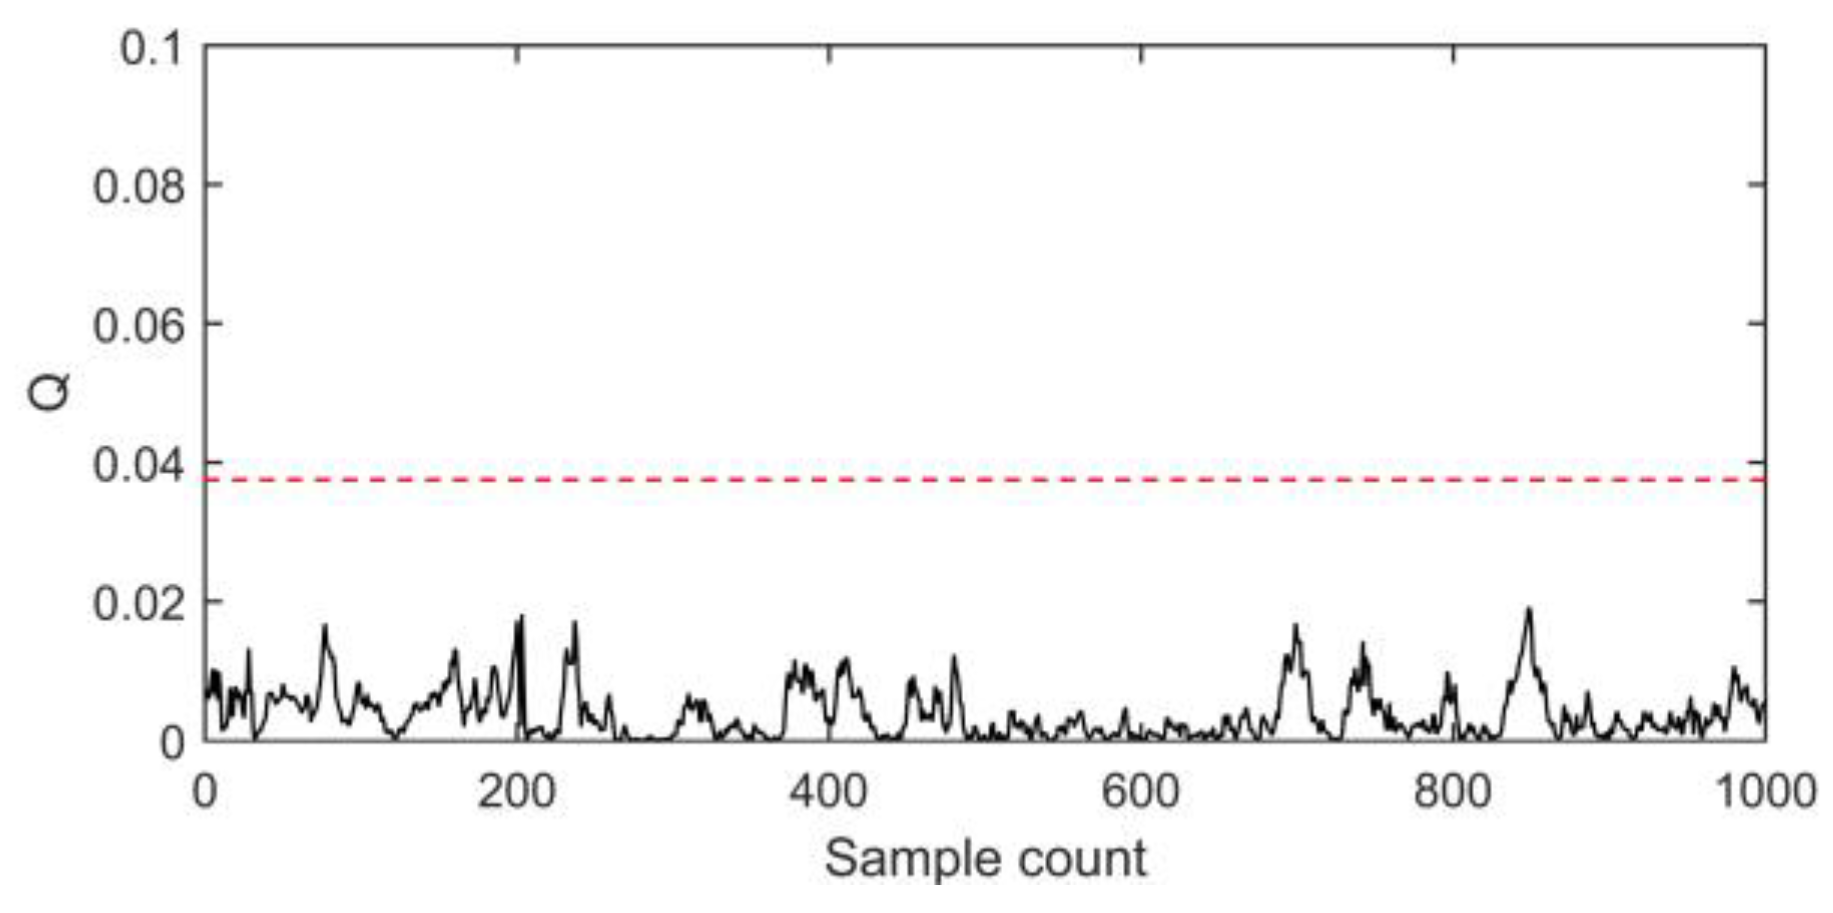
  • Offline learning by PCA:
    • Obtain normal operation data; Calculate mean b 0 and covariance matrix R 0 ;
    • Calculate the Q-statistic and its control limit Q c .
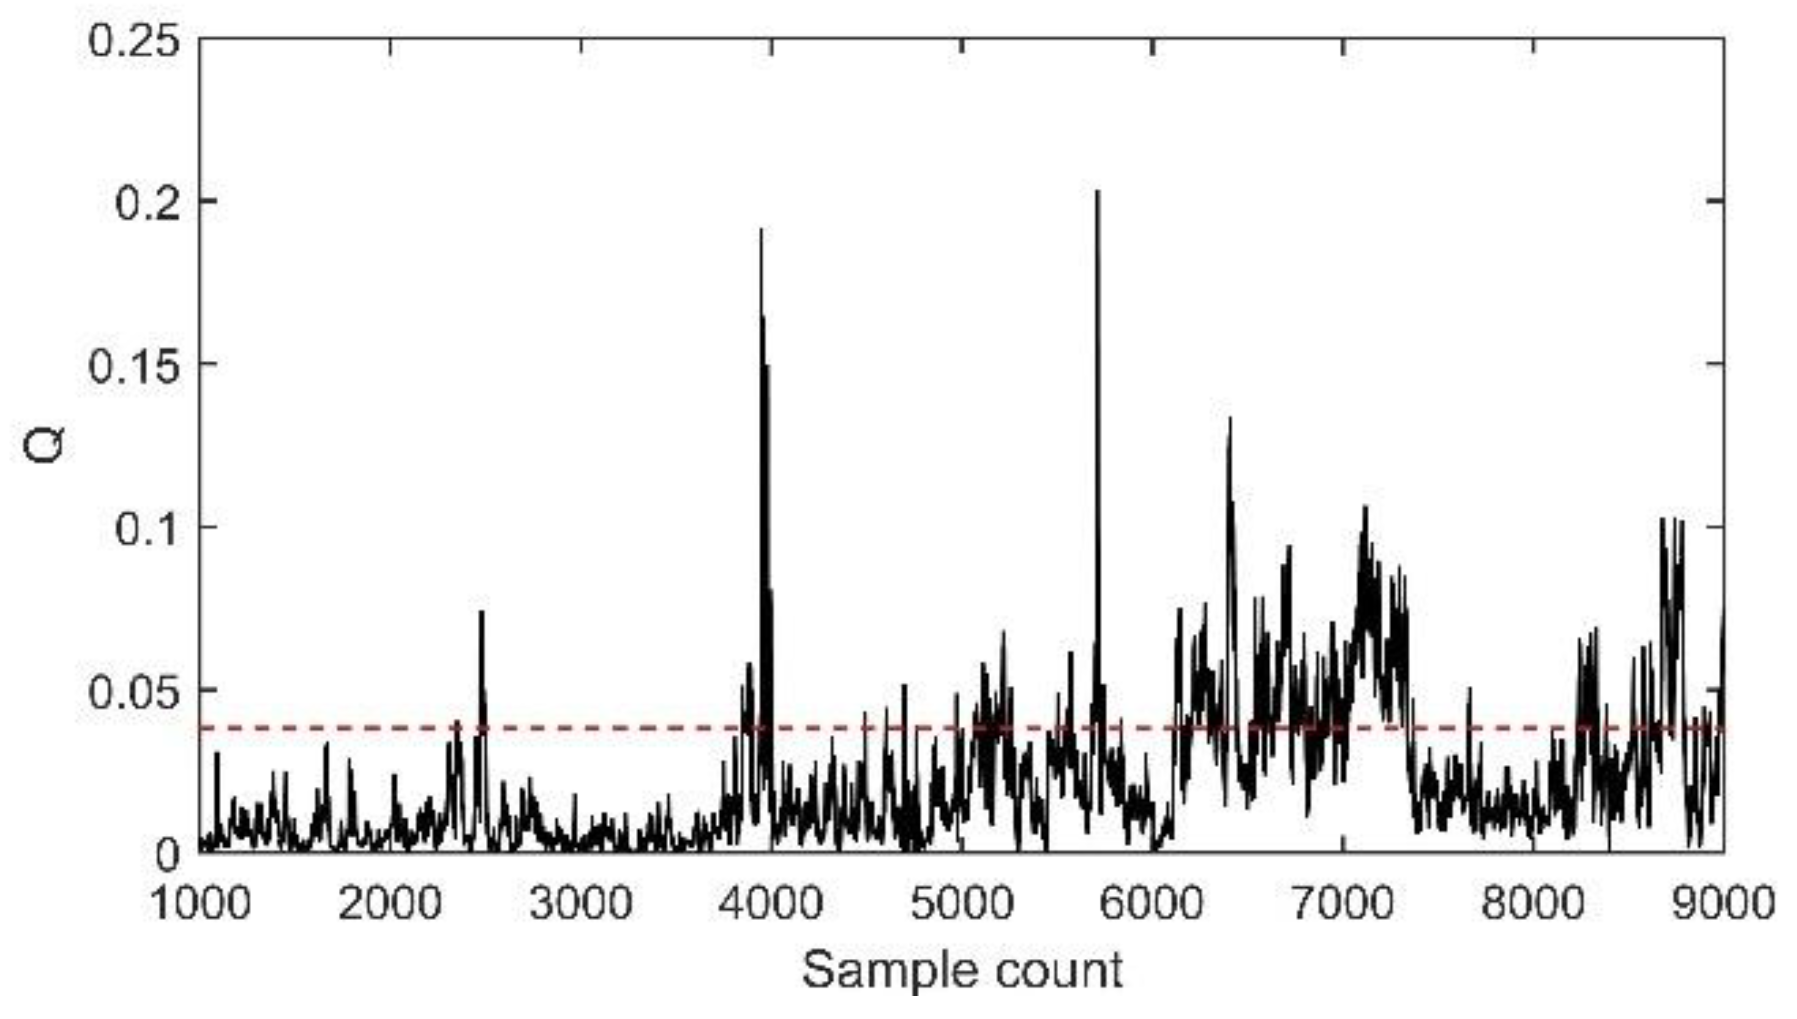
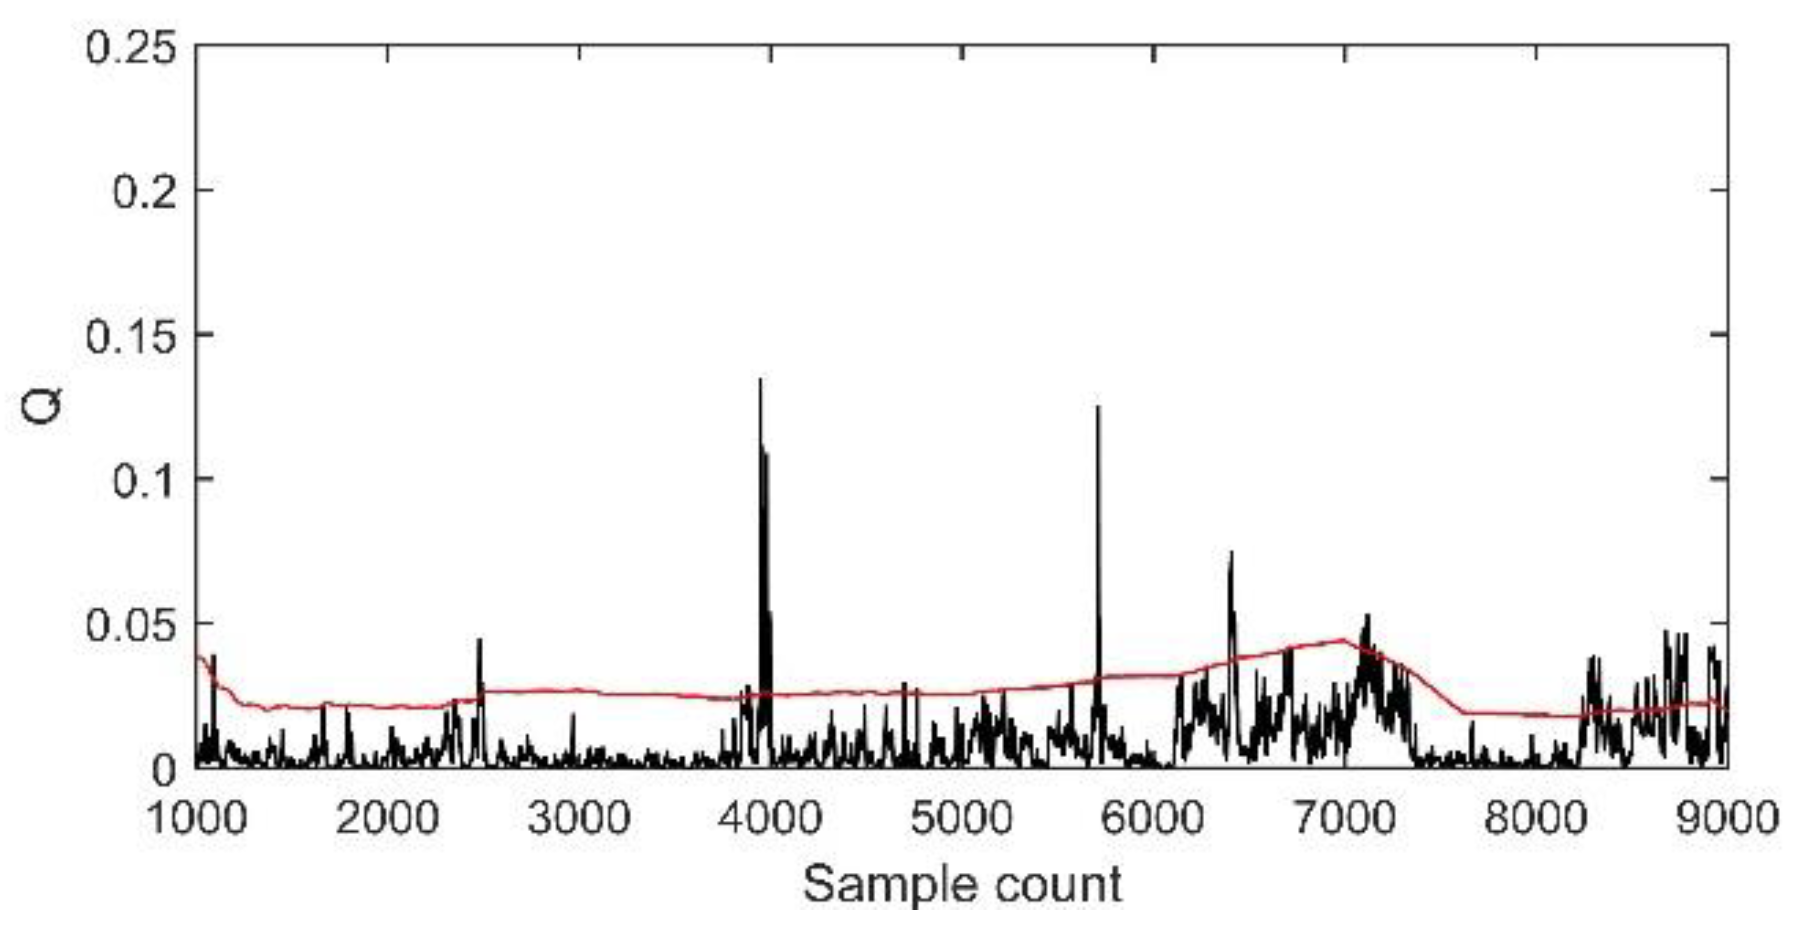
  • Online learning by RPCA:
    • Recursively renew the mean b k + 1 , covariance matrix R k + 1 and principal component model of PCA;
    • Recursively update Q-statistic and its control limit Q c ;
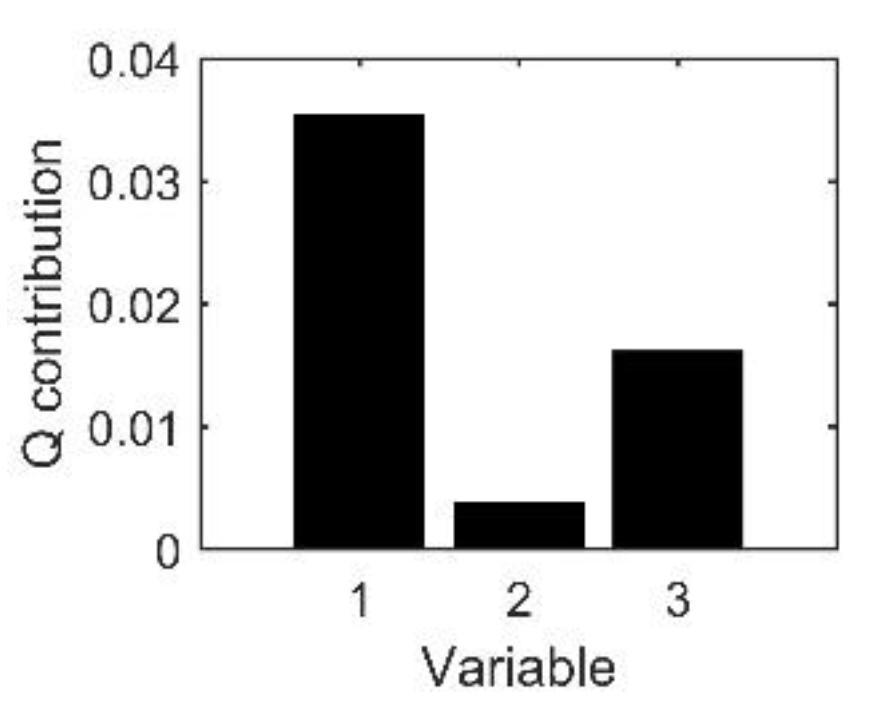
    • Determinate the abnormal phase of the EVT using the contribution rate method.

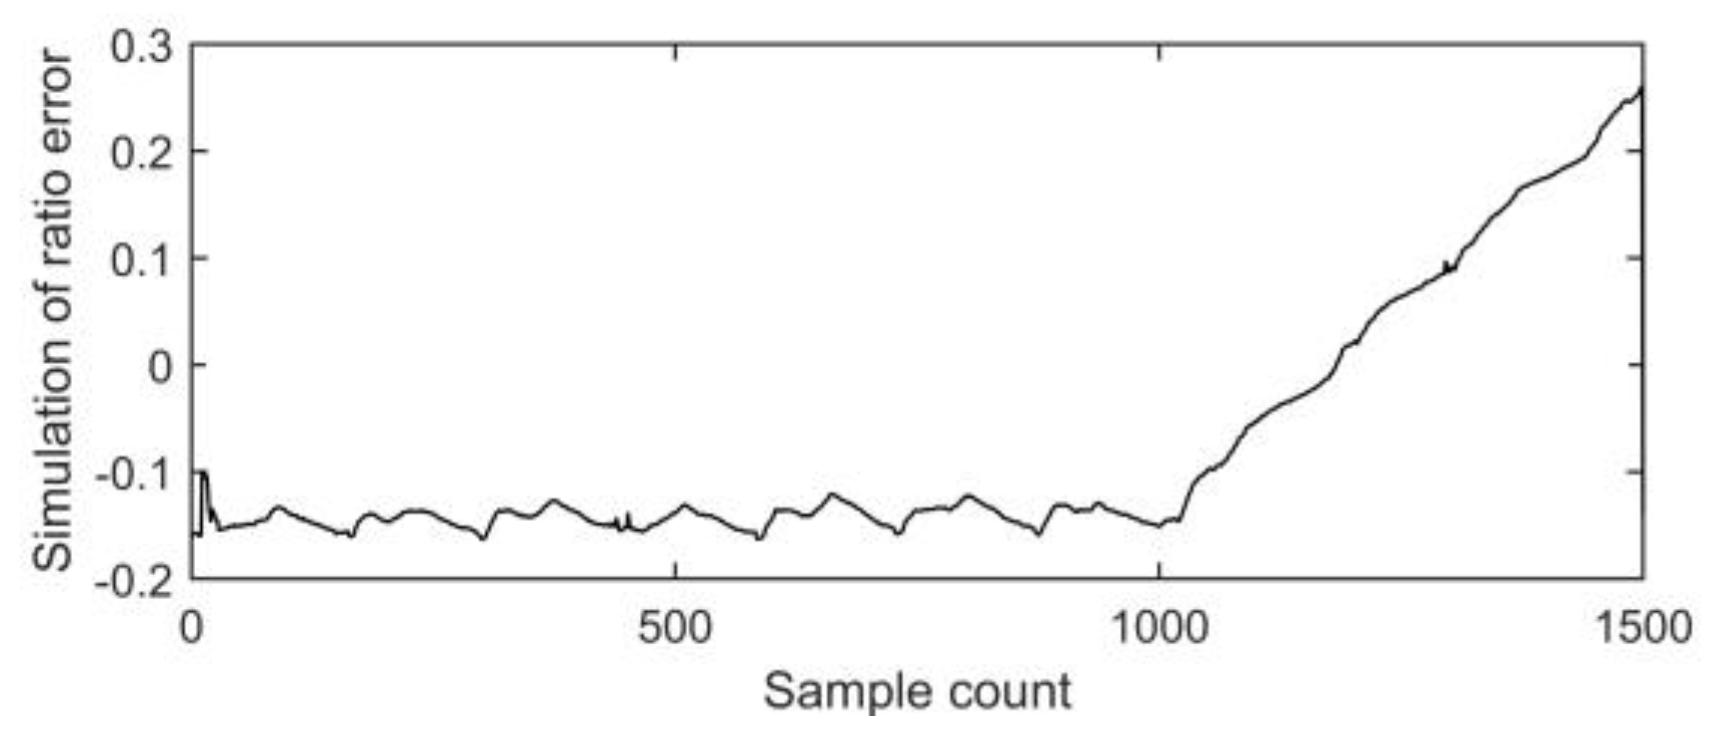
4.2. Fault Simulation

A variable resistance is connected in series with phase-A of the EVT secondary side to simulate the change of the EVT output ratio error. Hence, testing the effectiveness of the developed PCA model. The data for the phase-A ratio error, shown in Figure 3, are plotted using a standard calibration system. The first 1000 points are measured during normal operation, while the subsequent 500 points are measured during a fault that is simulated by changing the connected series resistance. The status of the EVT is evaluated by calculating the Q-statistic, as shown in Figure 4. It can be seen from Figure 4 that when the ratio error exhibits a significant drift, the method based on the PCA can clearly show that the ratio error violating the standard of Class 0.2.

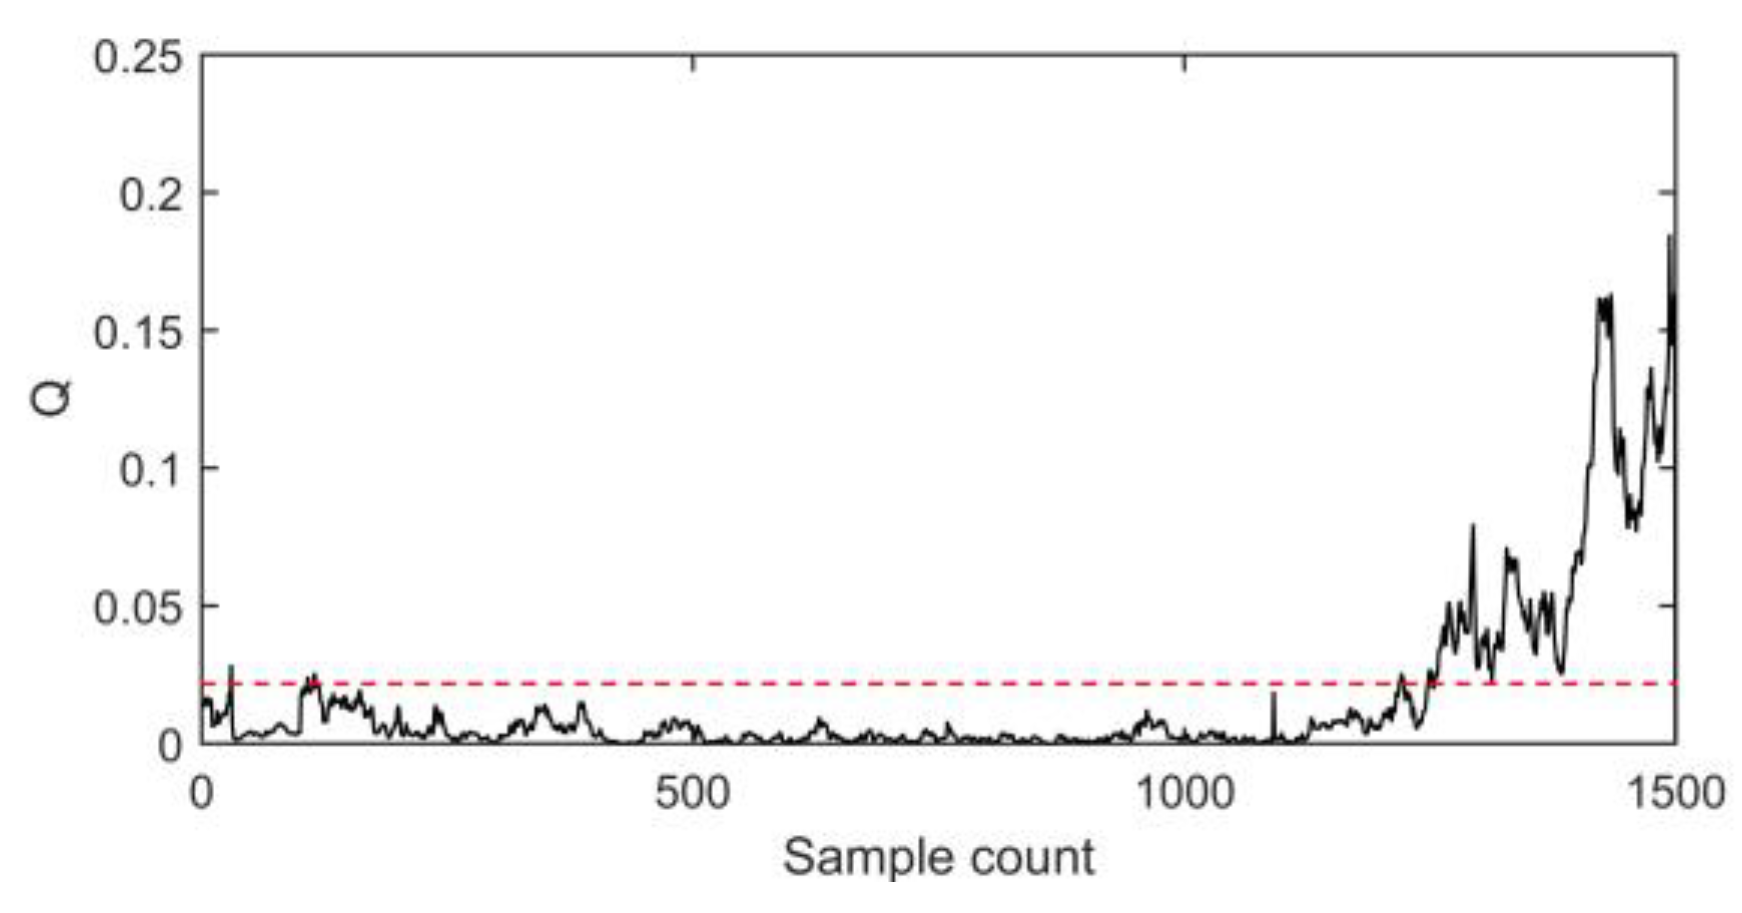
4.3. Online Evaluation Results

The 9000 sample points of the three phase output signals of Class 0.2 EVT, shown in Figure 5, are collected at an interval of 10 min and are used as the input of the developed online evaluation system. The first 1000 points of the collected data are used for training, while the remaining 8000 are used for the online evaluation. For the initial training model, the principal component subspace contains the fluctuation of EVT secondary output caused by the normal fluctuation of the power grid, and the residual subspace contains the measurement error of EVT. The control limit of Q-statistic is calculated as 0.0375 at a significance level of 0.99. The number of principal components is one.
The Q-statistic of the initial model by the PCA is shown in Figure 6. The traditional principal component model of the PCA is employed to evaluate the EVT, as shown in Figure 7. It can be seen that at the sample points 6100–7200 and 8300–9000, a large number of the Q-statistic data exceeds the control limit Qc. During these two periods, the EVT is classified as abnormal. However, the ratio error of the faulty phase in Figure 8 does not exceed the limit or fluctuate at the sample points 6100–7200 which is not consistent with the results of the PCA in Figure 7. This inconsistency is attributed to the fact that the principal component model of the traditional PCA is not updated with the new received data which results in the control limit remaining unchanged. Therefore, it is not accurate to evaluate the EVT by the traditional PCA.
The proposed online evaluation technique based on the RPCA is then employed to calculate the Q-statistic using the same collected data, as shown in Figure 9. According to the principle of RPCA, the Q-statistic of the initial model by the RPCA is consistent with the PCA; the data length of Q-statistic is increasing with the new data. In contrary with the traditional PCA method, the control limit is updated based on the new received data and as such, no violation to the limit can be seen at the sample points 6100–7200 which is consistent with the results of the EVT ratio error shown in Figure 8. On the other hand, the fluctuation trend can be observed that at the sample points 8300–9000, the Q-statistic has a lot of data beyond its control limit. By using the Q contribution rate method, as shown in Figure 10, the faulty phase-A of the EVT can be identified. From Figure 8, the fluctuation trend of phase-A of the EVT is more than the Class 0.2 accuracy at the sample points 8300–9000, which is again consistent with the results of the RPCA model. Among the influencing parameters on the performance of the EVT, humidity, vibration, and magnetic field interference have a smooth and insignificant impact, while the temperature has obvious impact, as shown in Figure 11. The ratio error of phase-A of the EVT exceeds the limit, which may be caused by a temperature drop.
Compared with the PCA, the principal component model of the RPCA is recursively updated with the input of new data, which effectively reduces the misjudgment of the operating EVT. Supposing that the sampling interval is properly increased from the frequency of 10 min, the number of data will be reduced in the same operation time of EVT. The trend of Q-statistic calculated by the two different sampling frequency of data is approximately consistent. Thus, the number of data samples controlled by frequency is irrelevant to the performance of the RPCA.
According to the “DL/T 1958–2018” standard in China, the maintenance cycle of the EVT is from 1 to 2 years. The principal component model of RPCA is increasing with the input of new data, which leads to a significant increase in the number of calculations. This issue can be solved by resetting and establishing a new initial PCA model after each maintenance cycle using the voltage data before the maintenance.

5. Conclusions

For evaluating the accuracy of the EVT online, the physical characteristics of the power grid are firstly analyzed. Then the metering error of EVT and the primary fluctuation of the power grid are separated using PCA in which the Q-statistic and its control limit are calculated to monitor the condition of the EVT. Meanwhile, the proposed RPCA is used to evaluate the EVT performance over a long operating duration, to reduce the possibility of misjudgment and to overcome the issue the time-invariant nature of the traditional PCA principal component model. Results show that the proposed RPCA can effectively assess the condition of the EVT of Class 0.2. Compared with the traditional method, the proposed technique can be applied without using a calibration device containing a standard transformer. By employing the proposed technique, the dynamic change of the EVT measurement error can be evaluated in real time which facilitates the proper diagnosis and asset management for the operating EVT.

Author Contributions

Z.L. provided the main idea for this paper, designed the proposed online evaluation method and wrote the paper. H.L. provided the equipment. Y.Z., A.A.-S., Y.X., and M.L. participated in the test and conducted the test data collection. All authors have read and agreed to the published version of the manuscript.

Funding

This research was funded by the Key Project of Hubei Provincial Department of Education, grant number D20201203.

Conflicts of Interest

The authors declare no conflict of interest.

References

  1. Wu, W.; Xu, Y.; Xiao, X.; Hu, H. Research on proximity effect in measuring error of active electronic voltage transformers. IEEE Trans. Instrum. Meas. 2016, 65, 78–87. [Google Scholar] [CrossRef]
  2. Li, Z.; Xiang, X.; Hu, T.; Abu-Siada, A.; Li, Z.; Xu, Y. An improved digital integral algorithm to enhance the measurement accuracy of Rogowski coil-based electronic transformers. Int. J. Electr. Power Energy Syst. 2020, 188, 105806. [Google Scholar] [CrossRef]
  3. Zhu, B.; Ding, F.; Vilathgamuwa, D.M. Coat circuits for DC-DC converters to improve Voltage conversion ratio. IEEE Trans. Power Electron. 2019, 35, 3679–3687. [Google Scholar] [CrossRef]
  4. Chen, K.; Wan, R.; Guo, Y.; Chen, N.; Lee, W. A redundancy mechanism design for Hall-based electronic current transformers. Energies 2017, 10, 312. [Google Scholar] [CrossRef] [Green Version]
  5. Liu, H.; Wang, K.; Yang, Q.; Yin, L.; Huang, J. On-Line Detection of Voltage Transformer Insulation Defects Using the Low-Frequency Oscillation Amplitude and Duration of a Zero Sequence Voltage. Energies 2019, 12, 619. [Google Scholar] [CrossRef] [Green Version]
  6. Ruan, S.; Wang, D.; Xu, K.; Xu, H.; Li, F.; Lü, P. ECT Fault Statistical Analysis of DC Transmission System. Power Syst. Technol. 2018, 42, 3170–3175. [Google Scholar]
  7. Li, Z.; Jiang, W.; Abu-Siada, A.; Li, Z.; Xu, Y.; Liu, S. Research on a composite voltage and current measurement device for HVDC networks. IEEE Trans. Ind. Electron. 2020. [Google Scholar] [CrossRef]
  8. Liu, Y.; Yang, N.; Dong, B.; Wu, L.; Yan, J.; Shen, X.; Xing, C.; Liu, S.; Huang, Y. Multi-lateral Participants Decision-making: A Distribution System Planning Approach with Incomplete Information Game. IEEE Access 2020. [Google Scholar] [CrossRef]
  9. Li, Q.; Lu, S.; Yang, S.; Li, H.; Li, D. Comparsion of two electronic transformer error measuring methods. High Volt. Eng. 2011, 37, 3022–3027. [Google Scholar]
  10. Djokic, B.; So, E. Calibration system for electronic instrument transformers with digital output. IEEE Trans. Instrum. Meas. 2005, 54, 479–482. [Google Scholar] [CrossRef]
  11. Li, Z.; Li, H.; Zhang, Z.; Luo, P. An Online Calibration Method for Electronic Voltage Transformers Based on IEC 61850-9-2. MAPAN J. Metrol. Soc. India 2014, 29, 97–105. [Google Scholar] [CrossRef]
  12. Hu, C.; Chen, M.; Li, H.; Zhang, Z.; Jiao, Y.; Shao, H. An accurate on-site calibration system for electronic voltage transformers using a standard capacitor. Meas. Sci. Technol. 2018, 29, 055901. [Google Scholar] [CrossRef]
  13. Xiong, X.; He, N.; Yu, J.; Chen, X.; Zi, M.; Hu, Z. Diagnosis of Abrupt-Changing Fault of Electronic Instrument Transformer in Digital Substation Based on Wavelet Transform. Power Syst. Technol. 2010, 34, 181–185. [Google Scholar]
  14. Jiang, Y.; Wang, J.; Li, J.; Yu, W.; Chen, B. Application of Artificial Neural Network to Fault Diagnosis for Optical Voltage Transformer. Proc. CSU-EPSA 2018, 30, 134–139. [Google Scholar]
  15. Lei, T.; Faifer, M.; Ottoboni, R.; Toscani, S. On-line fault detection technique for voltage transformers. Measurement 2017, 108, 193–200. [Google Scholar] [CrossRef]
  16. Liu, J.; Pei, J.; Tian, M.; Zhu, X. Research on nonlinear correction method of current transformer based on support vector machine. Electr. Mach. Control. 2020, 24, 130–138. [Google Scholar]
  17. Reza, M.S.; Sadeque, F.; Hossain, M.M.; Ghias, A.M.Y.M.; Agelidis, V.G. Three-Phase PLL for Grid-Connected Power Converters under Both Amplitude and Phase Unbalanced Conditions. IEEE Trans. Ind. Electron. 2019, 66, 8881–8891. [Google Scholar] [CrossRef]
  18. Zhang, Z.; Li, H.; Tang, D.; Hu, D.; Hu, C.; Jiao, Y. Monitoring the metering performance of electronic voltage transformer on-line based on cyber-physics correlation analysis. Meas. Sci. Technol. 2017, 28, 105015. [Google Scholar] [CrossRef] [Green Version]
  19. Bianchi, F.M.; De Santis, E.; Rizzi, A.; Sadeghian, A. Short-Term Electric Load Forecasting Using Echo State Networks and PCA Decomposition. IEEE Access 2015, 3, 1931–1943. [Google Scholar] [CrossRef]
  20. Li, W.; Yue, H.; Valle-Cervantes, S.; Qin, S. Recursive PCA for adaptive process monitoring. J. Process Control 2000, 10, 471–486. [Google Scholar] [CrossRef]
Figure 1. Schematic diagram of the field test. EVT: electronic voltage transformer. VT: voltage transformer
Energies 13 05576 g001
Figure 2. Proposed online evaluation of the EVT.
Energies 13 05576 g002
Figure 3. The ratio error of EVT phase-A with simulated fault.
Energies 13 05576 g003
Figure 4. The Q-statistic of EVT based on the PCA model.
Energies 13 05576 g004
Figure 5. Collected measured data of the EVT.
Energies 13 05576 g005
Figure 6. The Q-statistic of the EVT based on traditional PCA.
Energies 13 05576 g006
Figure 7. The Q-statistic of the EVT based on traditional PCA.
Energies 13 05576 g007
Figure 8. The ratio error of the EVT.
Energies 13 05576 g008
Figure 9. The Q-statistic of the EVT based on the proposed RPCA.
Energies 13 05576 g009
Figure 10. The contribution rate of Q.
Energies 13 05576 g010
Figure 11. Impact of ambient temperature on the EVT.
Energies 13 05576 g011
Table 1. Parameters of recursive principal components analysis (RPCA) Model.
SymbolParameterSymbolParameter
b k vector of mean R k covariance matrix
k standard deviation matrix Λ k eigenvalue matrix
X k standard data matrix P k load matrix
Publisher’s Note: MDPI stays neutral with regard to jurisdictional claims in published maps and institutional affiliations.

