Review

Laboratory Measurements of the Relative Permeability of Coal: A Review

1
State Key Laboratory of Geomechanics and Geotechnical Engineering, Institute of Rock and Soil Mechanics, Chinese Academy of Sciences, Wuhan 430071, China
2
University of Chinese Academy of Sciences, Beijing 100049, China
*
Author to whom correspondence should be addressed.
Energies 2020, 13(21), 5568; https://doi.org/10.3390/en13215568
Submission received: 6 September 2020 / Revised: 17 October 2020 / Accepted: 21 October 2020 / Published: 23 October 2020

Abstract

:
The relative permeability of coal to gas and water is an essential parameter for characterizing coalbed methane (CBM) reservoirs and predicting coal seam gas production, particularly in numerical simulations. Although a variety of studies related to the relative permeability of coals have been conducted, the results hardly meet the needs of practical engineering applications. To track the dynamic development of relative permeability measurements in the laboratory, discover the deficiencies, and discuss further work in this field, this paper investigates the relative permeability measurement preparation work and laboratory methods and summarizes the development of techniques used to determine the water saturation during experimentation. The previously determined relative permeability curves are also assembled and classified according to coal rank and the absolute permeability. It is found that the general operations in the relative permeability measurement process are still not standardized. The techniques applied to determine the water saturation of coal in experiments have been refined to some extent, but no optimal technique has been recognized yet. New techniques, such as the incorporation of high-precision differential pressure gauges, can be used to determine the water production during relative permeability measurement. In addition, the existing relative permeability data are limited, and no study has focused on supercritical carbon dioxide-water and mixed gas (methane and carbon dioxide)-water relative permeability measurements. To meet the requirements of actual projects, further research on this topic must be conducted.

1. Introduction

Coalbed methane (CBM) is one of the major unconventional gas resources in the world, estimated to be 256.1 × 10¹² m3 at the global level [1]. CBM recovery has gained increasing attention due to the related benefits of improving coal mining safety, providing clean energy, and reducing greenhouse gas emissions [2,3,4]. Currently, commercial CBM exploitation has been carried out in the United States, Australia, China, and Canada [2], and the development of CBM in those countries has been reviewed by Hein et al. [5].
It is well accepted that methane is the major component of CBM and is mainly absorbed on the surface of the matrix of coal particles. Unlike conventional gas reservoirs, coal seams are both reservoirs and sources for CBM [6]. Commonly, coal is considered a double-porosity medium composed of a matrix and cleat system [7,8,9] with unique pore structure and adsorption characteristics [10,11]. Normally, substantial quantities of gas are physically absorbed in the pore system of the coal matrix [12,13,14], and the cleats are saturated with water [15]. Gas adsorption and diffusion mainly occur in the coal matrix [16], and cleats provide a pathway for fluid flow [8,11,13,17]. CBM has been traditionally recovered by the method of reservoir pressure depletion. During the recovery of CBM, dewatering is initiated to decrease the pressure of the reservoir and release adsorbed gas from the matrix into the cleat system [15,18]. When the pressure of the reservoir drops to a certain value, a large amount of methane will desorb and flow to the production well together with water. According to the transport behavior of fluids in coal reservoirs, CBM production from coal seams may experience four stages (as shown in Figure 1) [19]. In stage 1, the pressure of the coal seam is still higher than the critical desorption pressure of methane; thus, only water flows to the production well. In stage 2, although some of the methane desorbs from the coal matrix and forms bubbles, the gas in the water is not saturated and fails to form a continuous flow. When the reservoir pressure is further reduced, more methane gas will desorb and diffuse into the cleat system, and the bubbles will connect to form a stable and continuous flow, as shown in Figure 1c. Then, CBM production enters stage 3, which is called the gas-water two-phase flow stage. When the output of water is not continuous, CBM production enters stage 4, in which the gas flow is accompanied by water vapor. In the process of CBM extraction, methane and water flow together for a long period. The transport behavior of the fluid in the reservoir rock is complex and is difficult to describe by theory alone [20]. The relative permeability, which is usually defined as the ratio of effective permeability to absolute permeability, is often used to describe the transportability of each phase in the multiphase flow system. Thus, accurate determination of the relative permeability of coal is of great significance to CBM prediction and production.
Since the 1970s, many scholars have begun to pay attention to the relative permeability of coal and have carried out a considerable amount of research to further understand the transport behavior of gas and water in the process of CBM production and provide guidance for CBM exploitation. Due to the differences in the formation and burial conditions of different coal seams, the composition and pore structure of coals of different rank vary [21,22]. Shen et al. [23] measured the relative permeability of coals with different ranks and expressed an empirical methane-water relative permeability model that can reflect the influence of coal properties on relative permeability based on the measured results of relative permeability and the analysis of coal composition. Additionally, the pore pressure gradually decreases with the continuous discharge of water and gas in the process of CBM production, and the permeability of coal exhibits strong stress dependency [24,25]. Therefore, it is important to explore the variation trend of coal relative permeability under different stress conditions. A variety of experiments have been conducted to study the variation in coal relative permeability with overburden pressure [26], confining pressure [27,28,29,30,31,32,33], and effective stress [34]. The variation in the relative permeability curve under different axial pressures and confining pressures was also studied by Wang et al. [35]. However, the results are still inconclusive, and more efforts are warranted. In addition, enhanced coalbed methane (ECBM) recovery involves the injection of nitrogen and/or carbon dioxide [36,37,38,39]. It is necessary to research the relative permeability of coal with different fluids. Carbon dioxide was used in the two-phase flow test experiments conducted by Zhang [40], Ham [41], and Alexis et al. [30]. Ham [41] pointed out that the gas type and pressure have a complex effect on the gas-water relative permeabilities. For adsorbing gases (methane and carbon dioxide), the higher the air pressure is, the stronger the water wettability of the coal; for nonadsorbing gases (helium), high pressure prevents the water from flowing into small pores, resulting in a decrease in the irreducible water saturation, which was also observed by Gao et al. [42]. Recently, Zhang [40] and Wang et al. [35] also investigated the seepage characteristics of nitrogen-water flow in coal. However, research on the relative permeability of nitrogen-water or carbon dioxide-water in coal is still limited, and the difference in the relative permeability curves measured during tests with different fluids has not been studied comprehensively.
Although some work related to coal relative permeability has been carried out in the past decades, such work can barely keep up with the rate of CBM and ECBM projects developed worldwide [43]. Zhang et al. [43] gave a summary of relative permeability measurement methods, relative permeability models and factors that varies relative permeability curves in 2015. Future studies concerning the coal relative permeabilities were also anticipated by them. However, due to the difficulty in measuring the relative permeability of coal, the existing relative permeability data are still limited, and the accuracy of the data obtained by different techniques needs to be further investigated. To track the dynamic development of relative permeability measurements in the laboratory, this article provides a comprehensive review of laboratory coal relative permeability measurements, including preparation work, measurement methods, measurement devices, and measurement results. Further work in the field of coal relative permeability research is also discussed.

2. Relative Permeability Measurement of Coal

Methods for obtaining the gas–water permeability of coal can be classified into field data analysis methods and laboratory experimental measurement methods. The relative permeability measurements in this paper mainly refer to those obtained by the laboratory experimental measurement method. Similar to the conventional relative permeability measurement method in the petroleum industry, methods for measuring the relative permeability of coal in the laboratory mainly include the steady-state method, unsteady-state method, and capillary pressure method. However, due to the natural characteristics of coal, such as friability, heterogeneity, low porosity, stress-dependent permeability, and gas adsorption, relative permeability measurements are more difficult to obtain for coal than for conventional reservoir rock [44]. In this section, the preparation work that needs to be conducted before the relative permeability measurement is introduced first, and then the method normally used in the laboratory is presented. The typically used devices, which were developed by several researchers, are also reviewed, and the relative permeability curves are classified according to the coal rank and absolute permeability. Some measurements of coal relative permeability have already been conducted by other researchers, and that information is summarized in Table 1.

2.1. Preparation Work

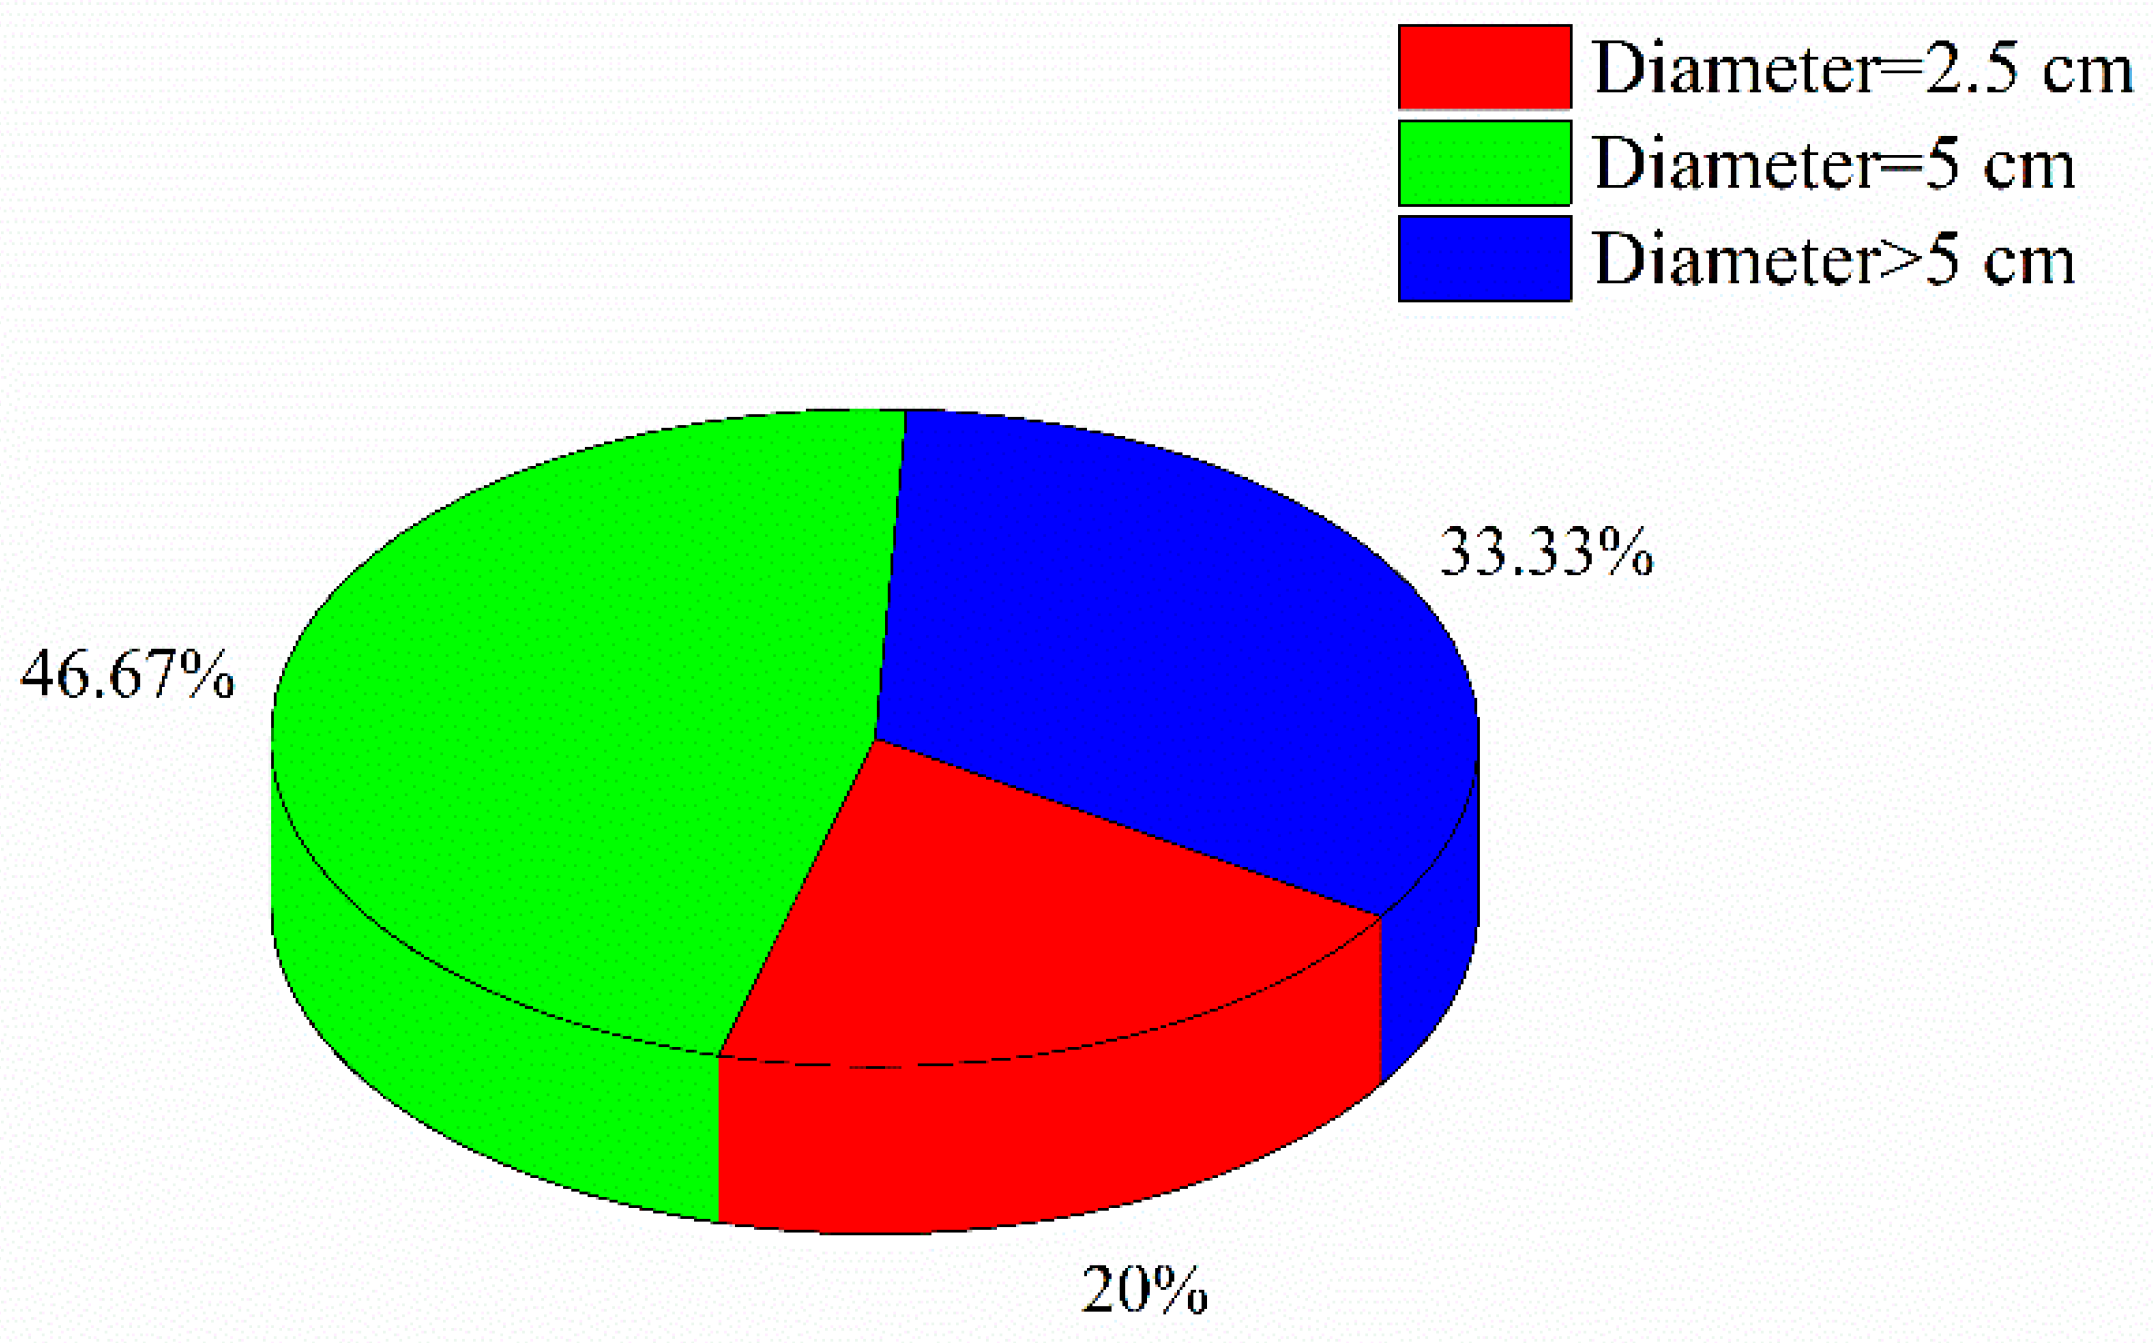
2.1.1. Sample Selection

Before the test of relative permeability, one of the significant tasks is to select a representative sample. It is generally believed that the larger the size of the coal sample is, the more cleat systems will be contained, and the measurement result will be more representative. Additionally, for coal, the deformation caused by gas adsorption occurs in regions that are related to the maceral composition of the coal [45,46]. Thus, the gas–water relative permeability measurement results may relate to the sample size selected. The frequency of the sample size selected in previous studies is shown in Figure 2, which is counted based on the database of Table 1. The diameter of a cylindrical coal sample used in a relative permeability measurement can be classified into three groups, 25 mm, 50 mm, and larger than 50 mm, because the sizes used in studies are inconsistent. Many researchers (approximately 47%) choose coal samples with a diameter of 50 mm for relative permeability measurement.

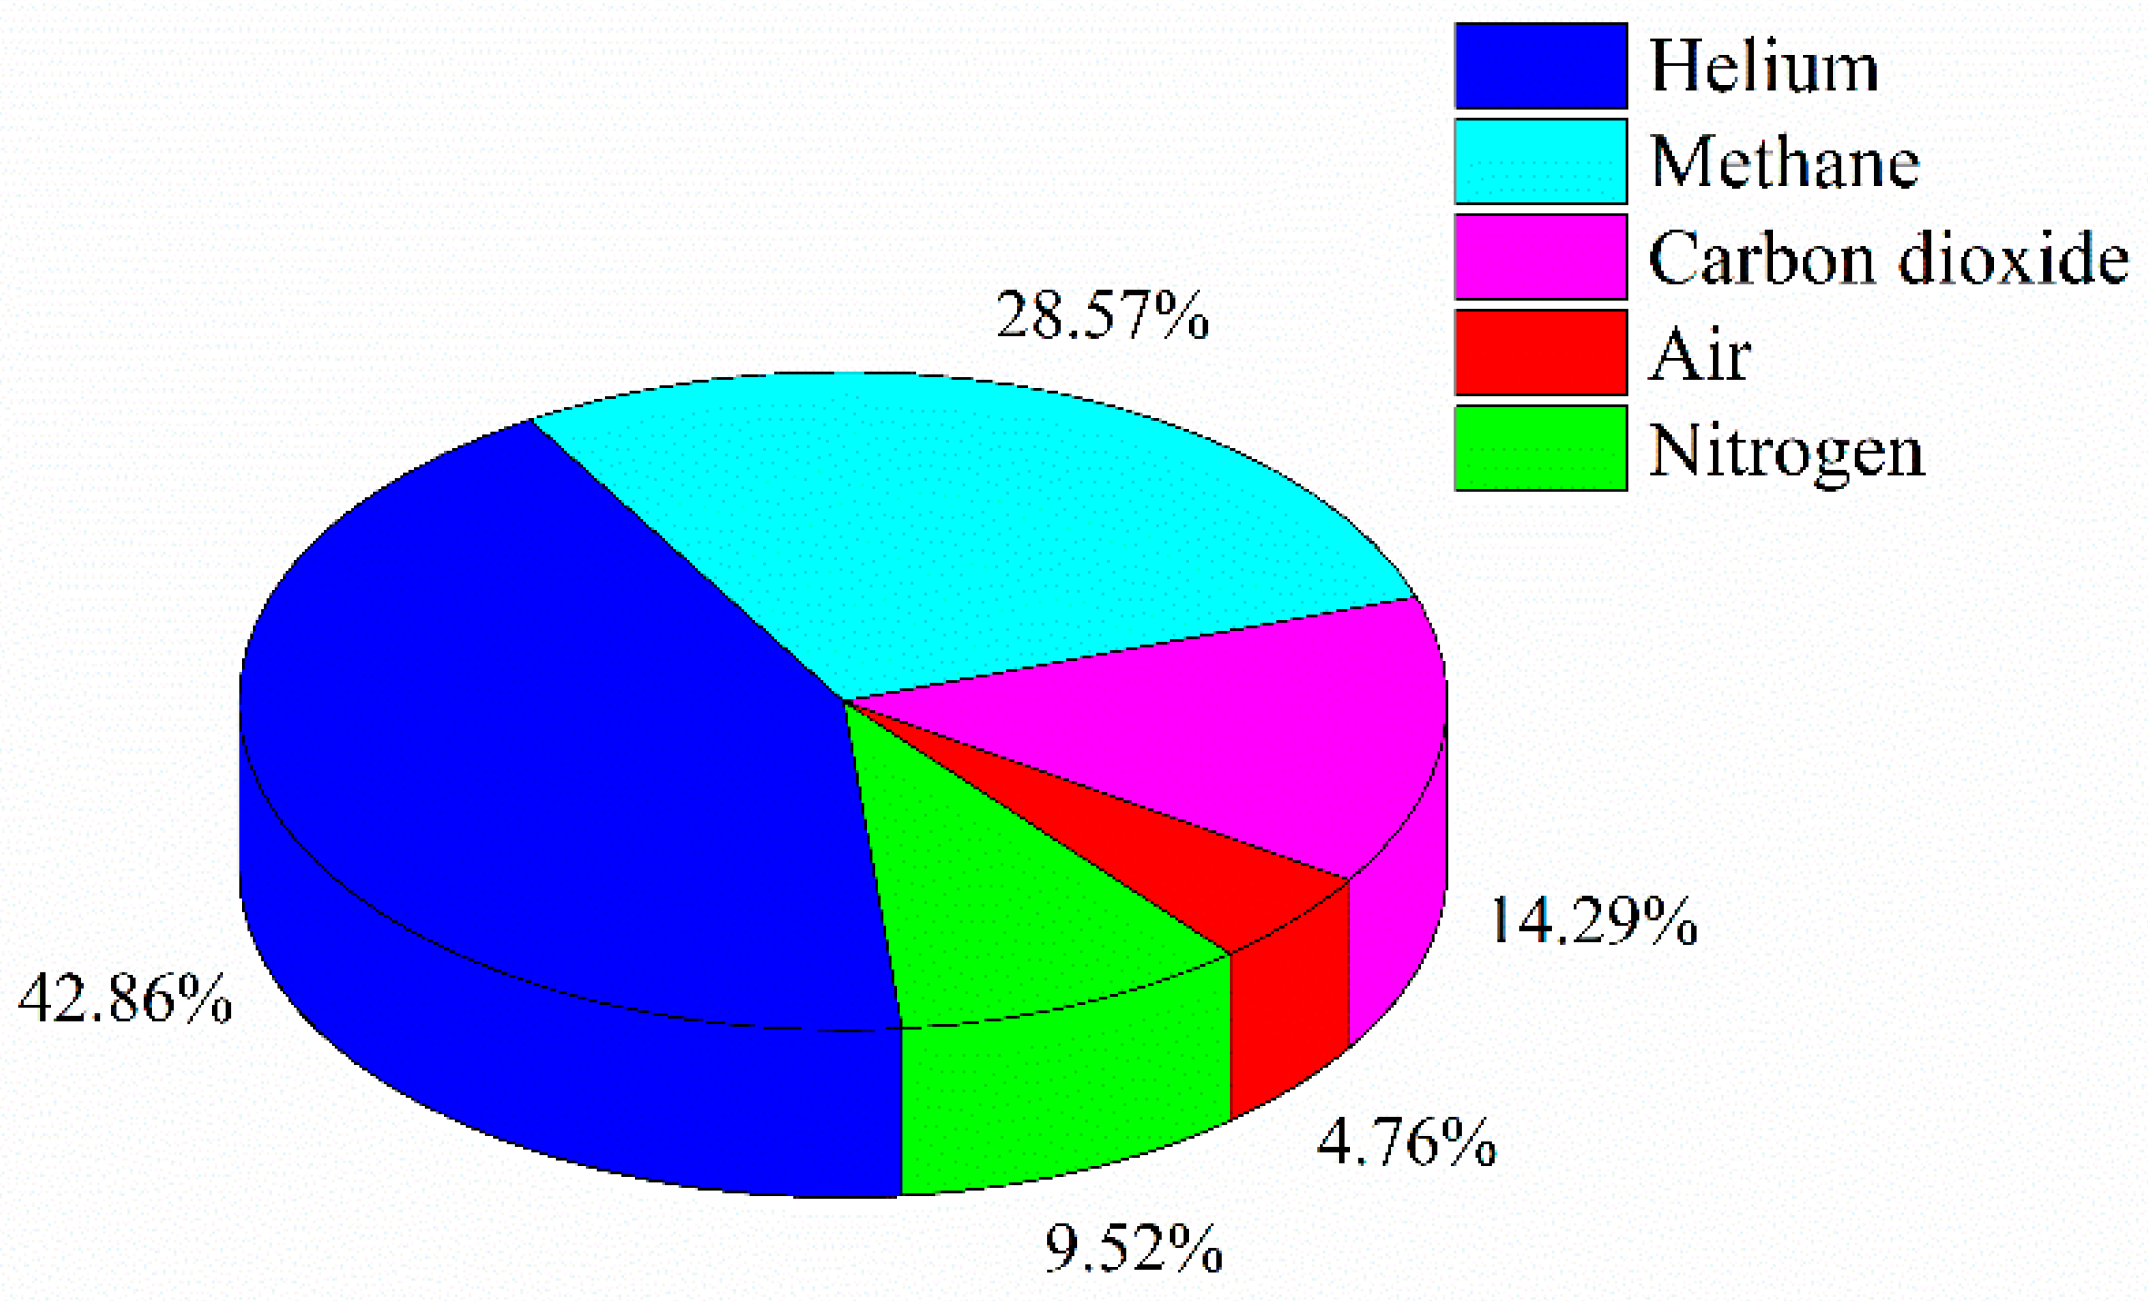
2.1.2. Test Fluid Selection

The test fluids in the previous tests varied, including helium, methane, carbon dioxide, air, and nitrogen. The frequency of each fluid used in previous studies is counted, and the result is presented in Figure 3. Air was applied once by Reznik et al. [26] and has not been used since then. To eliminate the adsorption effect, helium was widely used in the measurement of coal gas-water relative permeability, with a frequency of 42.86%. Recently, more researchers have used methane in their studies for consistency with actual reservoirs, and the frequency of the use of methane is 28.57%. Moreover, with the development of ECBM, people have begun to pay attention to the transport behavior of carbon dioxide-water and nitrogen-water in the coal seam, but related relative permeability research is limited. In addition, considering the actual pressure-temperature conditions of deep coal seams, carbon dioxide may be in a supercritical state. However, supercritical carbon dioxide–water relative permeability measurements have not been made.

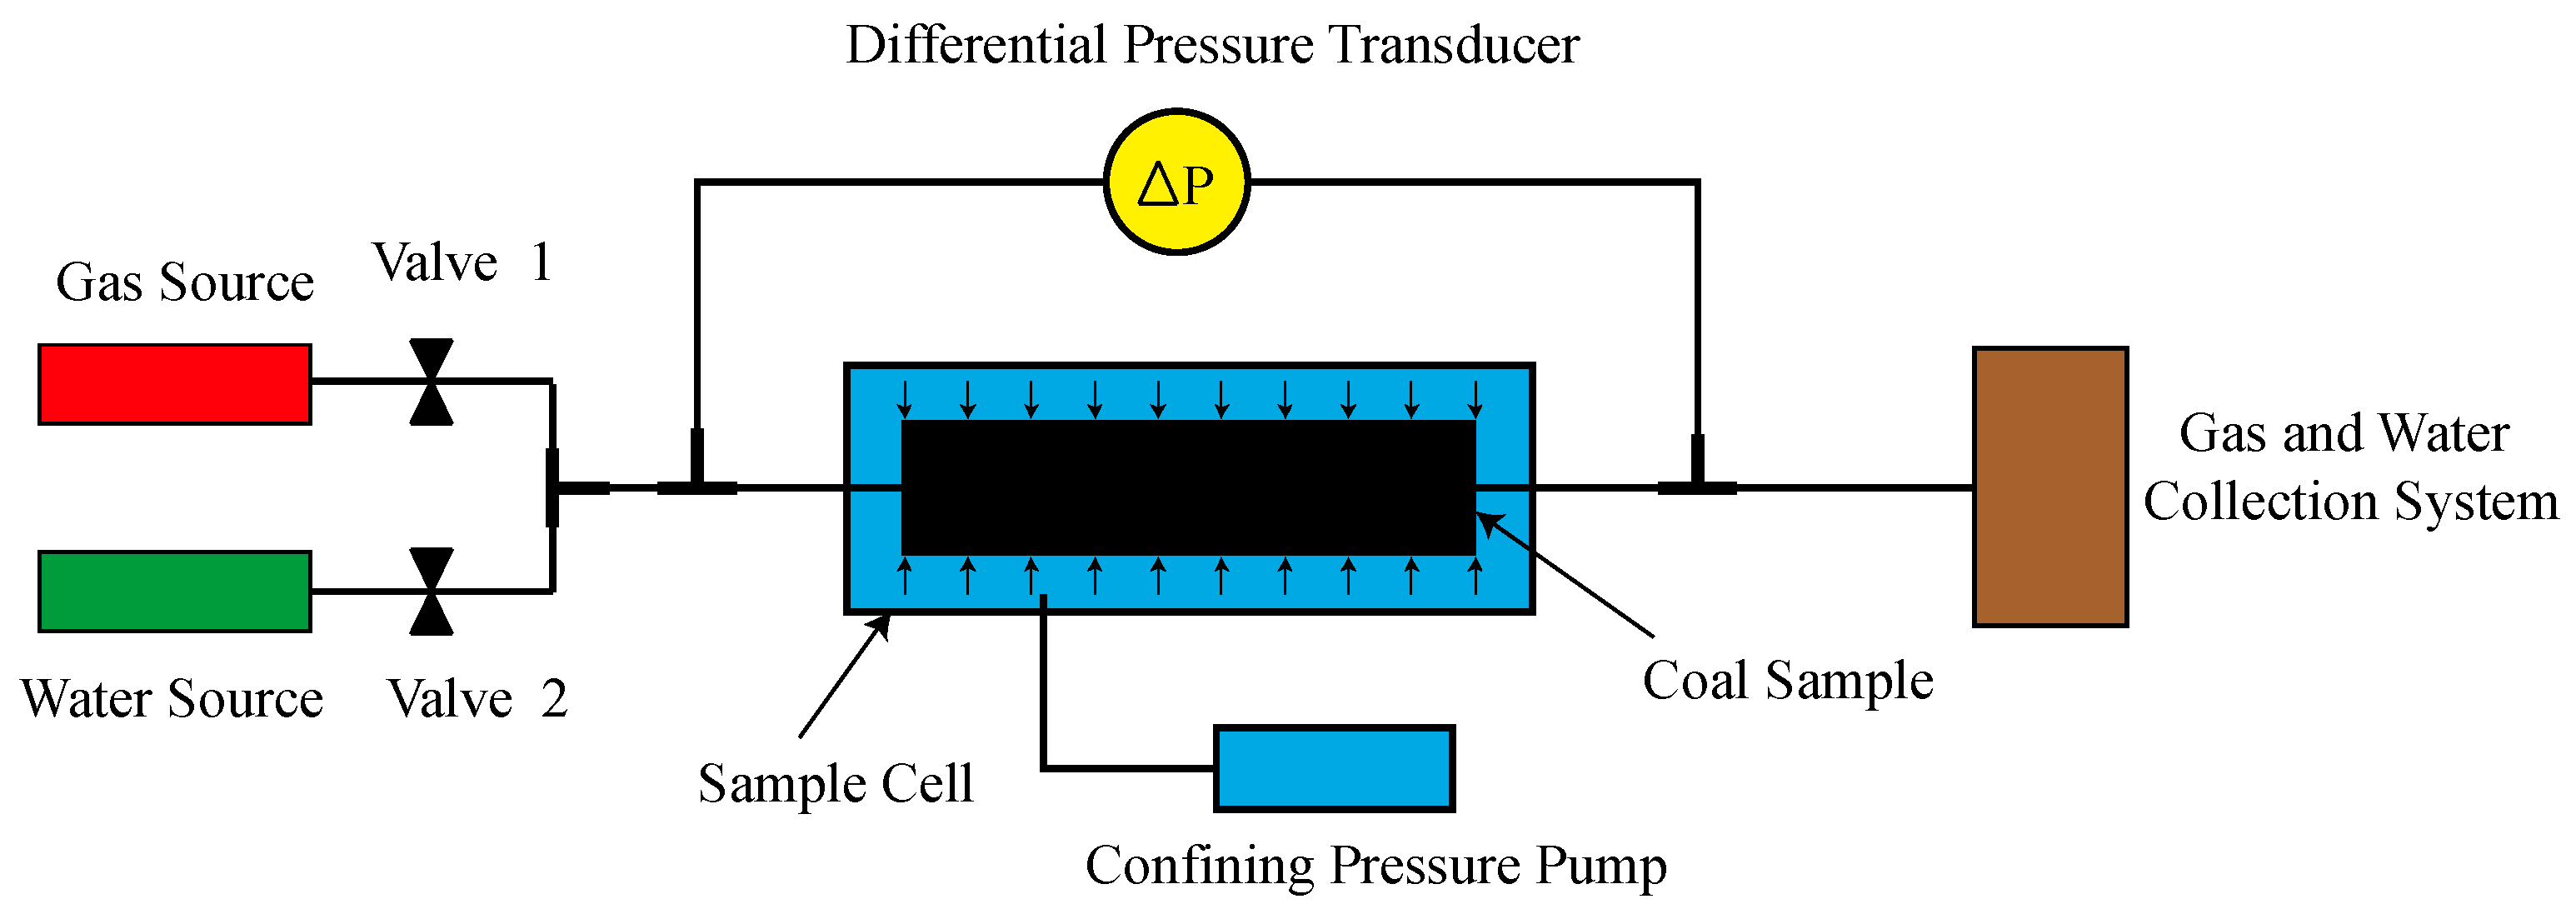
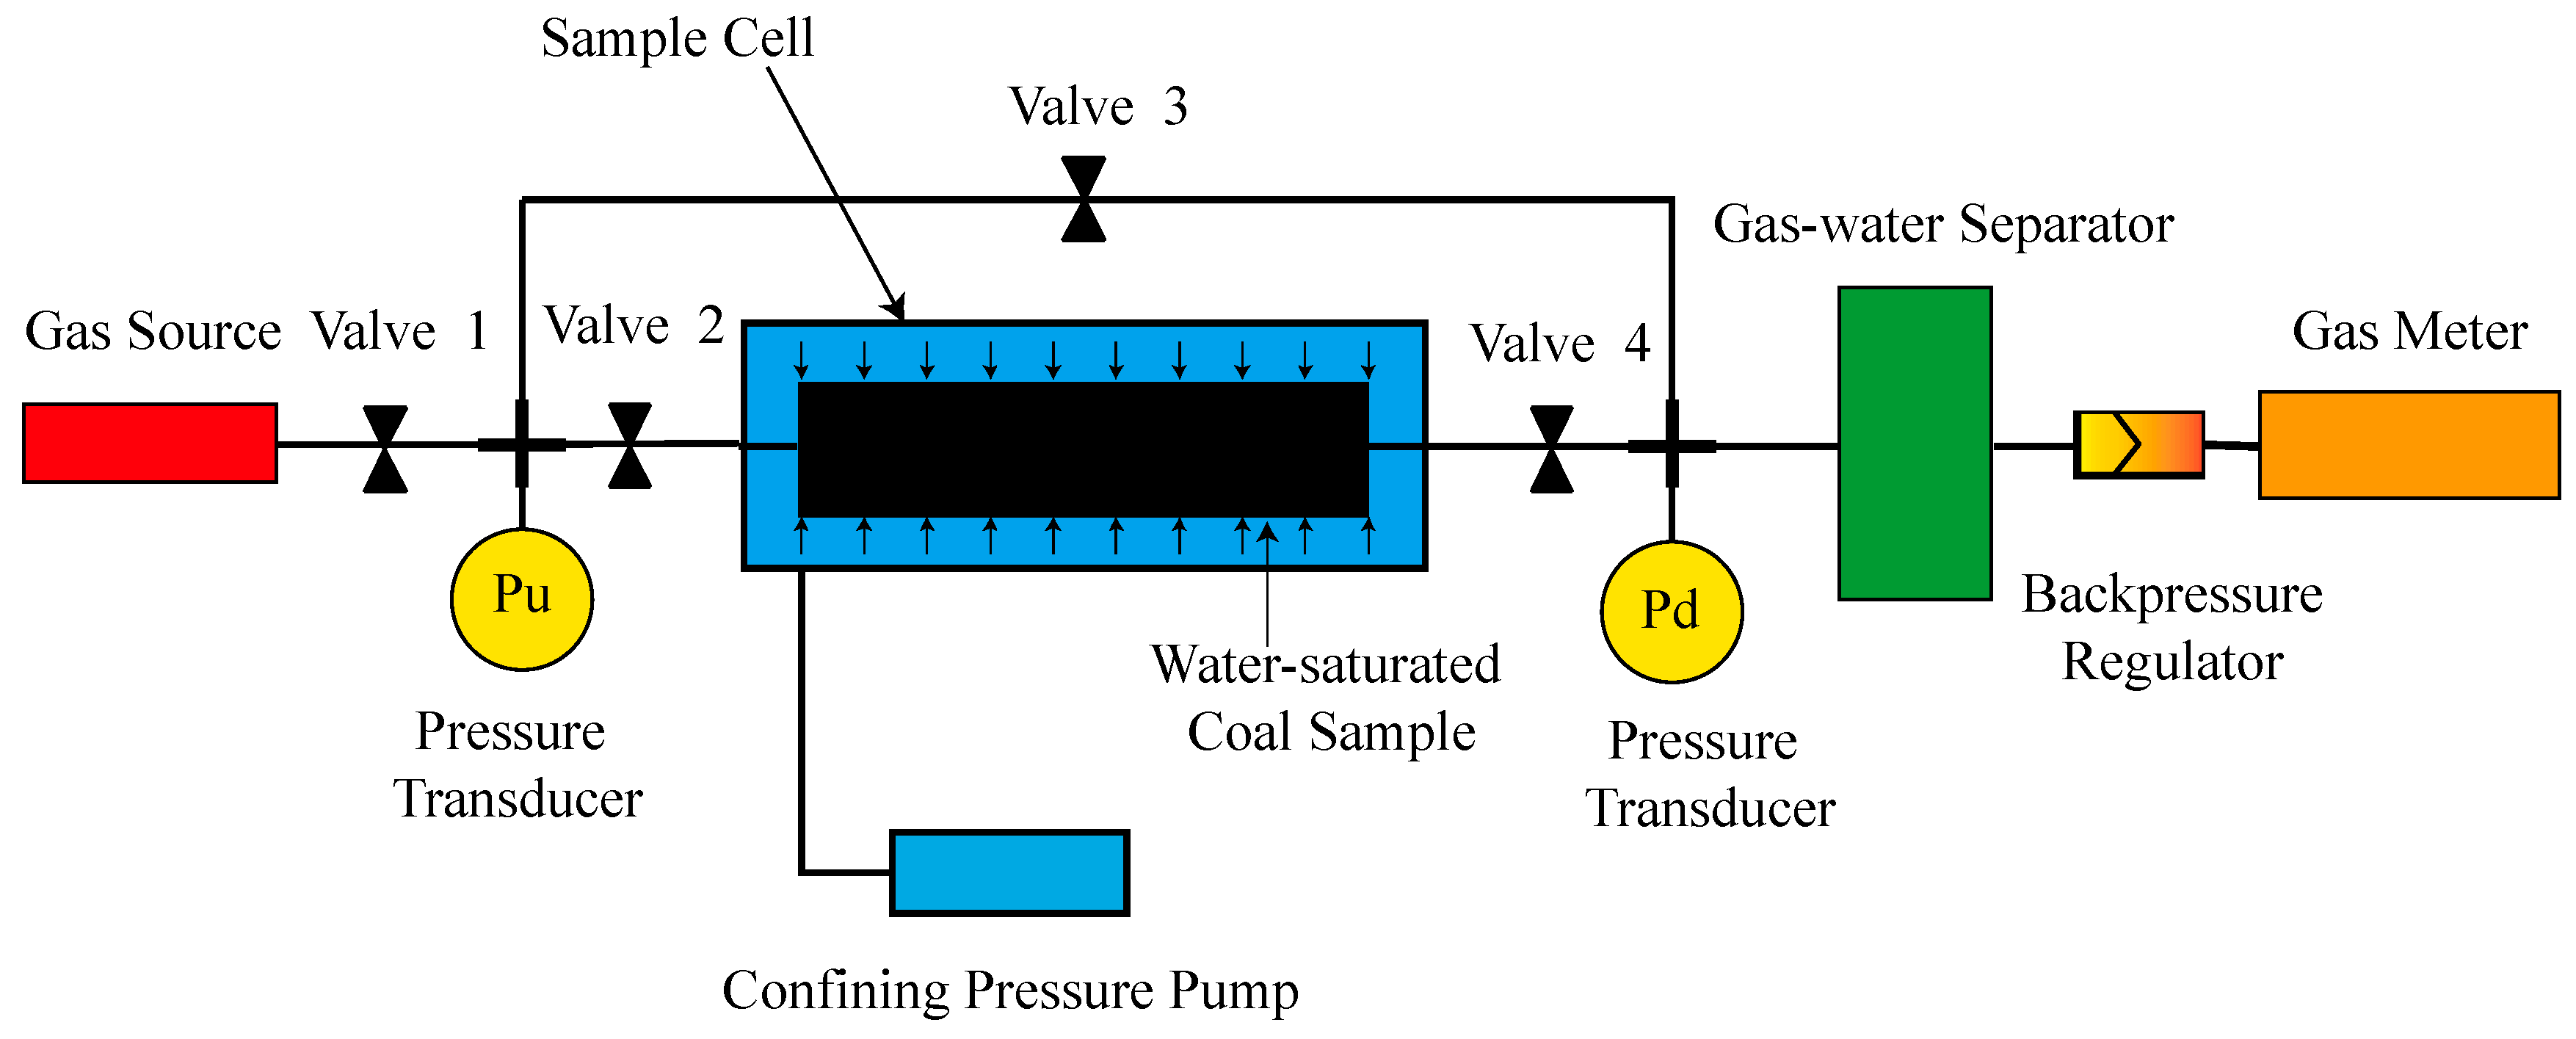
2.1.3. Absolute Permeability Test

To determine the relative permeability, the basic permeability should be determined first. Normally, the absolute permeability, which is the inherent property of rock, is taken as the basic permeability in relative permeability measurements. However, the permeabilities of coal measured by different gas species differ [25]. Therefore, the calculated relative permeability will be different if the permeability of coal is determined by different fluids. In the helium-water relative permeability experiment, Gash [47], Puri et al. [48], and Zhang et al. [31] applied water as the test fluid to determine the absolute permeability of coal. In the methane–water relative permeability test, the fluids used to measure the absolute permeability of coal may vary. Methane, air, and water were applied by Shen et al. [23], Zhang et al. [49] and Shen et al. [33], respectively. It is noted that the fluid applied to determine the absolute permeability of coal may vary, which can lead to a deviation in the measured relative permeability.

2.2. Methods to Measure the Coal Relative Permeability in Laboratories

Methods for measuring the relative permeability of coal in the laboratory mainly include the steady-state method, unsteady-state method, and capillary pressure method. The capillary pressure method refers to combining the capillary pressure data with a mathematical model to obtain the relative permeability of coal. In addition to the accuracy of the measured capillary pressure data, the applicability of the mathematical model is a key point in the capillary pressure method. Thus, among these three methods, the steady-state method and the unsteady-state method are commonly used. In this section, we mainly introduce the steady-state method and unsteady-state method to measure the relative permeability of coal in the laboratory.

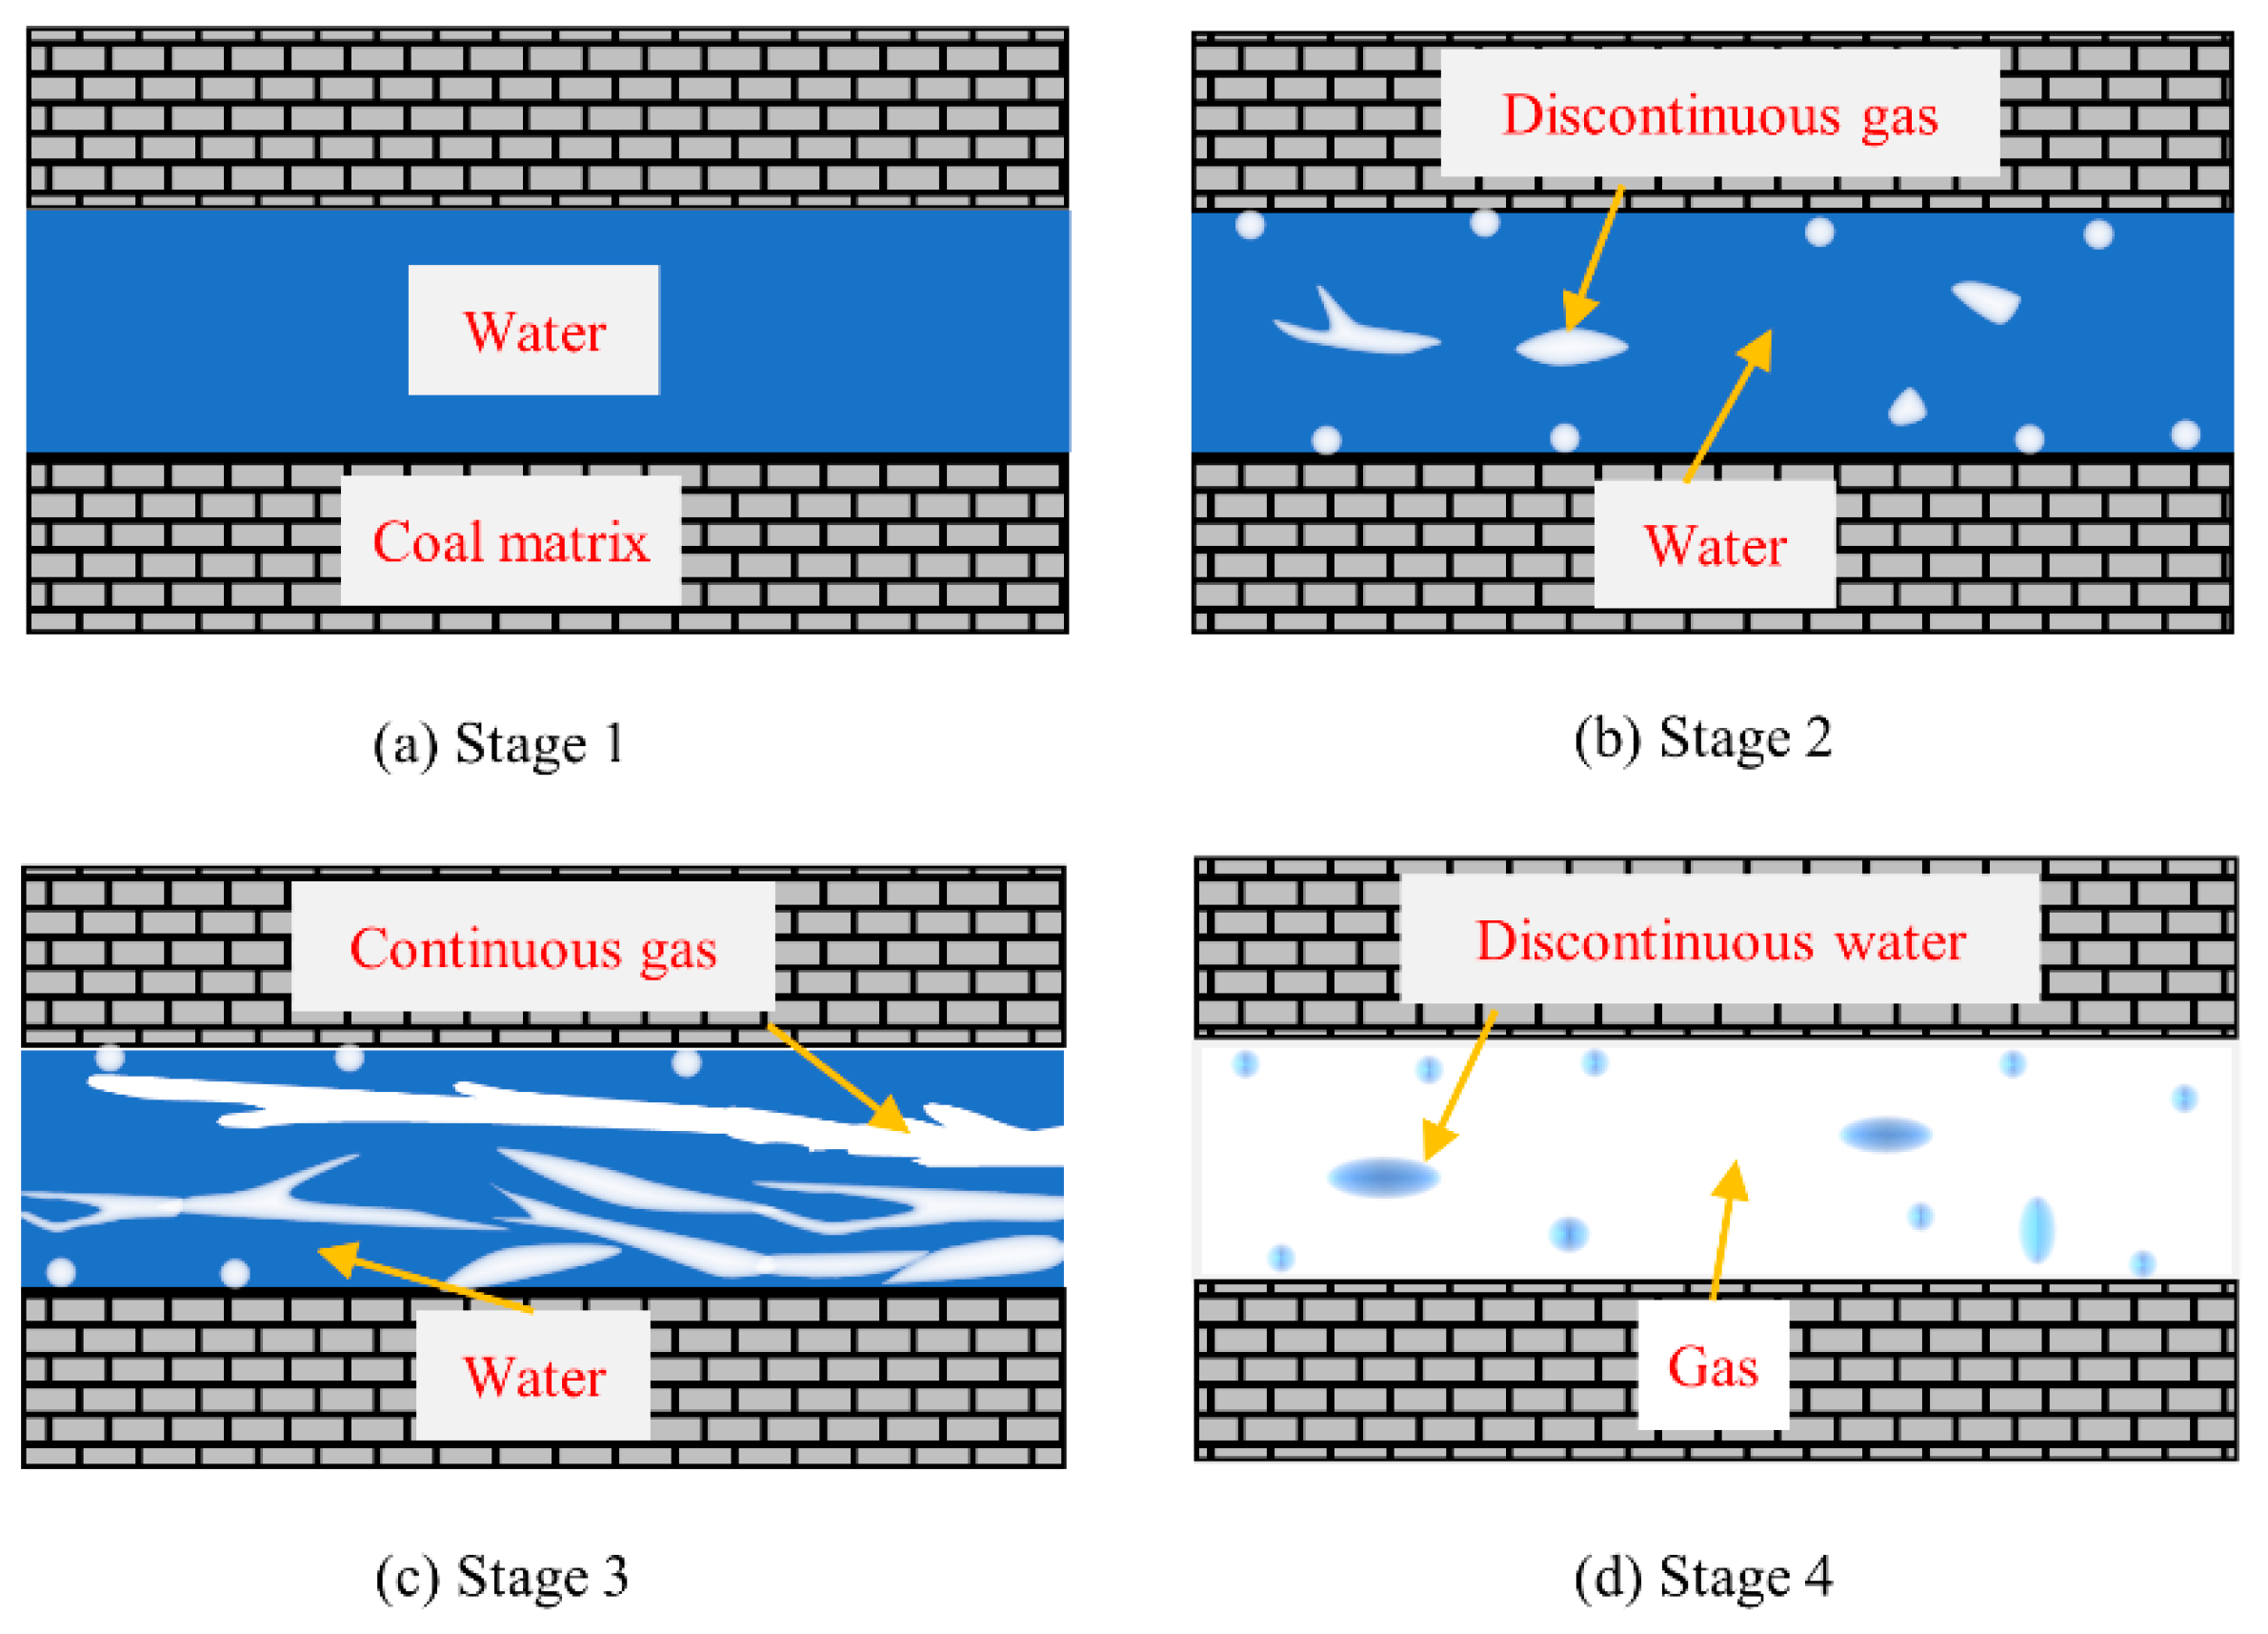
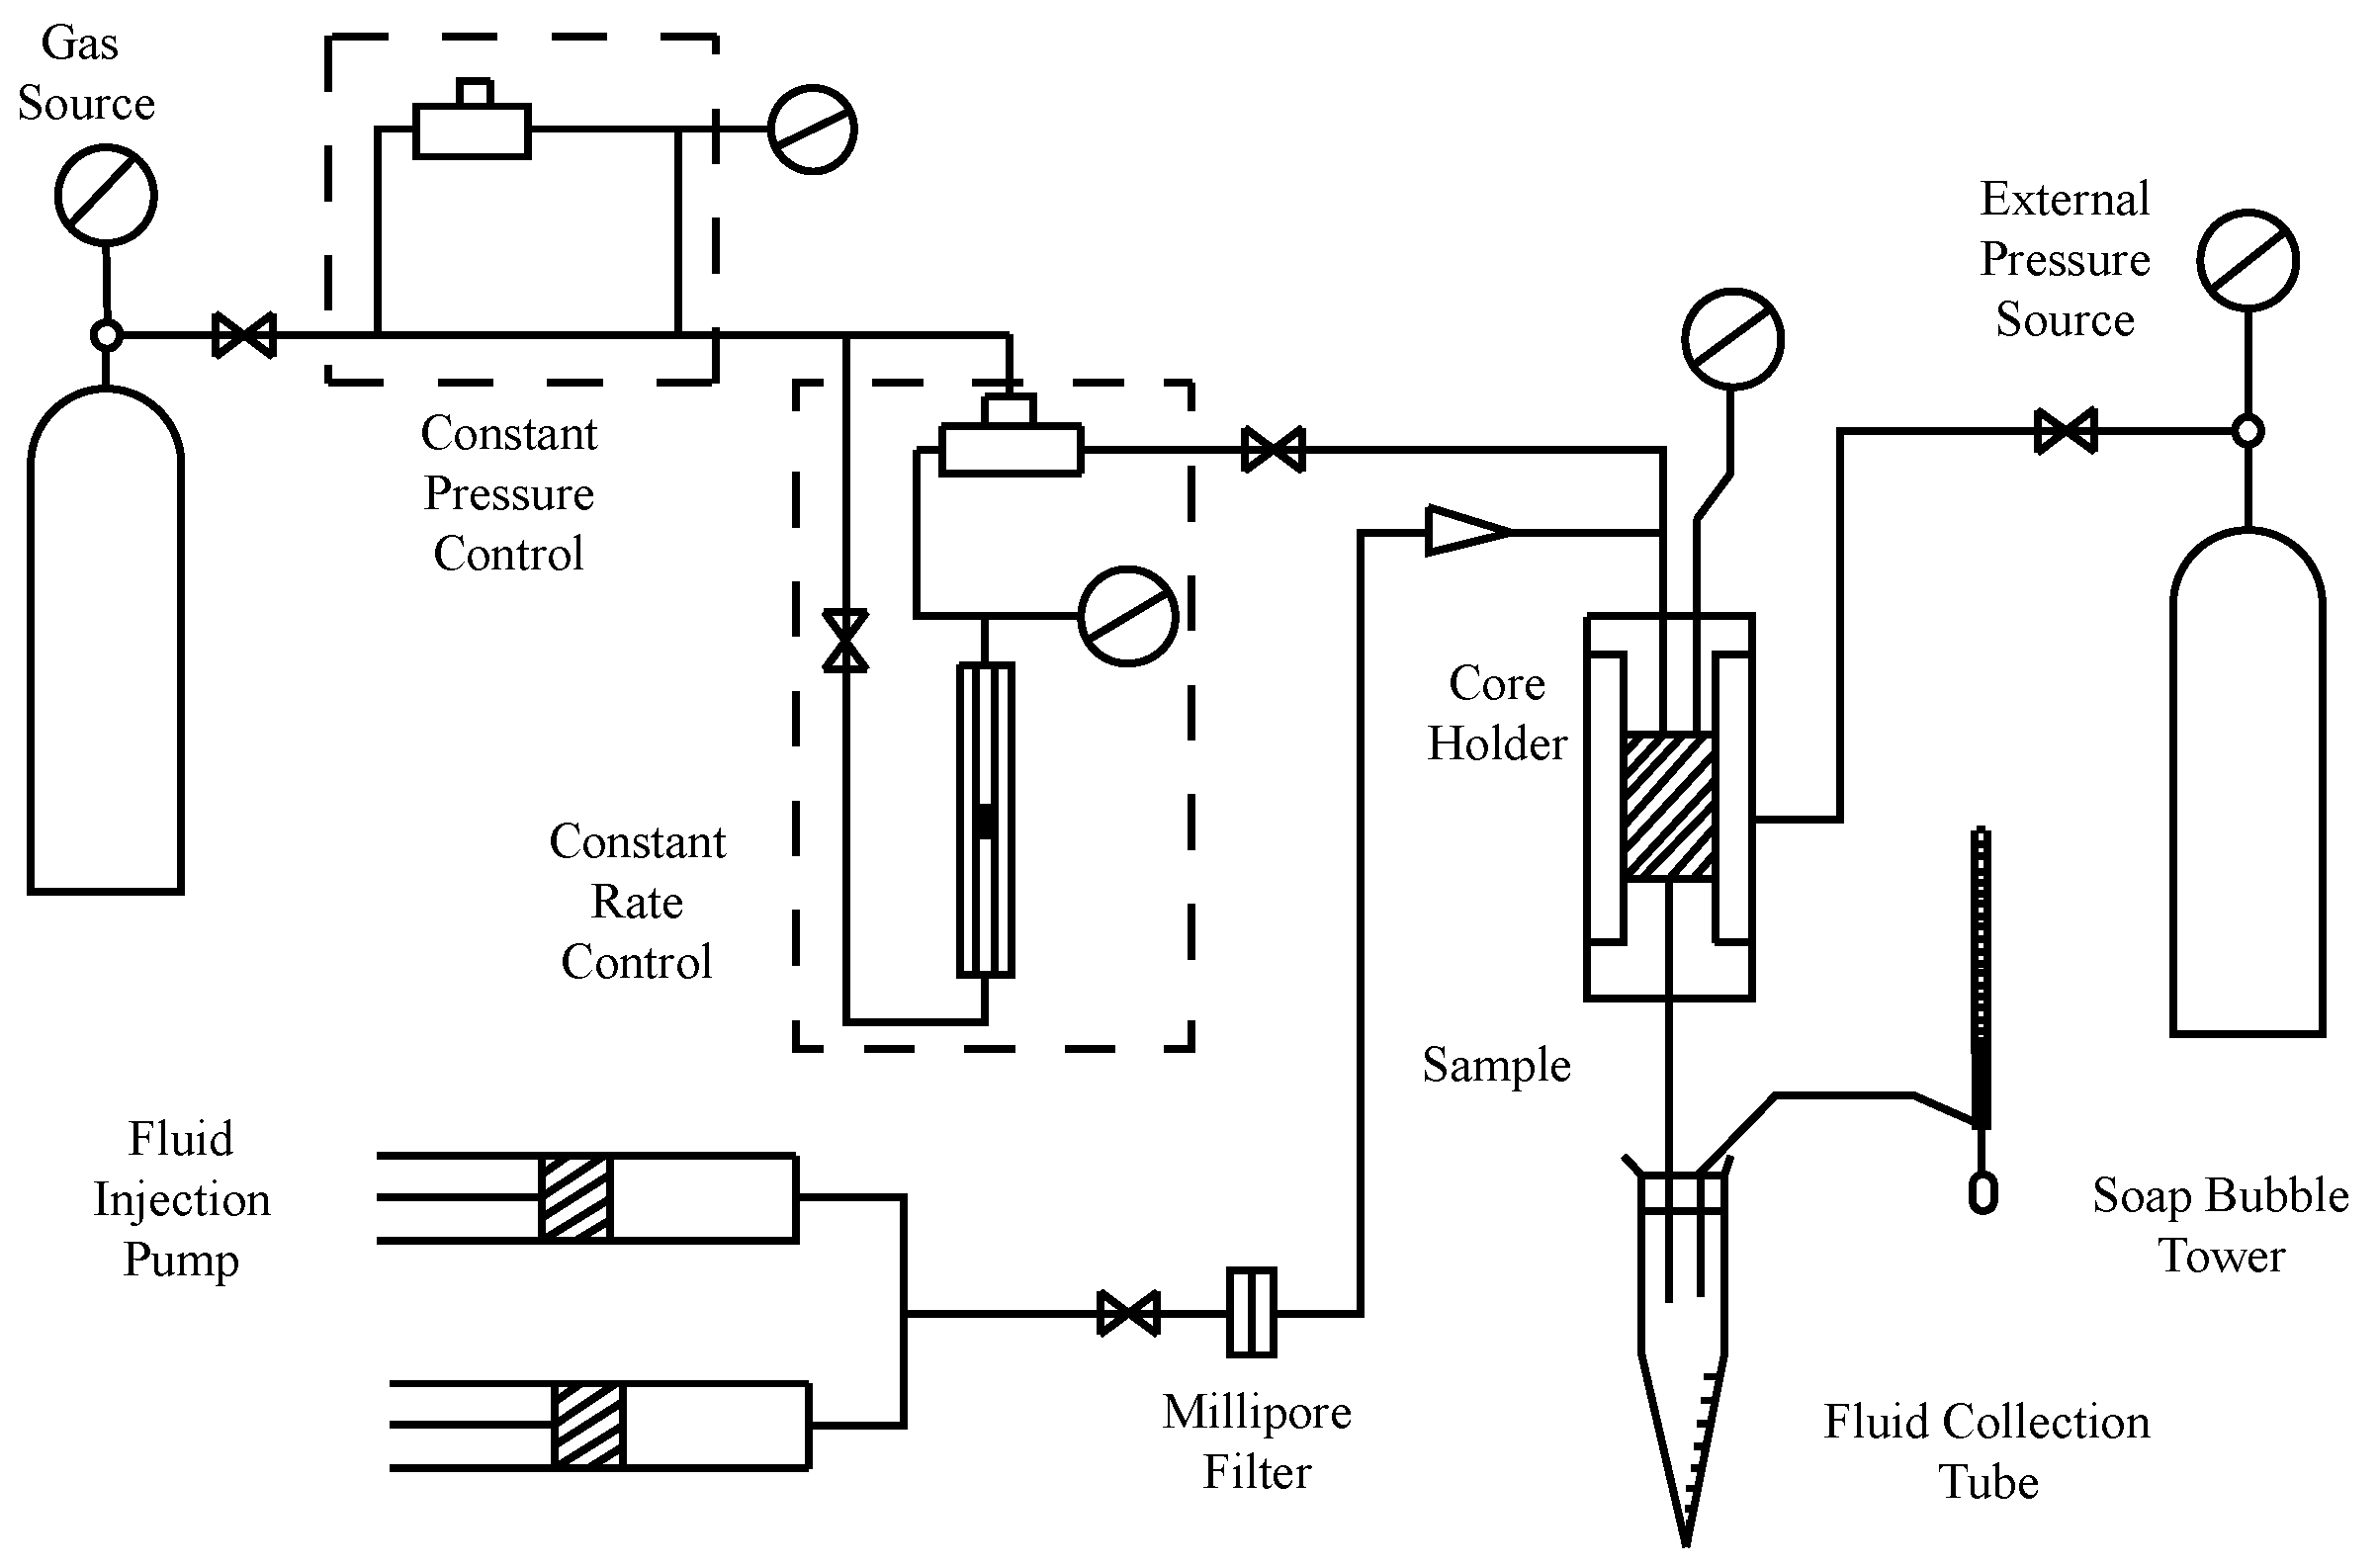
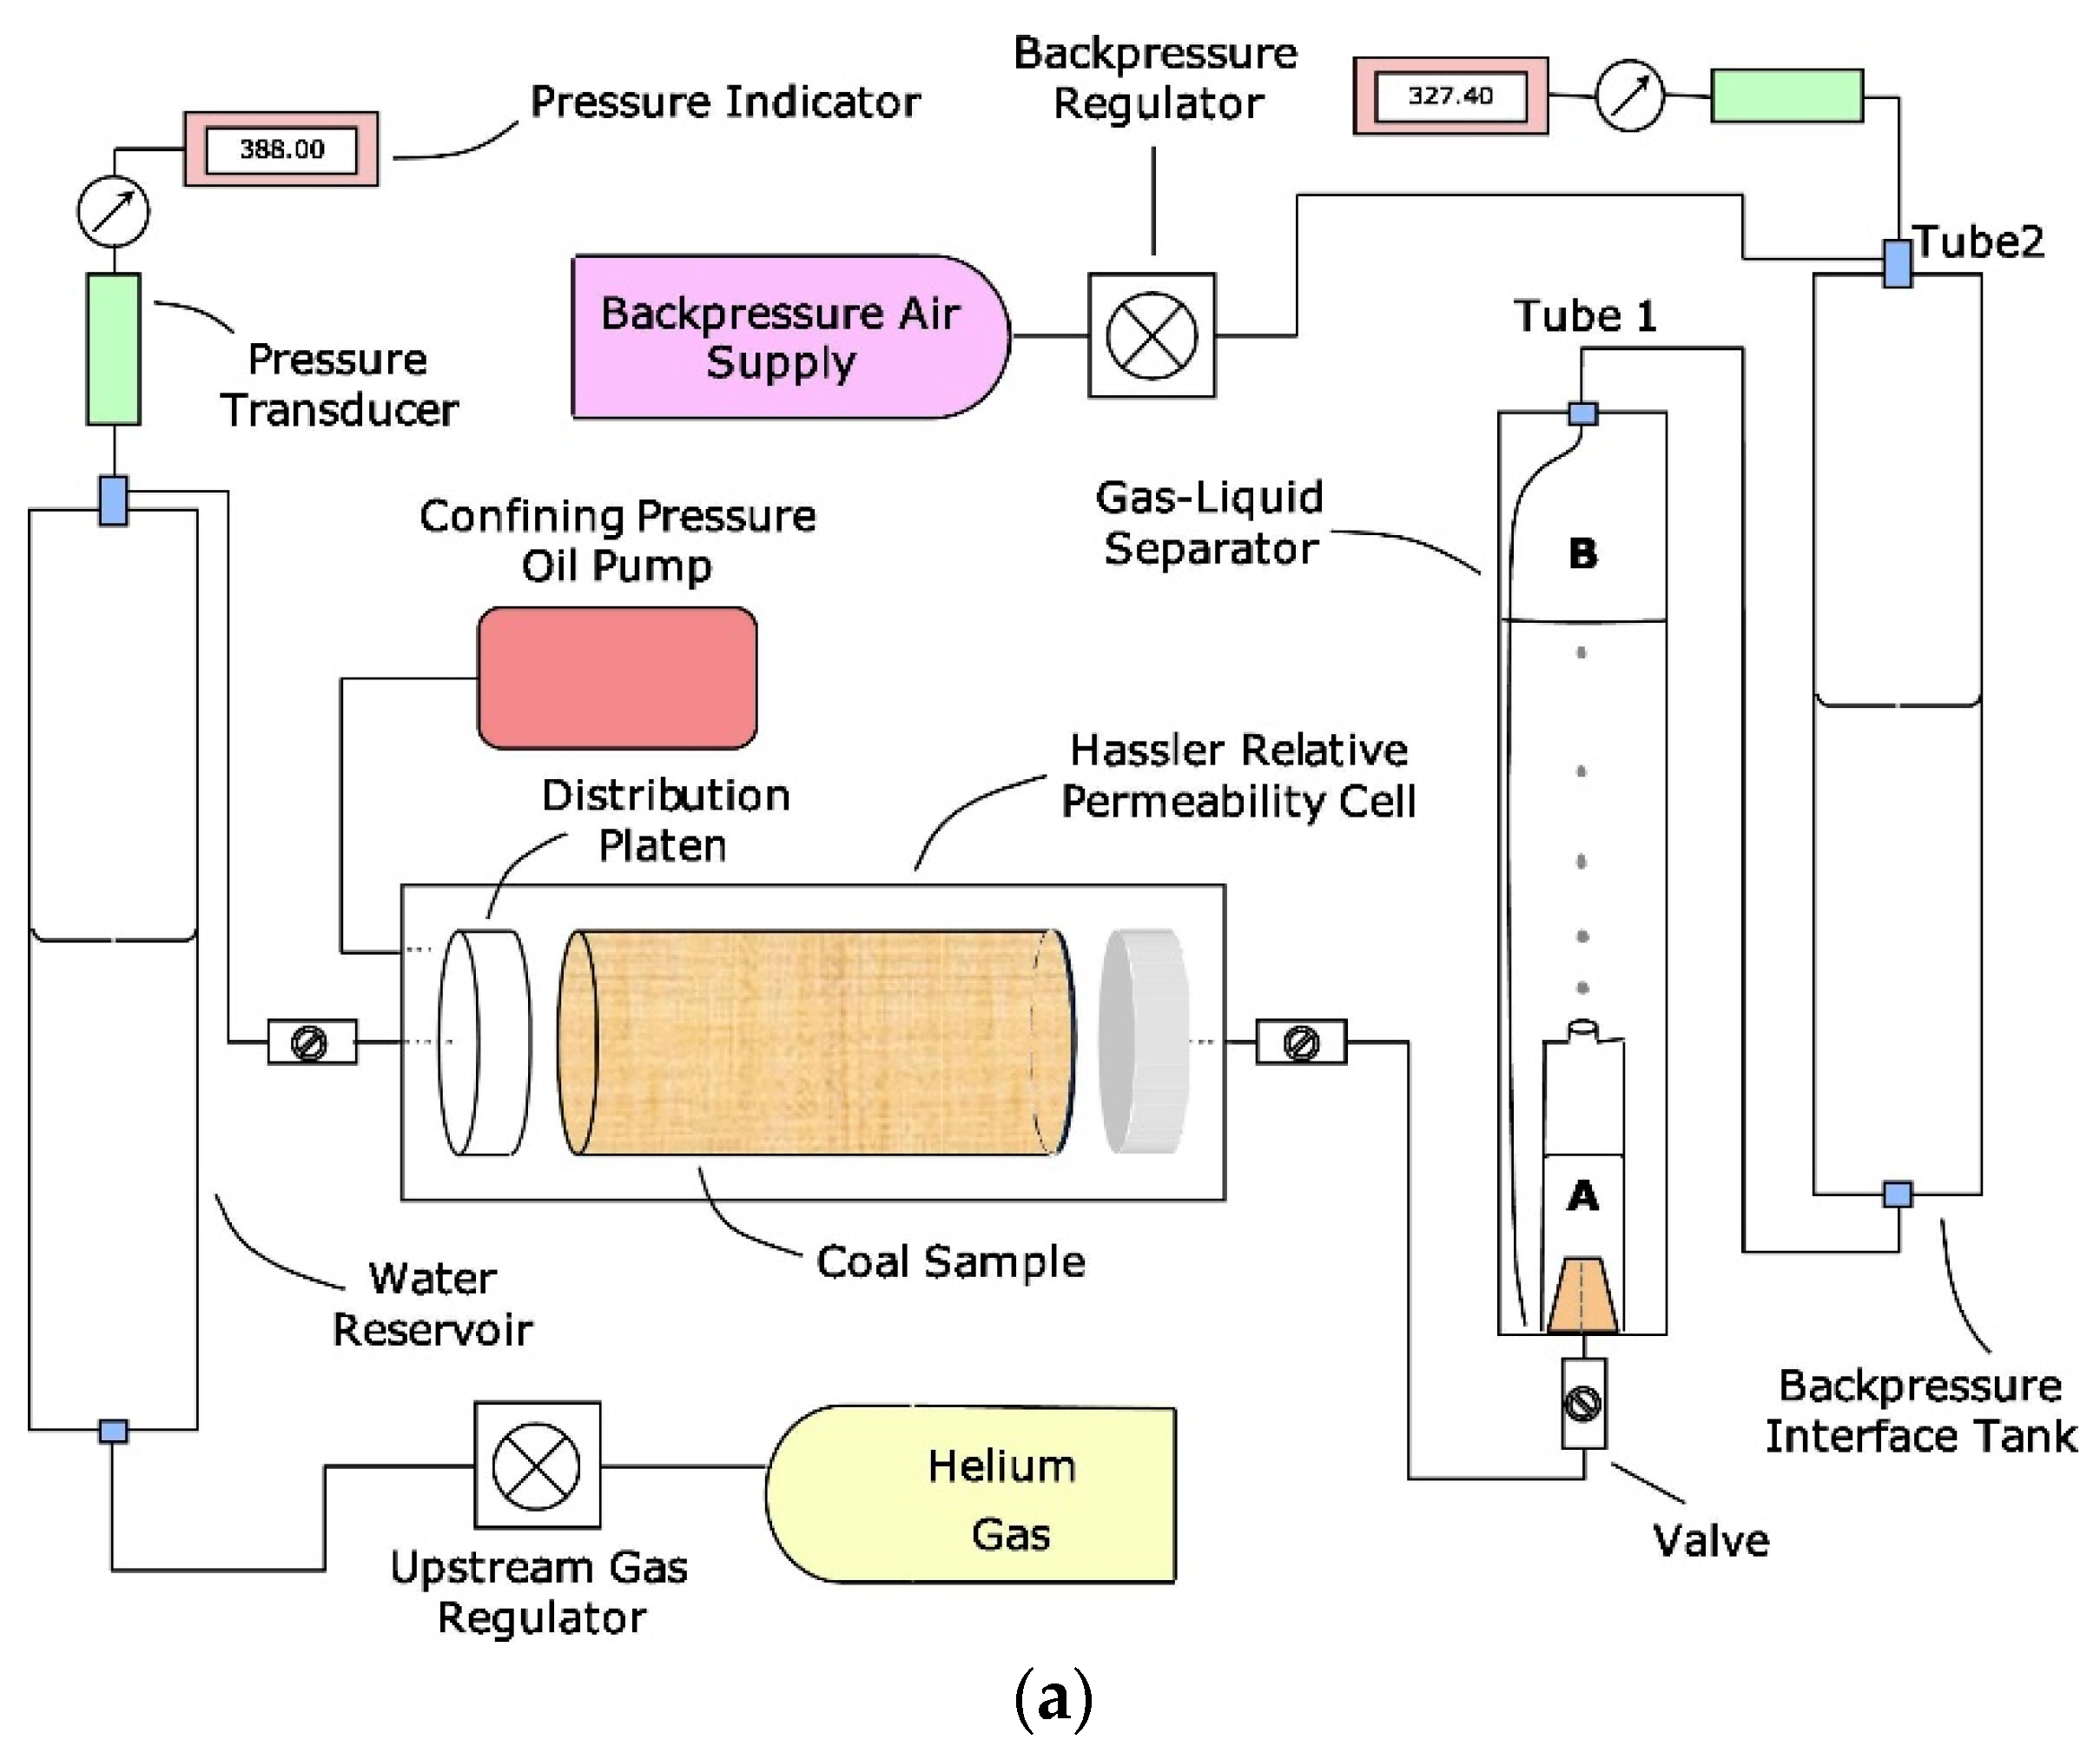
2.2.1. Steady-State Method

The principle of the steady-state method is shown in Figure 4. The experimental procedure is as follows: (1) Apply confining pressure to the designed value, and adjust the pressure to ensure that it remains stable. (2) Open valve 1 and valve 2, and inject the gas and water simultaneously at a constant rate, recording the reading of the differential pressure transducer. (3) When the flow of gas and water reaches equilibrium and the reading of the differential pressure transducer remains stable, the water saturation of the sample can be determined by techniques such as gravimetric or volumetric material balance, X-ray or gamma scanning or computed tomography (CT) scanning [43], and the effective permeability and relative permeability at this saturation can be calculated according to Darcy’s law (Equations (1)–(4)). (4) Change the ratio of the gas and water injection rates and repeat the test to obtain the relative permeability curve
The advantages of the steady-state method are that it is highly reliable and that it can obtain relative permeability in a wide range of saturation levels. However, the steady-state method is inherently time-consuming because it may require several hours or days to achieve equilibrium at each saturation level, especially for coal samples with ultralow permeability. In addition, the saturation needs to be determined at each rate. Furthermore, to avoid hysteresis, saturation changes should be controlled unidirectionally (i.e., imbibition or drainage) [20].
When calculating the relative permeability, assuming that the fluid flows in the coal fracture and cleat system follow Darcy’s law, then:
For incompressible fluids, the effective permeability is:
k e w = Q w A L ( p 0 p 1 )
For compressible fluids, the effective permeability is [50]:
k e g = Q g μ g L A 2 p 0 ( p 0 2 p 1 2 )
where Q w and Q g are the flow rates of the water and gas, μ w and μ g are the viscosities of the water and gas, respectively, p 0 is the downstream pressure, p 1 is the upstream pressure, A is the cross-sectional area, and L is the length of the sample.
According to the definition of relative permeability, the relative permeability of the water and gas are:
k r w = k e w K
k r g = k e g K
where K is the basic permeability, which is often defined as the absolute permeability.

2.2.2. Unsteady-State Method

In this method, a wetting phase fluid is usually displaced by a nonwetting phase fluid. Coal is assumed to be water-wet at low pressures [51]; thus, gas and water are often used as the displacing and displaced fluids in the experiment, respectively. The principle of measuring relative permeability by the unsteady-state method is shown in Figure 5. The experimental procedures are as follows: (1) Place the saturated coal into the core holder and apply the confining pressure according to the designed value. (2) Open valves 1 and 3 and inject gas with a set pressure upstream and downstream. After the pressure stabilizes, close valve 3, and inject gas at a constant pressure. (3) Open valves 2 and 4, and record the water and gas production in real time. (4) Calculate the relative permeability according to the recorded data, and draw the relative permeability curve.
Based on Darcy’s law, Leverett [52] expressed the general gas fractional flow equation as follows:
f g = 1 + 1 V t k e w μ w ( p c x + Δ ρ g sin α ) 1 + μ g k e g k e w μ w
where f g is the fraction of gas in the flow stream, V t is the total flow rate, k e w and k e g are the effective permeability of water and gas, respectively, μ w is the viscosity of water, p c is the capillary pressure (gas pressure minus water pressure), Δ ρ is the difference in gas-water density (water density minus gas density), and α is the angle of inclination.
If the capillary pressure is ignored and the flow direction is considered to be horizontal, Equation (5) becomes:
f g = 1 1 + μ g k e g k e w μ w
The relationship between the relative permeability to gas and that to water can be obtained by rearranging and substituting Equations (3) and (4) into Equation (6):
k r g = k r w μ g μ w f g f w
where f w is the fraction of water in the flow stream and μ g is the viscosity of the gas.
Based on the assumptions that porosity and permeability are constant and fluids are incompressible, Buckley and Leverett [53] developed the “frontal advance” theory, which considers a mass balance that can be expressed as:
( dx dt ) S g = Q A ( f g S g ) S g
where S g is the gas saturation.
Welge [54] gave the difference between the average and terminal gas saturations:
S avg = S g 2 + 1 f g 2 ( f g S g ) S g 2
where S avg is the average gas saturation and S g 2 is the terminal gas saturation.
Based on the work of Buckley-Leveret and Welge, Johnson et al. [55] gave the relative permeability calculation method (JBN method):
f w k r w = d ( 1 I r W i ) d ( 1 W i )
where I r is relative injective and W i is the cumulative injection (pore volume).
In the unsteady-state method, saturation equilibrium is not attained; thus, compared to the steady-state method, the unsteady-state method takes less time to execute. However, the range of saturation that can be measured is narrow due to the high irreducible water saturation in the coal.
To investigate the development of these two methods in the past few decades, the method used for the relative permeability measurement of coal samples with different permeabilities is further discussed (based on the dataset in Table 1). As shown in Figure 6, each point represents a sample. A total of 35 sets of experiments were acquired from the publicly available literature. Some other researchers measured the relative permeability of coals, but the permeability data were not presented; thus, the data collected in Figure 6 are limited. Only two sets (5.7%) of experiments were conducted with the steady-state method. The experiment conducted with the steady-state method in 1991 was compared to the that conducted with the unsteady-state method by Gash [47]. The absolute permeability of the sample used in his study was approximately 0.13 mD. The other experiment was conducted by Alexis in 2015 to measure the fracture effective permeability of coal. Because the steady-state method was used, all the samples were artificially fractured to obtain an absolute permeability greater than 1 mD. The relative permeabilities of more samples were measured with the unsteady-state method than with the steady-state method because the displacement process in the unsteady-state method is the same as the fluid flow process in the actual coal reservoir and the time required to complete an unsteady-state experiment is relatively short. The permeabilities of these coal samples exhibit a large range, from 0.015–9.51 mD. In addition, most of the coal permeability (79%) is lower than 1 mD, with a total of 33 sets of samples.
It can be accepted that the steady-state gas-water relative permeability measurement is suitable for rock samples with large air permeability (greater than 1 mD); furthermore, the corresponding experimental data are simple to analyze, and the calculation results are stable. The unsteady-state gas–water relative permeability measurement is more suitable for rock samples with a low air permeability (greater than 0.01 mD), which require only a short time to obtain data, and the experimental operation is relatively simple. Due to the low permeability of coal, most scholars choose the unsteady-state method to measure coal gas–water relative permeability.

2.3. Devices to Measure Relative Permeability in Laboratories

In 1974, Dabbous et al. [56] pointed out that the presence of water in the coal seam was known to have a marked influence on the behavior of methane flows, but there were no studies on gas/water relative permeability. Thus, Dabbous designed a device that could measure the gas-water relative permeability of coal and conducted a series of studies on the coal relative permeability. As shown in Figure 7, the apparatus is mainly composed of (1) a constant-flow-rate, constant pressure gas injection system, (2) a high-precision positive displacement pump, (3) a core holder that can handle pressures up to 1000 psi, and (4) a gas-liquid separation system, which consists of two parts: a graduated fluid receiver tube and gas flow metering equipment. The unsteady-state method was used to measure the relative permeability of coal through this apparatus by Reznik et al. [26]. The downstream gas flow rate was measured by a soap bubble tower and calibrated orifices, and all saturations were obtained gravimetrically. This apparatus design laid a foundation for subsequent research on the relative permeability of coal. Recently, more scholars have conducted coal gas–water relative permeability measurements with devices that they developed themselves. The information of these experiments is summarized in Table 1.
Because coal is a low-porosity rock (with a porosity of 0.5–2.5%) [57], the movable water volume in the coal is too small to be detected. Thus, accurate determination of saturation is the key point in the process of relative permeability measurement. To date, the change in water saturation during an experiment can be determined by the volumetric method, gravimetric method, acoustic method, and some new techniques (such as X-ray CT scanning and nuclear magnetic resonance (NMR)). According to the technique used to measure water saturation, the relative permeability apparatuses are classified and reviewed, as shown in Figure 8.

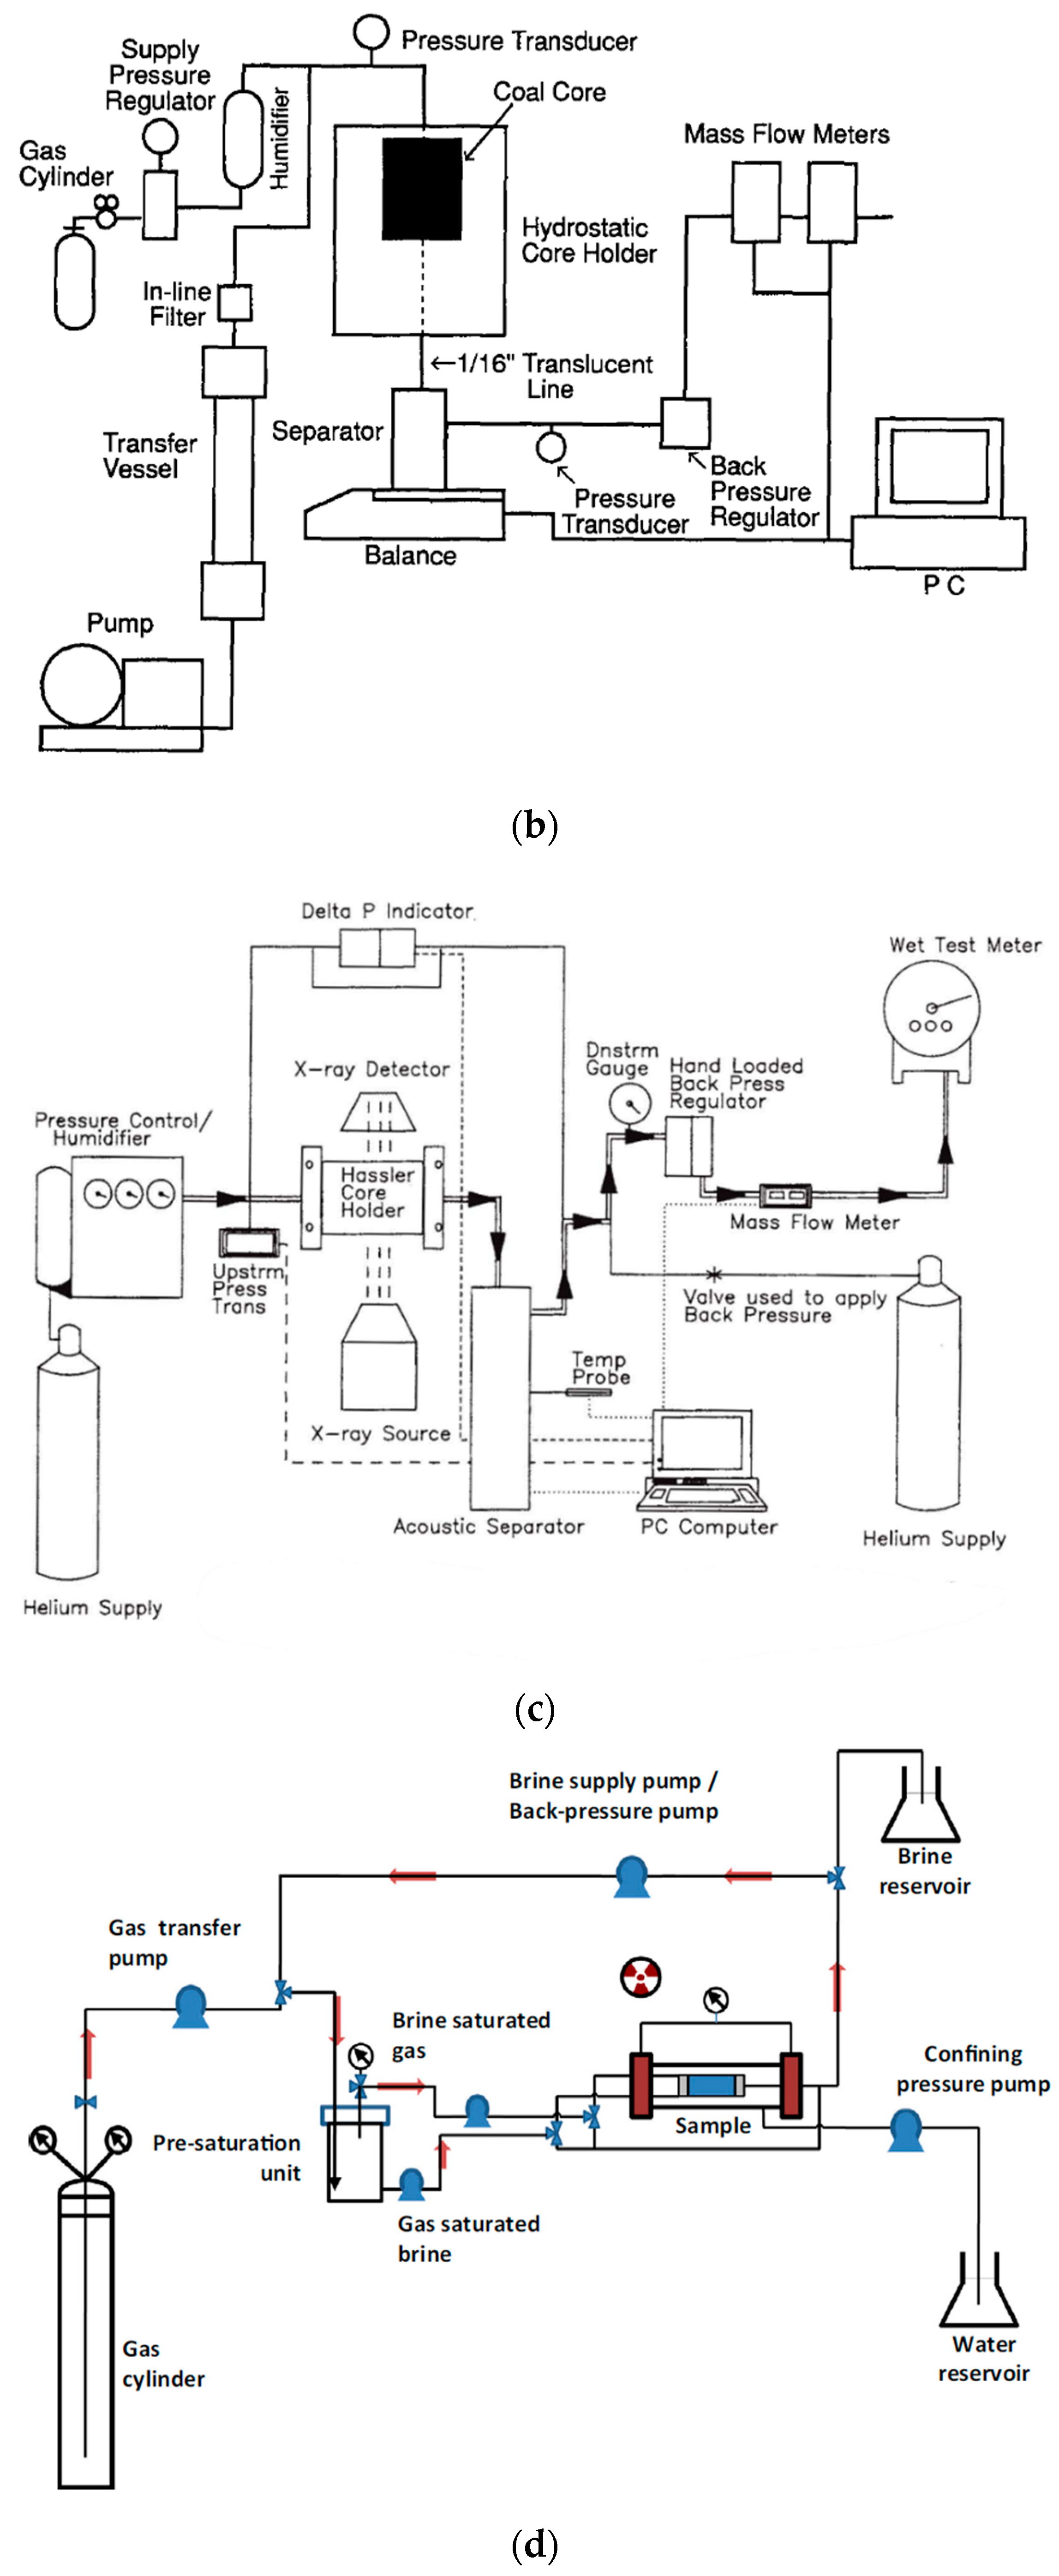
2.3.1. Volumetric Technique

To measure the gas-water relative permeability of the selected European coals and discuss the influence of wettability, overburden pressure, and other factors on coal relative permeability, Durucan et al. [29] designed a measurement device as illustrated in Figure 8a. It includes a water reservoir, a Hassler cell core holder, a confining pressure pump, a gas-liquid separator, and a backpressure device. The water reservoir is used to saturate the gas to prevent the dry gas from removing the water in the coal sample and ensure the accurate measurement of the water production. The core holder can withstand a stress of up to 100 MPa. The height of the gas-liquid separation tube was specially designed to be as high as 1.5 m to accommodate as much gas as possible but is thin enough (with an internal diameter of 25 mm) to minimize errors when reading the liquid level. When water is produced, it will accumulate in the small syringe, forcing the oil column downwards in tube 1, and any displaced oil will be transferred to tube 2. The flow rates of the gas and water could be determined by tube 1 and the upturned small syringe, respectively. According to the recorded flow rates, the water saturation of the sample at any time could be calculated.
Error may occur when reading the meniscus levels of the gas–water separator and pressure. In general, errors in measuring the volume of a liquid in a separator and the corresponding pressure are approximately ±1.0 cm3 and ±0.5 psi (3.45 kPa), respectively. One of the limitations of the separator is that the oil–water interface will become irregular and unstable when the gas passes through it, causing inaccuracies when reading the volume of water. However, no other device has been used to directly determine the volume of the water production during the experiment.

2.3.2. Gravimetric Technique

The determination of gas-water relative permeability is necessary for the prediction of methane and water production in a CBM reservoir. Standard laboratory techniques for measuring the relative permeability of conventional reservoir rock need to be modified when applied to coal [47]. Gash [47] pointed out that the unsteady-state technique used to measure the gas-water relative permeability can be modified to handle the small volumes of water produced from the sample with a porosity of less than 2%. The modified apparatus is shown in Figure 8b. The humidifier, core holder, separator, and backpressure regulator are the main components of the device. To avoid errors caused by the gas removing moisture from the coal sample, helium is saturated with water vapor in the humidifier before injection. A translucent 1/16 in ID exit line was designed to accurately determine the volume of the water protected before the gas breakthrough, and the function of the backpressure regulator is to maintain constant pressure downstream. The unique characteristic of this equipment is that it estimates the water saturation of the coal sample by recording the change in the weight of the separator with an electronic balance. To achieve accurate data, a mass flow meter and an electronic balance were used to monitor the total effluent (gas plus water) production and water production, respectively, and all the data were collected automatically. However, the measurement accuracy of this device was not specifically mentioned in his article.
After the appearance of this device, some other researchers [33,40,41,58,59] used an electronic balance to predict the water saturation of a coal sample via the unsteady state technique. In Ham’s study, the electronic balance used was accurate to two decimal places (0.01 g).

2.3.3. Acoustic Technique

Puri et al. [48] designed an experimental system that can measure the relative permeability, porosity, and irreducible water saturation of coal. Corresponding methods and procedures were also presented in his paper. As shown in Figure 8c, the apparatus includes a gas source, pressure and humidity controller, pressure transducers, Hassler core holder, X-ray emission/detector, acoustic separator, backpressure regulator, mass flow meter, and data collection system. During the relative permeability test, humidified helium gas was injected and the inlet pressure remained constant at all times. A backpressure regulator was also used to maintain a constant downstream pressure. Gas and water were separated by an acoustic separator, and the flow rates were accurately monitored by an acoustic cell and mass flow meter. The Hassler core holder was placed horizontally on a linear X-ray track, and the X-ray intensities were used to calculate the irreducible water saturation and the total cleat porosity of the coal. To make the calculation more efficient and accurate, the flow, pressure, and X-ray data were collected by a computer. Although X-ray scanning was performed with this apparatus, it was only used to calculate the irreducible water saturation by monitoring the change in coal sample water saturation before and after the relative permeability test.
Although X-ray scanning was performed with this device, it was only used to monitor the change in water saturation of coal samples before and after unsteady state testing, which has no influence on the measured data of the relative permeability during the experiment. Puri pointed out that the porosity measurement in his study had an error less than 8%, but the accuracy of the water saturation determined by acoustics was not mentioned. Since then, no other researchers have used this method to measure the porosity, irreducible water saturation, and relative permeability of coal rock. This is likely because the corresponding experimental process is relatively complicated.

2.3.4. X-ray CT Scanning Technique

The relative permeability measurement system designed by Alexis et al. [30] realizes the function of recirculating the experimental fluids in a closed loop and improves fluid utilization. The steady-state method was used in their study, and the in situ water saturation distribution was primarily determined by X-ray CT scanning. A schematic diagram of the relative permeability apparatus is shown in Figure 8d. It includes a presaturation unit, confining pressure system, and backpressure system. The presaturation unit is a pressure vessel that can meet the requirements of high temperature and pressure. The maximum tolerable temperature and pressure are up to 150 °C and 3000 psi (21 MPa), respectively.
When the gas and brine in the presaturation unit reach equilibrium, they are separated by pumps and injected into the core holder at a constant rate. Fluids passing through the sample are received by the backpressure pump, which is operated in a constant pressure mode to maintain constant backpressure. The backpressure pump is connected to the presaturation unit; thus, the fluids collected by the backpressure pump can be delivered into the presaturation unit, realizing the circulation of fluids in the closed loop. According to the pressure difference between the upstream and the downstream, the effective permeability of each phase could be calculated by Darcy’s law. During the experiment, the water and gas saturation distributions in the sample fractures were recorded by X-ray CT scanning. The X-ray scanner and the resolution used were presented in their work, but the accuracy of the water saturation measurement performed with this method was not described in detail.

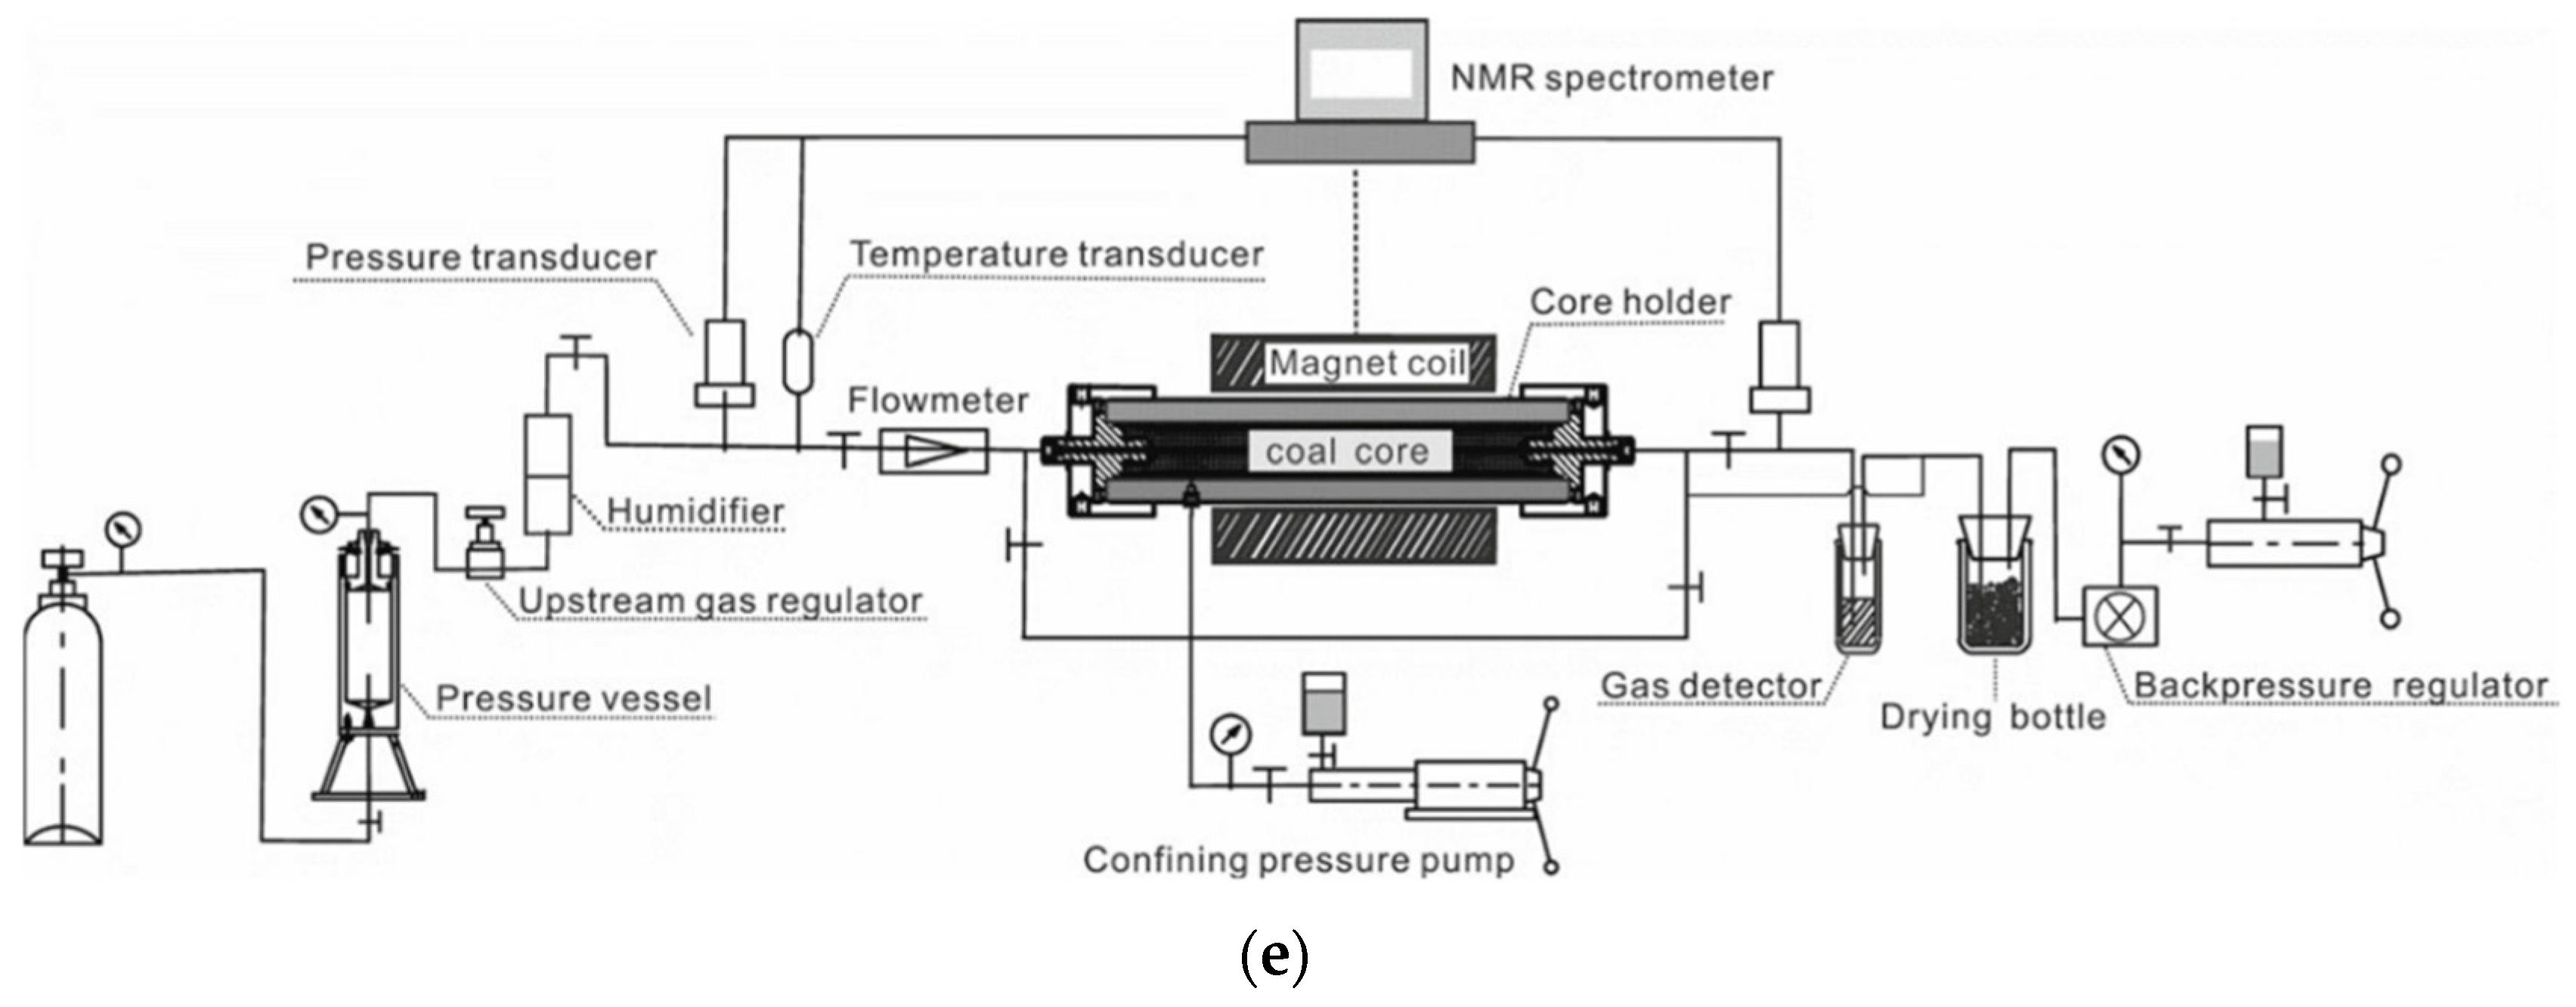
2.3.5. NMR Technique

Sun et al. [32] pointed out that using the conventional volumetric method to measure the unsteady-state relative permeability of unconventional gas reservoirs such as coal and shale is a significant challenge. On the one hand, the porosity of coal is extremely small, and the irreducible water saturation is high; thus, the volume of water in coal is too small to be detected. On the other hand, the dead volume of the measurement system can also lead to inaccuracy in determining the volume of displaced water. Sun applied the low-field NMR spectrometer to the relative permeability measurement apparatus, developing a new method to quantify the displaced water. A schematic diagram of the relative permeability apparatus designed by Sun is shown in Figure 8e. Similar to other apparatuses, this measurement device consists of a gas supply system, a core holder, a backpressure device, and a data collection system. However, an NMR spectrometer was included in this device, and the core holder was specially designed. Nonmetallic and nonmagnetic materials were used to manufacture the coal holder. During the experiment, the upstream gas regulator and the backpressure regulator were used to maintain a constant pressure from the upstream to the downstream. The injected gas was moisturized in the humidifier. A gas detector was placed downstream to monitor the first gas bubble, determining the gas breakthrough time.
In this study, the cumulative water production was calculated based on the results of NMR T2 measurements, without consideration of the dead volume of the system. However, the measurement accuracy was uncertain. In addition, the sample size used in the study was limited to a diameter of less than 5 cm because of the size constraints of the core holder, which makes it difficult to reflect the actual condition of the reservoir. Moreover, the gas used in the study was helium rather than methane, which is not representative of CBM reservoirs.
The development of the technique to determine the water saturation is shown in Figure 9. Twenty sets of data were collected, and each set of data represents a sample (based on the dataset in Table 1). The relative permeability of numerous core samples was measured in the past few decades, but the porosity of the sample or the method used to determine the water saturation was not discussed in some studies. According to the data presented, the gravimetric technique was mostly used to monitor the water saturation of a coal sample during the coal relative permeability measurement, and the porosity of these samples varies greatly, from 0.6% to 22.3%. The acoustic technique applied by Puri et al. [48] was not described in detail, and the measurement accuracy was unclear. In addition, the accuracy of the CT and NMR techniques was also uncertain. However, the porosity of a sample in which water saturation was measured by the acoustic or NMR technique was larger than 2%. The real porosity of the sample used by Alexis in 2015 is not provided in his paper; the value circled by a dotted line in Figure 9 is the fracture porosity used for reservoir simulation studies. The volumetric technique adopted by Durucan in 2014 had an error of approximately ±1.0 cm3 when measuring the volume of liquid in the separator, and the porosity of the sample used in his study ranged from 0.12% to 1.8%.

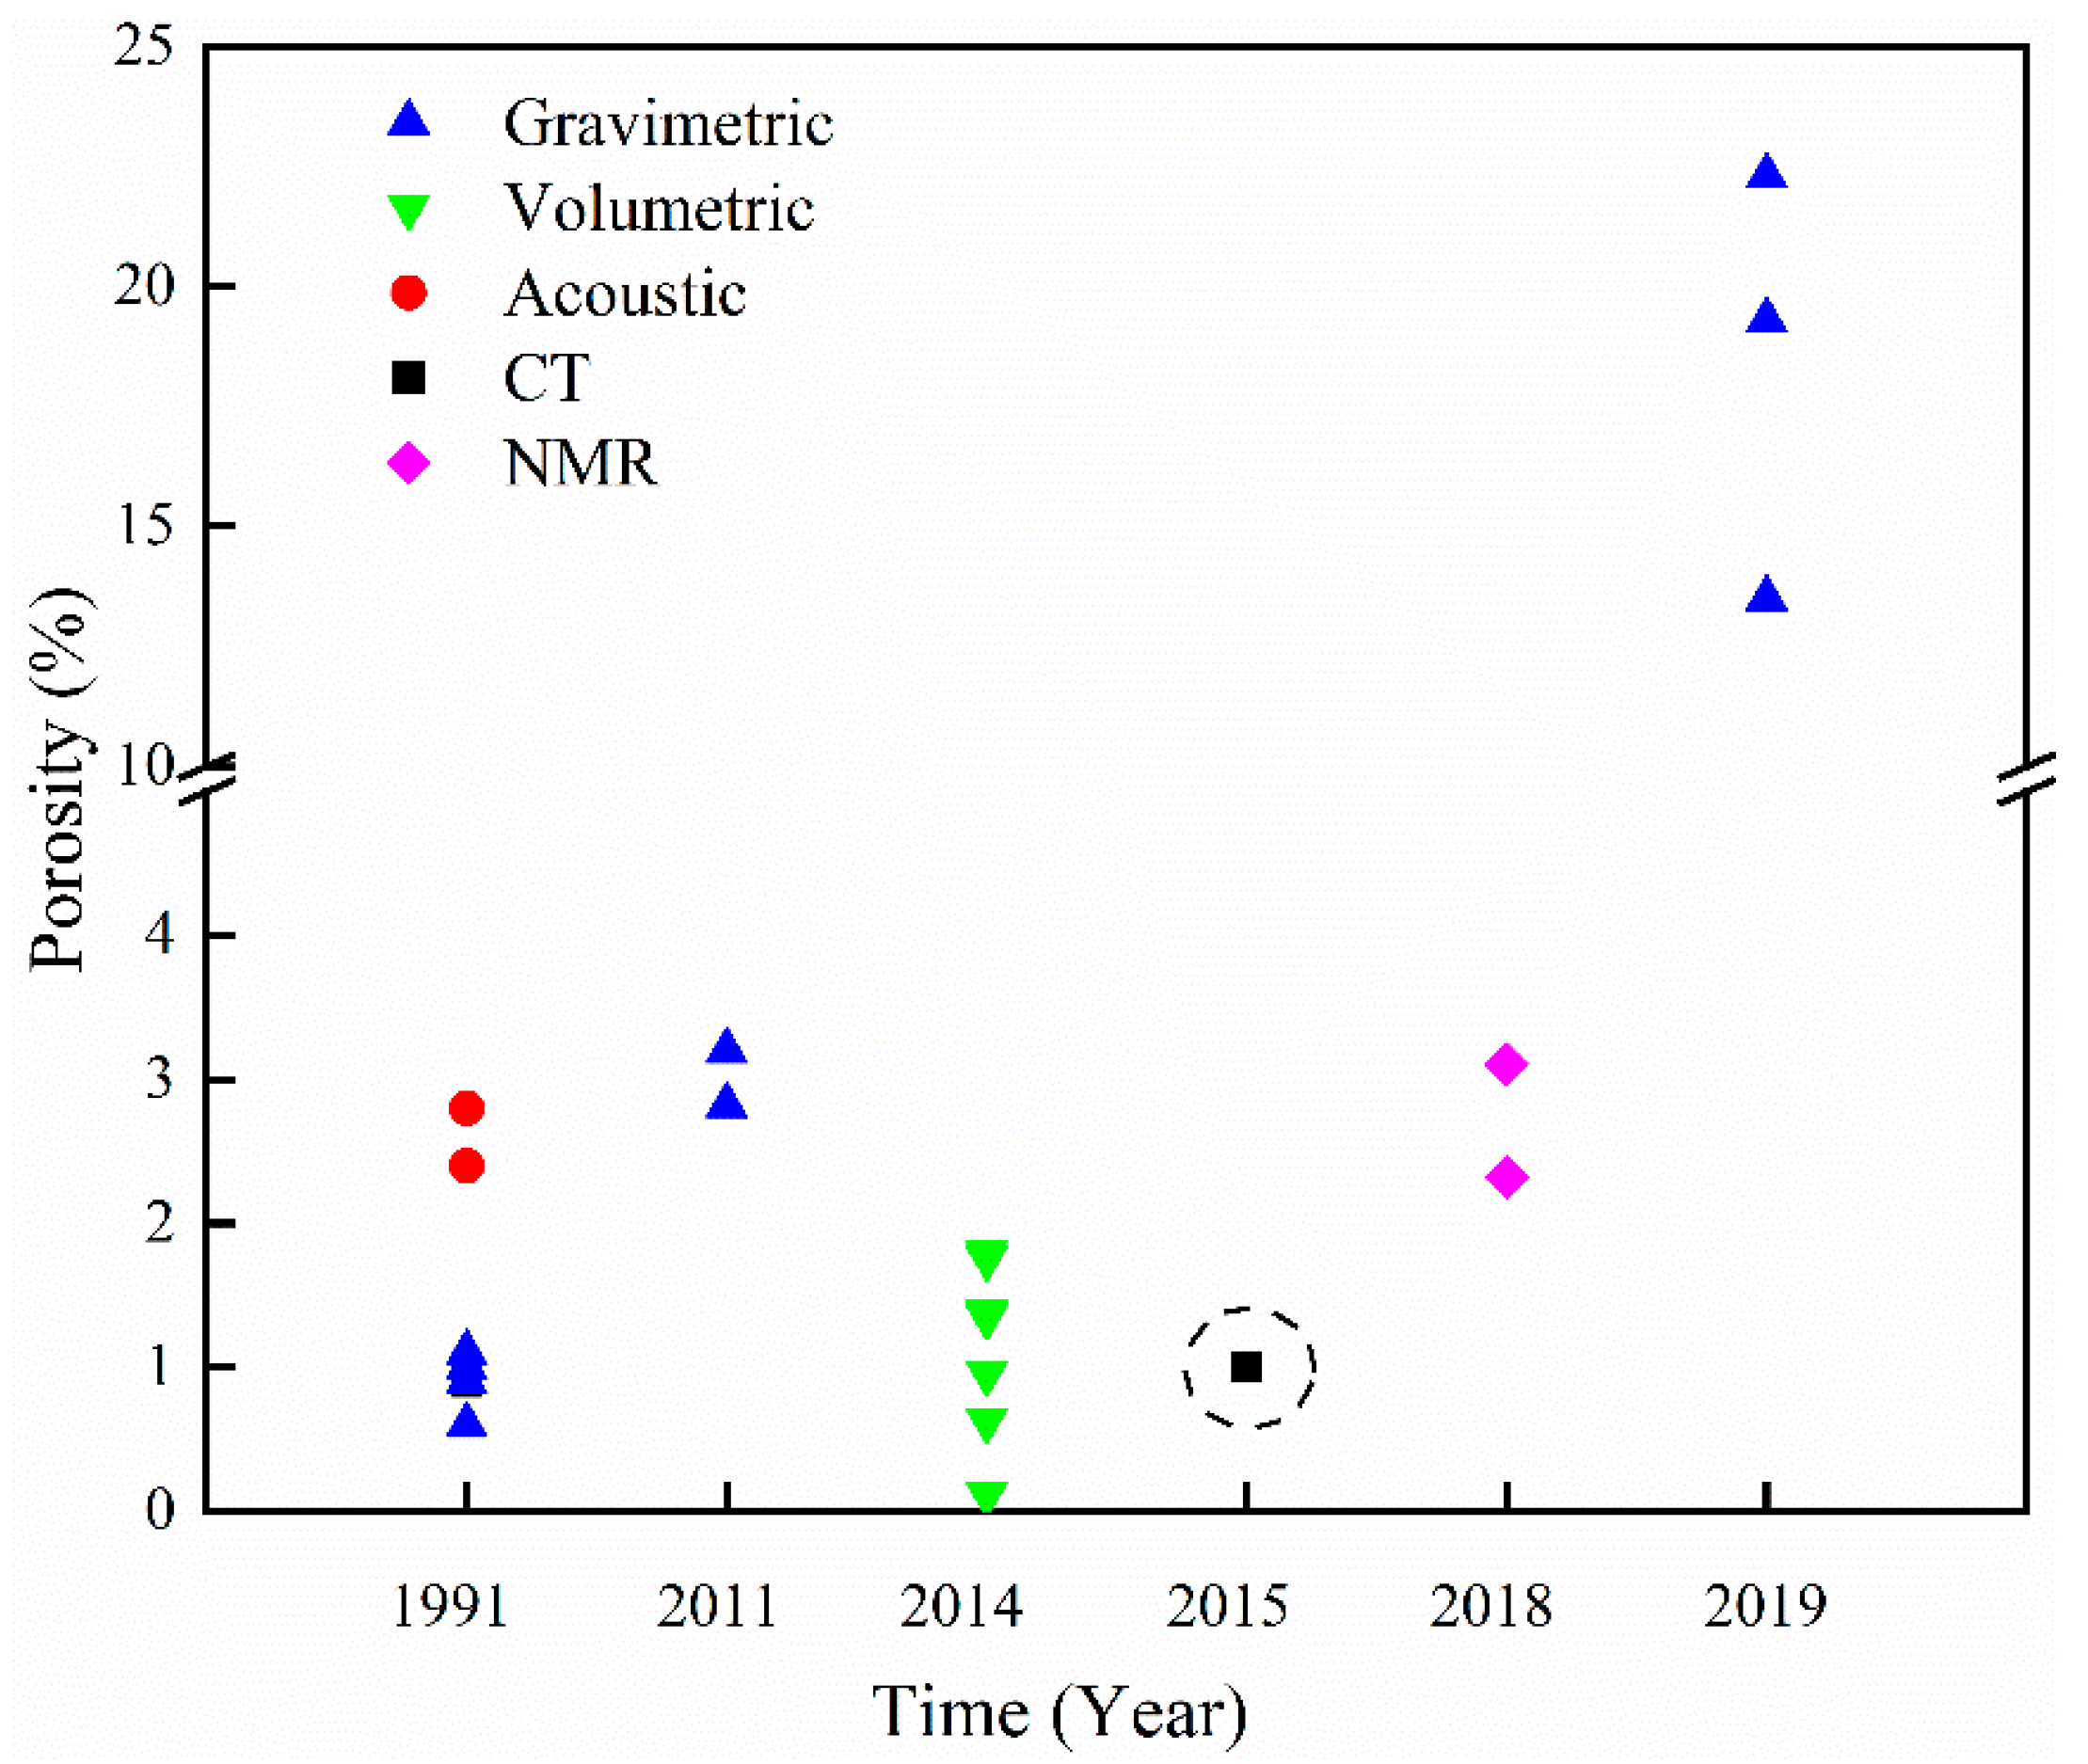
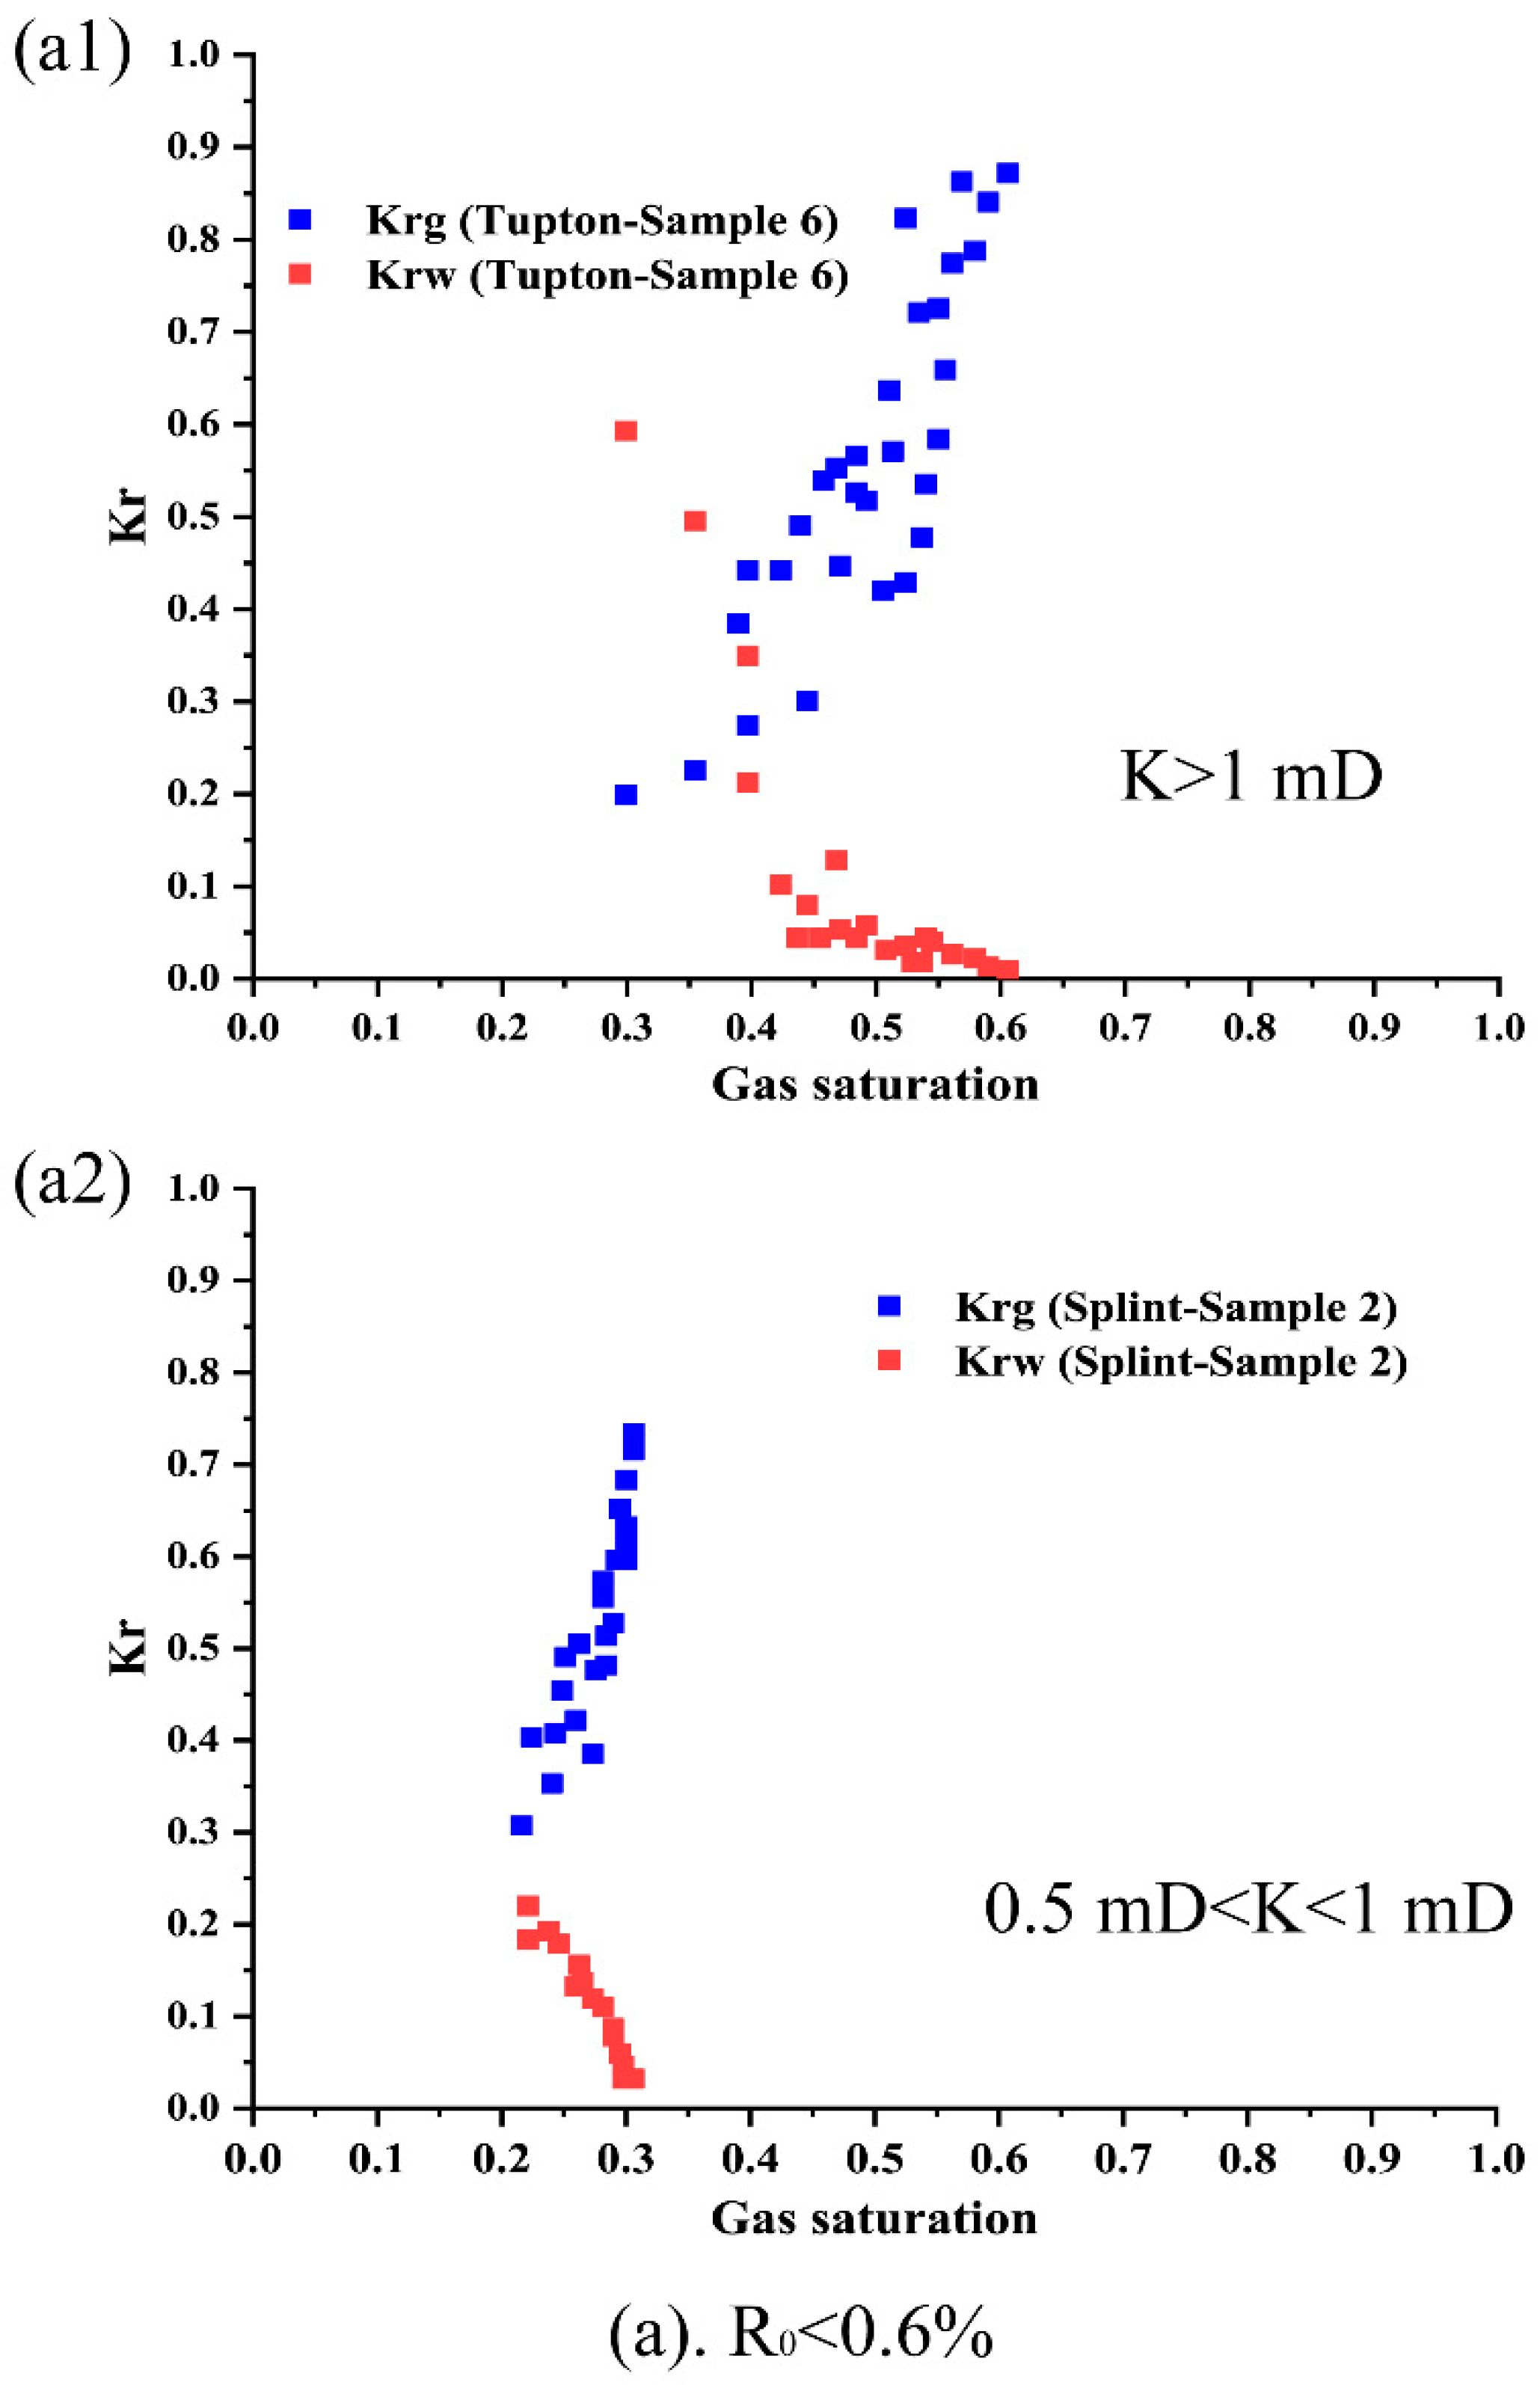
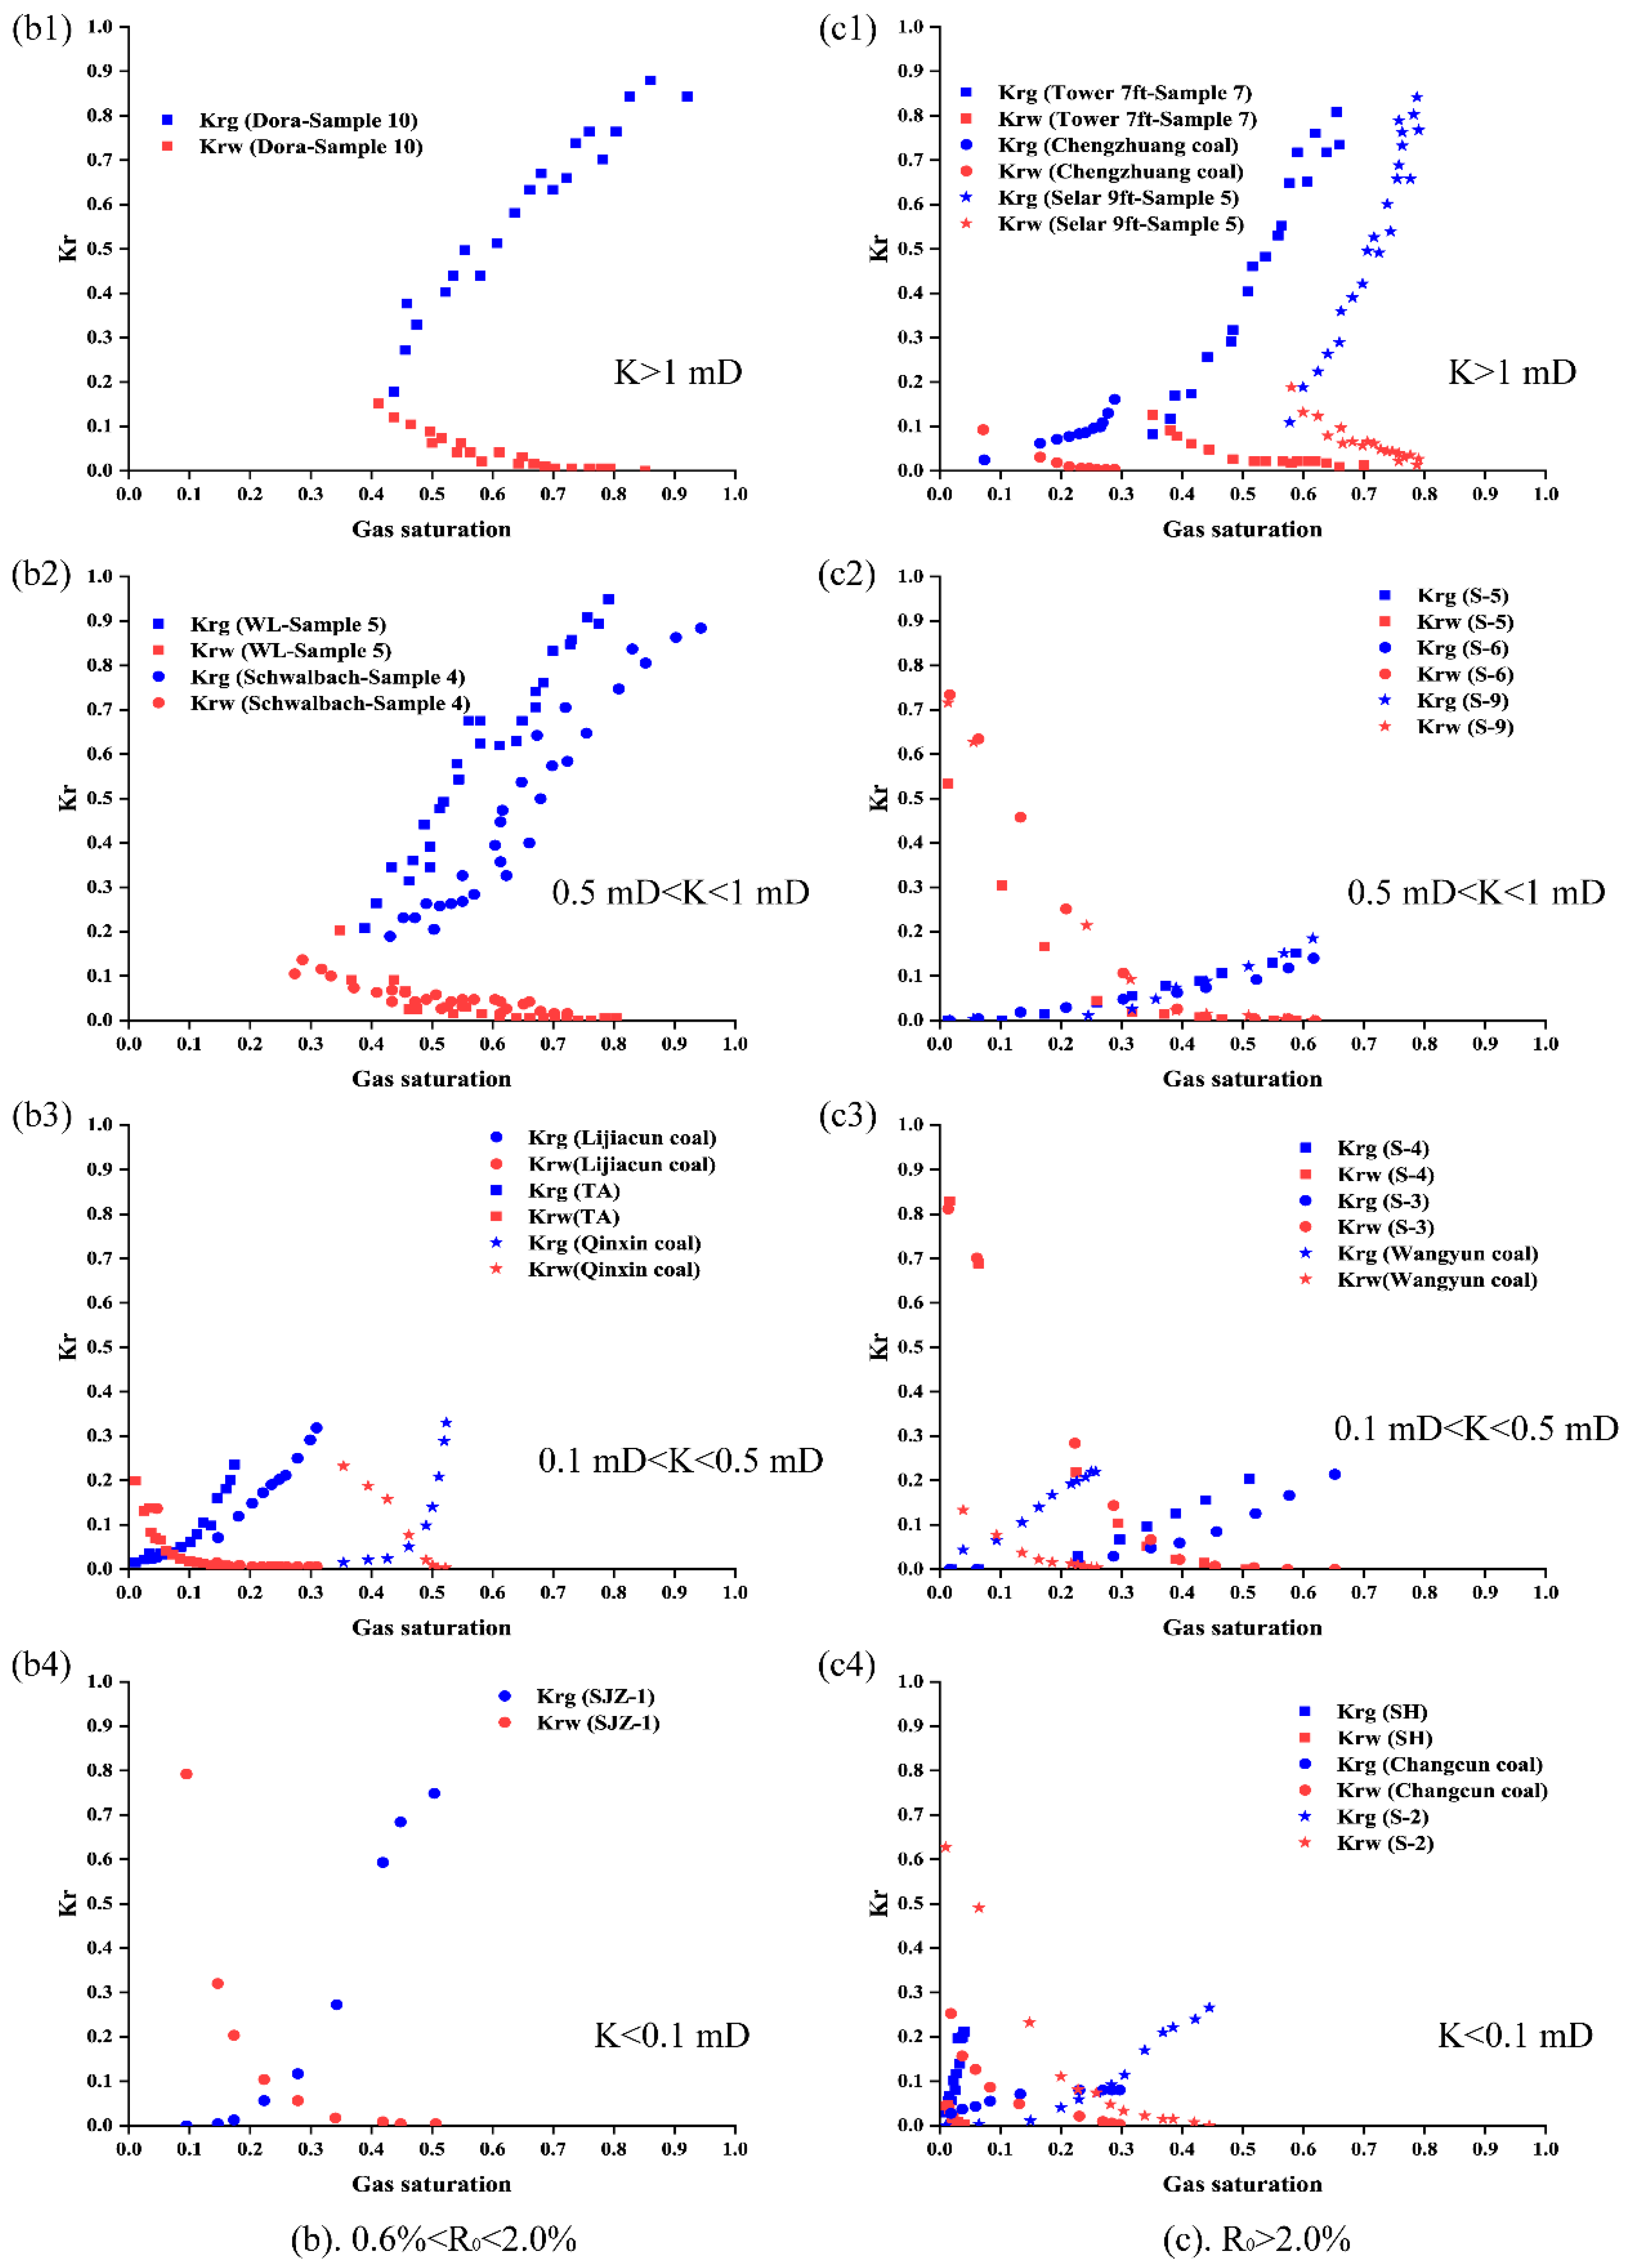
2.4. Summary of Relative Permeability Curves

With the existing relative permeability measurement devices, many scholars have conducted many studies on the relative permeability measurement of different coals. It is well accepted that the relative permeability is one of the most important concepts to describe multiphase flow in porous media and is closely related to the physical properties of the rock itself. Currently, the main relative permeability models, such as the Brooks-Corey model [61], two-parameter model [62], and the empirical model expressed by Shen et al. [23], are established based on the pore structure or composition of coals. Thus, it is reasonable to consider that the coal rank, pore structure, and connectivity may be the factors controlling the relative permeability curves of coals. Relative permeability curves are classified according to the vitrinite reflectance and the absolute permeability, as shown in Figure 10. Unfortunately, the relative permeability data are limited because some studies did not present information on the coal samples used in their research. The analyzed data were collected from the experiments conducted by Shen et al. [23], Durucan et al. [29], Zhang et al. [31], Sun et al. [32], and Zhang et al. [49]. Information on the sample size, stress condition, and test fluids provided in their studies is summarized in Table 1. These relative permeability curves are not only conducive to our in-depth understanding of the gas-water two-phase flow characteristics in the coal reservoir but also provide reliable data for the simulation of CBM production.
As shown in Figure 10, the irreducible water saturation and gas–water relative permeability curves exhibit great differences for different coal samples. On the whole, the irreducible water saturation seems to have a decreasing trend with increasing permeability, while the change in gas-water relative permeability is complicated. As presented in Figure 10a, the irreducible water saturation of the Splint sample is approximately 0.7, while the irreducible water saturation is approximately 0.4 for the sample with an absolute permeability greater than 1 mD. This trend can be observed in Figure 10b,c. For example, the minimal irreducible water saturation of the coal samples in Figure 10b is approximately 0.48 when the absolute permeability is less than 0.5 mD and is approximately 0.1 when the permeability is larger than 0.5 mD. However, there are some special cases, as shown in Figure 10(c1); the irreducible water saturation of Chengzhuang coal is approximately 0.7, although the permeability is up to 5.707 mD. Thus, whether this trend is accurate requires further exploration. Apart from the irreducible water saturation, we explored the change in the cross-point saturation, which reflects the wettability of the coal, but there is no obvious relationship between the cross-point saturation and the absolution permeability or the coal rank.
Apart from the irreducible water saturation, the gas-water relative permeability also varies with the change in the absolute permeability. As shown in Figure 10a, different samples show a great difference in their water relative permeabilities. For the sample with a lower absolute permeability, the measured maximal water relative permeability is approximately 0.2, and the measured maximal water relative permeability reaches 0.6 for the sample with a permeability greater than 1 mD. This trend is contrary to that observed for the coal samples with a vitrinite reflectance greater than 0.6%. As shown in Figure 10b, the water relative permeability of the sample in Figure 10(b4) is high, and the measured maximal water relative permeability is approximately 0.8; however, the water relative permeability is 0.2 for samples with permeabilities greater than 0.1 mD. In addition, with increasing permeability, the water relative permeability profile tends to flatten. The same phenomenon can also be observed in Figure 10c, but the crossover permeability becomes 1 mD.
The changing trend of the gas relative permeability is also related to the permeability of the coal sample. As shown in Figure 10b,c, for the coal samples with vitrinite reflectance greater than 2.0%, the gas relative permeability curve shows a convex or straight shape when the absolute permeability is less than 0.5 mD, and the maximum gas relative permeability measured in the laboratory is approximately 0.3. When the absolute permeability of the coal sample is larger than 0.5 mD, the gas relative permeability curves are slightly concave downwards. Notably, the gas relative permeability in Figure 10(c1) shows a great difference among samples. The test fluid used in the measurement may be the main reason for this phenomenon. For Cheng Zhang coal, methane was used in the study, while helium was used for the other two coals. For the coal samples with vitrinite reflectances in the range of 0.6%–2.0%, with the increase in absolute permeability, the gas relative permeability curves tend to change from concave downwards to straight and then become convex, which is different from the changes observed in the curves of the other coal samples (R0 > 2.0%). For the coal samples with a vitrinite reflectance less than 0.6%, no obvious difference among the gas relative permeability results is observed due to the limited data.
In the same permeability range, the relative permeability curves of the coal samples of different ranks also show large differences, especially in the shape of the gas relative permeability. As shown in Figure 10b,c, the shape of the gas relative permeability curve seems to be very different for coal samples with different R0 values. For example, for coal samples with absolute permeabilities greater than 0.5 mD, the gas relative permeability curves of the samples with 0.6% < R0 < 2.0% are convex or straight, while the gas relative permeability curve for the sample with R0 > 2.0% is concave downwards. Under the condition of an absolute permeability lower than 0.5 mD, the opposite trend is observed.
Nevertheless, the conclusion mentioned above should be treated with caution because the test fluids, stress conditions, sample size, and technique used to measure the water saturation during the test are all different. Moreover, although several researchers have carried out relative permeability measurements of coal, it is obvious that the data are still insufficient, and more work is anticipated to be conducted.

3. Discussion

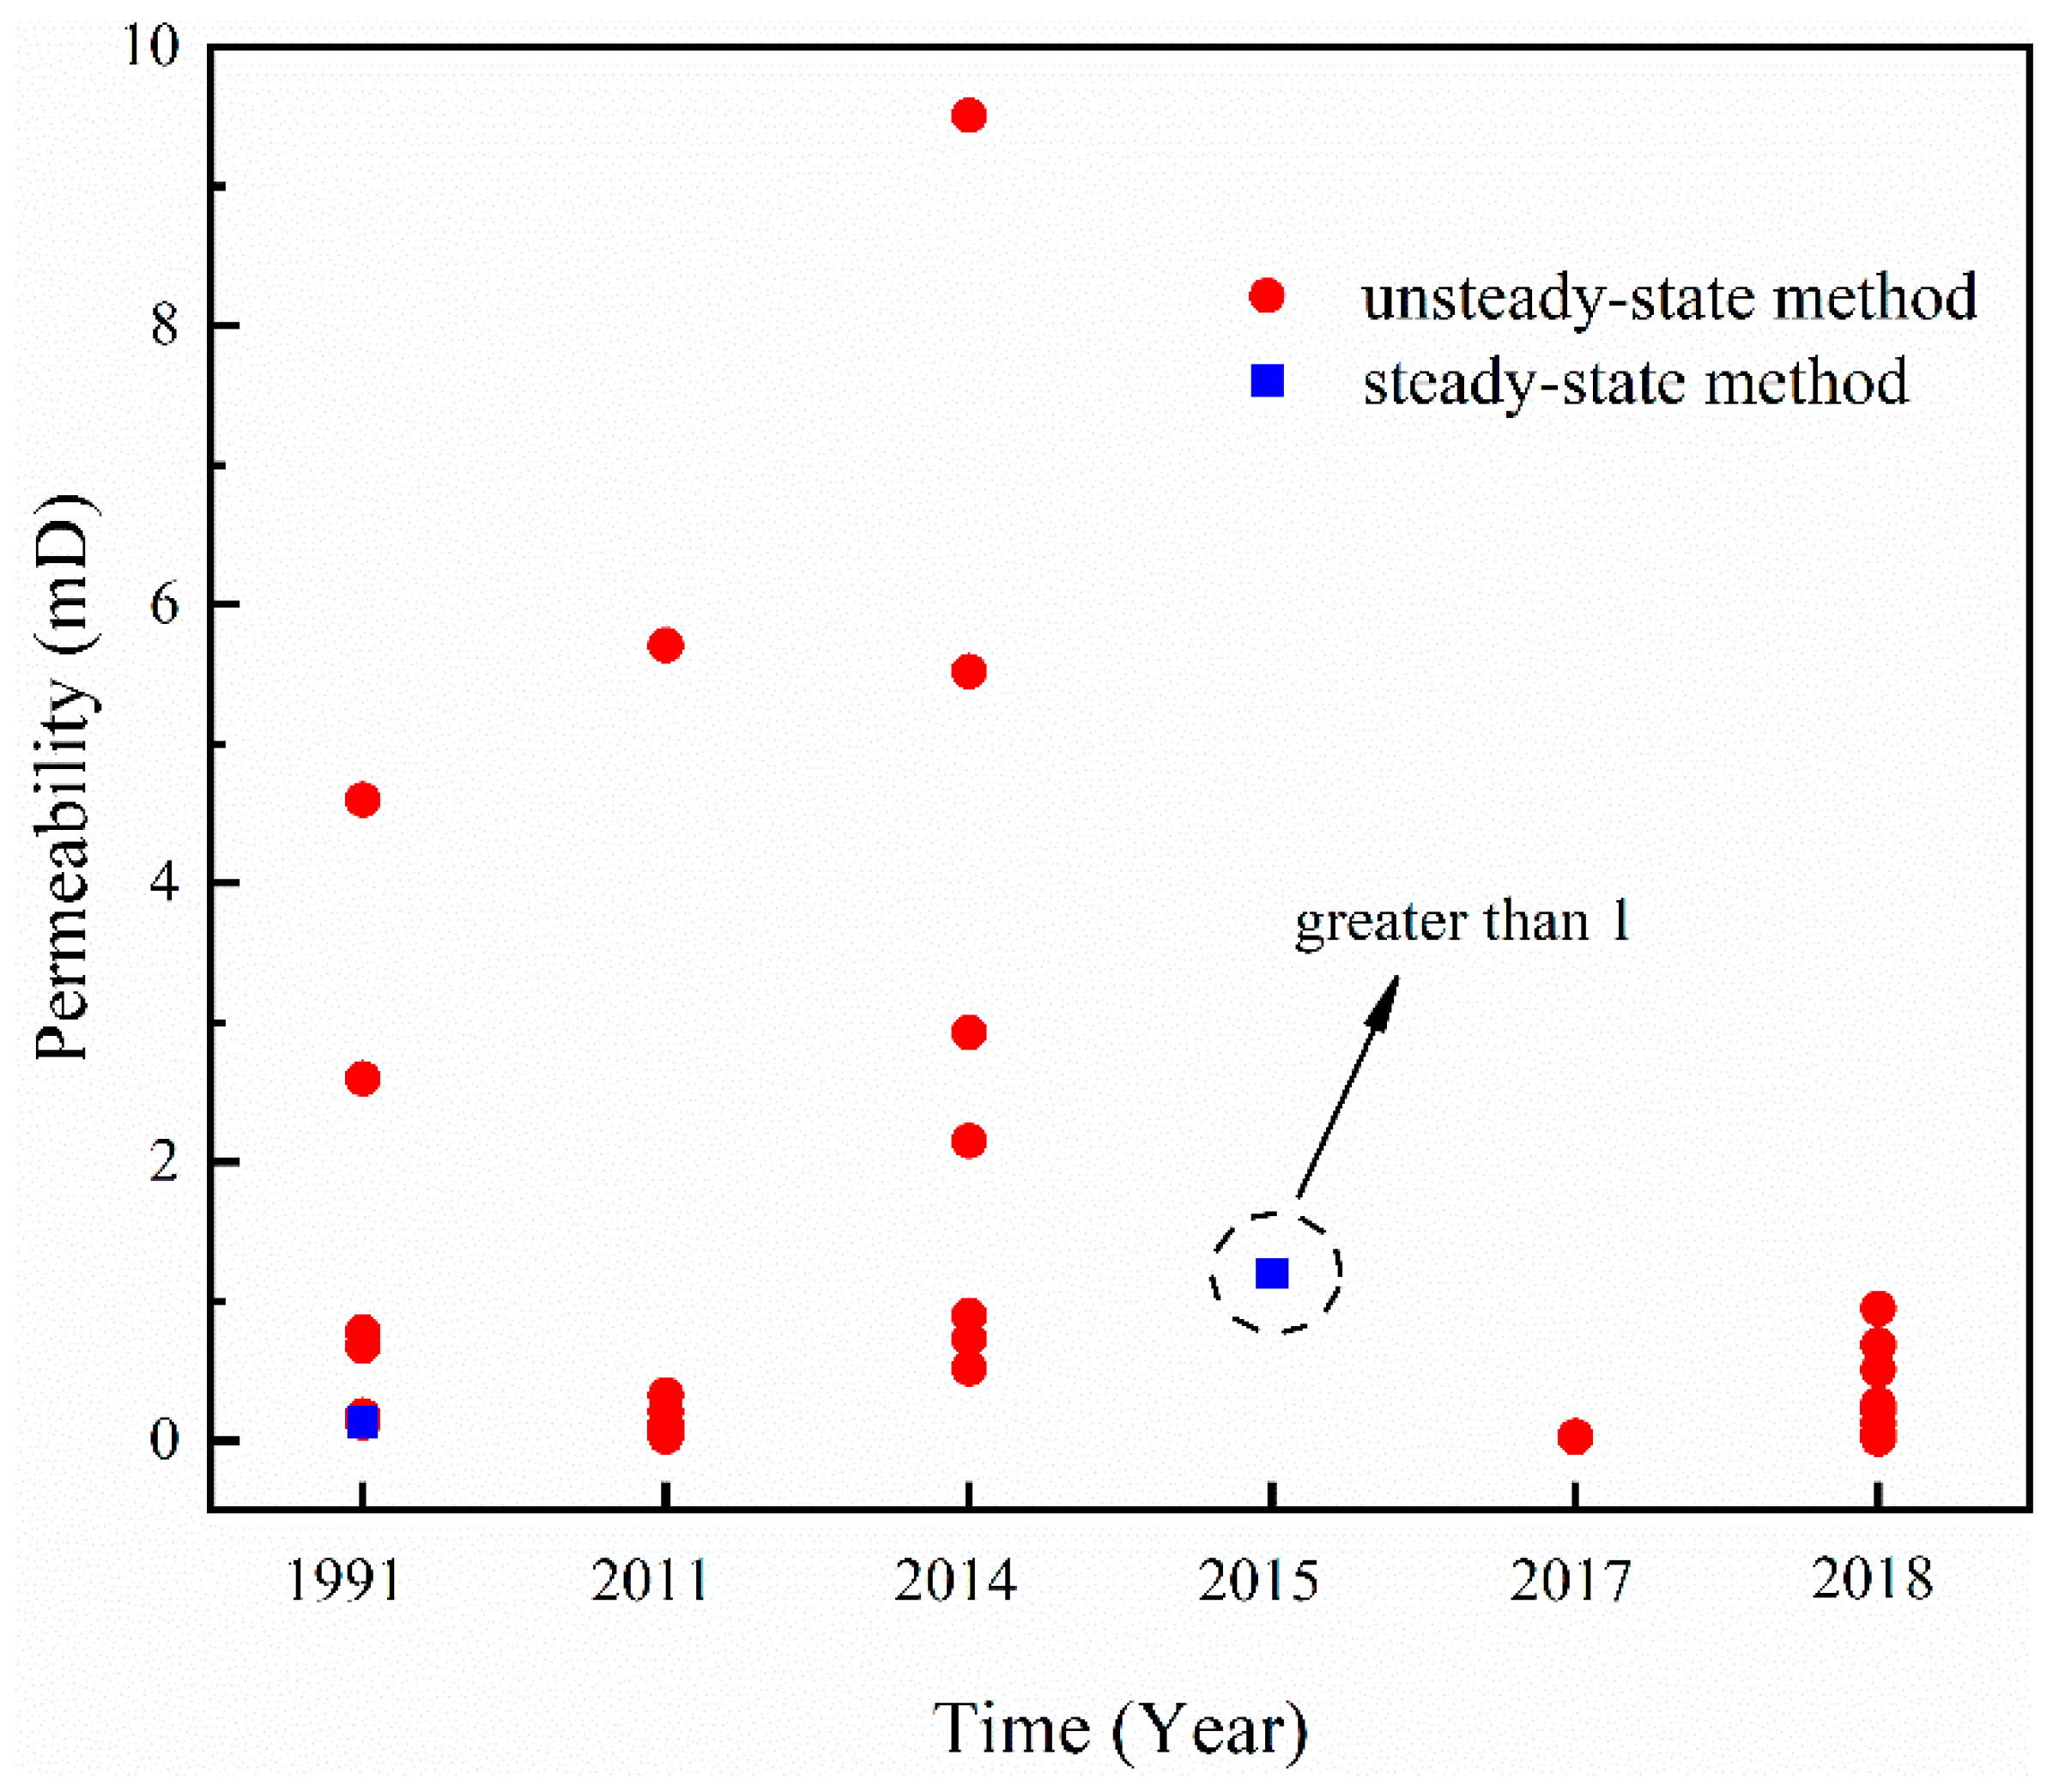
3.1. Determination of Absolute Permeability

The accurate determination of absolute permeability is a prerequisite for the reliable calculation of relative permeability. As described in Section 2.1.3, absolute permeability does not remain uniform during a relative permeability study. In addition, absolute permeability is assumed to be consistent during an experiment for simplicity and convenience. This assumption may be reasonable for nonadsorbing gas-water transport behavior in coal seams if the pore pressure remains constant. However, whether it is rational for adsorbing gas, such as methane and carbon dioxide, is uncertain. During a relative permeability measurement, the gas saturation of the core is unidirectional. Gas will accumulate/release from the coal sample during the displacement process. If the gas used can induce the swelling/shrinkage of the coal matrix, it will cause a dynamic change in coal absolute permeability. Whether the change in absolute permeability in the measurement process needs to be considered has not been well studied.

3.2. Measurement Method

The unsteady-state method has been widely applied to measure the relative permeability of coal. However, there are many uncertainties in this method. First, the dead volume, which is inevitable in actual experimental equipment, is an important factor affecting the relative permeability measurement. Gash [47] once discussed the effect of inaccuracies in determining the dead volume on the gas–water unsteady-state relative permeability curves. The results show that inaccuracies in determining dead volume have a significant effect on the measurement results [47]. Due to the low porosity and high irreducible water saturation characteristics of coal, the volume of water displaced in the unsteady state experiment can be roughly equal to the dead volume. If part of the displacement water remains in the pipeline, it will also cause a large deviation of the measurement results from the actual results. To ignore the influence of gravity on the fluid flow behavior, the sample was placed horizontally, but this increases the probability of water staying in the pipeline. Thus, methods to minimize the effect of dead volume need to be improved. Second, in recent studies, methane was used to ensure that the relative permeability tests truly represent the reservoir flow conditions [33,49]. However, the transient displacement process cannot fully reflect the effect of coal swelling induced by gas adsorption because the time scales of displacement and gas adsorption are very difference [29]. Third, the constant pressure model is usually applied to determine the relative permeability of coal when using the unsteady-state technique. During the experiment, the selected pressure gradient should be large enough to minimize capillary end effects but small enough compared to the total system pressure so that the compressibility effect is negligible, but there is no uniform standard experimental procedure.

3.3. Measurement Devices

As described in Section 2.3, the development of measurement devices has been slow, and a universally recognized optimal technique for the relative permeability measurement of coal has not yet been identified. In the volumetric technique, the gas-water interface will become irregular and unstable when the gas passes through it, causing inaccuracies when reading the volume of water. In the gravimetric technique, the electronic balance has been commonly used, and the accuracy of the measured data depends on the electronic balance used. Usually, a gas-water separator that can withstand high pressures is heavy. Thus, the range of the electronic balance required is generally large, and the measurement accuracy is limited. Recently, although some researchers have incorporated X-ray CT [63] and NMR [32,64] techniques into the measurement of the relative permeability of rocks, due to the limitation of measurement accuracy, the measurement error of these techniques is uncertain when they are applied to low-permeability rocks with a small porosity and pore size, such as coal. It will be beneficial if the measurement accuracy of each technique is compared, which can help us choose a suitable technique to use in future studies and make the measurement results more comparable.
In addition to the techniques already applied, the high-precision differential pressure gauge may be an effective device to use to measure the relative permeability of low-permeability coal [65]. With this device, the volume of the water produced during the experiment can be calculated by the pressure difference between the upper and lower surfaces of the liquid in the separator. Compared to the gravimetric technique, a high-precision differential pressure gauge can be included to monitor the water production without having to address the weight of the separator, guaranteeing the measurement accuracy.

3.4. Measurement Results

In the process of the literature research, we found that some literature only provided the measured relative permeability curve, and specific information on the corresponding coal samples and tests was not given. Consequently, useful data are rare. We suggest providing coal sample information such as composition, porosity, and absolute permeability in future studies, which will help to understand the relative permeability characteristics of different coals. Additionally, from the published data, it can be found that the current relative permeability data of coal samples are insufficient and that there are still some research gaps in the study of coal relative permeability measurement. Although supercritical carbon dioxide has been widely used to investigate its impact on coal permeability [66,67,68], supercritical carbon dioxide-water relative permeability measurements have not been performed. Additionally, with the application of heat injection to enhance CBM recovery [69], it is necessary to investigate the two-phase flow characteristics in coal at different temperatures. Wang et al. [35] studied gas-liquid multiphase seepage in the temperature range of 30–180 °C, but the variation in the relative permeability curve with temperature was not presented. Furthermore, the feasibility of SO2/CO2-ECBM has been studied by Luo et al. [70], but the existing relative permeability measurement mainly focuses on a single gas-water flow, and no research has been conducted on relative permeability measurement with mixed gas (methane/carbon dioxide)–water. To compensate for the lack of data and make the results more comparable, a series of supplementary experiments are required.

4. Conclusions and Future Work

Accurately measuring the relative permeability curve is the basis for further understanding the law of gas-water flow in coals, and it is also an important prerequisite for accurately predicting the production of gas and water during the production of CBM. To further understand the transport behavior of multiple fluids in coal seams, this paper provides a comprehensive review of coal relative permeability measurement via physical experimentation, including the preparation work before the test, measurement methods, and measurement devices. In addition, the relative permeability curves of coal samples from across the world are assembled according to coal rank and absolute permeability. It can be concluded that the general operations (such as sample size selection, test fluid selection, and absolute permeability treatment) performed in the relative permeability measurement vary. A universally recognized optimal technique to determine the water saturation of coal experimentally has not yet been identified. Gap in the study of coal relative permeability still exist. Thus, to further understand the transport behavior of multiple fluids in coal seams, the following relevant work needs to be conducted:
  • Standardize the measurement process to make the experimental results more comparable and reliable. To make the results more comparable, the routine operations in the experiment (such as sample size selection, test fluid selection, and absolute permeability treatment) should be as consistent as possible, which will help to summarize the characteristics of the relative permeability of coals of different rank.
  • Improve the measurement accuracy. The use of a high-precision differential pressure gauge may be an effective technique to monitor water production during the experiment and improve measurement accuracy. In addition, methods should be identified to reduce water retention in the pipe and minimize the system error; for example, vertically placing the pipeline between the sample and the separator and performing hydrophobic treatment on the inner surface of the pipeline will improve measurement accuracy.
  • Fill the research gaps. The relative permeability of supercritical carbon dioxide–water and mixed gas (methane and carbon dioxide)–water in coal as not yet been investigated and must be the next focus of study.

Author Contributions

Conceptualization, S.S. and Z.F.; methodology, X.L.; data curation, S.S.; writing—original draft preparation, S.S.; writing—review and editing, Z.F. and X.L. All authors have read and agreed to the published version of the manuscript.

Funding

The research was funded by the National Key Research and Development Program of China (No. 2018YFB0605601).

Conflicts of Interest

The authors declare no conflict of interest.

References

  1. Zou, C.; Yang, Z.; Zhu, R.; Zhang, G.; Hou, L.; Wu, S.; Tao, S.; Yuan, X.; Dong, D.; Wang, Y.; et al. Progress in China’s Unconventional Oil & Gas Exploration and Development and Theoretical Technologies. Acta Geol. Sin. Engl. Ed. 2015, 89, 938–971. [Google Scholar]
  2. McGlade, C.; Speirs, J.; Sorrell, S. Unconventional gas—A review of regional and global resource estimates. Energy 2013, 55, 571–584. [Google Scholar] [CrossRef]
  3. Xia, X.G.; Yang, Y.F. Attribute Synthetic Evaluation Model for the CBM Recoverability and Its Application. Math. Probl. Eng. 2015, 2015, 434583. [Google Scholar] [CrossRef] [Green Version]
  4. Lau, H.C.; Li, H.Y.; Huang, S. Challenges and Opportunities of Coalbed Methane Development in China. Energy Fuels 2017, 31, 4588–4602. [Google Scholar] [CrossRef]
  5. Hein, F.J.; Ambrose, W.A.; Hackley, P.; Mead, J.S.; American Association of Petroleum Geologists, Energy Minerals Division. Unconventional Energy Resources: 2017 Review. Nat. Resour. Res. 2019, 28, 1661–1751. [Google Scholar]
  6. Thakur, P. Chapter 1—Global Reserves of Coal Bed Methane and Prominent Coal Basins. In Advanced Reservoir and Production Engineering for Coal Bed Methane; Thakur, P., Ed.; Gulf Professional Publishing: Houston, TX, USA, 2017; pp. 1–15. [Google Scholar]
  7. Zhang, M.; Fu, X.H. Characterization of pore structure and its impact on methane adsorption capacity for semi-anthracite in Shizhuangnan Block, Qinshui Basin. J. Nat. Gas Sci. Eng. 2018, 60, 49–62. [Google Scholar] [CrossRef]
  8. Lu, M.; Connell, L.D. A dual-porosity model for gas reservoir flow incorporating adsorption behaviour—Part I. Theoretical development and asymptotic analyses. Transp. Porous Media 2007, 68, 153–173. [Google Scholar] [CrossRef]
  9. Warren, J.E.; Root, P.J. The behavior of naturally fractured reservoirs. Soc. Pet. Eng. J. 1963, 3, 245–255. [Google Scholar] [CrossRef] [Green Version]
  10. Clarkson, C.R.; Bustin, R.M. The effect of pore structure and gas pressure upon the transport properties of coal: A laboratory and modeling study. 1. Isotherms and pore volume distributions. Fuel 1999, 78, 1333–1344. [Google Scholar] [CrossRef]
  11. Mostaghimi, P.; Armstrong, R.T.; Gerami, A.; Hu, Y.B.; Jing, Y.; Kamali, F.; Liu, M.; Liu, Z.S.; Lu, X.; Ramandi, H.L.; et al. Cleat-scale characterisation of coal: An overview. J. Nat. Gas Sci. Eng. 2017, 39, 143–160. [Google Scholar] [CrossRef]
  12. Gray, I. Reservoir Engineering in Coal Seams: Part 1-The Physical Process of Gas Storage and Movement in Coal Seams. SPE Reserv. Eng. 1987, 2, 28–34. [Google Scholar] [CrossRef]
  13. Aminian, K.; Ameri, S. Predicting production performance of CBM reservoirs. J. Nat. Gas Sci. Eng. 2009, 1, 25–30. [Google Scholar] [CrossRef]
  14. De Silva, P.N.K.; Ranjith, P.G.; Choi, S.K. A study of methodologies for CO2 storage capacity estimation of coal. Fuel 2012, 91, 1–15. [Google Scholar] [CrossRef]
  15. Packham, R.; Cinar, Y.; Moreby, R. Simulation of an enhanced gas recovery field trial for coal mine gas management. Int. J. Coal Geol. 2011, 85, 247–256. [Google Scholar] [CrossRef]
  16. Liu, H.H.; Mou, J.H.; Cheng, Y.P. Impact of pore structure on gas adsorption and diffusion dynamics for long-flame coal. J. Nat. Gas Sci. Eng. 2015, 22, 203–213. [Google Scholar] [CrossRef]
  17. Fang, Z. Mechanisms and Experimental Study of Gas Mixture Enhanced Coalbed Methane Recovery Technology. Ph.D. Thesis, Institute of Rock and Soil Mechanics Chinese Academy of Sciences, Wuhan, China, 2009. [Google Scholar]
  18. Ma, T.; Rutqvist, J.; Oldenburg, C.M.; Liu, W.Q.; Chen, J.G. Fully coupled two-phase flow and poromechanics modeling of coalbed methane recovery: Impact of geomechanics on production rate. J. Nat. Gas Sci. Eng. 2017, 45, 474–486. [Google Scholar] [CrossRef] [Green Version]
  19. Teng, T.; Wang, J.G.; Gao, F.; Ju, Y.; Xia, T.Q. Impact of Water Film Evaporation on Gas Transport Property in Fractured Wet Coal Seams. Transp. Porous Media 2016, 113, 357–382. [Google Scholar] [CrossRef]
  20. Honarpour, M.; Mahmood, S.M. Relative-Permeability Measurements—An Overview. J. Petrol. Technol. 1988, 40, 963–966. [Google Scholar] [CrossRef] [Green Version]
  21. Nie, B.; Liu, X.; Yang, L.; Meng, J.; Li, X. Pore structure characterization of different rank coals using gas adsorption and scanning electron microscopy. Fuel 2015, 158, 908–917. [Google Scholar] [CrossRef]
  22. Vassilev, S.V.; Kitano, K.; Vassileva, C.G. Some relationships between coal rank and chemical and mineral composition. Fuel 1996, 75, 1537–1542. [Google Scholar] [CrossRef]
  23. Shen, J.; Qin, Y.; Wang, G.X.; Fu, X.H.; Wei, C.T.; Lei, B. Relative permeabilities of gas and water for different rank coals. Int. J. Coal Geol. 2011, 86, 266–275. [Google Scholar] [CrossRef]
  24. Palmer, I.; Mansoori, J. How permeability depends on stress and pore pressure in coalbeds: A new model. In Proceedings of the SPE Annual Technical Conference and Exhibition of the Society of Petroleum Engineers, Denver, CO, USA, 6–9 October 1996. [Google Scholar]
  25. Pan, Z.J.; Connell, L.D.; Camilleri, M. Laboratory characterisation of coal reservoir permeability for primary and enhanced coalbed methane recovery. Int. J. Coal Geol. 2010, 82, 252–261. [Google Scholar] [CrossRef]
  26. Reznik, A.A.; Dabbous, M.K.; Fulton, P.F.; Taber, J.J. Air-Water Relative Permeability Studies of Pittsburgh and Pocahontas Coals. Soc. Pet. Eng. J. 1974, 14, 556–562. [Google Scholar] [CrossRef]
  27. Gash, B.W.; Volz, R.F.; Potter, G.; Corgan, J.M. The Effects of Cleat Orientation and Confining Pressure on Cleat Porosity, Permeability and Relative Permeability in Coal. In Proceedings of the SPWLA/SCA Symposium, Oklahoma City, OK, USA, 15–16 June 1992; pp. 15–16. [Google Scholar]
  28. Dabbous, M.K.; Reznik, A.A.; Mody, B.G.; Fulton, P.F.; Taber, J.J. Gas-Water Capillary Pressure in Coal at Various Overburden Pressures. Soc. Pet. Eng. J. 1976, 16, 261–268. [Google Scholar] [CrossRef]
  29. Durucan, S.; Ahsan, M.; Shi, J.Q.; Syed, A.; Korre, A. Two phase relative permeabilities for gas and water in selected European coals. Fuel 2014, 134, 226–236. [Google Scholar] [CrossRef]
  30. Alexis, D.A.; Karpyn, Z.T.; Ertekin, T.; Crandall, D. Fracture permeability and relative permeability of coal and their dependence on stress conditions. J. Unconv. Oil Gas Res. 2015, 10, 1–10. [Google Scholar] [CrossRef] [Green Version]
  31. Zhang, X.Y.; Wu, C.F.; Liu, S.X. Characteristic analysis and fractal model of the gas-water relative permeability of coal under different confining pressures. J. Pet. Sci. Eng. 2017, 159, 488–496. [Google Scholar] [CrossRef]
  32. Sun, X.; Yao, Y.; Ripepi, N.; Liu, D. A Novel Method for Gas-Water Relative Permeability Measurement of Coal Using NMR Relaxation. Transp. Porous Media 2018, 124, 73–90. [Google Scholar] [CrossRef]
  33. Shen, J.; Qin, Y.; Li, Y.P.; Wang, G. Experimental investigation into the relative permeability of gas and water in low-rank coal. J. Pet. Sci. Eng. 2019, 175, 303–316. [Google Scholar] [CrossRef]
  34. Shaw, D.; Mostaghimi, P.; Armstrong, R.T. The dynamic behaviour of coal relative permeability curves. Fuel 2019, 253, 293–304. [Google Scholar] [CrossRef]
  35. Wang, J.M.; Zhao, Y.S.; Mao, R.B. Impact of temperature and pressure on the characteristics of two-phase flow in coal. Fuel 2019, 253, 1325–1332. [Google Scholar] [CrossRef]
  36. Mazzotti, M.; Pini, R.; Storti, G. Enhanced coalbed methane recovery. J. Supercrit. Fluids 2009, 47, 619–627. [Google Scholar] [CrossRef]
  37. Mukherjee, M.; Misra, S. A review of experimental research on Enhanced Coal Bed Methane (ECBM) recovery via CO2 sequestration. Earth-Sci. Rev. 2018, 179, 392–410. [Google Scholar] [CrossRef]
  38. Puri, R.; Yee, D. Enhanced Coalbed Methane Recovery. In Proceedings of the SPE Annual Technical Conference and Exhibition, New Orleans, LA, USA, 23–26 September 1990; Society of Petroleum Engineers: Richardson, TX, USA, 1990. [Google Scholar]
  39. Gunter, W.; Gentzis, T.; Rottenfusser, B.; Richardson, R. Deep coalbed methane in Alberta, Canada: A fuel resource with the potential of zero greenhouse gas emissions. Energy Convers. Manag. 1997, 38, S217–S222. [Google Scholar] [CrossRef]
  40. Zhang, Y. Experimental Study on Gas-Water Two Phase Flow in Coalbed Media. Master’s Thesis, China University of Petroleum, Qingdao, China, 2011. [Google Scholar]
  41. Ham, Y. Measurement and Simulation of Relative Permeability of Coal to Gas and Water. Ph.D. Thesis, The University of Calgary, Calgary, AB, USA, 2011. [Google Scholar]
  42. Gao, G.; Bai, Y.; Hou, T.; Guan, T. Experimental on relative permeability of gas and water based on coal unsteady-state method. Saf. Coal Mines 2015, 46, 12–15. [Google Scholar]
  43. Zhang, J.Y.; Feng, Q.H.; Zhang, X.M.; Wen, S.M.; Zhai, Y.Y. Relative Permeability of Coal: A Review. Transp. Porous Media 2015, 106, 563–594. [Google Scholar] [CrossRef]
  44. Meaney, K.; Paterson, L. Relative Permeability in Coal. In Proceedings of the SPE Asia Pacific Oil and Gas Conference, Adelaide, Australia, 28–31 October 1996; Society of Petroleum Engineers: Adelaide, Australia, 1996; p. 6. [Google Scholar]
  45. Karacan, C.O. Swelling-induced volumetric strains internal to a stressed coal associated with CO2 sorption. Int. J. Coal Geol. 2007, 72, 209–220. [Google Scholar] [CrossRef]
  46. Zhou, D.; Feng, Z.C.; Zhao, D.; Zhao, Y.S.; Cai, T.T. Experimental study of meso-structural deformation of coal during methane adsorption-desorption cycles. J. Nat. Gas Sci. Eng. 2017, 42, 243–251. [Google Scholar] [CrossRef]
  47. Gash, B.W. Measurement of “Rock Properties” in Coal for Coalbed Methane Production. In Proceedings of the SPE Annual Technical Conference and Exhibition, Dallas, TX, USA, 6–9 October 1991; Society of Petroleum Engineers: Richardson, TX, USA, 1991. [Google Scholar]
  48. Puri, R.; Evanoff, J.C.; Brugler, M.L. Measurement of coal cleat porosity and relative permeability characteristics. In Proceedings of the SPE Gas Technology Symposium, Houston, TX, USA, 22–24 January 1991. [Google Scholar]
  49. Zhang, Z.; Qin, Y.; Zhuang, X.G.; Li, G.Q.; Wang, X.M. Poroperm characteristics of high-rank coals from Southern Qinshui Basin by mercury intrusion, SEM-EDS, nuclear magnetic resonance and relative permeability analysis. J. Nat. Gas Sci. Eng. 2018, 51, 116–128. [Google Scholar] [CrossRef]
  50. Chen, G. Gas Slippage and Matrix Shrinkage Effects on Permeability of Coal. Ph.D. Thesis, The University of Arizona, Tucson, Arizona, 1994. [Google Scholar]
  51. Mazumder, S.; Plug, W.J.; Bruining, H. Capillary Pressure and Wettability Behavior of Coal-Water-Carbon dioxide System. In Proceedings of the SPE Annual Technical Conference and Exhibition, Denver, CO, USA, 5–8 October 2003; pp. 2467–2476. [Google Scholar]
  52. Leverett, M.C. Capillary behavior in porous solids. Trans. AIME 1941, 142, 152–169. [Google Scholar] [CrossRef]
  53. Buckley, S.E.; Leverett, M.C. Mechanism of fluid displacement in sands. Trans. AIME 1942, 146, 107–116. [Google Scholar] [CrossRef]
  54. Welge, H.J. A simplified method for computing oil recovery by gas or water drive. Trans. AIME 1952, 195, 91–98. [Google Scholar] [CrossRef]
  55. Johnson, E.F.; Bossler, D.P.; Naumann, V.O. Calculation of Relative Permeability from Displacement Experiments. Trans. AIME 1959, 216, 370–372. [Google Scholar] [CrossRef]
  56. Dabbous, M.K.; Reznik, A.A.; Taber, J.J.; Fulton, P.F. The Permeability of Coal to Gas and Water. Soc. Pet. Eng. J. 1974, 14, 563–572. [Google Scholar] [CrossRef]
  57. Laubach, S.E.; Marrett, R.A.; Olson, J.E.; Scott, A.R. Characteristics and origins of coal cleat: A review. Int. J. Coal Geol. 1998, 35, 175–207. [Google Scholar] [CrossRef]
  58. Cheng, Q. Research on determination of coalbed gas-water relative permeability. J. Jiaozuo Inst. Technol. 2001, 20, 199–201. [Google Scholar]
  59. Ge, L.; Soares, F.T.; Mahoney, S.; Hamilton, C.; Khan, C.; Steel, K.; Rufford, T.E.; Rudolph, V. Effect of oxidation and silane surface treatments of coal powders on relative permeability in packed coal beds. J. Nat. Gas Sci. Eng. 2019, 69, 102931. [Google Scholar] [CrossRef]
  60. Paterson, L.; Meaney, K.; Smyth, M. Measurements of relative permeability, absolute permeability and fracture geometry in coal. In Proceedings of the Coalbed Methane Symposium, Townsville, Australia, 19–21 November 1992. [Google Scholar]
  61. Brooks, R.H.; Corey, A.T. Properties of porous media affecting fluid flow. J. Irrig. Drain. Div. 1966, 92, 61–88. [Google Scholar]
  62. Chen, D.; Pan, Z.J.; Liu, J.S.; Connell, L.D. An improved relative permeability model for coal reservoirs. Int. J. Coal Geol. 2013, 109, 45–57. [Google Scholar] [CrossRef]
  63. Schembre, J.M.; Kovscek, A.R. A technique for measuring two-phase relative permeability in porous media via X-ray CT measurements. J. Pet. Sci. Eng. 2003, 39, 159–174. [Google Scholar] [CrossRef]
  64. Guo, Y.; Pan, B.; Zhang, L. A New Method to Identify Reservoirs in Tight Sandstones Based on the New Model of Transverse Relaxation Time and Relative Permeability. Geofluids 2017, 2017, 6787038. [Google Scholar] [CrossRef]
  65. Fang, Z.; Li, X. Device for Measuring Gas and Water Relative Permeability of Porous Media; China National Intellectual Property: Beijing, China, 2014.
  66. Vishal, V.; Singh, T. A laboratory investigation of permeability of coal to supercritical CO2. Geotech. Geol. Eng. 2015, 33, 1009–1016. [Google Scholar] [CrossRef]
  67. Li, W.; Liu, Z.D.; Su, E.L.; Cheng, Y.P. Experimental Investigation on the Effects of Supercritical Carbon Dioxide on Coal Permeability: Implication for CO2 Injection Method. Energy Fuels 2019, 33, 503–512. [Google Scholar] [CrossRef]
  68. Du, Y.; Sang, S.; Pan, Z.; Wang, W.; Liu, S.; Fu, C.; Zhao, Y.; Zhang, J. Experimental study of supercritical CO2-H2O-coal interactions and the effect on coal permeability. Fuel 2019, 253, 369–382. [Google Scholar] [CrossRef]
  69. Salmachi, A.; Haghighi, M. Feasibility Study of Thermally Enhanced Gas Recovery of Coal Seam Gas Reservoirs Using Geothermal Resources. Energy Fuels 2012, 26, 5048–5059. [Google Scholar] [CrossRef]
  70. Luo, C.J.; Zhang, D.F.; Lun, Z.M.; Zhao, C.P.; Wang, H.T.; Pan, Z.J.; Li, Y.H.; Zhang, J.; Jia, S.Q. Displacement behaviors of adsorbed coalbed methane on coals by injection of SO2/CO2 binary mixture. Fuel 2019, 247, 356–367. [Google Scholar] [CrossRef]
Figure 1. Four stages in the production of coalbed methane (CBM).
Energies 13 05568 g001
Figure 2. Frequency of the sample size used in previous studies.
Energies 13 05568 g002
Figure 3. Frequency of test fluid (gas) used in previous studies.
Energies 13 05568 g003
Figure 4. The principle of steady-state measurement.
Energies 13 05568 g004
Figure 5. The principle of unsteady-state measurement.
Energies 13 05568 g005
Figure 6. The development of the steady-state and unsteady-state methods.
Energies 13 05568 g006
Figure 7. Schematic diagram of the relative permeability apparatus [56].
Energies 13 05568 g007
Figure 8. Schematic diagram of relative permeability testing apparatuses. (a) Volumetric technique [30]. (b) Gravimetric technique [48]. (c) Acoustic technique [49]. (d) X-ray computed tomography (CT) scanning technique [31]. (e) Nuclear magnetic resonance (NMR) technique [33].
Energies 13 05568 g008aEnergies 13 05568 g008bEnergies 13 05568 g008c
Figure 9. The development of the technique to determine the water saturation.
Energies 13 05568 g009
Figure 10. Summary of the relative permeability results according to the permeability and coal rank.
Energies 13 05568 g010aEnergies 13 05568 g010b
Table 1. Summary of the experimental conditions designed by different authors with their self-developed experimental equipment. “*” represents the net confining pressure; “ng” means not given.
AuthorMethodSample Dimensions (cm)Test FluidsAbsolute Permeability (mD)Experimental Conditions
Confining Pressure (MPa)Inlet Pressure (MPa)Outlet Pressure (MPa)Temperature (°C)
Reznik, Dabbous, Fulton and Taber [26]Steady-state method and
Unsteady-state method
ngair–distilled waterng1.38/4.14/6.89ngngng
Gash [47]Steady-state method and
Unsteady-state method
D = 5.08–8.89helium–water0.04–4.63.1/6.892.552.07ng
Puri, Evanoff and Brugler [48]Unsteady-state methodD = 8.89/6.35
L = 8.38/6.35
helium–water0.18/
0.68
7.45/2.632.10ng
2.79 *ng2.07
Paterson et al. [60]Unsteady-state methodD = 5
L = 12
methane–waterngngngngng
Cheng [58]Unsteady-state methodhelium–waterngngngngng
Ham [41]Unsteady-state methodD = 7.62
L = 7.62
helium–brine
methane–brine
carbon dioxide–brine
0.0772/
0.0784
5.521.380.6922
2.762.07
3.452.76
Shen, Qin, Wang, Fu, Wei and Lei [23]Unsteady-state methodD = 5
L = 10
methane–water0.03–5.712.5*ngngng
Zhang [40]Unsteady-state methodD = 7.69
L = 21
methane–distilled water
nitrogen–distilled water
Carbon dioxide–distilled water
375.2ngngngng
Durucan, Ahsan, Shi, Syed and Korre [29]Unsteady-state methodD = 5
L = 6–10
helium–water0.52–9.516.9/4.11.921.38ng
Alexis, Karpyn, Ertekin and Crandall [30]Steady-state methodD = 5.08helium–brine
carbon dioxide–brine
>12.1/2.25/
3.8/4
ngng20 ± 2
Zhang, Wu and Liu [31]Unsteady-state methodD = 4.85
L = 10.03
helium–water0.022–0.0312/4/6A + 1Ang
Sun, Yao, Ripepi and Liu [32]Unsteady-state methodD = 2.5
L = 6
helium–brine0.015/
0.128
4.3/8.3ngngng
Zhang, Qin, Zhuang, Li and Wang [49]Unsteady-state methodD = 2.5
L = 5
methane–brine0.052–0.952.5 *ngng25
Shaw, Mostaghimi and Armstrong [34]Unsteady-state methodD = 6.10
L = 7.9
helium–brineng5.524.414.34ng
5.522.172.09
5.520.570.45
Shen, Qin, Li and Wang [33]Unsteady-state methodD = 2.50methane–water7.54.90.122 ± 1
ng8.54.90.1
9.54.90.1
10.54.90.1
94.90.1
9.55.90.1
106.90.1
10.57.90.1
Wang, Zhao and Mao [35]Unsteady-state methodD = 5
L = 10–11
nitrogen–waterng43ng30/60/90/
120/150/180
53ng
Publisher’s Note: MDPI stays neutral with regard to jurisdictional claims in published maps and institutional affiliations.

