Article

Where Renewable Energy Sources Funds are Invested? Spatial Analysis of Energy Production Potential and Public Support

1
Institute of Spatial Management, Wrocław University of Environmental and Life Sciences, ul. Grunwaldzka 55, 50-357 Wrocław, Poland
2
Department of Mathematics, Wrocław University of Environmental and Life Sciences, ul. Grunwaldzka 53, 50-357 Wrocław, Poland
3
Student Scientific Organization of Spatial Management PUZZLE, Wrocław University of Environmental and Life Sciences, ul. Grunwaldzka 55, 50-357 Wrocław, Poland
*
Author to whom correspondence should be addressed.
Energies 2020, 13(21), 5551; https://doi.org/10.3390/en13215551
Submission received: 14 September 2020 / Revised: 14 October 2020 / Accepted: 20 October 2020 / Published: 23 October 2020
(This article belongs to the Special Issue Economic Development and Energy Policy)

Abstract

:
Energy transition in the European Union (EU) is strongly related to public support from structural funds which enable member states to create new and renovate existing renewable energy source (RES) installations. However, in order to maximize benefits of these investments it is crucial to consider where RES funds are allocated, how it corresponds with RES potential in specific locations, and how future implementation of energy policies can be improved. In this study, RES development projects supported by EU funds, implemented in the period 2004–2019 in Poland, were analyzed in relation to solar, wind and biomass energy potential. The study was conducted with the use of agglomeration method and k-mean method to define clusters of local administrative units characterized by similar features of RES funds absorption and renewable energy production potential. The results obtained show that in the case of all energy sources there is no correlation between high RES funds absorption and energy production potential. The final conclusion of the research is that in order to boost energy transformation into more sustainable solutions, renewable energy production potential should be considered as a factor to allocate public financial support for future energy policy implementation.

1. Introduction

The domain of energy transition is not a new topic. European Union (EU) policy efforts on energy efficiency started in the 1970s as response to the oil crisis [1] and at that time had more economic background. However, constantly intensifying adverse environmental changes increased the awareness of the need for more sustainable approach. Therefore, in response to the United Nations Conference on Environment and Development (UNCED), also known as the Earth Summit (3–14 June 1992) and the adopted Rio Declaration on Environment and Development (Agenda21) [2], EU introduced the first major European policy on energy efficiency by the Council Directive 93/76/EEC of 13 September 1993 to limit carbon dioxide emissions by improving energy efficiency (SAVE) [3]. The direction set in these documents still remains a target of current policies and actions [4,5]. In the case of the EU energy transformation it is an especially challenging process when it comes to eastern member states of the EU (also called “new” EU; countries that joined the EU in 2004 and after [6]), as due to their historical political situation their economies are less energy efficient. On the other hand, member states of the “old” EU, which represent higher economic and financial development and have more experience in the implementation of eco innovations, have also higher level of greenhouse gas emissions which impact socio-environmental systems [7]. Therefore, different groups of countries have to face different problems and undertake different actions to balance their environmental carrying capacity [8].
In order to achieve goals connected with energy transformation, strategies and policies for different scales are developed [9,10,11,12]. However, the fact of energy strategy adoption does not always need to have the same impact on the domain on which it focuses. The impact of renewable energy policies on renewable energy source (RES) capacity evaluated using a panel dataset including 29 countries in the period 2000–2015 showed that the influence of different strategies varies [13]. Therefore, in not every case can the undertaken actions lead an economy that meets RES targets. The study of Dusonchet and Telaretti [14] on economic analysis covering a variety of supporting policies for the production of electricity from photovoltaics in eastern European Union countries showed over a decade ago that, depending on each national law, the efficiency of RES measures varies considerably. These differences may be caused by technical and organizational aspects of RES development together with cultural drivers which are strongly related to the “willingness to act” and “ability to act” of stakeholders. That applies to individuals as well as institutions represented by people [15]. Taking into account that national values play a significant role in the preference and consumption of resources [16], identification of prejudices in RES development from a social perspective might be crucial in order to identify and overcome obstacles in efficient implementation of energy transition policies. It is especially important considering that failure to address socio-cultural and policy dimensions in a proper way may cause wastage of resources and time [17].
In the case of the EU, the key public support instrument in energy transformation are funds that come from structural funds [18,19]. More than a third of the EU budget was assigned for the structural funds, which in the case of many member states are one of the main financial instruments contributing to the implementation of energy transformation policy in Europe with a high priority to RES development [20]. The development of RES can not only improve the environmental performance of energy sector [21,22], but also gives an opportunity to create local energy autonomy [23,24] for instance by creating energy clusters [25,26,27] or small-scale energy grids or systems [28,29,30] as well as combat such unfavorable social problems as energy poverty [31,32]. Similar to different impact of energy strategies and policies, EU structural funds also have different effectiveness in member states when it comes to energy transformation, which was considered for example in Greece [33], the Baltic states (Lithuania, Latvia and Estonia) [20], Slovenia and Spain [34], Romania [35] or Italy [36]. In all cases different limitations were found, which shows the capacity to improvement of future energy transformation mechanisms. However, in none of the studies mentioned above [20,33,34,35,36] was the potential of energy production from renewable sources considered as a factor of formal analysis. They rather focus on spatial or institutional factors influencing the energy transformation actions. Therefore, comparing these studies, there is a need to enrich scientific perspectives from the point of view of the role of energy potential in RES development. This is the added value of the research presented in this manuscript.
The evaluation of energy policy implementation may rely on different benchmarks. As Veum and Bauknecht noted [37], a benchmark based on gross domestic product (GDP) or GDP/capita allows for contributions per member state to better adjust their ability to pay, while a benchmark based on national renewables cost supply curves allows for better cost-efficiency. The allocation method used for the 2020 target assumed that each EU country should increase its share of RES by a set percentage point number (applicable to all EU member states), plus a member state-specific percentage points number reflecting its welfare level, indicated by GDP per capita [37]. Considering that it is already proven in the management domain that the selection of a specific method to allocate funds can improve odds for successes of activity [38], there is a need to combine studies on renewable energy potential evaluation, which are conducted for solar [39,40,41], wind [42,43,44], biomass [45,46,47], biogas [48,49,50] and others [51,52,53,54], with research on energy policy implementation [55,56] in order to assess the effectiveness of public support to boost RES development. The novelty of the study proposed in this article is (as mentioned in the previous paragraph) include in the formal analysis public financial support with RES potential with the breakdown of these elements (financial support and energy potential) into separate groups treating each RES separately.
Therefore, the aim of this research is to evaluate the relation between investment of funds allocated for RES development and renewable energy production potential, in order to investigate where RES funds are invested and if there are some patterns of allocating these funds among local administrative units. The study was conducted for the biggest “new” member state of the EU (Poland) and it covers all projects supported by the EU structural funds from 2004 (when Poland joined the EU) until the end of 2019 at the amount of 1,460,632,283 EUR. The study focuses only on one selected country as mechanisms of RES investments are strongly related with national approaches and only the level of unified rules allows further comparison of local units. The paper is structured as follows: Section 2 describes methods that were applied in the research together with materials that were used to perform the analyses; Section 3 contains results of the research presenting clusters of local authorities characterized by similar features of renewable energy production potential and the absorption of EU funds for RES development; and discussion and conclusions of the obtained results are presented in Section 4.

2. Materials and Methods

2.1. Materials

The study was conducted with the use of four different information sources: RES development projects, solar energy potential, wind energy potential and biomass energy potential. Other kinds of RES are excluded from the analysis due to the small number of investments within the country or lack of proper conditions to obtain the energy from these sources in all local administrative units (e.g., geothermal energy, hydro energy, tidal energy). Below, each type of data set is described.

2.1.1. Renewable Energy Source (RES) Development Projects

Information on RES development projects supported by EU funds was obtained from governmental database [57]. For the purpose of this research, data on projects realized in the period 2004–2019 were used. This period overlap three European programming periods: 2004–2006 (the last years of budget 2000–2006, covering the period after Poland joined EU), 2007–2013 and 2014–2020. The sum of all implemented RES projects over this period was 943. The most common were projects based on solar energy (523 projects), subsequently wind energy (218 projects) and finally biomass energy (202 projects). Analyzed projects aimed to build, renovate, or modernize RES installations. Projects could be implemented by a local authority as well as by private company. All data were aggregated to the level of county (pol. poviat) which is equal to European LAU-1 (Local Administrative Units; formerly NUTS-4-Nomenclature of Territorial Units for Statistics). Spatial data on administrative borders of LAU-1 was obtained from the Polish Head Office of Geodesy and Cartography [58].

2.1.2. Solar Energy Potential

The dataset used to assess solar energy potential was the Global Solar Atlas. It is an open source, web-based database owned by the World Bank Group and provided by Solargis. Solar energy potential is assessed as the approximate amount of energy that could be converted by a photovoltaic (PV) system into electricity. It takes into account geo-location parameters (coordinates) as well as surface factors describing the site and a configuration of the PV system. Geo-spatial information on describing photovoltaic electricity output (PVOUT) is measured in kWh/kWp. The value of PVOUT is estimated based on natural solar energy resources, climate conditions like air temperature and physical factors like elevation of surface as well as relative height of the surface to sea level. PVOUT evaluation approach refer to three basic algorithms used PV systems: small residential rooftop; distributed or medium-size commercial roof-mounted system; and large or utility-scale PV power plant. The generalization of the method used to calculate PVOUT enable to use this data source for preliminary assessments by reflecting macro-scale energy potential factors [59].

2.1.3. Wind Energy Potential

The dataset used to assess wind energy potential was collected from the Global Wind Atlas. Similar to the previous source, it is an open source and web-based database. The Global Wind Atlas is managed by the Technical University of Denmark in partnership with the World Bank Group. This database contain the data on potential of the wind energy as wind power density reflected in W/m2. Wind density for specific locations was obtained by downscaling from large-scale wind climate data to the microscale wind climate data estimate. Downscaling approach was a key methodological concept developed by the Technical University of Denmark. It includes data on global circulation, topography, orography, position of the coastline as well as a surface roughness. As mentioned in the case of the Global Solar Atlas, methodological limitations allow use of this data for preliminary assessment of larger-scale areas [60].

2.1.4. Biomass Energy Potential

The biomass production potential for energy use was assessed using a geo-spatial data set obtained from the BioBoost project [61], which was carried out for 27 EU member states and Switzerland. The total biomass potential was estimated for biomass types like: agricultural (straw, hay, etc.) and animal residues (manure) from food production sector, tree residues from forestry sector, nature conservation resources (green areas, hay) from protected areas, vegetation in infrastructure areas used for transportation purposes, as well as urban and industrial wastes (municipal bio-wastes, selected agri-industrial wastes from food and wood processing). The evaluation of biomass potential takes into account only wastes and residues as resources used for energy generation purposes, which excludes the conflict between energy production and food production. Such an approach include sustainable development principles taking into account priority of food production sector. Initially, the biomass potential was estimated and visualized as factors for NUTS-3 zones. The NUTS is a statistical system established by Regulation (EC) No 1059/2003 of the European Parliament and of the Council of 26 May 2003. The NUTS classification divides the territory of the EU into NUTS-1: major socio-economic regions; NUTS-2: basic regions for the application of regional policies; NUTS-3: small regions for specific diagnoses. The NUTS-3 is the lowest common level at the European scale. In Poland NUTS-3 level aggregates several poviat (county) units. For the purpose of this research, the initial BioBoost dataset was downscaled to the poviat level with use of the area-weighted approach. Following the original dataset, the biomass potential is represented as kilo tones per area of administrative unit [t/km2]. The detailed methodology of residual biomass potential is elaborated by Hamelin et al. [62].

2.2. Methods

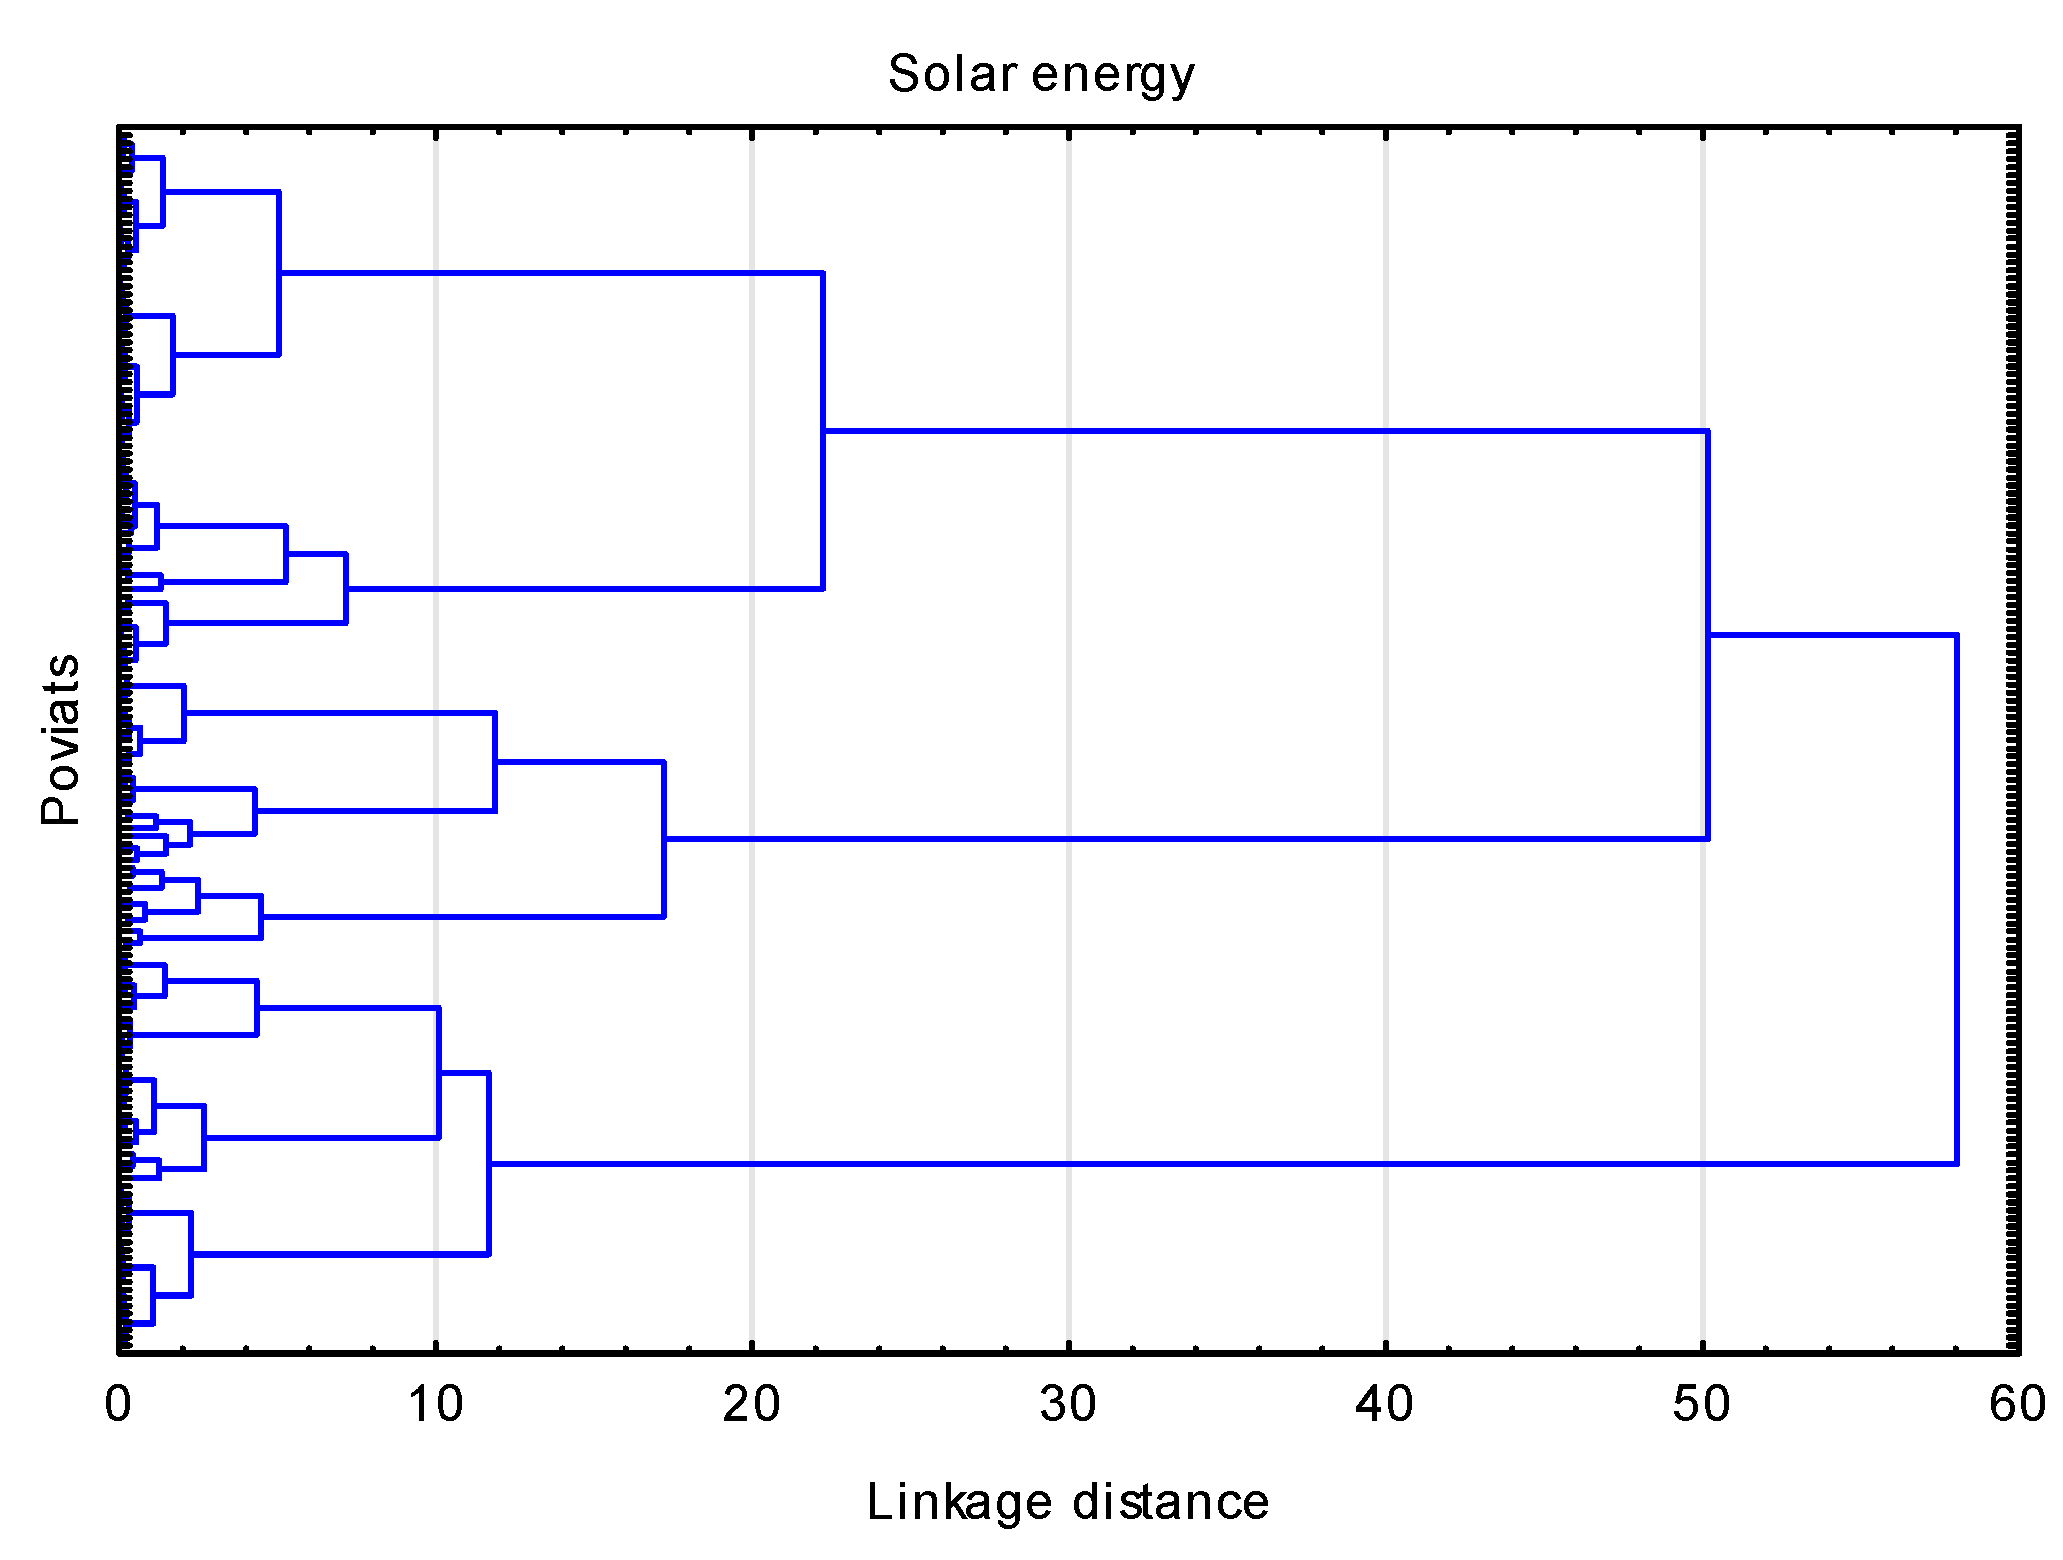
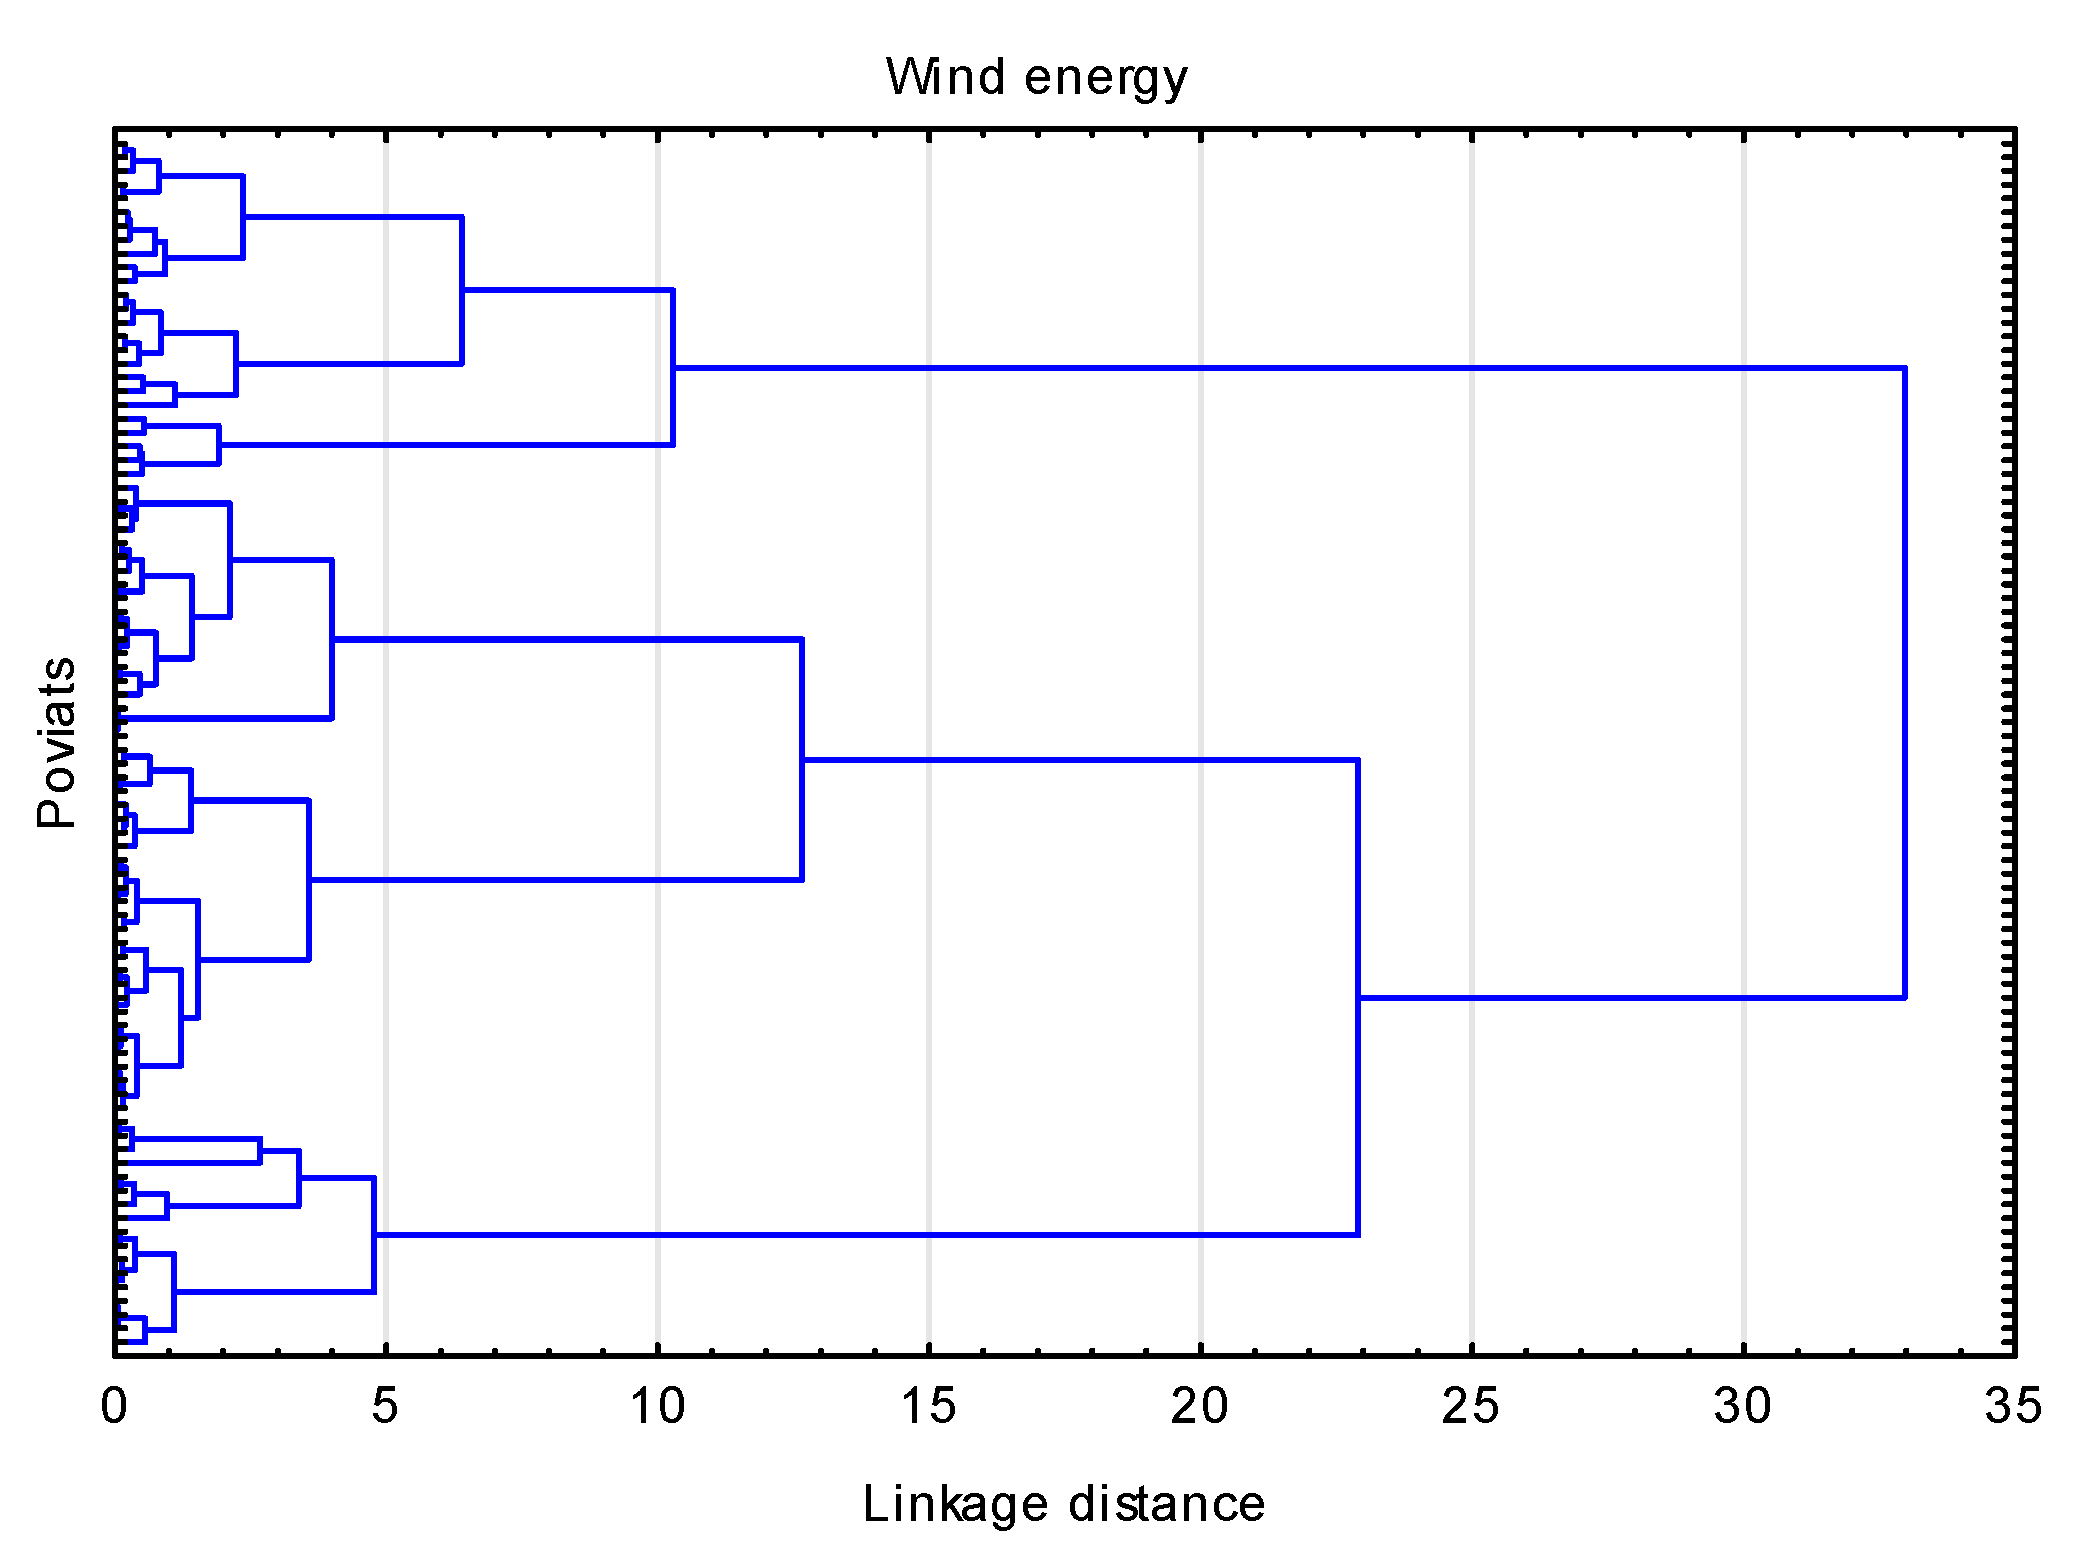
In order to perform the study and define clusters of local authorities characterized by similar features of renewable energy production potential and the absorption of EU funds for RES development, two cluster analyses methods were used: agglomeration and k-means. As part of the preprocessing, the variables’ values involved in the cluster analysis were standardized. This operation ensures the comparability of the values of various variables, which guarantees equal influence of each variable on the process of creating clusters. The agglomeration method was used to limit the number of clusters. An approach based on the variance analysis Ward binding method with the classical Euclidean distance was applied. In order to determine the number of clusters, a preliminary analysis was performed using the agglomeration method. Based on dendrograms (Figure A1, Figure A2 and Figure A3), the distances between successive binds were determined and descending ordered. By analyzing the numbers of the resulting clusters at the several largest distances between bonds the number of clusters was limited to 4. Then, using the iterative-optimization k-means method the distances between clusters were analyzed for division into 2, 3 and 4 clusters for each type of renewable energy. For each of the 9 divisions obtained (3 different numbers of clusters and 3 types of energy), the distances between the clusters were determined. The number of clusters implying the largest mean distance between clusters was selected. Ultimately, a division into 3 disjoint subsets in each case was made.

2.2.1. Agglomeration Method

The scheme of the agglomeration classification methods was iterative with N-1 (N- set size) steps. In step zero, each cluster is single-element (N-clusters). Then the two “closest” elements are combined into one cluster. Thus, N-1 clusters are formed. This procedure was repeated N-2 more times until one cluster containing all the elements was obtained in the last step. The joining process is graphically represented in a graph called a dendrogram. Depending on the method of measuring the distance between the set elements (distance) and between clusters (linkage criteria), several agglomeration methods were distinguished. The most universal of these was Ward’s method [63]. In Ward’s method, in each iteration, the value of the objective function is determined for all possible pairs of existing clusters and the one having the optimal value of the functional relationship or the objective function that reflects the criterion selected by the researcher is selected. In our case, the objective function was total within-cluster variance. At each step is found the pair of clusters that leads to minimum increase in total within-cluster variance after merging. This increase is a weighted squared distance between cluster centers. The optimal number of clusters is decided on the basis of the course of the agglomeration presented graphically on the dendrogram. The division at which the distance between bonds is the greatest is considered to be the best. However, this is not a condition that determines the decision. The specificity of both the considered objects and the features that describe them, on the basis of which we make the classification, are also important. The final decision is made by the researcher based on the premises and experience.
When using a clustering agglomeration procedure, one should remember about the disadvantages/limitations and strengths of this method. Hierarchical clustering creates a hierarchy, i.e., a structure that itself carries information about the similarities and differences between the elements. An insight into the course of agglomeration (occurring variables and boundary partition values) allows the structure of multidimensional data to be looked at. The dendrogram gives an opportunity to determine the number of clusters. The calculation procedure itself is easy to implement. There are many binding methods and distances measures using in the analysis and result depends on the choice of each of them. This feature can be considered both an advantage (the ability to choose the right combination) and a disadvantage (researcher’s experience required) of the method. The main and objective weaknesses of clustering agglomeration method are: the order of the data affects the final results and is very sensitive to outliers.

2.2.2. K-Means Method

The k-means method [64] is completely different from the agglomeration methods, but also iterative. In this method, it is necessary to know the number of clusters (k) into which the set will be divided, which is the main drawback/limitation of this method. In step zero the selection of k-centroids (centers of clusters) is made. There are many methods of selection. In this research it was necessary to maximize the distances between clusters [65]. Then, the elements whose square of the Euclidean distance to this centroid is the smallest were assigned to the cluster corresponding to a given centroid. The new centroids were determined for each cluster with coordinates being the arithmetic mean of the coordinates of the cluster elements. The distances of each element to each centroid were then examined and reassigned to the cluster with the “nearest” centroid. The procedure is repeated as many times as necessary until each element is “closest” to its own centroid. This algorithm is also referred as Lyoyd-Forgy’s algorithm [66].
The main advantage of the k-means method is that the resulting division is less dependent on the initial settings. In this method, the number of classes (main disadvantage) and the method of determining the first centroids in step zero should be specified in advance. The K-means method produces more concentrated and more numerous clusters than in hierarchical methods.
In the presented analysis, the elements (poviats) were grouped according to two features (energy potential and project costs), which additionally made it possible to indirectly conclude on the relationship between these variables. Due to the abnormal distribution of each variable, no correlation or regression (with explicit function) analysis between them was possible.

3. Results

Descriptive statistics for each dataset are presented in Table 1. Most often in the poviat in the study period, one project was implemented for each type of renewable energy. Solar and wind potential have quite symmetric distribution in poviats. Nevertheless, both the number of projects and their values show a strong right-hand symmetry (few poviats implementing investments with high financial expenditures). The exception is the biomass potential, which has high values for poviats in the western and south-western part of the country which results in significant right-hand asymmetry. Out of 380 poviats in Poland, most of them invest in the use of solar energy (153) and least in wind energy (88).
Based on cluster analyses, solar, wind and biomass energy projects were analyzed separately. The outcomes in the following subsections present clusters of local administrative units characterized by similar features of RES funds absorption and renewable energy production potential. In the process of classification using the k-means method, poviats were divided into 3 clusters. In the fourth cluster there are poviats that have not obtained funds for different types of renewable energy projects.

3.1. Solar Energy Clusters

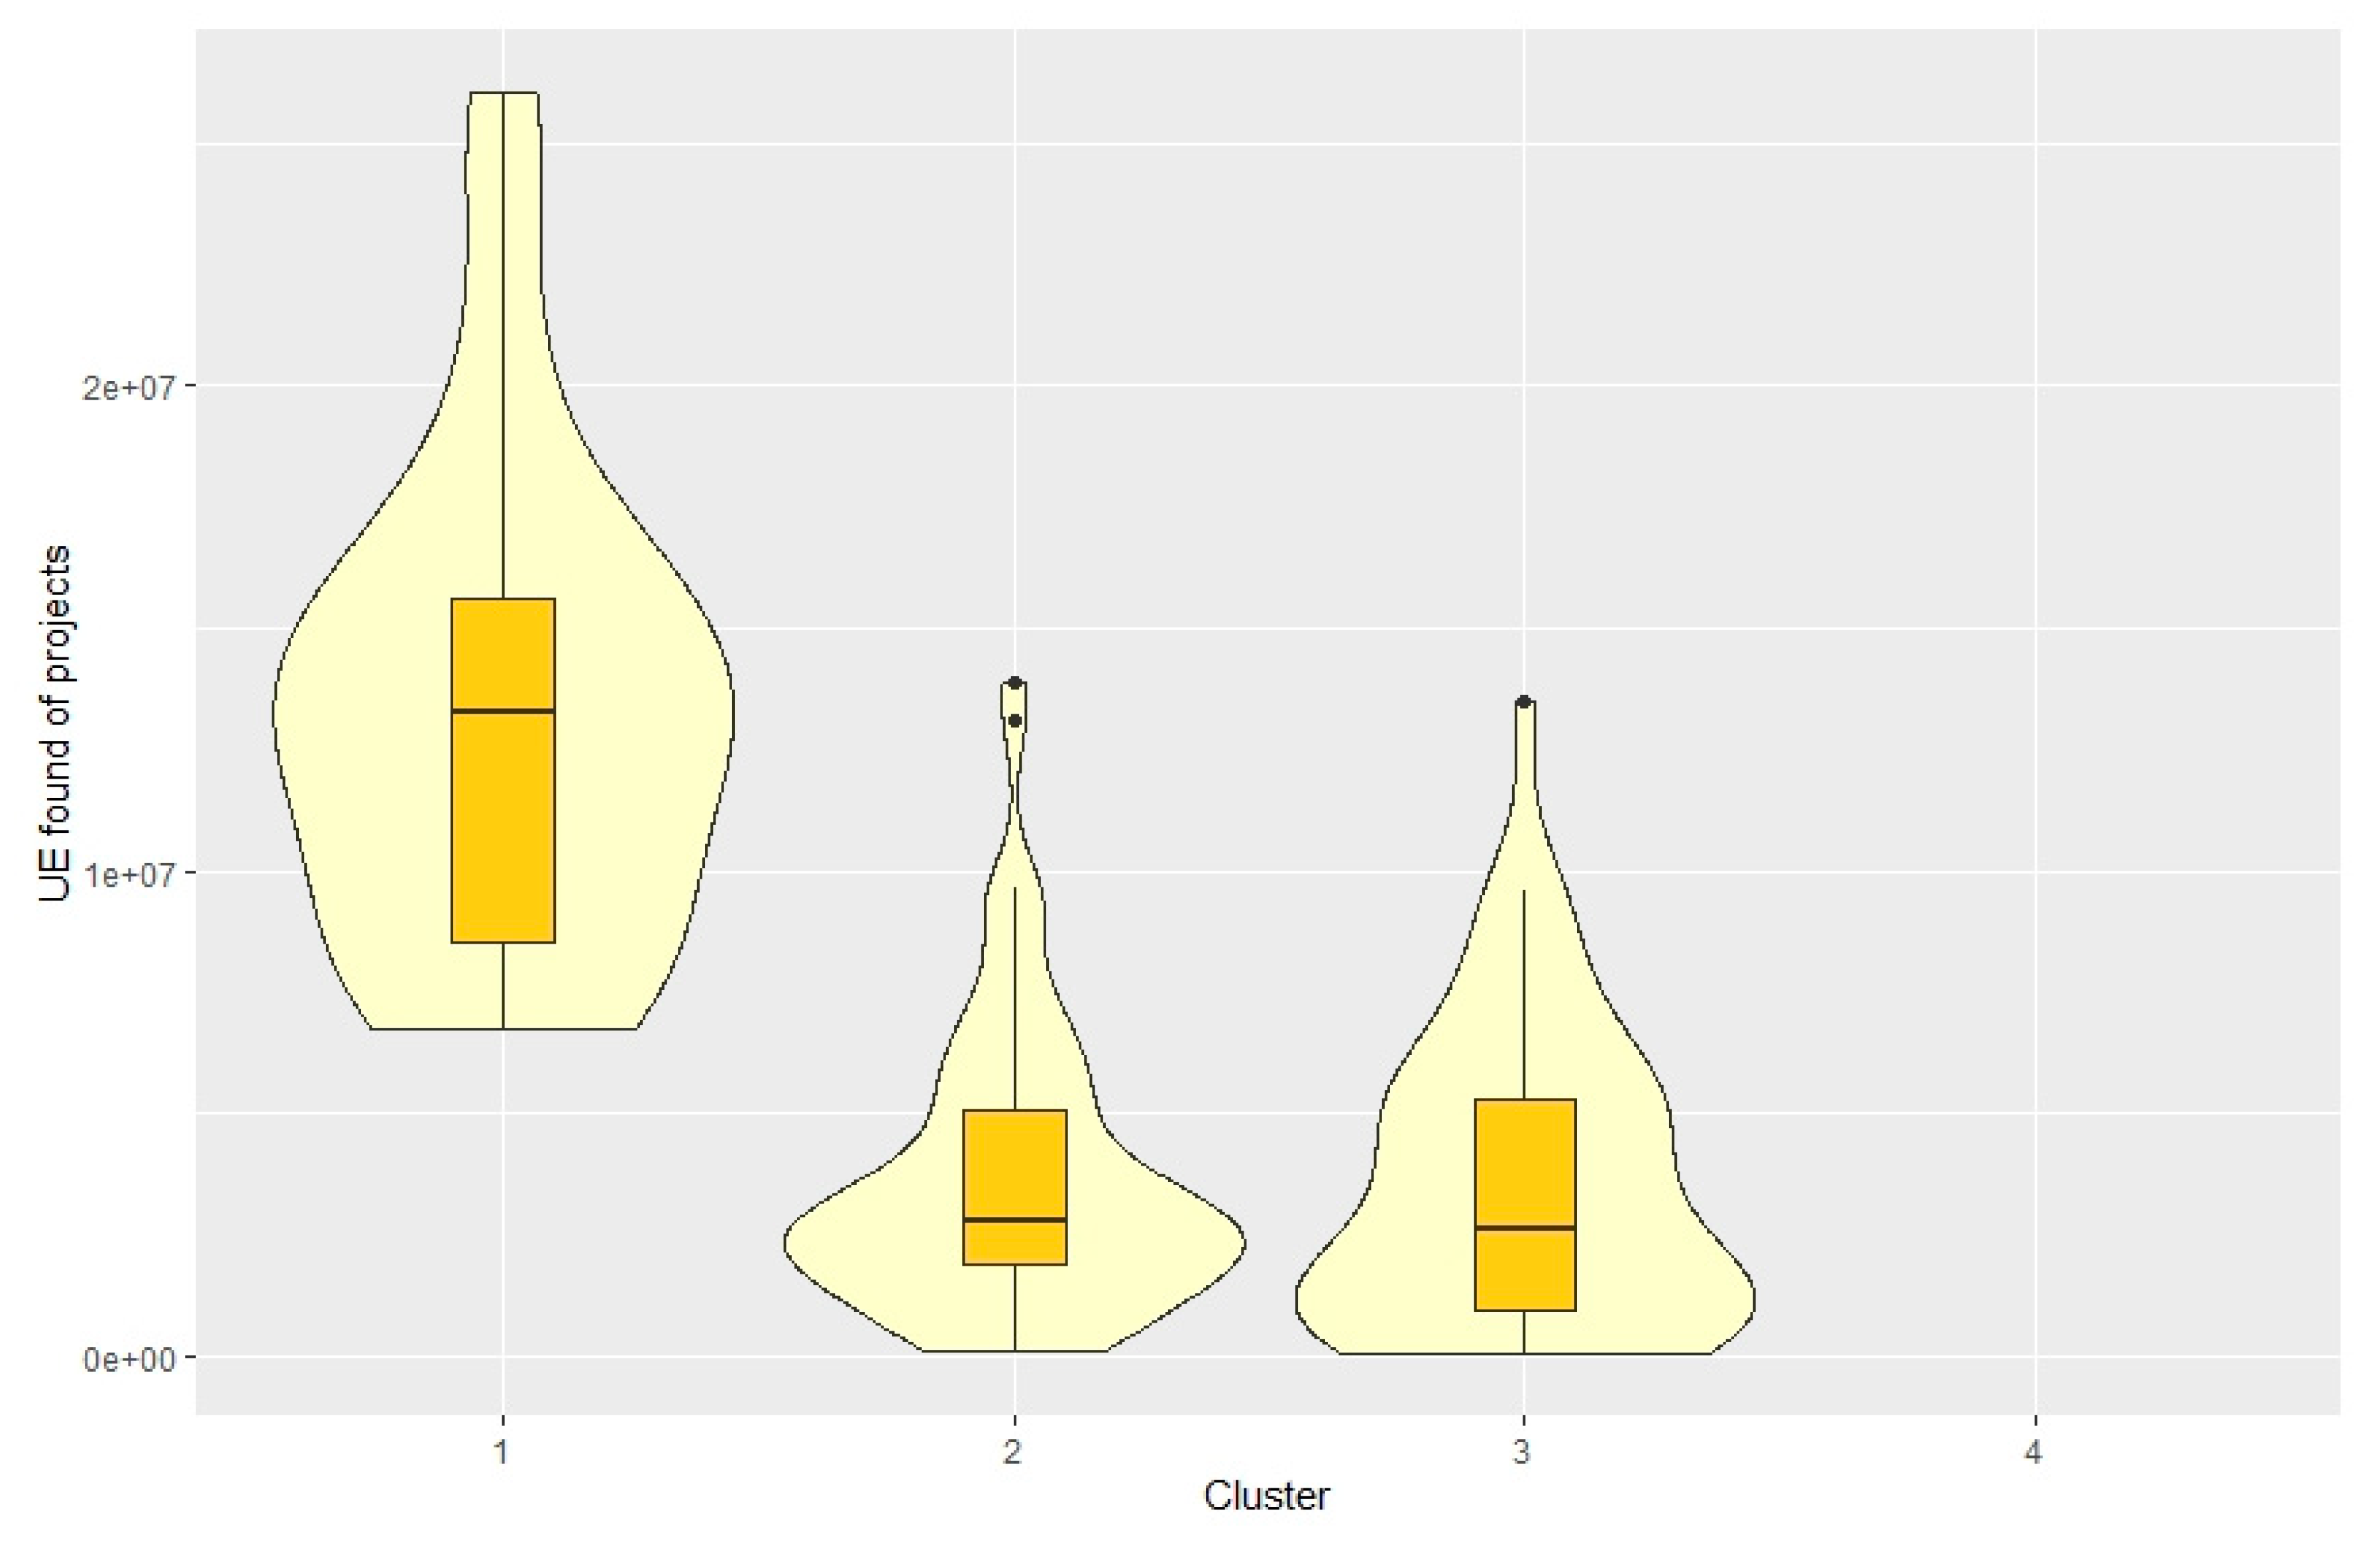
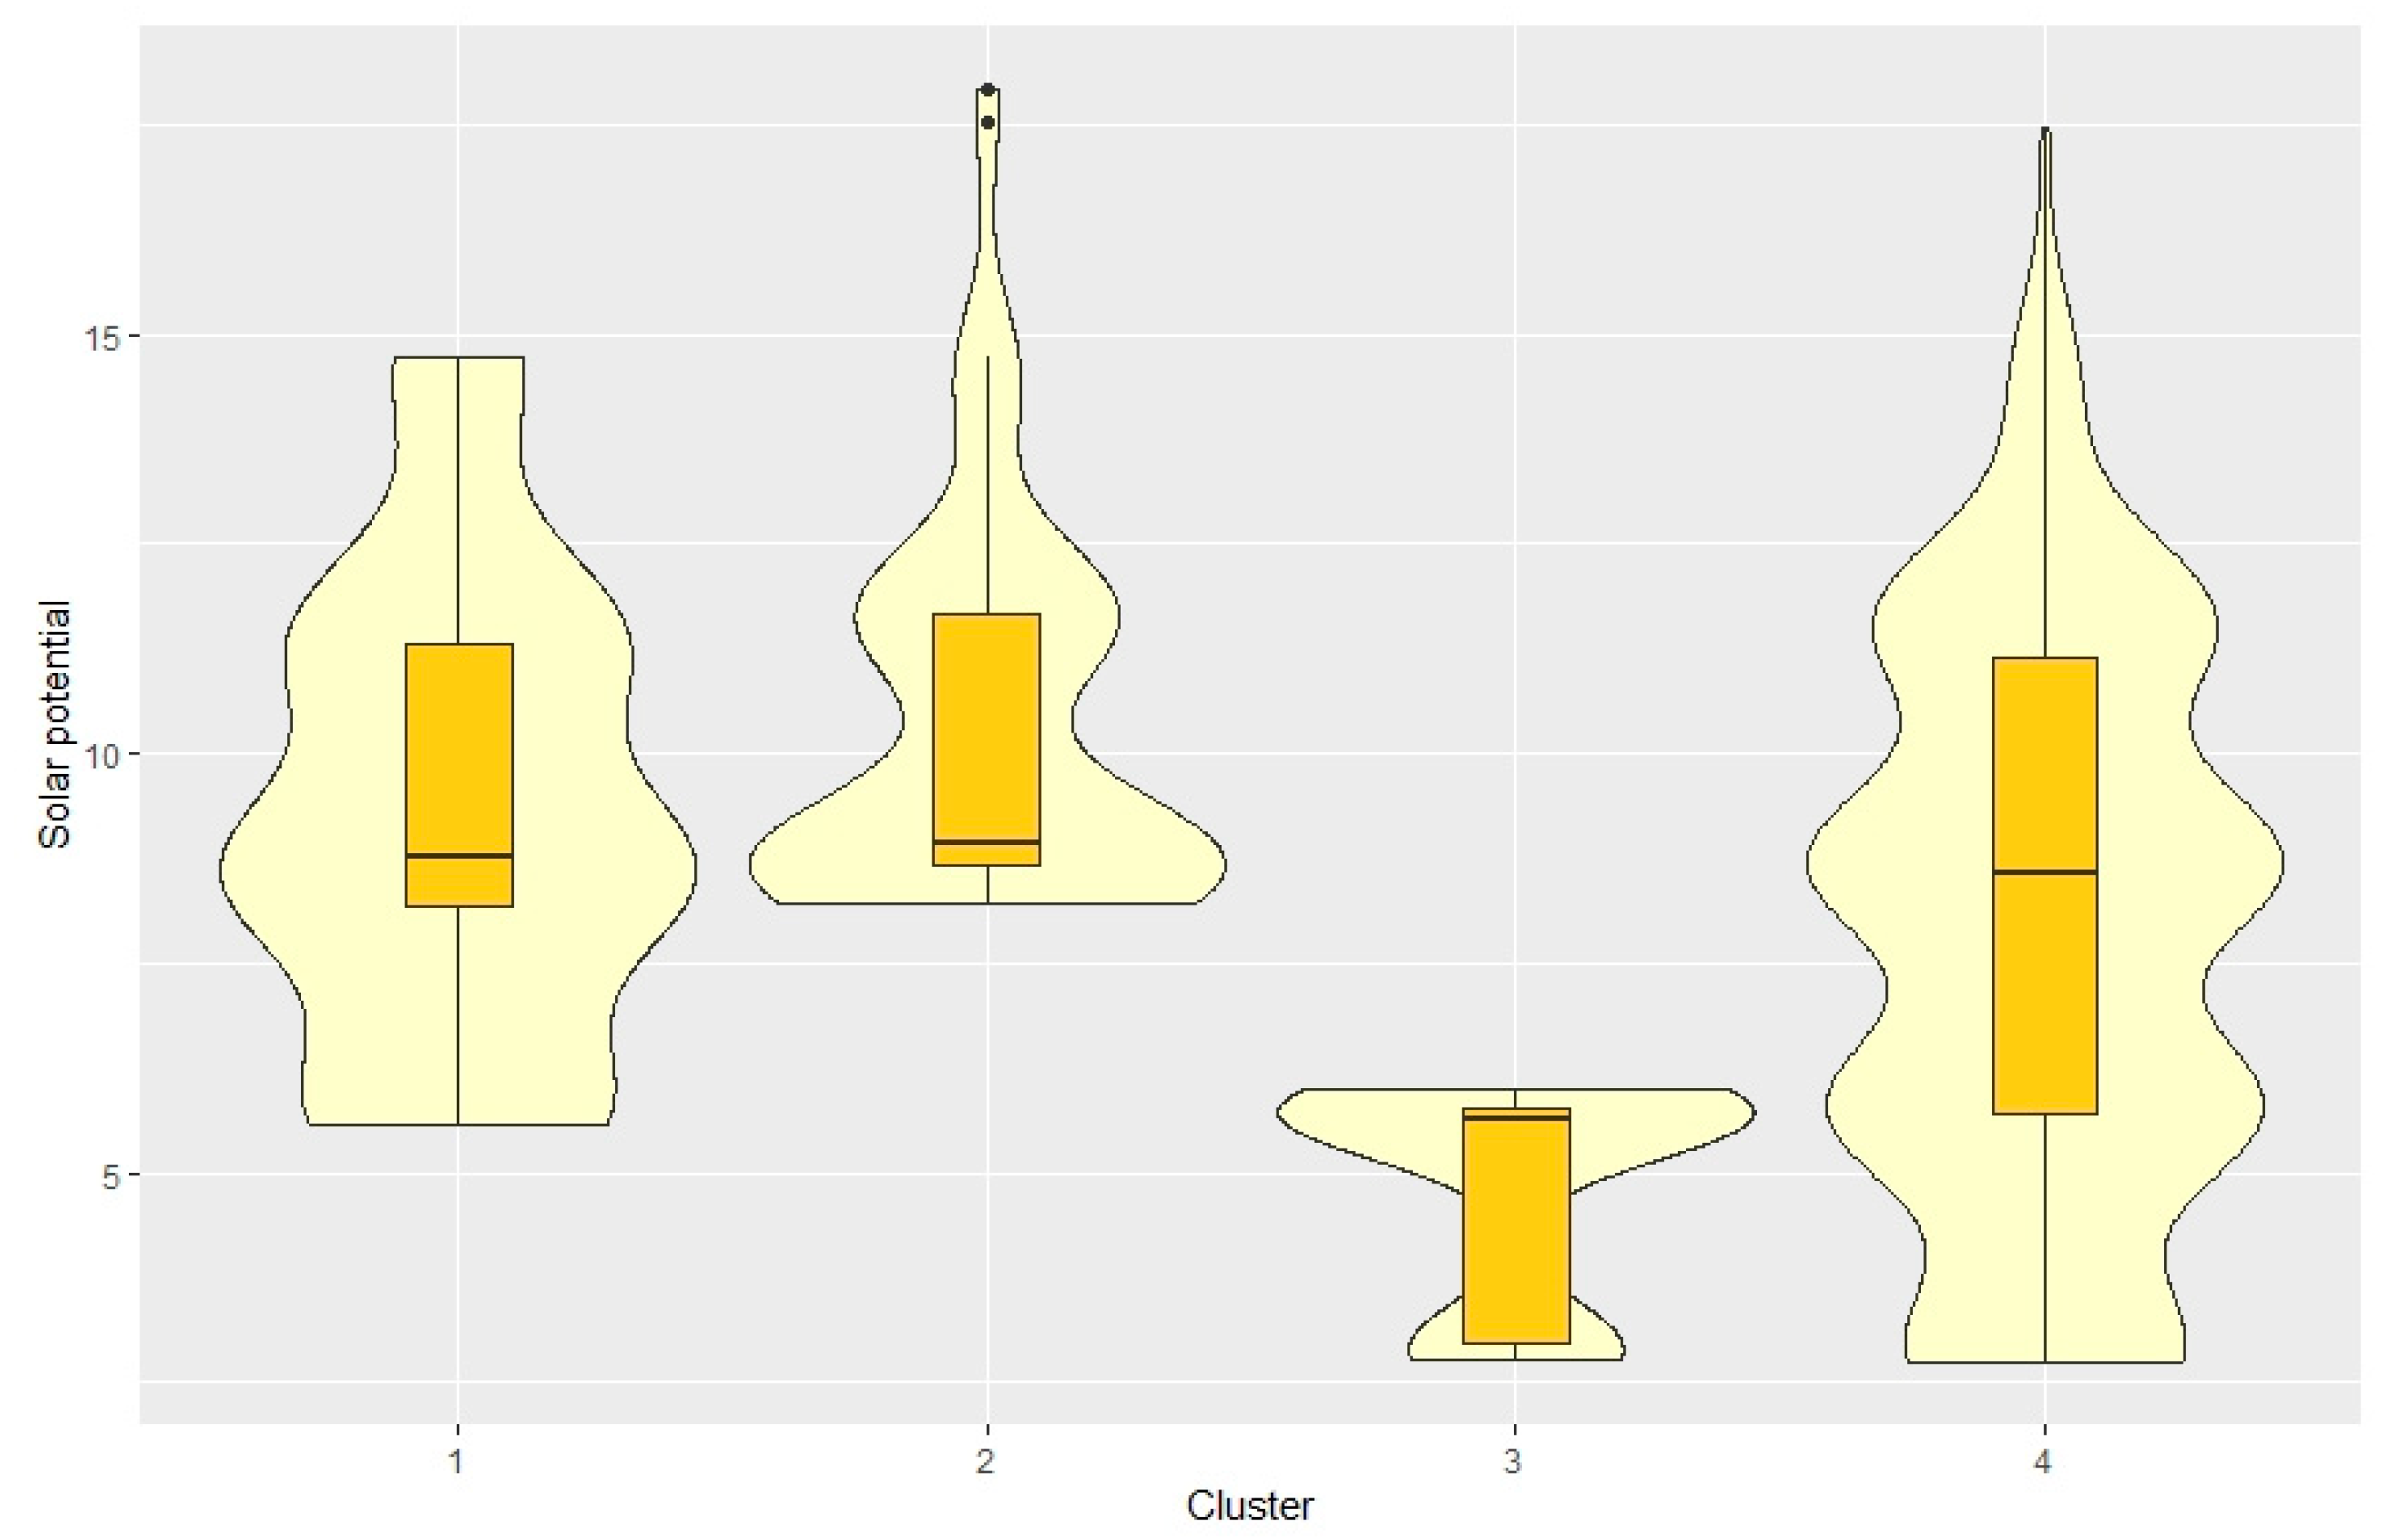
Based on the methodological procedure of the study, the first cluster is the least numerous (29) group of poviats where the most projects were implemented (Figure A4 in Appendix A), with the highest project cost, despite only slightly above the average solar potential (Figure 1 and Figure 2). In poviats from this group, between 2 and 28 projects were implemented in the analyzed period, most often from 5 to 8, Me = 6, Mo = 6 (Figure A4). In these poviats, the most funds from the EU were consumed for the purposes of expanding infrastructure for generating solar energy. There was an almost uniform distribution of the EU funds for poviats with the consumption of these funds between the lower and upper quartile (Figure A5).
The second cluster contains 75 poviats with above-average solar potential. The number of implemented projects did not exceed 9 per poviat. In most poviats from this cluster only one project carried out, therefore, the minimum and Q1 and Me are equal (Figure A4). In general, it can be concluded that the solar potential of these poviats is not utilized. Both the average total project costs and the EU funding are below average.
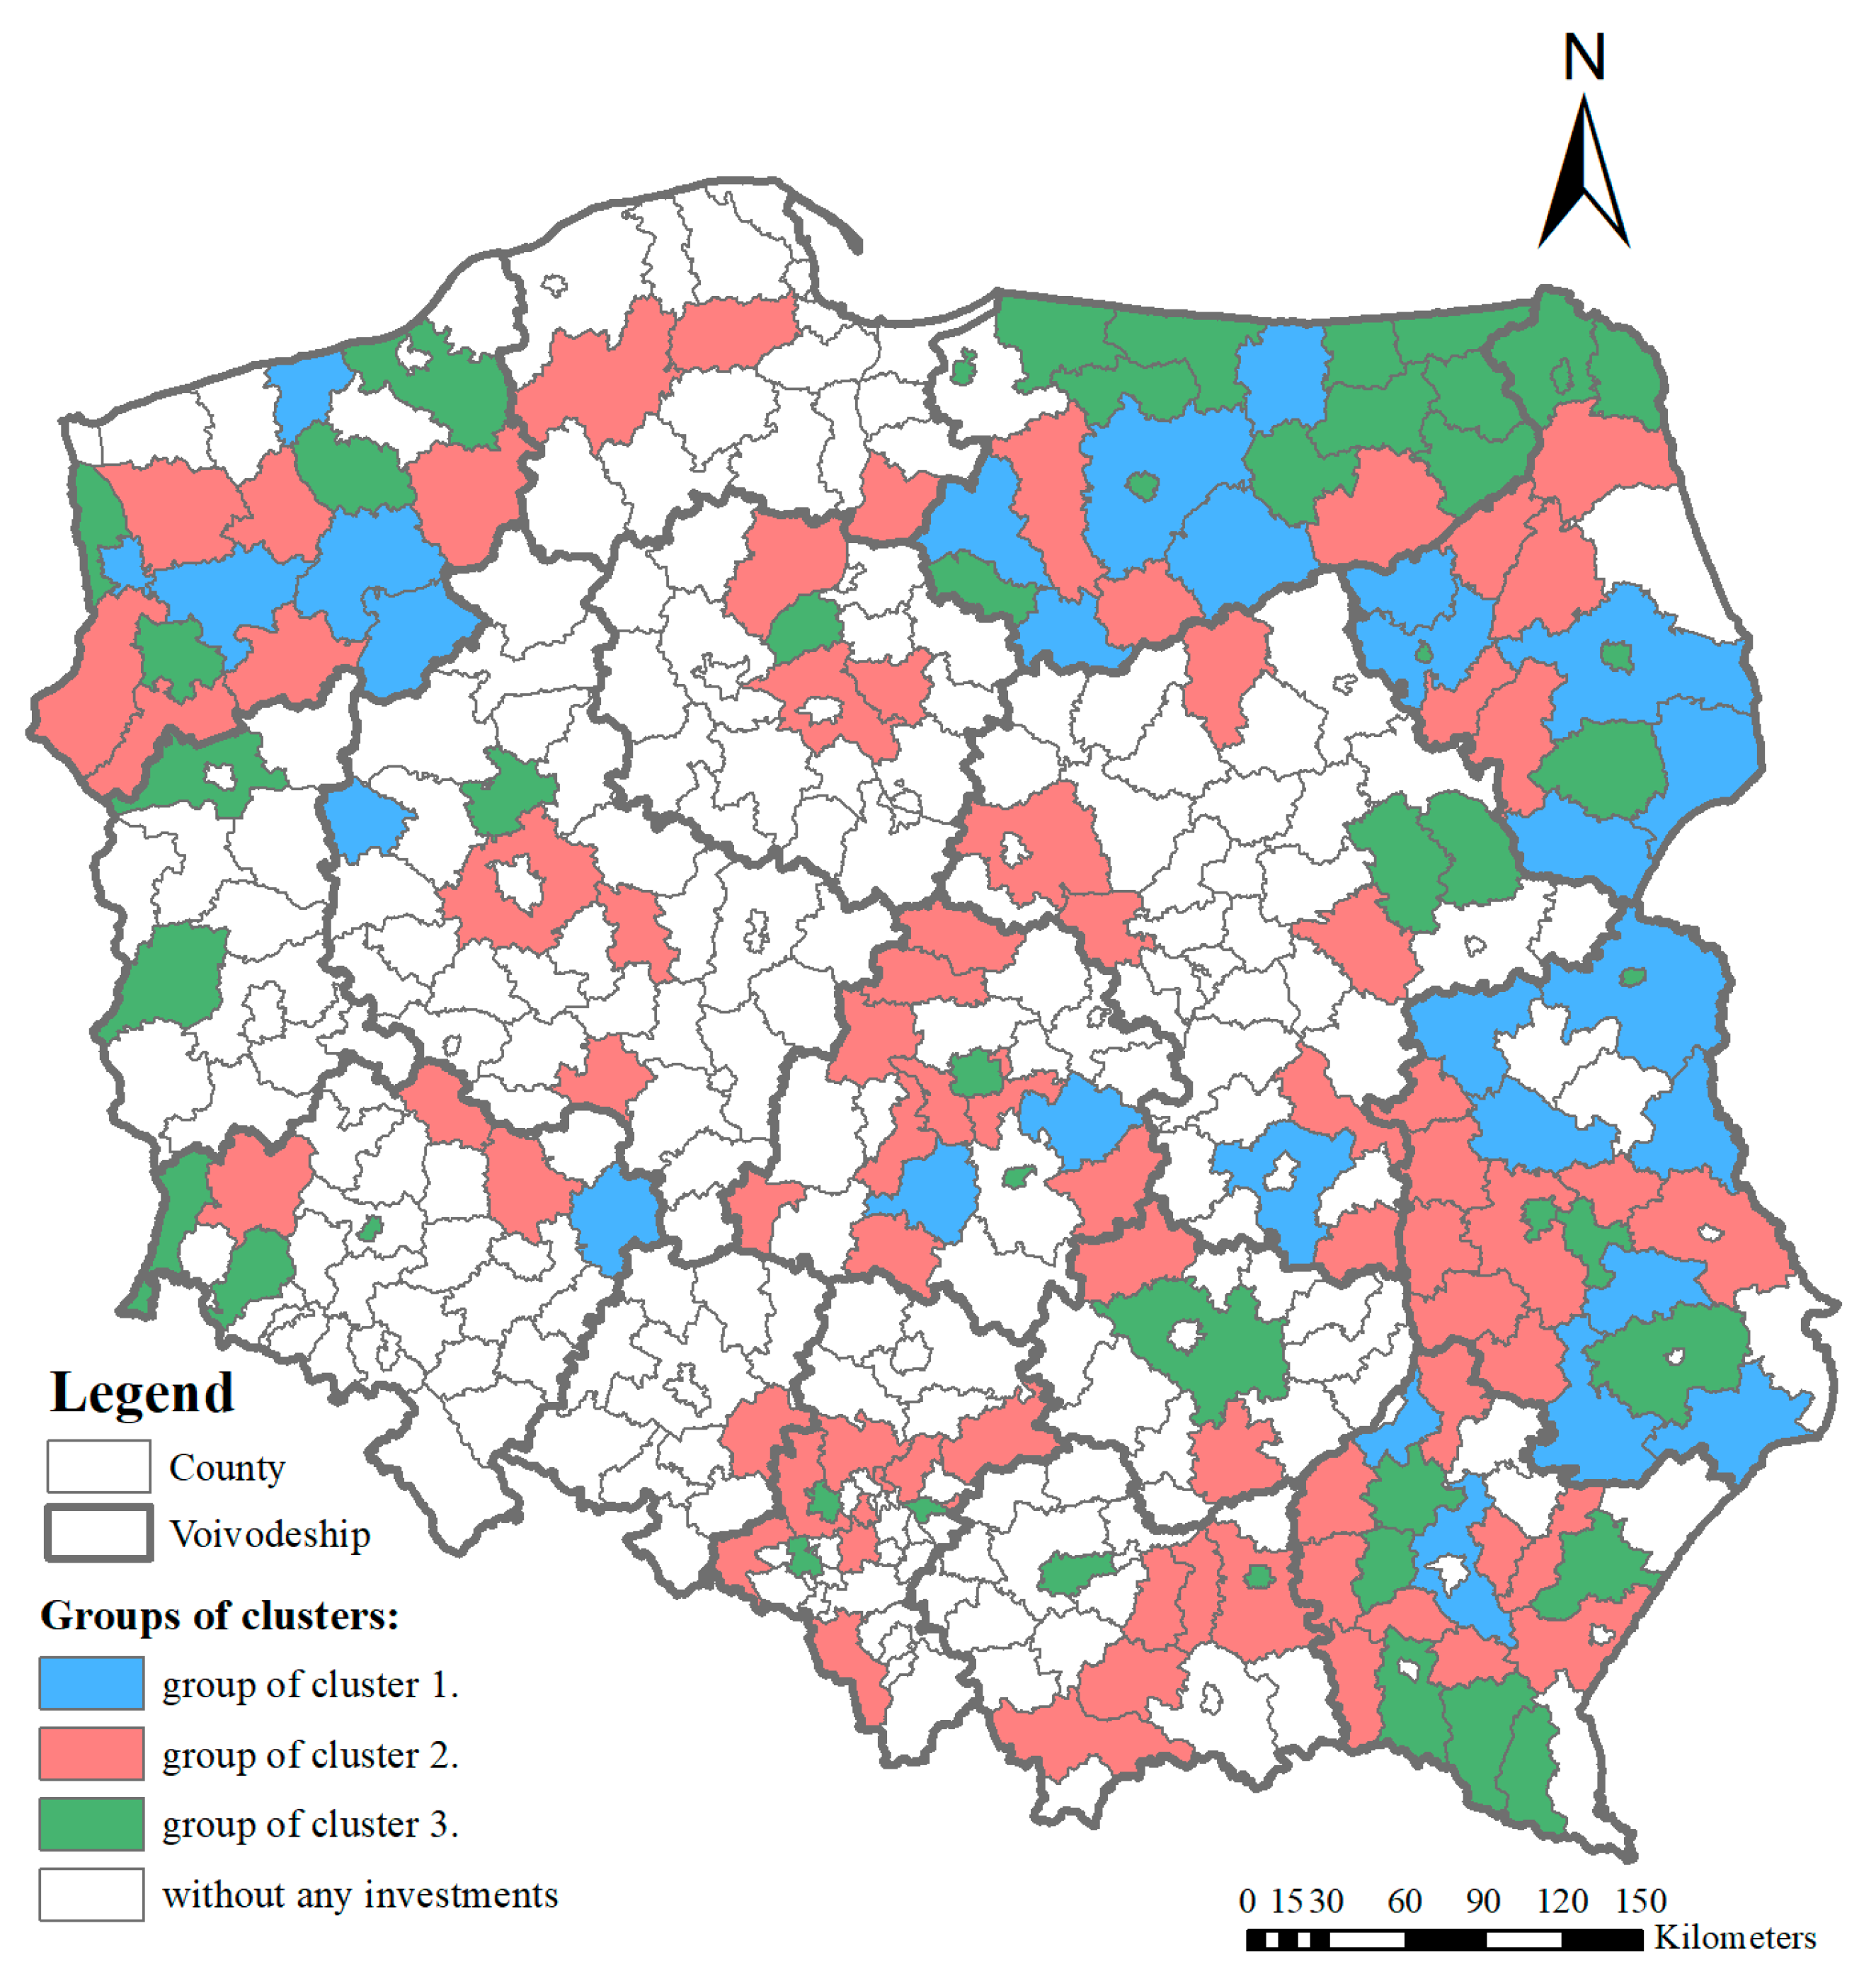
The cluster with the lowest and least diverse solar potential (cluster 3) contains 49 poviats located in the north-eastern part of the country (Figure 3). The number of projects in poviats from this cluster is very diverse (from 1 to 25 projects), however, in half of the poviats from this group, one or two projects were implemented and in 75% of poviats no more than 4 (Figure A4). Projects implemented in this group were generally low cost and hence relatively low RES funds were absorbed. There is a concentration of low co-financing values in the poviats (even lower than in cluster 2). (Figure A5).
In 227 poviats (out of 380), in the 16 years analyzed, not a single investment in the use of solar energy was implemented (cluster 4) which constitutes approximately 60% of poviats in Poland. Counties in this group represent the full range of solar potential (Figure 2).
Basic cluster statistics for all groups are summarized in Table 2.

3.2. Wind Energy Clusters

In terms of using the wind energy potential in Poland’s counties, 3 clusters covering counties that have implemented at least one project have also been developed.
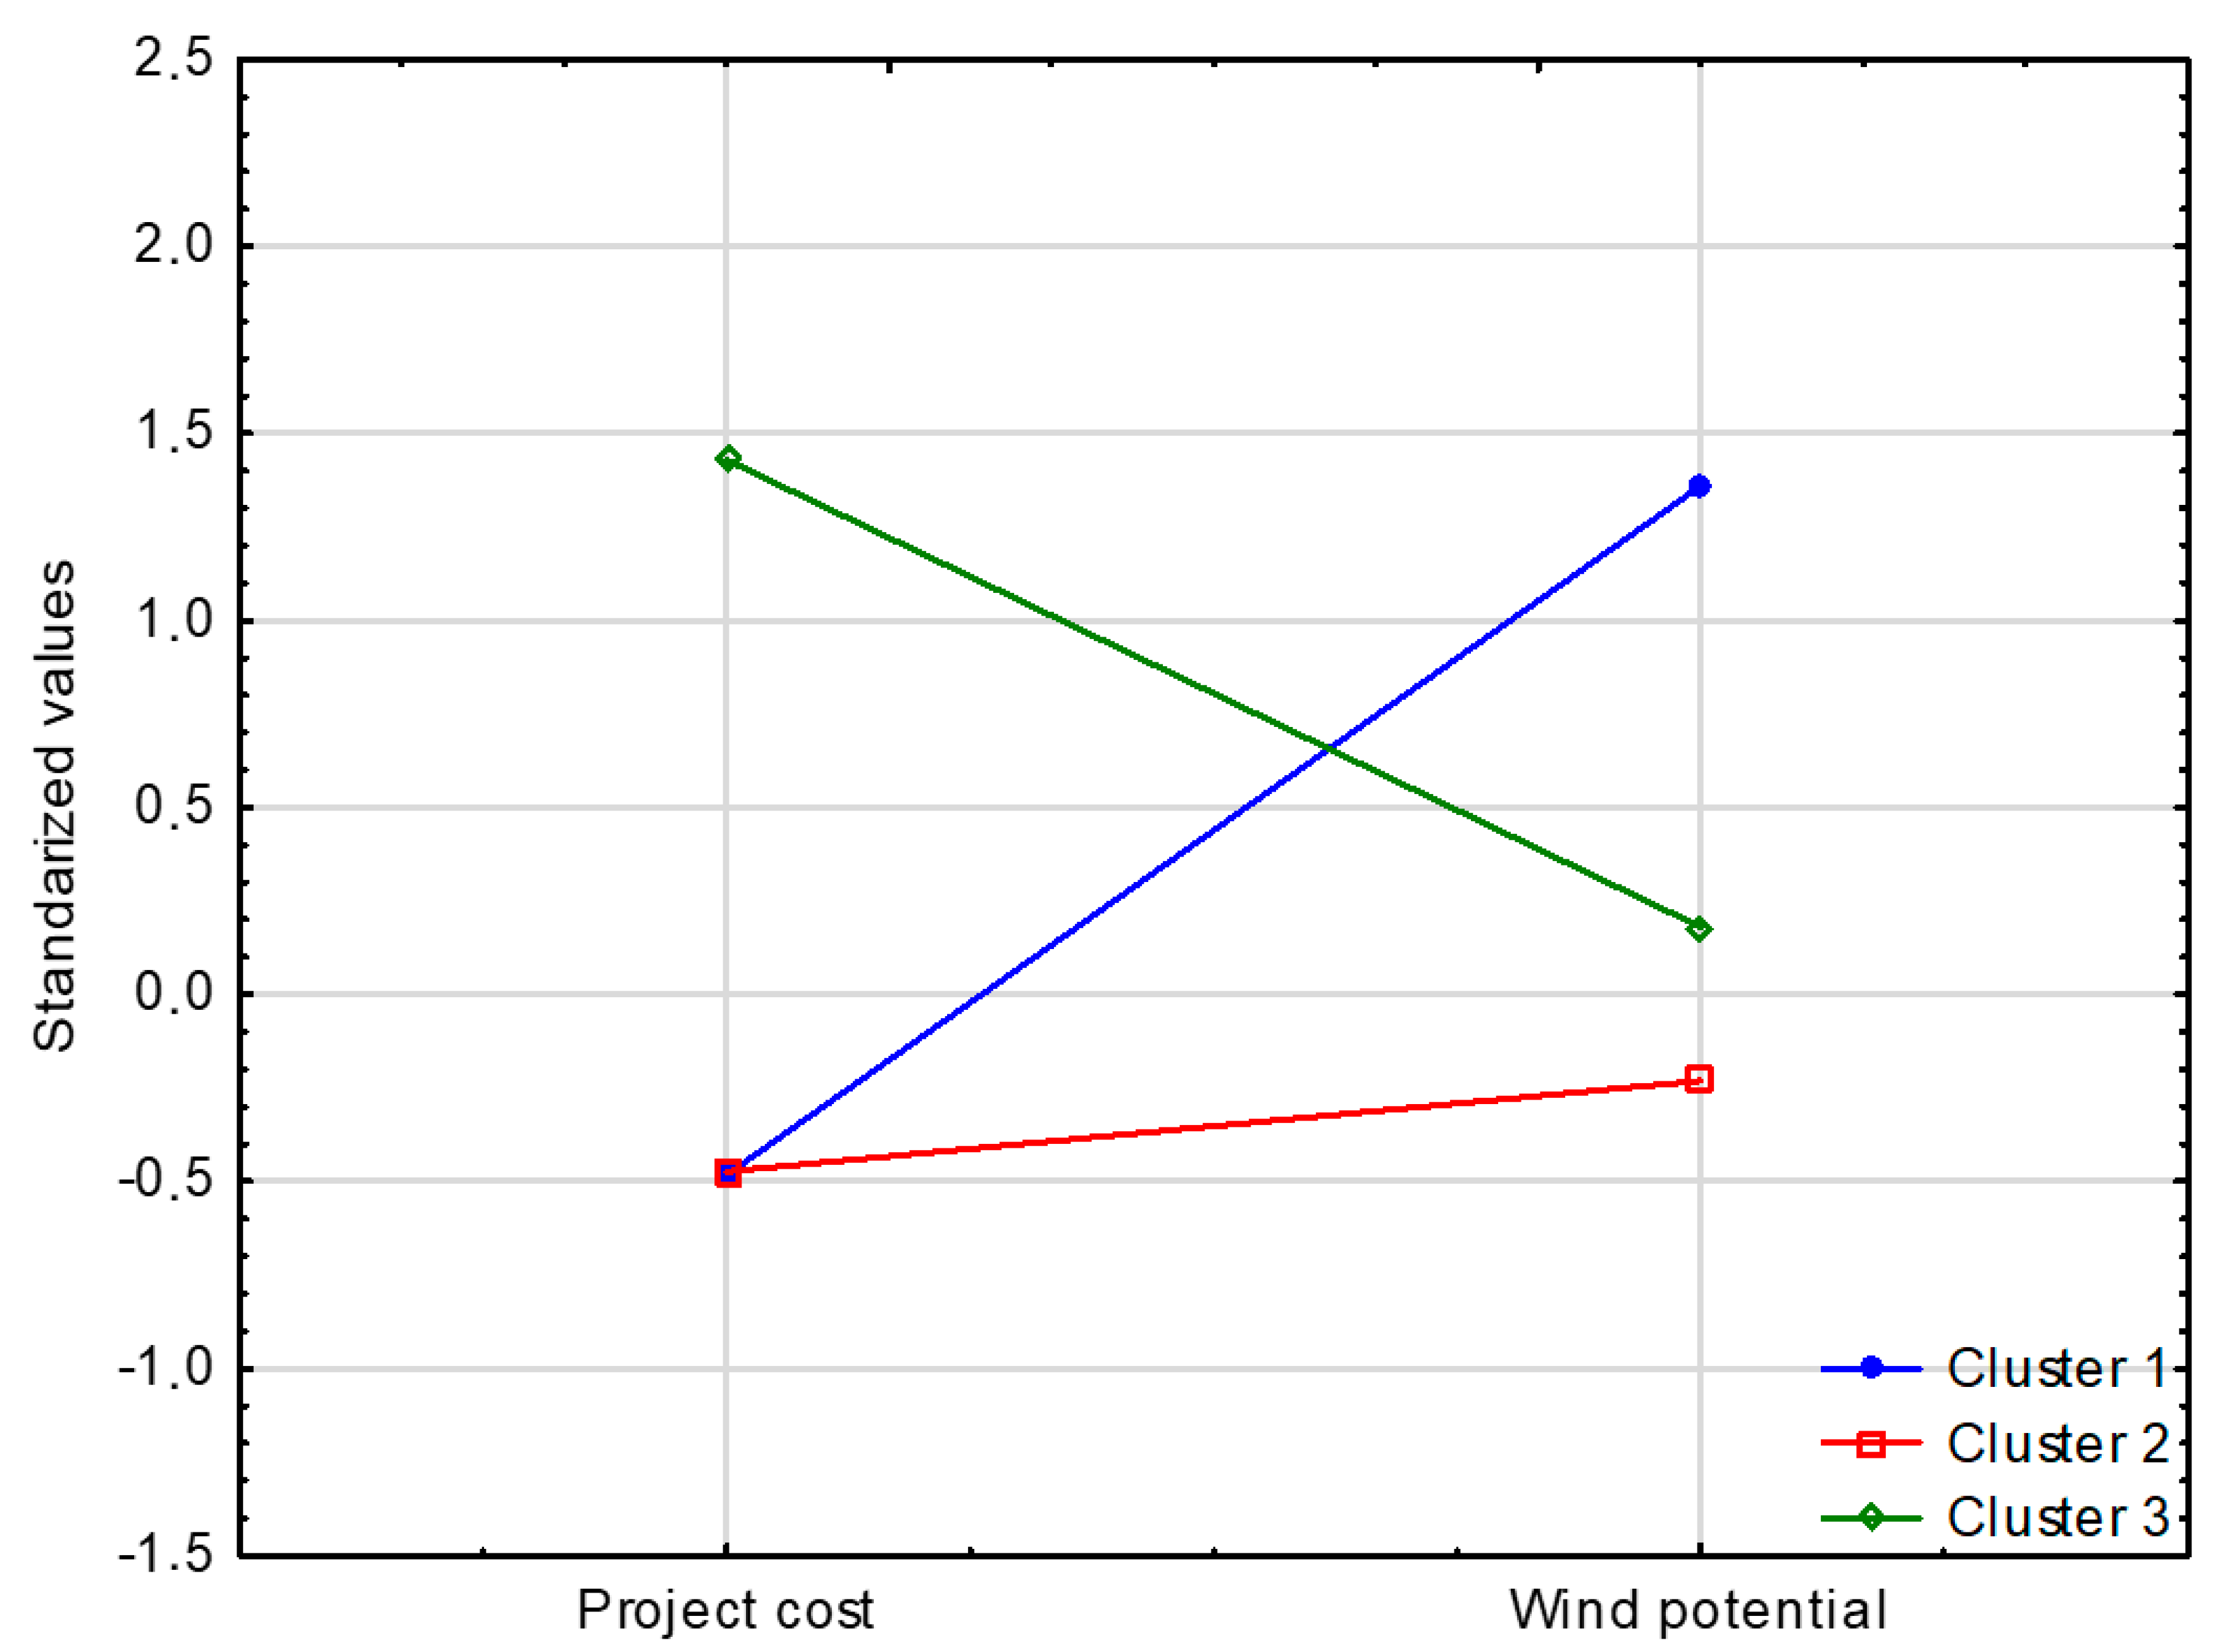
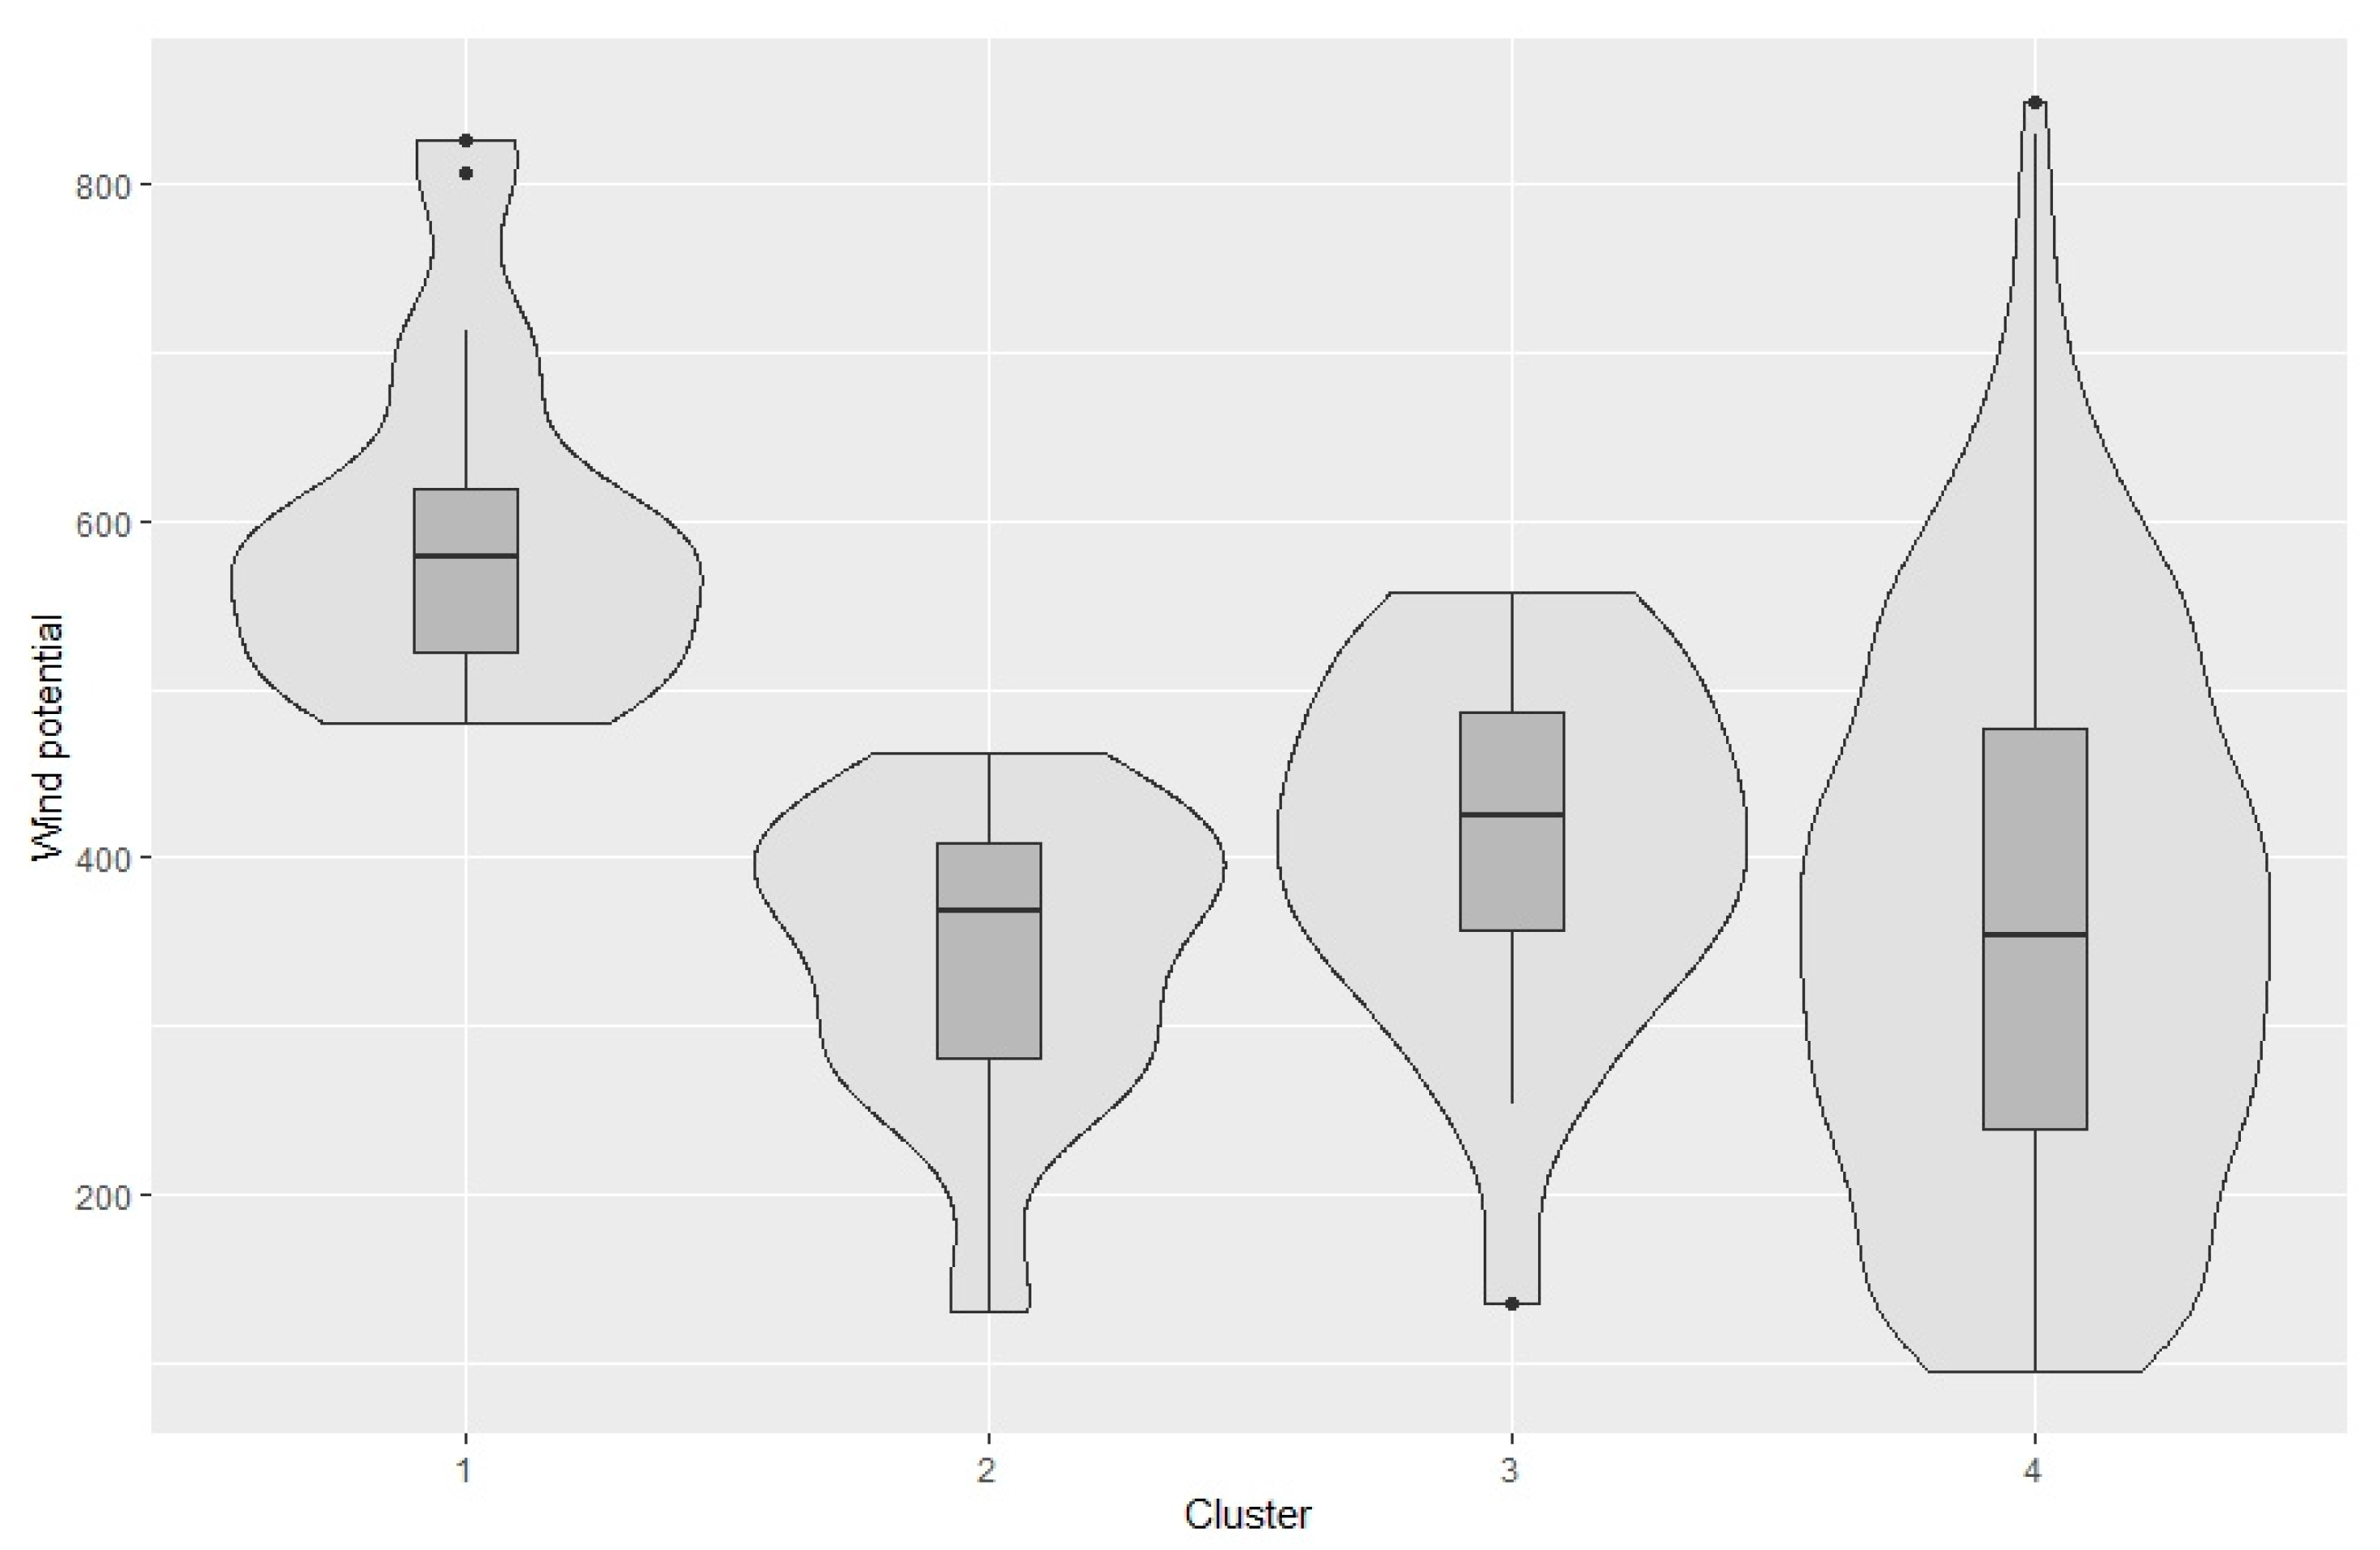
In the first cluster there are 21 poviats (Table 3) which can be said to have the potential and do not utilize it. This is a group of poviats with a very high wind potential (Figure 4 and Figure 5), where few projects have been implemented. In 18 poviats not more than 3 projects, in one-4 projects, in one–5 projects (Figure A6). Consequently, the smallest funds, both total funds and co-financing from the EU, were allocated for this, most often not exceeding 18.3 million PLN (4 mln EUR) (Table 3, Figure A7).
The second cluster includes 45 poviats with low wind potential and implementing few investments in this area (Table 2). However, despite significantly lower and left-hand asymmetrical wind potential than poviats from cluster 1, they implement a similar number of projects with similar distribution and slightly higher financial outlays (both total and acquired from the EU). This group includes two poviats with the number of projects exceeding 5 (Figure A6 and Figure A7).
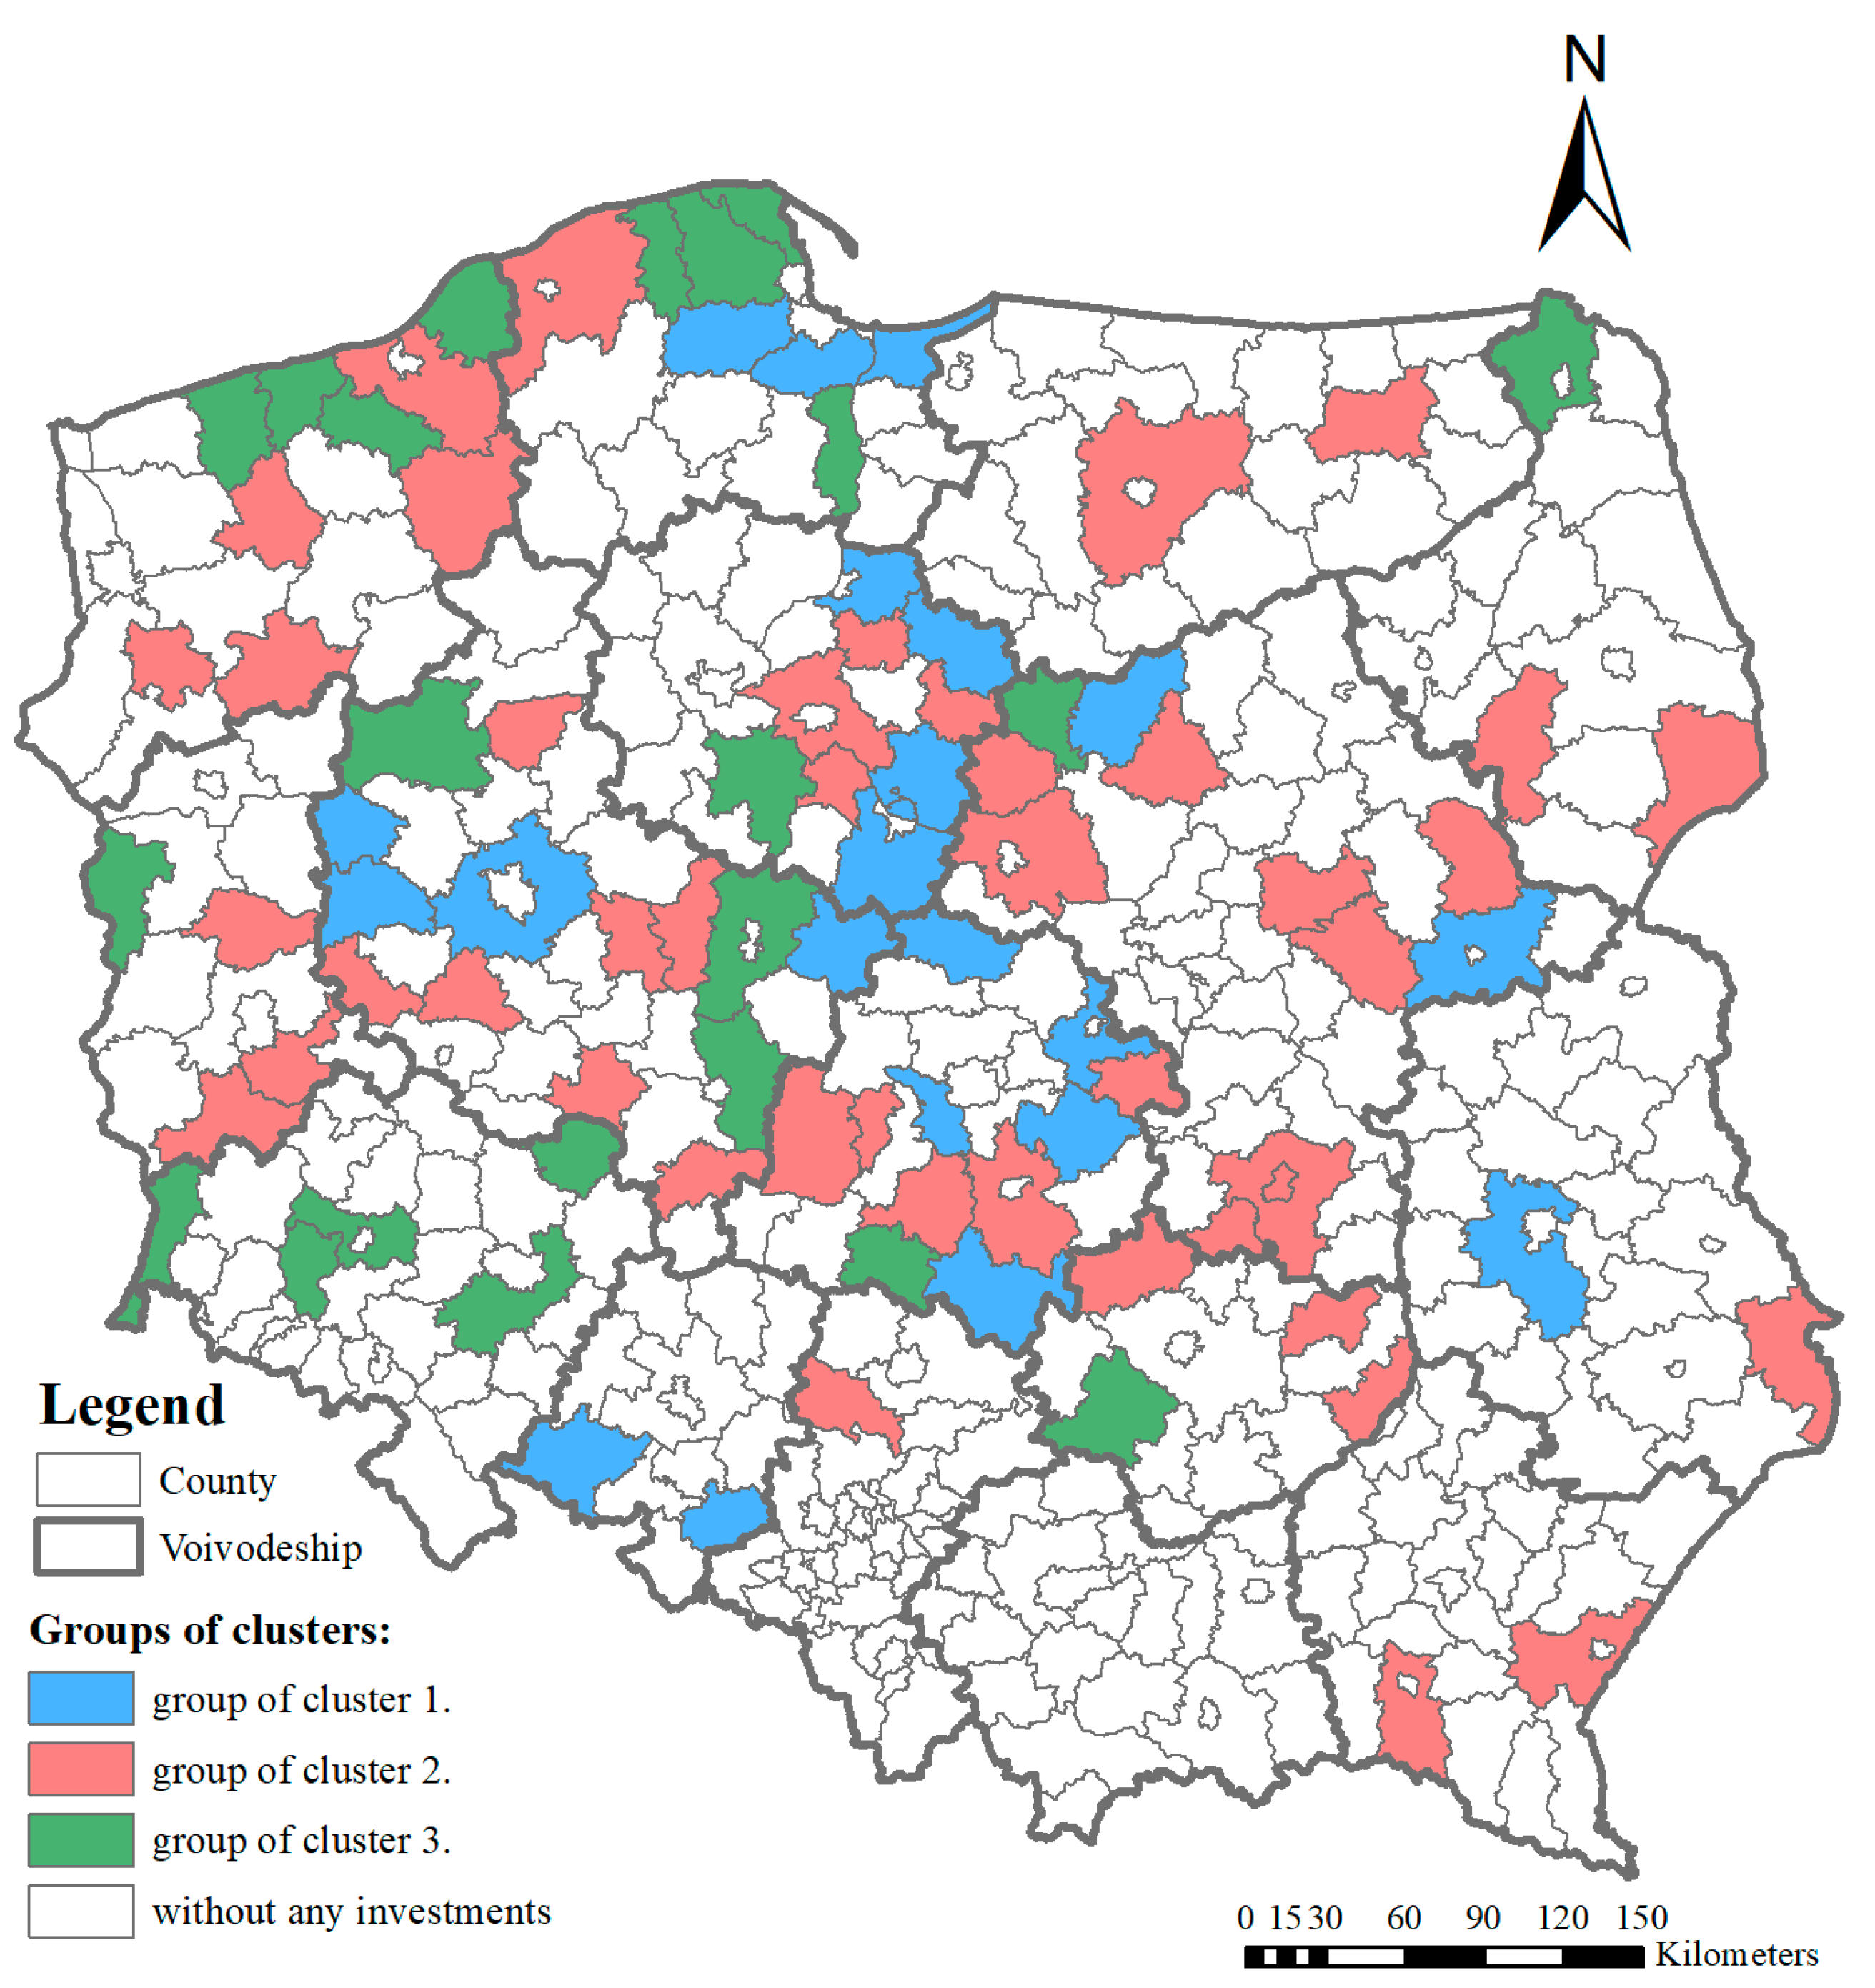
Poviats investing the most in the use of wind energy were grouped in the third cluster. These are 22 poviats located in northern and central parts of the country with slightly above average wind potential implementing many high-cost projects (Figure 4 and Figure 6). The potential in these poviats is slightly higher than in cluster 2, but much lower than in cluster 1 (Figure 5). In half of the poviats from this group, at least 3 projects were implemented; 25% of poviats from this cluster fulfilled not less than 7 projects. These poviats implemented mainly large projects as evidenced by high costs, both total and obtained from the EU (Table 3, Figure A7). The median of EU funds in projects in this cluster is higher than the highest funds in cluster 1 and 2.
Again, the largest group (77%) is the group of poviats that have not implemented any wind energy project. This group includes poviats with different and quite symmetry distributed wind potential (Figure 5).

3.3. Biomass Energy Clusters

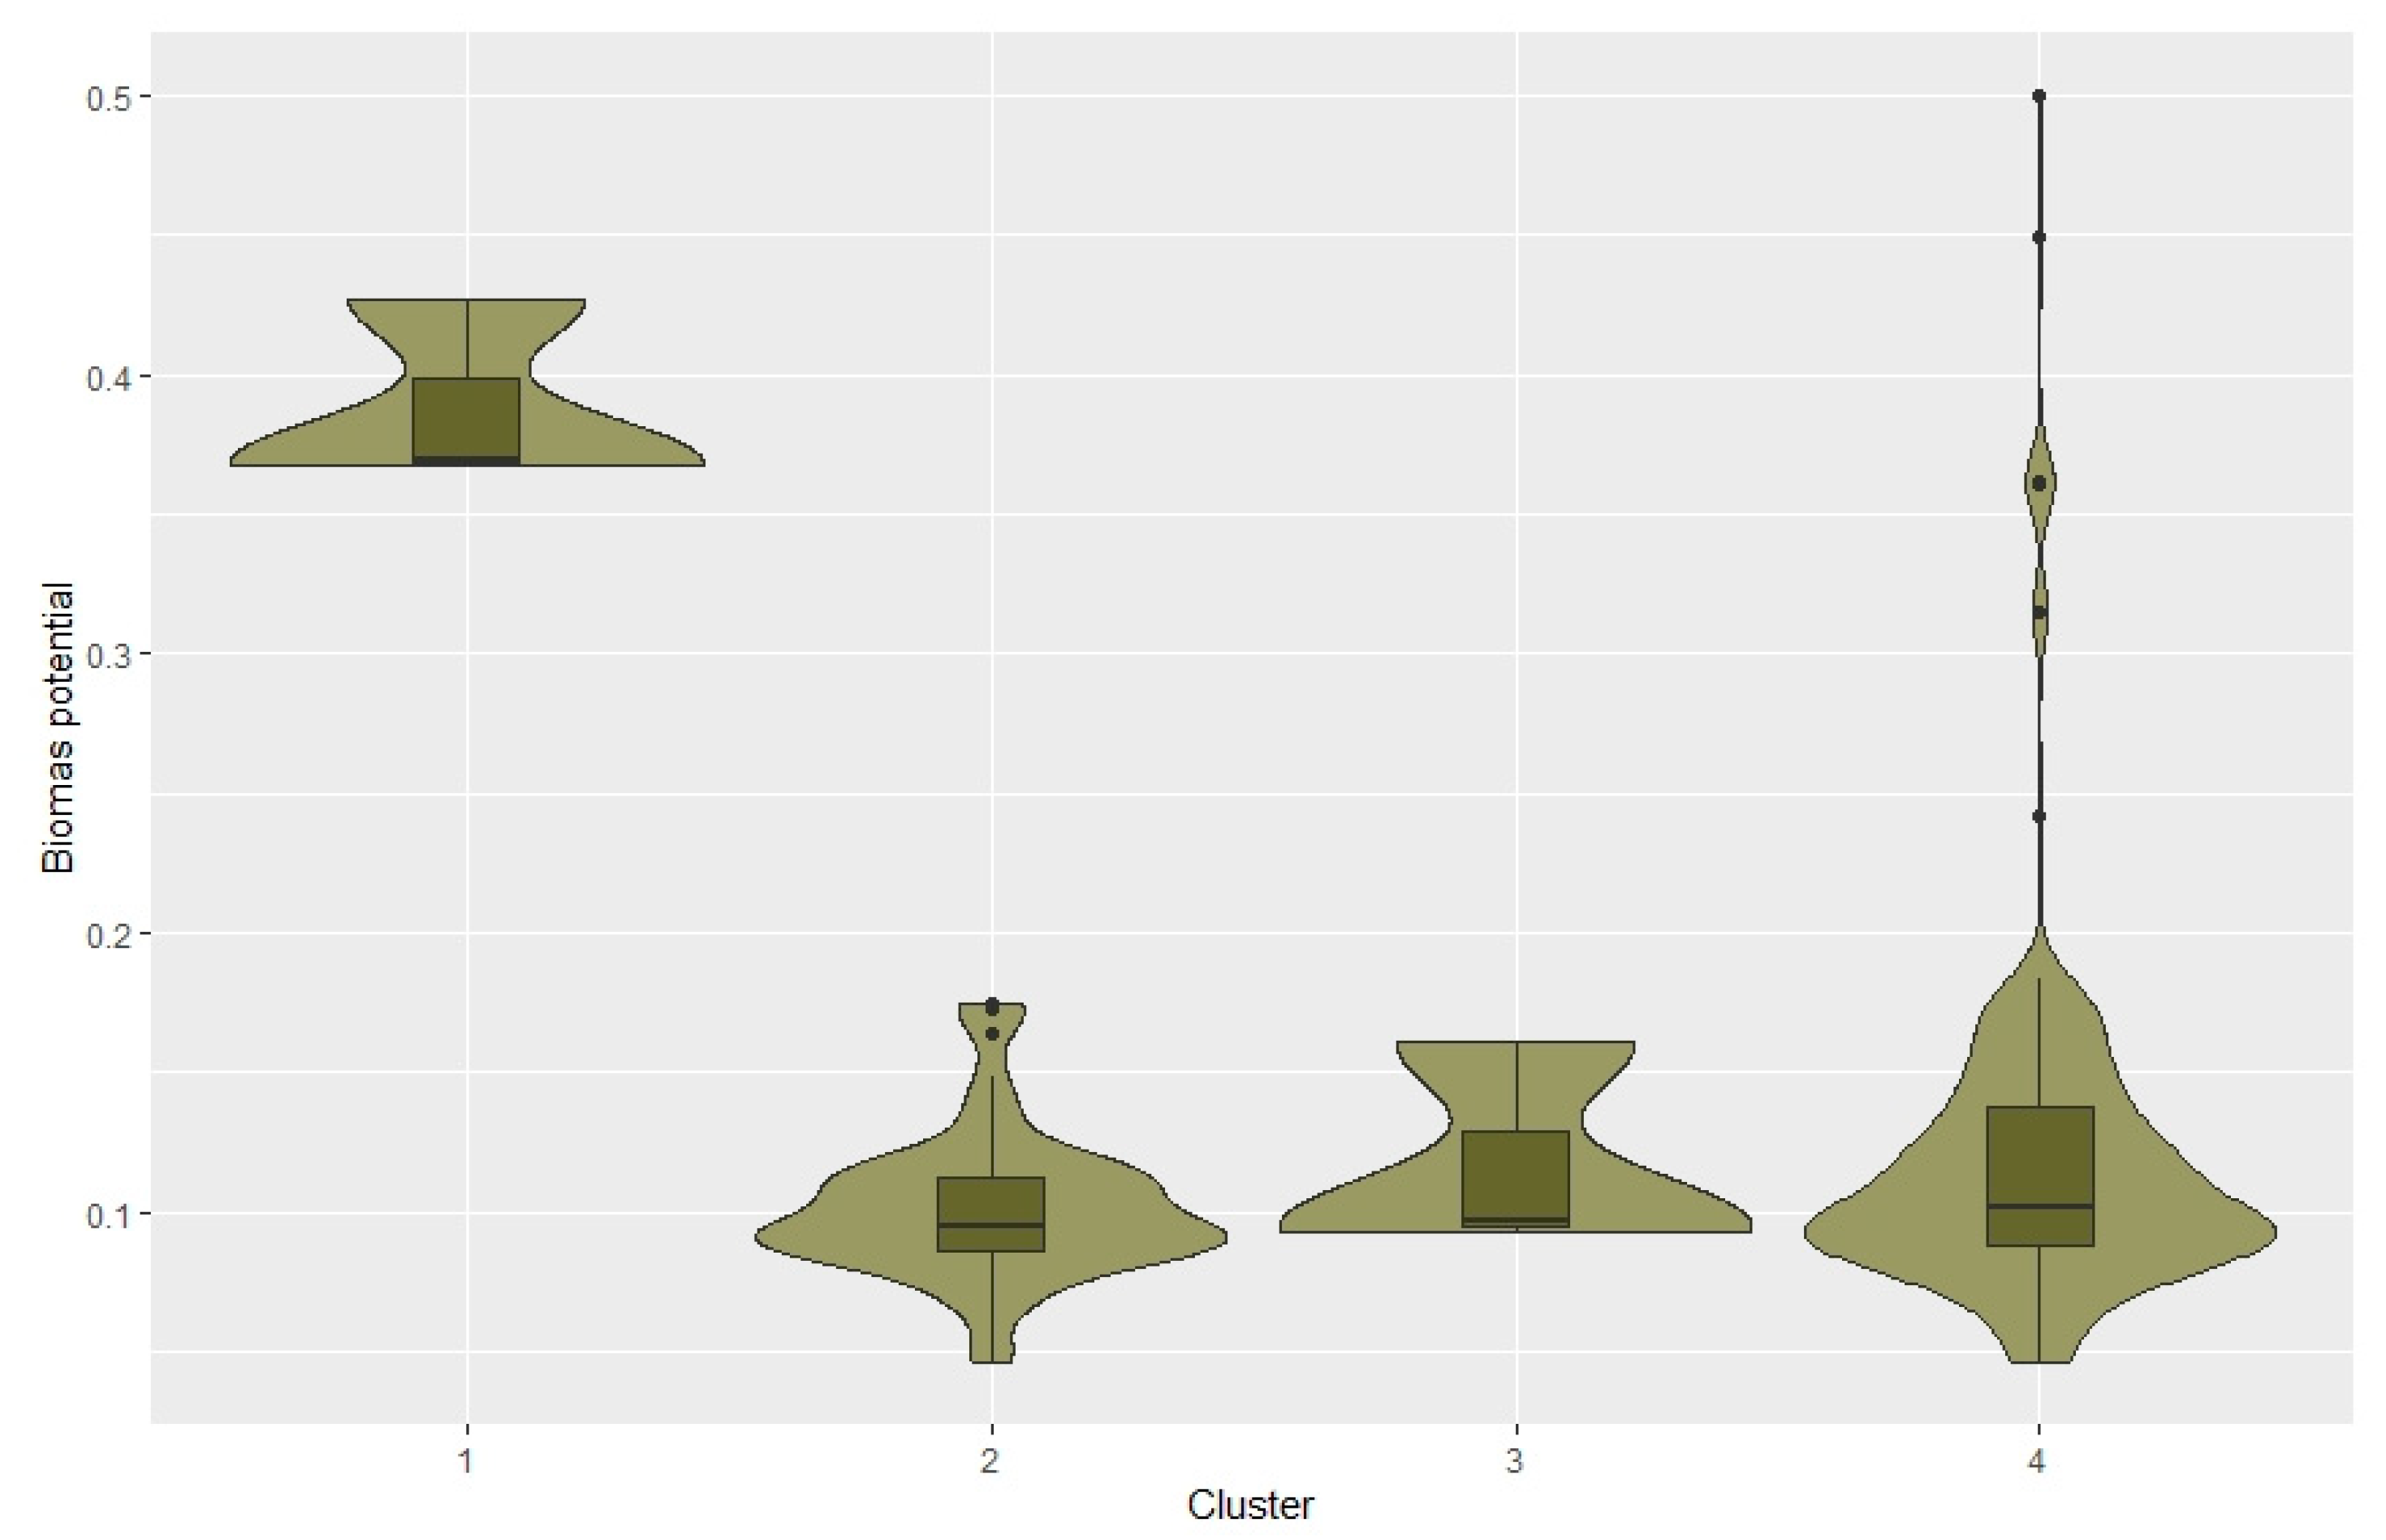
In terms of the utility of biomass energy as a RES measured by the number and value of completed projects, three groups were distinguished, analogous to the other types of renewable energy. In the first one there were 3 poviats with the highest untapped biomass potential (Figure 7 and Figure 8), in each of which only one project of slightly above average value was implemented (Figure A8). These were poviats that are large cities.
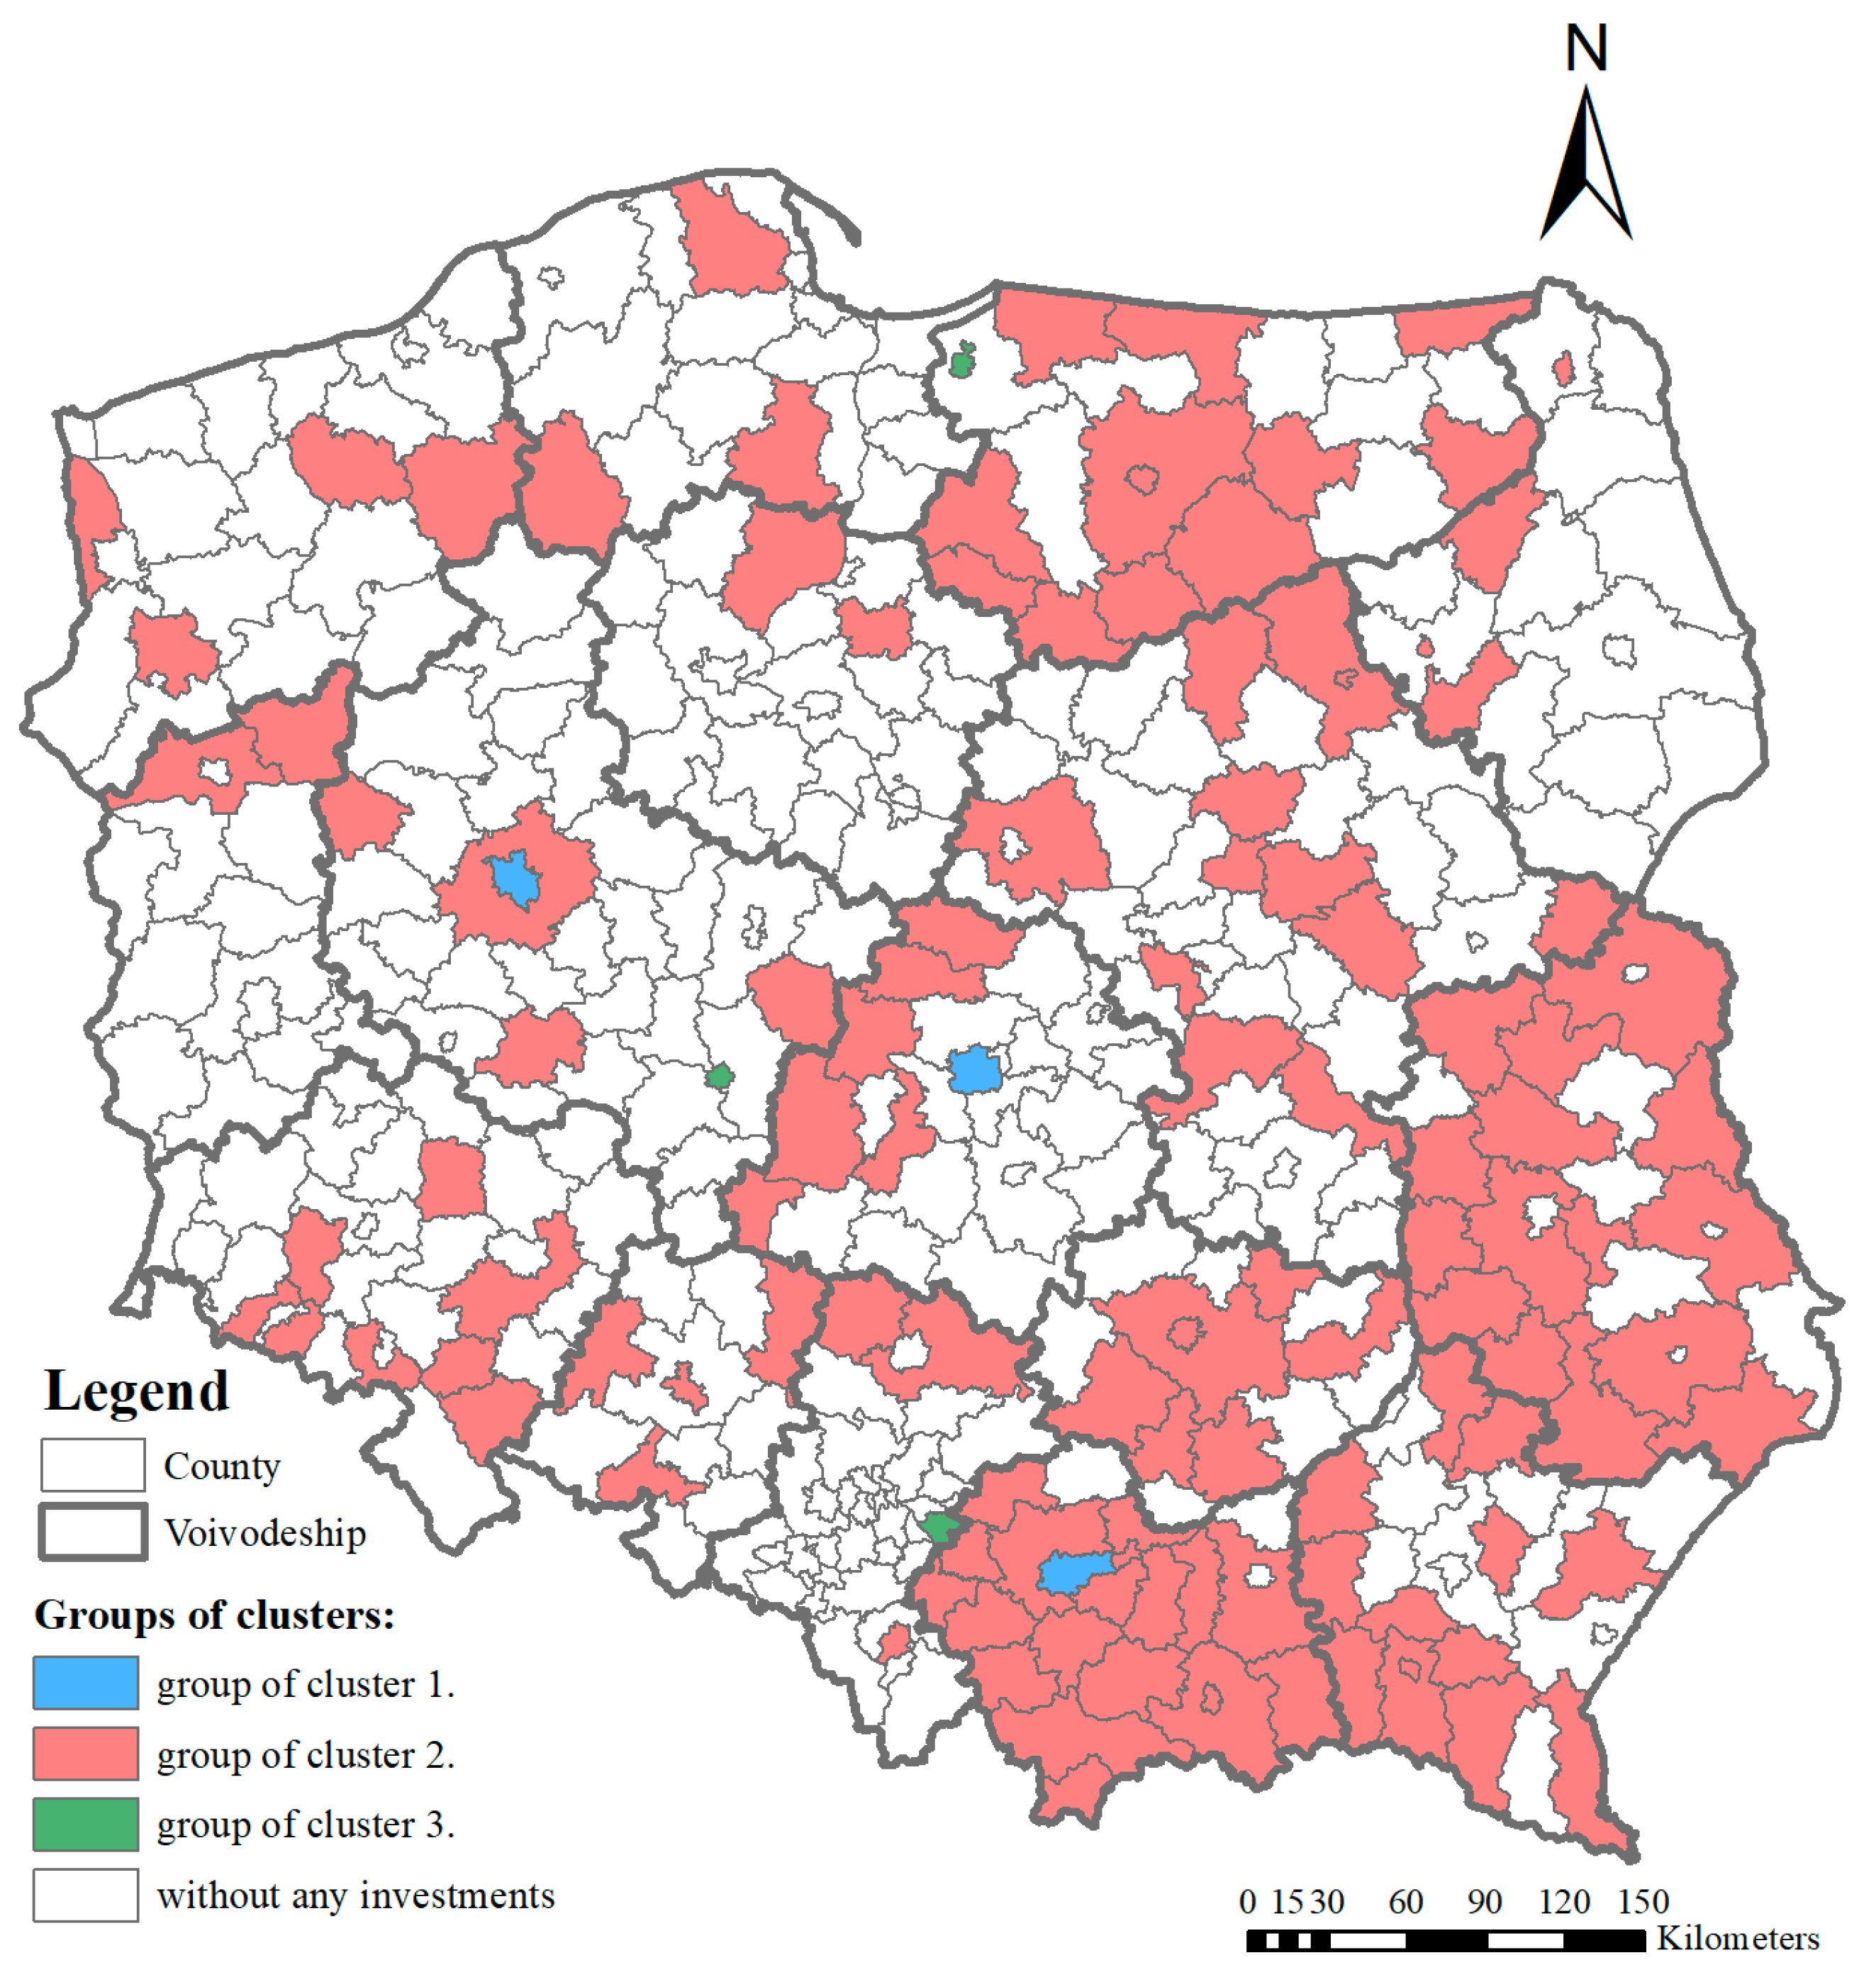
The second group contained 116 poviats which have a low potential and implemented numerous (up to 6 projects per poviat), but with relatively low unit value projects (Table 4). Only one project was implemented in over half of the poviats from this group (Figure A8). Maximal project cost in this group of poviats was 87.4 mln PLN (19.4 mln EUR). These poviats are located in the eastern part of the country with a concentration in the south-east (Figure 9).
The third cluster included 3 poviats with average biomass potential. The common feature of these poviats was the very high cost (both total and EU funding) (Figure A9) of the implemented projects. In these poviats one or two projects were implemented, but each with a value exceeding 150 million PLN (34 million EUR). These were medium-sized cities.
Again, the most numerous was the group of poviats that did not invest in the use of biomass energy (68%). These poviats represented the full range of biomass potential with right-hand asymmetry (Figure 4).

4. Discussion

The results obtained do not allow us to distinguish one general pattern in relation to renewable energy potential and EU funds absorption for RES development. In the case of RES projects based on all three analyzed sources, there was no connection between analyzed factors. By contrast, in some cases local administration units with higher energy production potential were granted with smaller amount of public financial support. Moreover, analyzed units did not represent any concrete spatial pattern presenting coherent spatial clusters of similar neighboring counties except local clusters of around 5–6 units. There were some similarities in terms of activity of poviats in to implement RES projects. In the case of solar energy, local administration units in Eastern and Northern regions were more active in undertaking such activity. In case of wind energy coastal units (neighboring Baltic Sea) were more active comparing to those located farer from the coast. Moreover, there was also one region in the South of Poland in which no wind energy project was implemented within the analyzed period of 16 years. On the other hand, almost all local units in that region implemented projects based on biomass energy, which shows that each region was able to search for their own RES development pattern. That is compatible with policy on national level, as in terms of spatial structure, counties in Eastern and South-Eastern part of Poland were the areas of main concentration of EU funds absorption to develop biomass energy production.
Considering identified patterns, allocation of RES funds supported by the EU in Poland in the period 2004–2019 shows that in general high renewable energy potential was not a factor which significantly increased the use of RES funds. Many reasons for differences in EU funds absorption could explain this fact. In the case of Greece, it was found that type of rural development policy is related with the funding decision and the balance between local and supra-local funding decisions vary depending upon heterogeneous criteria [33] and therefore, it was not possible to distinguish one pattern of EU funds allocation. This is strongly driven by socio-cultural aspects created by local authorities. Considering national differences of RES funds investment observed within the same legal and organizational system, not surprisingly, significant changes in funds investment were registered in Lithuania, Latvia and Estonia by Štreimikienė [20], even when Baltic states have similar natural conditions. That proves the strong impact of local regulations on final energy transformation. In this case, the institutional level of preparedness of local authorities may be the key factor for effective RES funds investment. Such a situation was observed in the case of local development strategies in Poland, where RES development was not considered as an important area of intervention around a decade ago [67]. Luckily, as Carfora et al. [36] proved, the production of renewable energy is directly influenced by the production in similar regions. The opportunity to compare processes in comparable conditions increase the conviction of the local community that they also can successfully implement similar solutions. Therefore, actions undertaken in some local units may impact surrounding units as well. Such a situation was observed also in this study, where for example one of the Southern regions almost fully implemented projects in biomass energy production. That local support from neighboring communities is crucial element considering that for some local authorities even to understand how to assess long-term average cost of saved electricity [68] and to convince to energy transformation at the local level. Fortunately, the approach of local authorities to pro-investment activity in RES development may change over time. As mentioned in the introduction, stakeholders (including institutions) may possess different “willingness to act” and “ability to act” [15]. Results of the study shows the areas in of specialization in Poland in case of specific RES. The higher concentration of poviats in Eastern and Northern regions in terms of solar energy and Southern and Eastern regions in terms of biomass energy prove that these administration units represent both willingness and ability to act to implement RES development actions. Despite the aspect of rationality of funds allocation in these parts of the country, it is worth highlighting that local authorities were effective in realizing RES investments which reflects their approach and the priority assigned to this development direction.
Additionally to the institutional approach, cultural aspect of individuals also play a key role in the process of EU funds allocation for RES development. This can be assessed for instance by the opinion of stakeholders on which kinds of projects should be granted. It was identified that while Polish public authorities are more concentrate on “hard” projects considering mainly infrastructure, citizens are willing to invest in both “hard” as well as “soft” projects influencing social aspects of RES implementation [69]. Therefore, in the process of strategies and planning the final allocation can vary depending on the impact of each stakeholder group. Moreover, it should be highlighted that still there is a problem with a lack of social acceptance by individuals in terms of RES investments in some cases [70,71]. Some people present a “not-in-my-backyard” (NIMBY) attitude while discussing potential scenarios of investments location [72]. However, as Boyle et al. [73] proved, people who favor wind energy do not display NIMBY. They support wind energy and wind-farm development even without compensation. Therefore, “soft” RES projects (including education and the final impact on RES acceptance) might also be also very useful for successful implementation of RES installations, and fortunately citizens can play the role of ambassadors. Such RES support activities have a pivotal role as promotion policies have a positive and statistically significant effect on RES investment (verified on a group of 50 countries) both in Europe as well as in Latin America, where RES development started to be promoted later [74].
While discussing the effectiveness of RES investments, it is also important to refer to its link with the scale of RES installations. Similar to other economy sectors, all new solutions in the renewable energy area at the initial phase of their implementation are more expensive. As Liu et al. [75] observed, there is a tendency of decreasing costs in renewable energy generation as the scale effect appears. Similarly, Tröndle et al. [76] concluded that “European renewable electricity systems on larger geographic scales always have lower cost”. As a major factor of this situation they showed more flexibility variants available to balance fluctuating supply situation. On the other hand, local renewable energy systems can also be economically effective. Based on their study, it was proven that small-scale supply in renewable energy systems has only 20% higher costs, but in case of local grids the needs for energy transport infrastructure are reduced. The open question is if in the case of renewable energy sector the phenomenon of diseconomies of scale can be observed. Diseconomies of scale are connected with the growth of a system over the point above which costs per unit do not decrease any longer due to the scale effect, but start to increase due to its complexity. Such analyses were carried out for traditional energy sector (like natural gas in U.S. [77] and Switzerland [78], crude oil in Kuwait [79], electric energy from conventional sources in Spain [80] and Brazil [81]) but not that common for renewables (like biogas production in Denmark [82]). The report Is Bigger Best in Renewable Energy? published in 2016 by the Institute for Local Self-Reliance referred to the aspect of energy infrastructure scale [83]. One of the conclusions in terms of solar energy installations was that marginally better solar resources in remote sites were lost during energy transmission from the location of its production to the final consumer. At the same time, it is worth highlighting that even though solar energy potential at rooftops in buildings of final consumers was lower, it was still enough to fulfil the needs of households. In terms of wind energy, it was verified how increasing the height or the size of the rotors of a wind turbine by doubling them can reduce the cost of wind electricity production. However, in this case the scale economies of a single turbine seems to be not reached yet. Therefore, depending on the variability of renewable resources, the density of built-up areas and level of dispersion of customers and energy production sites, the optimal size of RES installations from the economic point of view might be different.

5. Conclusions

It is important to highlight two main limitations of the study. The first issue is the generalization of RES potential. As projects were assigned to each poviat, and there were no exact coordinates of the project implementation, energy potential could not be precisely analyzed. Therefore, in the study we referred to mean value of energy potential in each county. The second limitation of the research is the fact that we refer to energy potential on land, excluding territorial waters at the Baltic Sea. Considering the option of constructing both onshore as well as offshore wind energy turbines, projects assigned to coastal units could be located on the sea where wind energy potential is higher. Therefore, there is a potential gap between effectiveness of wind energy production between the analysis and the real operation of the system.
Future research on the development of RES with the support of public funds could focus on each type of RES from the perspective of national conditions predestination, for instance hydropower in Norway [84], geothermal energy in Iceland [85], solar energy in Spain [86] or wind energy in Great Britain [87]. Considering the experience of some cultures and nations with a specific kind of RES it can be assumed that their experience in implementation of these installations is higher. Therefore, national procedures in these countries could be less biased by the option of being managed and controlled by the layman. Moreover, an additional perspective important from the point of view of effectiveness of policy implementation could be to analyze separately RES investments granted and implemented in the beginning and the end of the financial perspective. In the beginning of the financial horizon of granting program decisions could be potentially different (for example driven by granting the most rational projects), while in the end the perspective target of administrative institutions might change (for instance to allocate all available funds among applicants to avoid criticism connected with an inability to invest the whole budget into the local economy). Evaluation of projects’ effectiveness depending on the time frame might be useful to assess if there is a need for more flexibility in financial programs’ implementation. Finally, the identification of actors driving the change might enrich the future state of the art. Answering the question as to who is the catalyst for change in terms of specific types of RES investments may help in designing new energy policy in order to include proper actors and set proper mechanisms to take into account cultural aspects of RES development.
The study conducted allows us to define political implications considering energy transformation policy. In order to increase the efficiency of the energy transformation process in the future it seems important to consider this aspect in public support allocation among local authorities. As Apostolopoulos et al. [33] suggested, a future mechanism should be based on a hybrid allocation of funding that prioritizes local approaches, which are connected with different aspects of local conditions. One of the local conditions is also the selection of the most suitable RES for local development, which is also important due to the cost discrepancy between installations based on different RES [88]. The findings of this research also correspond with this perspective, as current practice in Poland in RES development projects confirms that allocation of EU funds did not target the most profitable parts of the country in terms of possible renewable energy production. The increase of EU funds’ investment effectiveness is especially important considering energy transformation plans assumed in the European Green Deal [89]. From the perspective of practical applicability, the inclusion of RES potential in the decision-making process while allocating public funding between local authorities could help to achieve ambitious environmental targets quicker and to mitigate human impact on the environment with more efficient management of resources.

Author Contributions

Conceptualization, J.K.K. and J.A.K.; methodology, J.K.K. and J.A.K.; software, J.A.K. and R.M.; validation, J.K.K. and J.A.K.; formal analysis, J.K.K., J.A.K. and R.M.; investigation, J.K.K., J.A.K. and R.M.; resources, J.K.K. and R.M.; data curation, J.A.K. and R.M.; writing—original draft preparation, J.K.K. and J.A.K.; writing—review and editing, J.K.K. and M.B.; visualization, J.A.K. and R.M.; supervision, J.K.K.; project administration, J.K.K.; funding acquisition, J.K.K. All authors have read and agreed to the published version of the manuscript.

Funding

The research is co-financed under the Leading Research Groups support project from the subsidy increased for the period 2020–2025 in the amount of 2% of the subsidy referred to Art. 387 (3) of the Law of 20 July 2018 on Higher Education and Science, obtained in 2019.

Conflicts of Interest

The authors declare no conflict of interest.

Appendix A

Figure A1. Dendrogram for poviats agglomeration, Ward linkage method with Euclidean distance–solar energy.
Energies 13 05551 g0a1
Figure A2. Dendrogram for poviats agglomeration, Ward linkage method with Euclidean distance–wind energy.
Energies 13 05551 g0a2
Figure A3. Dendrogram for poviats agglomeration, Ward linkage method with Euclidean distance–biomass energy.
Energies 13 05551 g0a3
Figure A4. Violin plots for number of solar projects in clusters, cluster 4–no projects.
Energies 13 05551 g0a4
Figure A5. Violin plots for EU funds of solar projects in clusters, cluster 4–no projects.
Energies 13 05551 g0a5
Figure A6. Violin plots for number of wind projects in clusters, cluster 4–no projects.
Energies 13 05551 g0a6
Figure A7. Violin plots for EU funds of wind projects in clusters, cluster 4–no projects.
Energies 13 05551 g0a7
Figure A8. Violin plots for number of biomass projects in clusters, cluster 4–no projects.
Energies 13 05551 g0a8
Figure A9. Violin plots for EU funds of biomass projects in clusters, cluster 4–no projects.
Energies 13 05551 g0a9

References

  1. Economidou, M.; Todeschi, V.; Bertoldi, P.; D’Agostino, D.; Zangheri, P.; Castellazzi, L. Review of 50 years of EU energy efficiency policies for buildings. Energy Build. 2020, 225, 110322. [Google Scholar] [CrossRef]
  2. United Nations General Assembly. Rio Declaration on Environment and Development. Available online: https://www.un.org/en/development/desa/population/migration/generalassembly/docs/globalcompact/A_CONF.151_26_Vol.I_Declaration.pdf (accessed on 1 September 2020).
  3. European Council. Council Directive 93/76/EEC of 13 September 1993 to Limit Carbon Dioxide Emissions by Improving Energy Efficiency (SAVE). Available online: https://www.legislation.gov.uk/eudr/1993/76/pdfs/eudr_19930076_adopted_en.pdf (accessed on 1 September 2020).
  4. Mrówczyńska, M.; Skiba, M.; Bazan-Krzywoszańska, A.; Sztubecka, M. Household standards and socio-economic aspects as a factor determining energy consumption in the city. Appl. Energy 2020, 264, 114680. [Google Scholar] [CrossRef]
  5. Krstić-Furundžić, A.; Vujošević, M.; Petrovski, A. Energy and environmental performance of the office building facade scenarios. Energy 2019, 183, 437–447. [Google Scholar] [CrossRef]
  6. Furmankiewicz, M.; Knieć, W.; Atterton, J. Rural governance in the new EU member states: The experience of the Polish LEADER+ pilot programme (2004–2008). In Springer Geography; Springer: Berlin/Heidelberg, Germany, 2015; pp. 133–153. [Google Scholar]
  7. Ziolo, M.; Kluza, K.; Spoz, A. Impact of Sustainable Financial and Economic Development on Greenhouse Gas Emission in the Developed and Converging Economies. Energies 2019, 12, 4514. [Google Scholar] [CrossRef] [Green Version]
  8. Świąder, M.; Lin, D.; Szewrański, S.; Kazak, J.K.; Iha, K.; van Hoof, J.; Belčáková, I.; Altiok, S. The application of ecological footprint and biocapacity for environmental carrying capacity assessment: A new approach for European cities. Environ. Sci. Policy 2020, 105, 56–74. [Google Scholar] [CrossRef]
  9. Wohlgemuth, N.; Wojtkowska-Łodej, G. Policies for the promotion of renewable energy in Poland. Appl. Energy 2003, 76, 111–121. [Google Scholar] [CrossRef]
  10. Bazan-Krzywoszańska, A.; Skiba, M.; Mrówczyńska, M.; Sztubecka, M.; Bazuń, D.; Kwiatkowski, M. Green Energy in Municipal Planning Documents; EDP Sciences: Krakow, Poland, 2018; Volume 45, p. 00006. [Google Scholar]
  11. Anke, C.P.; Hobbie, H.; Schreiber, S.; Möst, D. Coal phase-outs and carbon prices: Interactions between EU emission trading and national carbon mitigation policies. Energy Policy 2020, 144, 111647. [Google Scholar] [CrossRef]
  12. Maes, D.; Van Passel, S. Interference of regional support policies on the economic and environmental performance of a hybrid cogeneration-solar panel energy system. Energy Policy 2012, 42, 670–680. [Google Scholar] [CrossRef]
  13. Liu, W.; Zhang, X.; Feng, S. Does renewable energy policy work? Evidence from a panel data analysis. Renew. Energy 2019, 135, 635–642. [Google Scholar] [CrossRef]
  14. Dusonchet, L.; Telaretti, E. Economic analysis of different supporting policies for the production of electrical energy by solar photovoltaics in eastern European Union countries. Energy Policy 2010, 38, 4011–4020. [Google Scholar] [CrossRef]
  15. West, J.; Bailey, I.; Winter, M. Renewable energy policy and public perceptions of renewable energy: A cultural theory approach. Energy Policy 2010, 38, 5739–5748. [Google Scholar] [CrossRef]
  16. Pelau, C.; Pop, N. Al Implications for the energy policy derived from the relation between the cultural dimensions of Hofstede’s model and the consumption of renewable energies. Energy Policy 2018, 118, 160–168. [Google Scholar] [CrossRef]
  17. Urmee, T.; Md, A. Social, cultural and political dimensions of off-grid renewable energy programs in developing countries. Renew. Energy 2016, 93, 159–167. [Google Scholar] [CrossRef]
  18. Martí-Ballester, C.P. Do European renewable energy mutual funds foster the transition to a low-carbon economy? Renew. Energy 2019, 143, 1299–1309. [Google Scholar] [CrossRef]
  19. Kachniarz, M.; Szewranski, S.; Kazak, J. The Use of European Funds in Polish and Czech Municipalities. A Study of the Lower Silesia Voivodship and Hradec Kralove Region. In IOP Conference Series: Materials Science and Engineering; IOP Publishing: Bristol, UK, 2019; Volume 471, p. 112047. [Google Scholar] [CrossRef]
  20. Štreimikiene, D. Review of financial support from EU Structural Funds to sustainable energy in Baltic States. Renew. Sustain. Energy Rev. 2016, 58, 1027–1038. [Google Scholar] [CrossRef]
  21. Boerenfijn, P.; Kazak, J.K.; Schellen, L.; van Hoof, J. A multi-case study of innovations in energy performance of social housing for older adults in the Netherlands. Energy Build. 2018, 158, 1762–1769. [Google Scholar] [CrossRef]
  22. Bazan-Krzywoszańska, A.; Mrówczyńska, M.; Skiba, M.; Łączak, A. Economic conditions for the development of energy efficient civil engineering using RES in the policy of cohesion of the European Union (2014–2020). Case study: The town of Zielona Gora. Energy Build. 2016, 118, 170–180. [Google Scholar] [CrossRef]
  23. Woch, F.; Hernik, J.; Linke, H.; Sankowski, E.; Bęczkowska, M.; Noszczyk, T. Renewable Energy and Rural Autonomy: A Case Study with Generalizations. Polish J. Environ. Stud. 2017, 26, 2823–2832. [Google Scholar] [CrossRef]
  24. Grešlová, P.; Štych, P.; Salata, T.; Hernik, J.; Knížková, I.; Bičík, I.; Jeleček, L.; Prus, B.; Noszczyk, T. Agroecosystem energy metabolism in Czechia and Poland in the two decades after the fall of communism: From a centrally planned system to market oriented mode of production. Land Use policy 2019, 82, 807–820. [Google Scholar] [CrossRef]
  25. Szewrański, S.; Bochenkiewicz, M.; Kachniarz, M.; Kazak, J.K.; Sylla, M.; Świąder, M.; Tokarczyk-Dorociak, K. Location support system for energy clusters management at regional level. In IOP Conference Series: Earth and Environmental Science; IOP Publishing: Bristol, UK, 2019; Volume 354, p. 012021. [Google Scholar] [CrossRef]
  26. Derlukiewicz, N.; Mempel-Śnieżyk, A.; Mankowska, D.; Dyjakon, A.; Minta, S.; Pilawka, T. How do Clusters Foster Sustainable Development? An Analysis of EU Policies. Sustainability 2020, 12, 1297. [Google Scholar] [CrossRef] [Green Version]
  27. Klaniecki, K.; Duse, I.A.; Lutz, L.M.; Leventon, J.; Abson, D.J. Applying the energy cultures framework to understand energy systems in the context of rural sustainability transformation. Energy Policy 2020, 137, 111092. [Google Scholar] [CrossRef]
  28. Prabatha, T.; Hager, J.; Carneiro, B.; Hewage, K.; Sadiq, R. Analyzing energy options for small-scale off-grid communities: A Canadian case study. J. Clean. Prod. 2020, 249, 119320. [Google Scholar] [CrossRef]
  29. Aberilla, J.M.; Gallego-Schmid, A.; Stamford, L.; Azapagic, A. Design and environmental sustainability assessment of small-scale off-grid energy systems for remote rural communities. Appl. Energy 2020, 258, 114004. [Google Scholar] [CrossRef]
  30. Chodkowska-Miszczuk, J. Small-Scale Renewable Energy Systems in the Development of Distributed Generation in Poland. Morav. Geogr. Reports 2014, 22, 34–43. [Google Scholar] [CrossRef] [Green Version]
  31. Lakatos, E.; Arsenopoulos, A. Investigating EU financial instruments to tackle energy poverty in households: A SWOT analysis. Energy Sources Part B Econ. Plan. Policy 2019, 14, 235–253. [Google Scholar] [CrossRef]
  32. Streimikiene, D.; Lekavičius, V.; Baležentis, T.; Kyriakopoulos, G.L.; Abrhám, J. Climate Change Mitigation Policies Targeting Households and Addressing Energy Poverty in European Union. Energies 2020, 13, 3389. [Google Scholar] [CrossRef]
  33. Apostolopoulos, N.; Chalvatzis, K.J.; Liargovas, P.G.; Newbery, R.; Rokou, E. The role of the expert knowledge broker in rural development: Renewable energy funding decisions in Greece. J. Rural Stud. 2020, 78, 96–106. [Google Scholar] [CrossRef]
  34. Malinauskaite, J.; Jouhara, H.; Egilegor, B.; Al-Mansour, F.; Ahmad, L.; Pusnik, M. Energy efficiency in the industrial sector in the EU, Slovenia, and Spain. Energy 2020, 208, 118398. [Google Scholar] [CrossRef]
  35. Bostan, I.; Lazar, C.M.; Asalos, N.; Munteanu, I.; Horga, G.M. The three-dimensional impact of the absorption effects of European funds on the competitiveness of the SMEs from the Danube Delta. Ind. Crops Prod. 2019, 132, 460–467. [Google Scholar] [CrossRef]
  36. Carfora, A.; Romano, A.A.; Ronghi, M.; Scandurra, G. Renewable generation across Italian regions: Spillover effects and effectiveness of European Regional Fund. Energy Policy 2017, 102, 132–141. [Google Scholar] [CrossRef]
  37. Veum, K.; Bauknecht, D. How to reach the EU renewables target by 2030? An analysis of the governance framework. Energy Policy 2019, 127, 299–307. [Google Scholar] [CrossRef]
  38. Bobis, A.H.; Cooke, T.F.; Paden, J.H. A Funds Allocation Method to Improve the Odds for Research Successes. Res. Manag. 1971, 14, 34–49. [Google Scholar] [CrossRef]
  39. Zhu, D.; Song, D.; Shi, J.; Fang, J.; Zhou, Y. The Effect of Morphology on Solar Potential of High-Density Residential Area: A Case Study of Shanghai. Energies 2020, 13, 2215. [Google Scholar] [CrossRef]
  40. Kazak, J.K.; Świąder, M. SOLIS—A Novel Decision Support Tool for the Assessment of Solar Radiation in ArcGIS. Energies 2018, 11, 2105. [Google Scholar] [CrossRef] [Green Version]
  41. Besser, A.; Kazak, J.K.; Świąder, M.; Szewrański, S. A Customized Decision Support System for Renewable Energy Application by Housing Association. Sustainability 2019, 11, 4377. [Google Scholar] [CrossRef] [Green Version]
  42. Krishnamoorthy, R.; Udhayakumar, K.; Kannadasan, R.; Elavarasan, R.M.; Mihet-Popa, L. An Assessment of Onshore and Offshore Wind Energy Potential in India Using Moth Flame Optimization. Energies 2020, 13, 3063. [Google Scholar] [CrossRef]
  43. Negash, T.; Möllerström, E.; Ottermo, F. An Assessment of Wind Energy Potential for the Three Topographic Regions of Eritrea. Energies 2020, 13, 1846. [Google Scholar] [CrossRef]
  44. Korupczynski, R.; Trajer, J. Assessment of wind energy resources using artificial neural networks-Case study at Łódz Hills. Bull. Polish Acad. Sci. Tech. Sci. 2019, 67, 115–124. [Google Scholar] [CrossRef]
  45. Woch, F.; Hernik, J.; Sankowski, E.; Pióro, P.; Pazdan, M.; Noszczyk, T. Evaluating the potential use of forest biomass for renewable energy: A case study with elements of a systems approach. Polish J. Environ. Stud. 2020, 29, 885–891. [Google Scholar] [CrossRef]
  46. Szulczewski, W.; Żyromski, A.; Jakubowski, W.; Biniak-Pieróg, M. A new method for the estimation of biomass yield of giant miscanthus (Miscanthus giganteus) in the course of vegetation. Renew. Sustain. Energy Rev. 2018, 82, 1787–1795. [Google Scholar] [CrossRef]
  47. Pietrzykowski, M.; Woś, B.; Tylek, P.; Kwaśniewski, D.; Juliszewski, T.; Walczyk, J.; Likus-Cieślik, J.; Ochał, W.; Tabor, S. Carbon sink potential and allocation in above- and below-ground biomass in willow coppice. J. For. Res. 2020, 1, 3. [Google Scholar] [CrossRef]
  48. Ali, M.M.; Ndongo, M.; Bilal, B.; Yetilmezsoy, K.; Youm, I.; Bahramian, M. Mapping of biogas production potential from livestock manures and slaughterhouse waste: A case study for African countries. J. Clean. Prod. 2020, 256, 120499. [Google Scholar] [CrossRef]
  49. Lovrak, A.; Pukšec, T.; Duić, N. A Geographical Information System (GIS) based approach for assessing the spatial distribution and seasonal variation of biogas production potential from agricultural residues and municipal biowaste. Appl. Energy 2020, 267, 115010. [Google Scholar] [CrossRef]
  50. Białowiec, A.; Bieniek, J.; Koziołek, S.; Dębska, A. Potencjał produkcji biogazu z odpadów we wrocławskim Ogrodzie Zoologicznym (The biogas production potential from Wrocław Zoological Garden). Rocz. Ochr. Środowiska Annual Set Environ. Prot. 2016, 18, 337–351. [Google Scholar]
  51. Nachtane, M.; Tarfaoui, M.; Hilmi, K.; Saifaoui, D.; El Moumen, A. Assessment of Energy Production Potential from Tidal Stream Currents in Morocco. Energies 2018, 11, 1065. [Google Scholar] [CrossRef] [Green Version]
  52. Shadman, M.; Silva, C.; Faller, D.; Wu, Z.; de Freitas Assad, L.; Landau, L.; Levi, C.; Estefen, S. Ocean Renewable Energy Potential, Technology, and Deployments: A Case Study of Brazil. Energies 2019, 12, 3658. [Google Scholar] [CrossRef] [Green Version]
  53. Bilić, T.; Raos, S.; Ilak, P.; Rajšl, I.; Pašičko, R. Assessment of Geothermal Fields in the South Pannonian Basin System Using a Multi-Criteria Decision-Making Tool. Energies 2020, 13, 1026. [Google Scholar] [CrossRef] [Green Version]
  54. Chodkowska-Miszczuk, J.; Szymańska, D. Current state and perspectives for oilseed rape production for energy purposes in Poland. Energy Sources Part A Recover. Util. Environ. Eff. 2016, 38, 117–123. [Google Scholar] [CrossRef]
  55. Oikonomou, V.; Flamos, A.; Grafakos, S. Combination of energy policy instruments: Creation of added value or overlapping? Energy Sources Part B Econ. Plan. Policy 2014, 9, 46–56. [Google Scholar] [CrossRef]
  56. Oikonomou, V.; Flamos, A.; Zeugolis, D.; Grafakos, S. A qualitative assessment of EU energy policy interactions. Energy Sources Part B Econ. Plan. Policy 2012, 7, 177–187. [Google Scholar] [CrossRef]
  57. Mapa Dotacji UE. Available online: https://mapadotacji.gov.pl/ (accessed on 5 August 2020).
  58. Head Office of Geodesy and Cartography Dane z Państwowego Rejestru Granic i Powierzchni Jednostek Podziałów Terytorialnych Kraju—PRG. Available online: http://www.gugik.gov.pl/pzgik/dane-bez-oplat/dane-z-panstwowego-rejestru-granic-i-powierzchni-jednostek-podzialow-terytorialnych-kraju-prg (accessed on 4 January 2020).
  59. World Bank Group Global Solar Atlas. Available online: https://globalsolaratlas.info/map (accessed on 4 January 2020).
  60. World Bank Group Global Wind Atlas. Available online: https://globalwindatlas.info/ (accessed on 4 January 2020).
  61. BioBoost. Available online: http://bioboost.eu/home.php (accessed on 5 August 2020).
  62. Hamelin, L.; Borzęcka, M.; Kozak, M.; Pudełko, R. A spatial approach to bioeconomy: Quantifying the residual biomass potential in the EU-27. Renew. Sustain. Energy Rev. 2019, 100, 127–142. [Google Scholar] [CrossRef]
  63. Ward, J.H. Hierarchical Grouping to Optimize an Objective Function. J. Am. Stat. Assoc. 1963, 58, 236–244. [Google Scholar] [CrossRef]
  64. Macqueen, J. Some Methods for Classification and Analysis of Multivariate Observations; The Regents of the University of California: Los Angeles, CA, USA, 1967. [Google Scholar]
  65. TIBCO Software Inc. Data Science Textbook; Available online: https://www.tibco.com/products/data-science (accessed on 1 September 2020).
  66. Forgy, E.W. Cluster analysis of multivariate data: Efficiency versus interpretability of classifications. Biometrics 1965, 21, 768–769. [Google Scholar]
  67. Furmankiewicz, M.; Janc, K.; Kazak, J.K.; Hewitt, R.J. Europeanisation of energy policy and area-based partnerships: Regional diversity of interest in renewable energy sources in local development strategies in Poland. Proc. IOP Conf. Ser. Earth Environ. Sci. 2020, in press. Available online: https://iopscience.iop.org/journal/1755-1315 (accessed on 1 September 2020).
  68. Dranka, G.G.; Ferreira, P.; Vaz, A.I.F. Cost-effectiveness of energy efficiency investments for high renewable electricity systems. Energy 2020, 198, 117198. [Google Scholar] [CrossRef]
  69. Kisiała, W.; Bajerski, A.; Stępiński, B. Preferences of Poles concerning the shape of regional policy and the allocation of European funds. Transylvanian Rev. Adm. Sci. 2018, 14, 55–72. [Google Scholar] [CrossRef]
  70. Harper, M.; Anderson, B.; James, P.; Bahaj, A.B. Assessing socially acceptable locations for onshore wind energy using a GIS-MCDA approach. Int. J. Low Carbon Technol. 2019, 14, 160–169. [Google Scholar] [CrossRef]
  71. Martinez, N.; Komendantova, N. The effectiveness of the social impact assessment (SIA) in energy transition management: Stakeholders’ insights from renewable energy projects in Mexico. Energy Policy 2020, 145, 111744. [Google Scholar] [CrossRef]
  72. Brown, G.; Glanz, H. Identifying potential NIMBY and YIMBY effects in general land use planning and zoning. Appl. Geogr. 2018, 99, 1–11. [Google Scholar] [CrossRef]
  73. Boyle, K.J.; Boatwright, J.; Brahma, S.; Xu, W. NIMBY, not, in siting community wind farms. Resour. Energy Econ. 2019, 57, 85–100. [Google Scholar] [CrossRef]
  74. Bersalli, G.; Menanteau, P.; El-Methni, J. Renewable energy policy effectiveness: A panel data analysis across Europe and Latin America. Renew. Sustain. Energy Rev. 2020, 133, 110351. [Google Scholar] [CrossRef]
  75. Liu, D.; Liu, M.; Xu, E.; Pang, B.; Guo, X.; Xiao, B.; Niu, D. Comprehensive effectiveness assessment of renewable energy generation policy: A partial equilibrium analysis in China. Energy Policy 2018, 115, 330–341. [Google Scholar] [CrossRef]
  76. Tröndle, T.; Lilliestam, J.; Marelli, S.; Pfenninger, S. Trade-Offs between Geographic Scale, Cost, and Infrastructure Requirements for Fully Renewable Electricity in Europe. Joule 2020, 4, 1929–1948. [Google Scholar] [CrossRef] [PubMed]
  77. Oliver, M.E. Economies of scale and scope in expansion of the U.S. natural gas pipeline network. Energy Econ. 2015, 52, 265–276. [Google Scholar] [CrossRef]
  78. Alaeifar, M.; Farsi, M.; Filippini, M. Scale economies and optimal size in the Swiss gas distribution sector. Energy Policy 2014, 65, 86–93. [Google Scholar] [CrossRef]
  79. Al-Mutairi, N.; Burney, N.A. Factor substitution, and economies of scale and utilisation in Kuwait’s crude oil industry. Energy Econ. 2002, 24, 337–354. [Google Scholar] [CrossRef]
  80. Arcos, A.; de Toledo, P.A. An analysis of the Spanish electrical utility industry: Economies of scale, technological progress and efficiency. Energy Econ. 2009, 31, 473–481. [Google Scholar] [CrossRef]
  81. Machado, M.M.; de Sousa, M.C.S.; Hewings, G. Economies of scale and technological progress in electric power production: The case of Brazilian utilities. Energy Econ. 2016, 59, 290–299. [Google Scholar] [CrossRef]
  82. Skovsgaard, L.; Jacobsen, H.K. Economies of scale in biogas production and the significance of flexible regulation. Energy Policy 2017, 101, 77–89. [Google Scholar] [CrossRef] [Green Version]
  83. Farrell, J. Report: Is Bigger Best in Renewable Energy?—Institute for Local Self-Reliance. Available online: https://ilsr.org/report-is-bigger-best/ (accessed on 12 October 2020).
  84. Varlas, G.; Christakos, K.; Cheliotis, I.; Papadopoulos, A.; Steeneveld, G.J. Spatiotemporal variability of marine renewable energy resources in Norway. In Proceedings of the Energy Procedia; Elsevier: Amsterdam, The Netherlands, 2017; Volume 125, pp. 180–189. [Google Scholar]
  85. Spittler, N.; Davidsdottir, B.; Shafiei, E.; Leaver, J.; Asgeirsson, E.I.; Stefansson, H. The role of geothermal resources in sustainable power system planning in Iceland. Renew. Energy 2020, 153, 1081–1090. [Google Scholar] [CrossRef]
  86. Mir-Artigues, P.; Cerdá, E.; del Río, P. Analysing the economic impact of the new renewable electricity support scheme on solar PV plants in Spain. Energy Policy 2018, 114, 323–331. [Google Scholar] [CrossRef] [Green Version]
  87. Harper, M.; Anderson, B.; James, P.A.B.; Bahaj, A.B.S. Onshore wind and the likelihood of planning acceptance: Learning from a Great Britain context. Energy Policy 2019, 128, 954–966. [Google Scholar] [CrossRef]
  88. Chodkowska-Miszczuk, J.; Biegańska, J.; Środa-Murawska, S.; Grzelak-Kostulska, E.; Rogatka, K. European Union funds in the development of renewable energy sources in Poland in the context of the cohesion policy. Energy Environ. 2016, 27, 713–725. [Google Scholar] [CrossRef]
  89. European Commission. Communication from the Commission to the European Parliament, the Council, the European Economic and Social Committee and the Committee of the Regions: The European Green Deal; European Commission: Brussels, Belgium, 2019. [Google Scholar]
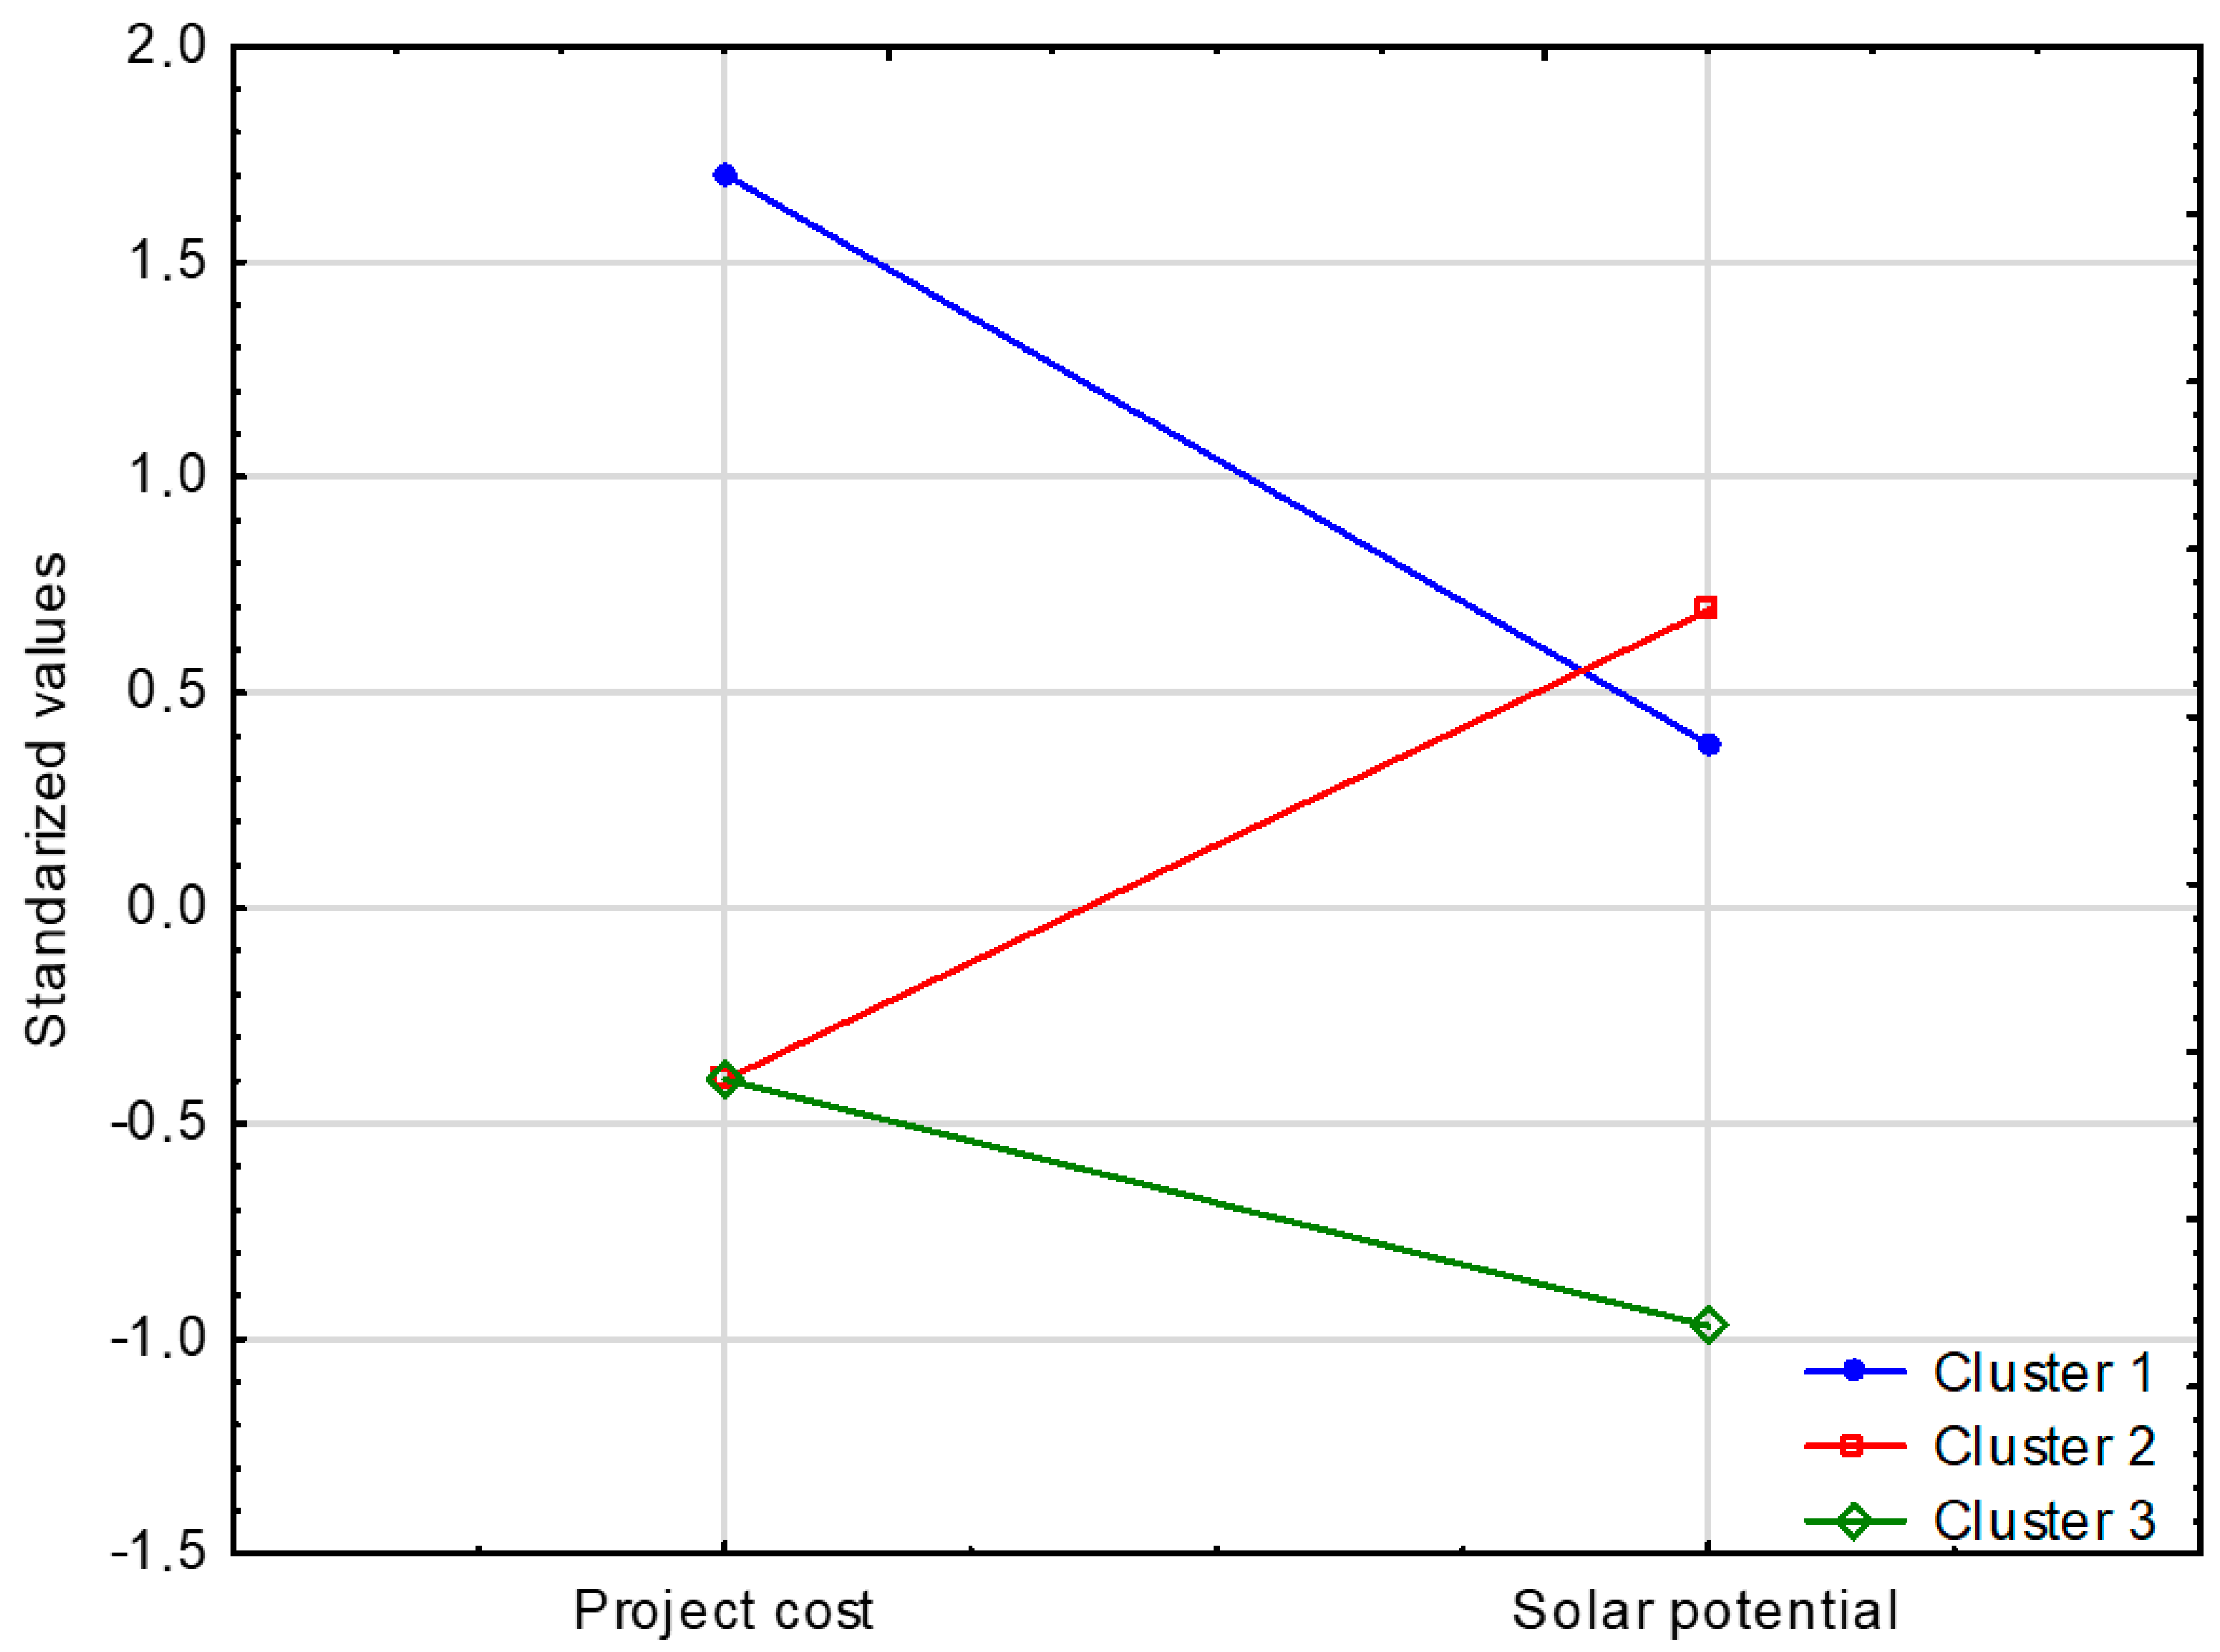
Figure 1. Standardized average project costs and solar potential.
Energies 13 05551 g001
Figure 2. Solar potential distribution for clusters.
Energies 13 05551 g002
Figure 3. Spatial distribution of solar energy clusters.
Energies 13 05551 g003
Figure 4. Standardized average project costs and wind potential.
Energies 13 05551 g004
Figure 5. Wind potential distribution for clusters.
Energies 13 05551 g005
Figure 6. Spatial distribution of wind energy clusters.
Energies 13 05551 g006
Figure 7. Standardized average project costs and biomass potential.
Energies 13 05551 g007
Figure 8. Biomass potential distribution for clusters.
Energies 13 05551 g008
Figure 9. Spatial distribution of biomass energy clusters.
Energies 13 05551 g009
Table 1. Descriptive statistics.
VariableNMeanMedianModeM.C.MinMaxQ1Q3Stand. Dev.Skewness
Solar energy *
Number of projects15332160127143.93.51
Project costs15311,167,3786,976,243* 145,33648,621,7903,456,06215,705,37410,843,2041.48
EU funds1535,415,8783,530,248* 68,56826,038,3121,826,5157,671,1895,123,4701.51
Potential38089* 2.8186113.30.20
Wind energy
Number of projects8822134110132.11.94
Project costs88112,926,94853,929,94722,975,875290,493564,970,25516,161,395186,206,876129,585,1281.58
EU funds8830,213,82421,138,621*263,345119,773,6396,341,92441,595,58528,371,2801.18
Potential380378.1376.3* 95.6848.2258.1487.2159.60.32
Biomass energy
Number of projects1222117516121.01.81
Project costs12216,951,4134,015,233* 7420282,470,5801,045,89310,913,45042,187,2954.68
EU funds1225,691,1752,738,784* 259757,828,660415,5396,840,2388,730,3153.20
Potential3800.1170.100* 0.040.500.0870.1280.0593.32
* there is no mode in the set; M.C. —median count.
Table 2. Descriptive statistics for solar energy clusters.
NProject Cost [mln zł]Solar Potential
MinMeMaxsMinMeMaxs
12918.025.248.69.25.68.814.72.8
2750.25.419.45.08.28.917.92.3
3490.15.921.05.52.785.645.991.3
422700002.88.617.53.3
N—number of elements, Me—median, s—standard deviation.
Table 3. Descriptive statistics for wind energy clusters.
NProject Cost [mln zł]Wind Potential
MinMeMaxsMinMeMaxs
1210.518.3276.167.148057982698
2450.0944.3167.846.313136946286
322184.3262.4565.0113.6135424558105
4292000096354848164
N—number of elements, Me—median, s—standard deviation.
Table 4. Descriptive statistics for biomass energy clusters.
NProject Cost [mln zł]Biomass Potential
MinMeMaxsMinMeMaxs
1358.178.9163.155.60.370.370.430.03
21160.0073.787.415.50.050.090.170.03
33151.7235.4282.572.70.090.100.160.04
425800000.050.100.500.06
N—number of elements, Me—median, s—standard deviation.
Publisher’s Note: MDPI stays neutral with regard to jurisdictional claims in published maps and institutional affiliations.