1. Introduction
Stringent exhaust emission and fuel consumption regulations always impose the need for new solutions for further development of internal combustion engines. Concerning compression ignition engines, widely used due to their high fuel efficiency and specific power output, significant attention is paid to biodiesel, with the aim of both replacing fossil fuels and reducing exhaust emissions [
1,
2]. On the other hand, the high Nitrogen Oxides and Particulate Matter production represents a limit to meet worldwide exhaust emissions regulation, arousing major interest in spark ignition (SI) engines. The combination of new technologies and solutions such as downsizing/turbocharging, variable valve timing and actuation, cooled exhaust gas recirculation and water injection has allowed a strong optimization of SI engines throughout the recent decades [
3,
4,
5,
6,
7].
A turbocharged/downsized SI engine can operate close to minimum brake specific fuel consumption (BSFC) over a wide range of speeds and loads. In more detail, this kind of engine provides major reductions in BSFC if compared to a naturally aspirated, port fuel injection counterpart at low-to-moderate torque levels. The consumption reductions come from a drop in friction losses (thanks to the smaller number and dimension of cylinders and related moving mechanisms) and pumping losses (associated with the reduction or abolition of throttling at low loads).
The application of turbocharging and downsizing in commercial vehicles has been increasing since 2000s, but at the present time there are still technical issues connected to this kind of engine such as pre-ignition, knocking tendency and high temperatures at the exhaust. The elevated intake pressures increase the knock predisposition; due to pre-ignition and knock concerns, the spark timing range for acceptable operation is significantly reduced at high Brake Mean Effective Pressures, which results in an increase in fuel consumption. On the other hand, turbochargers are characterized by maximum allowed values of temperature to avoid an excessive thermal stress for the turbine blades; in order to maintain exhaust temperatures below this limit and to reduce the knock tendency at high load and low speed, fuel enrichment is often used. Moreover, the latter control strategy obviously deteriorates the fuel consumption of the vehicle.
In addition to this, another phenomenon that usually becomes a limiting factor for the operational range of the engine design [
8] is the cycle-to-cycle variation (CCV). Cycle-to-cycle variation consists of the differences between consecutive combustion events and it is mainly due to the stochastic nature of internal turbulent flow structures and combustion processes [
9]; it can lead to a reduction in the engine efficiency because of the potentially associated knocking phenomena, and also increase the production of unburned hydrocarbon and carbon monoxide due to incomplete combustion. Moreover, this phenomenon can induce unwanted fluctuations of power [
10].
Due to all these restrictions and limiting factors, the modern turbocharged SI engine needs a robust control through engine control unit (ECU). An ECU control scheme manages engine emissions and fuel economy gathering the data obtained by different sensors and regulating the input parameters such as spark timing, fuel injection timing, etc. Engine control procedures are carried out taking into account the overall engine operation and emissions assuming that the different cylinders have the same behavior. Anyway, although many efforts have been made to introduce in all cylinders a homogeneous air-fuel mixture, some non-uniformities remain that induce the phenomenon of cylinder-to-cylinder variation. This occurrence is attributed to the uneven distribution of the charge in different cylinders caused by thermo-fluid dynamic processes taking place during the intake process. This means that some cylinders work in lean condition and the engine parameters are adjusted to make these cylinders run reliably. On the other hand, the richer cylinders probably produce unburned hydrocarbons and waste fuel. Moreover, this difference in air/fuel (A/F) ratio of each cylinder leads to a further increase in cycle-to-cycle variation as an optimal combustion phasing for all cylinders is impossible without a single cylinder control strategy of engine parameters. A significant cylinder-to-cylinder variability compromises the engine balancing, increasing both longitudinal and torsional vibrations which strain the crankshaft with fatigue stress and decrease comfort and safety of the vehicle passenger [
11]. Saxén et al. [
12] investigated the effect of cylinder power balancing on torque propagation. They found a reduction of 82% in the standard deviation of the power unbalances at the flywheel through a dynamic control of individual cylinder fuel injection duration and timing. As a consequence, a reduction in the magnitude of all the torque order frequency components below ignition frequency was found.
According to this scenario, a refined control of combustion process in each cylinder can represent a useful and affordable way to limit cylinder-to-cylinder and cycle-to-cycle variations and this would be a significant step towards further optimization of SI engines.
A number of studies are available in the current literature discussing the origin, the main effects and the control of both cylinder-to-cylinder variation and cyclic dispersion for internal combustion engines. Special attention is here devoted to the analysis of literature works discussing the impact of the above phenomena on the operation of Spark-ignition engines.
As reported by Zhou et al. [
13], the research works in the field of cylinder non-uniformity in a multi-cylinder engine can be summarized in three main aspects.
The first one is the study of variation of several engine parameters among different cylinders and their influence factors. In particular, indicated mean effective pressure (IMEP) and its coefficient of variation (COV
IMEP) were extensively studied as main parameters that can describe the cylinder performance and variations [
14].
The second aspect of the literature study is how the cylinder-to-cylinder and the cycle-to-cycle variations influence the performance and emissions of a multi-cylinder engine [
15,
16,
17].
The last aspect of the research work in this field is how to reduce the above discussed variability in a multi-cylinder engine. The results obtained show that this phenomenon is very difficult to control; some good results were obtained through controlling the inlet air temperature [
18], or through the development of a cylinder balancing control strategy [
19,
20].
An effective way to reduce cycle-to-cycle variations is adding hydrogen to the primary fuel. This solution is considered especially for spark ignition engines fueled with Compressed Natural Gas (CNG) and Liquefied Petroleum Gas (LPG). Hydrogen has a high-octane number and burn velocity, promoting a more stable combustion and reducing knock tendency [
21]. These characteristics make the use of hydrogen attractive especially for applications on SI engines working under lean burn conditions as they allow the extension of the lean limit [
22].
Of course, certain benefits can be also achieved in terms of reduced CCV and improved combustion stability through the optimal control of cylinder operation, acting on the mitigation or the substantial elimination of the cylinder unbalance in a multi-cylinder SI engine [
20,
21,
22,
23,
24].
Most of the reference works on this topic are oriented towards an experimental approach. Fewer numerical analyses can be found in the literature, even if the use of numerical methodologies is receiving a growing interest on the study of individual cylinder operation and variability to reduce the time and cost required by the experiments. The combination of numerical and experimental methods appears to be a desirable choice to properly forecast the individual cylinder behavior and, subsequently, to explore the engine control strategies capable of improving the cylinder non uniformities and the related cyclic dispersion. Furthermore, the selection of the numerical approach holds an important role in satisfactorily forecasting the in-cylinder processes without burdening the computational time. From this point of view, among the existing numerical models, a 1D approach offers the possibility to study the individual cylinder behavior in a multi-cylinder engine, showing good balance between accuracy and computational effort. A 1D model is suitable for performing system analyses, testing modified engine architectures, and exploring and optimizing the operation of each cylinder in various engine conditions. On the other hand, a 1D model cannot provide information about local phenomena occurring in the combustion chamber like mixture inhomogeneity, variations in turbulence etc.
This paper presents experimental and 1D numerical investigations performed on a twin-cylinder turbocharged Port Fuel Injection (PFI) Spark Ignition engine in order to study the influence of cycle-to-cycle and cylinder-to-cylinder variations on combustion and performance under different operating conditions. In addition, the developed numerical model is also utilized in a predictive way to make uniform the operation between cylinders in order to optimize engine performance, combustion and CCV.
As is well known, the limits of the 1D model concerning local phenomena predictions do not allow the identification of variations in turbulence and mixture quality near the spark plug even if this has a significant influence on CoV and CCV.
The innovative contribution of this work with respect to the state-of-art papers mainly consists of the prediction of cylinder-related and cycle-related variabilities by means of a 1D model integrated with refined 0D in-cylinder sub-models. A further relevant aspect of the proposed study consists of the integration of the developed engine model with empirical CCV correlations to furnish a first attempt estimation of improved CCV levels resulting from the optimization of engine operation. Following the above discussed numerical procedure, in this paper the experimental tests on the considered SI engine are first presented.
For each cylinder, the coefficients of variations (CoVs) of selected pressure parameters were used to quantify the cyclic dispersion. Experimentally-derived correlations, representative of the actual engine system, were coupled to an advanced 1D model of the whole engine, developed within a commercial code. Once validated, the model was applied to optimize the single cylinder operation, mainly acting on the spark timing and fuel injection, with the aim to reduce the indicated specific fuel consumption (ISFC) and to improve the combustion stability through the optimization of the cyclic dispersion level.
2. Engine Features, Experimental Activity and Procedure
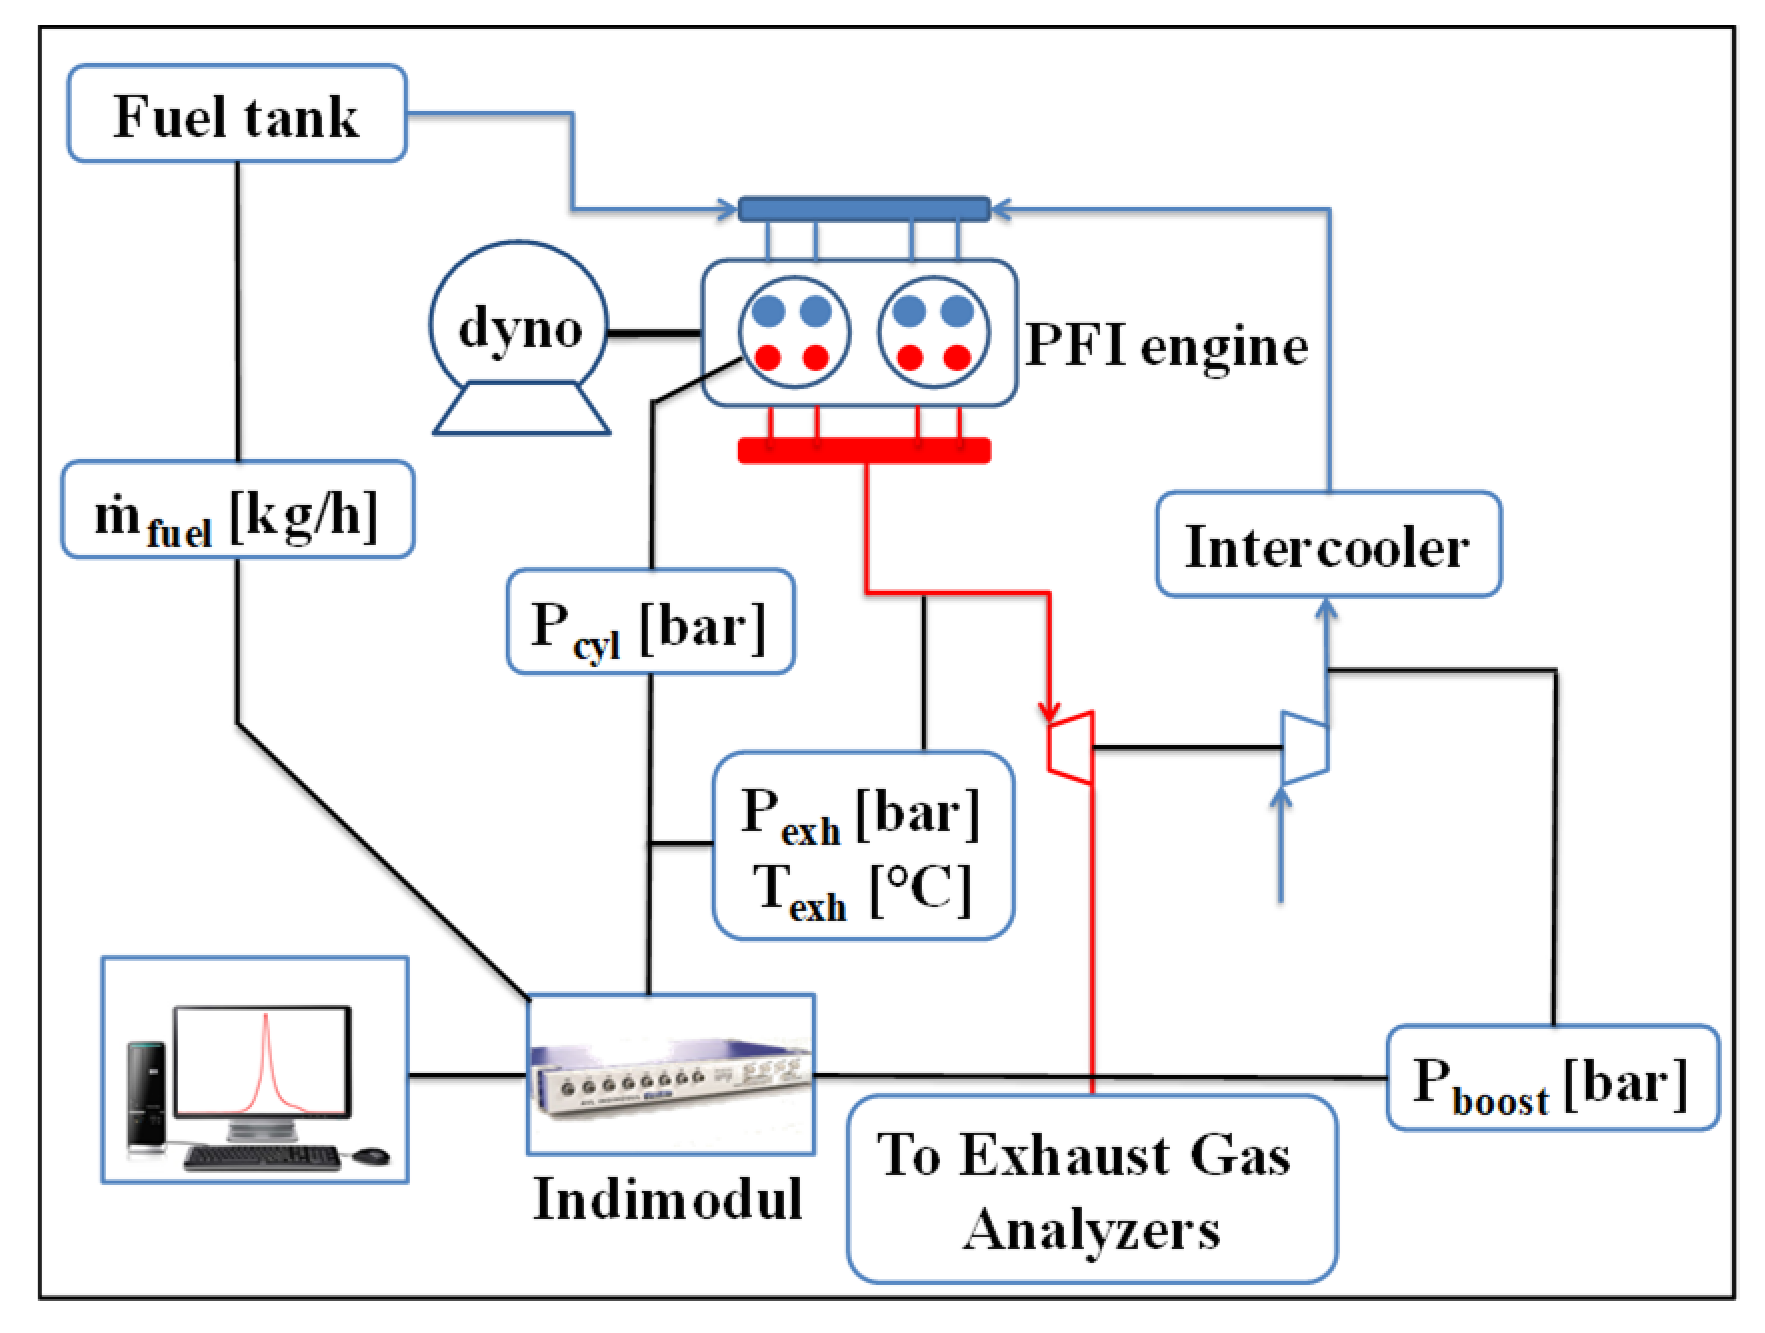
The SI internal combustion engine used in this work is sketched in
Figure 1 and its main features, including performance, geometrical and intake/exhaust valve characteristics, are listed in
Table 1. It consists of two cylinders coupled to a small waste-gated turbocharger, which allows it to match the boost level for the prescribed full load performance target. Port fuel injectors are mounted along the intake runners just upstream of the valves to feed the engine with liquid gasoline. The engine is also equipped with a Variable Valve Actuation (VVA) device for a flexible control of the intake lift strategy while the exhaust valves present both fixed lift and timing.
The engine was installed at a test bench and instrumented with various sensors/transducers. Two piezo-quartz pressure transducers (measuring range 0: 250 bar, accuracy of ±0.1%) in the cylinders allowed the measuring of instantaneous pressure. For combustion analysis, signals were recorded over 270 consecutive cycles, with a resolution of 0.1 Crank Angle Degree (CAD) within the angular window between −90 and 90 CAD After Top Dead Center (AFTDC), assuming a polytrophic thermodynamic process. A 1.0 CAD sampling resolution was set outside this angular interval.
Intake, boost and turbine inlet pressure were monitored through piezo-resistive low-pressure indicating sensors (measuring range 0: 10 bar, accuracy of ±0.1%); intake and exhaust temperatures were measured with thermocouples. The relative A/F ratio (λ) is measured with a sensor located at the engine exhaust, downstream of the turbine, with an accuracy of ±0.01 at λ = 0.8, ±0.007 at λ = 1.0.
The experimental activity can be divided into two phases: spark sweep analysis and ECU conditions analysis.
2.1. Phase 1: Spark Sweep Analyses
The first part of the experimental activity includes spark timing sweeps performed at various loads, a wide range of engine speeds and also stoichiometric and rich A/F mixture conditions at medium/high loads. In particular, a prevailing number of medium/high load conditions is considered in these studies and only a more limited set of part-load cases is analyzed.
Table 2 reports the overall test matrix for this phase of experiments consisting of 50 operating points. For each engine speed and selected λ, a spark timing sweep is actuated taking into account a proper range of values. This range includes a reference spark advance corresponding to the Maximum Brake Torque (MBT) at low load or to the heuristic-based knock limit at high load. The richer A/F ratio is investigated at high load regardless of the engine speed in order to take into account the characteristic limitations of the examined engine related to the avoidance of knock occurrence and to the constraint on the maximum allowable temperature at turbine inlet (below 950 °C). It is the case to also underline that the relative A/F ratio is maintained at a constant level for each combination of engine speed, spark timing and IMEP reported in
Table 2.
For each analyzed point belonging to the spark sweep analyses, 270 consecutive in-cylinder pressure traces were measured for both engine cylinders, the recorded sequence is then post-processed to obtain the distributions of both pressure variables (i.e., IMEP and pmax) and combustion parameters (i.e., mass fraction burned at relevant crank angles, MFB10, MFB50 and MFB90) for the individual cylinders of the engine. A standard deviation below 2% was measured for the IMEP of the engine in all the tested operating points. Even lower values were observed in the low/medium load range. The in-cylinder pressure peaks (pmax) of two cylinders have a quite similar standard deviation at varying the investigated speed/load points. Standard deviations in the range 4.8–9.9% (1.7–6.5 bar absolute value) and 3.6–9.4% (1.4–6.6 bar absolute value) were recorded for Cyl #1 and Cyl #2, respectively. Similar absolute standard deviations were found for the combustion phasing MFB50: 1.5–2.6 CAD for Cyl #1 and 1.5–2.4 CAD for Cyl#2. Concerning the core combustion durations (MFB10–50), a reduced standard deviation was detected with a lower variability range for Cyl #2 (0.73–1.15 CAD) compared to Cyl #1 (0.84–1.51 CAD). The air flow rate was derived by the intake plenum pressure, measured through a piezo-resistive low pressure sensor (measuring range 0: 10 bar, accuracy of ±0.1%), showing a standard deviation of about 3% in almost the whole test matrix.
2.2. Phase 2: Experimental Points on the Engine Map
In a second stage, the ECU standard calibration is considered: the experiments were carried out under the conditions reported in
Table 3. The test grid consists of 15 operating points, arranged in three groups characterized by the same speed, null external Exhaust Gas Recirculation (e-EGR) and increasing IMEPs. The matrix in
Table 3 was developed considering the engine points more representative of everyday driving conditions. First of all, it was considered that the tested engine, coupled to a segment A vehicle, works along a WLTC driving cycle in a region of the operating plan characterized by a speed from 1000 to 3000 rpm and loads up to 15 bar Brake Mean Effective Pressure (BMEP). For this reason, the speeds of 2000 and 3000 rpm were chosen with an IMEP sweep from 5 to 13 bar and from 5 to 18 bar, respectively.
Moreover, further operating conditions, outside of the WLTC, typical of highway driving conditions were added: an engine speed of 4000 rpm was selected and the IMEP was changed in a discrete way from 7 to 16 bar.
For each point, main performance and calibration variables are reported and a label is also used to synthesize the speed/load data. An analysis of the investigated ECU operating points highlights a mixture over-fueling at higher IMEP only for medium/high speeds. Furthermore, the spark timing is gradually delayed at increasing load. These control strategies are mandatory for the considered downsized engine to avoid knocking and to limit the thermal stress at turbine inlet. However, the discussed control strategies at high loads greatly penalize engine fuel consumption as emerged from the experimental results presented in the subsequent section of model validation. In the latter section, the experimental outcomes for both cylinders in each operating point of the test matrix (
Table 3) show a systematic cylinder-to-cylinder variation that can be easily observed by the differences in the pressure (peak and instantaneous trace) and combustion data of two cylinders. This systematic cylinder-to-cylinder variability is mainly ascribed to the different mass of fuel injected between cylinders. In fact, a comparison between pressure traces from Cyl #1 and Cyl #2 highlights an overlap in the compression stage, indicating an equal air volumetric efficiency for the two cylinders, while Cyl #2 provides higher pressure peak and combustion rate than Cyl #1, suggesting a difference in fuel supply to cylinders. These experimental outcomes suggest that engine cylinders operate under different A/F ratios: lean mixture is realized for Cyl #1 and rich mixture is obtained for Cyl #2 compared to the overall engine A/F ratio.
3. Modeling Approach and Validation
Based on the results of the previously discussed experimental activities, a modeling approach is employed here consisting of the integration of a complete 1D fluid-dynamic model of the whole engine and of properly developed correlations capable of quantifying the cycle-to-cycle variation of Indicated mean effective pressure (IMEP) and In-cylinder pressure peak (
pmax). Although the adopted 1D modeling can be considered a simple numerical method, it shows, on one hand, the advantage of a reduced computational effort and, on the other hand, it is enhanced with advanced 0D sub-models to refine the description of in-cylinder processes also including the cyclic dispersion (CCV). The CCV sub-model is capable of reproducing on a physical basis the measured sequence of consecutive pressure traces in each cylinder. In a first step, 1D engine model was validated against the experimental data considering both the overall performance of the engine and the ensemble-average in-cylinder pressure cycles. The CoV correlations of IMEP and
pmax with average combustion parameters were developed by numerical fitting of the outcomes deriving from the post-processing of experimental spark-sweep tests. Then the correlations were validated with the measured data set already adopted for the 1D model validation (
Table 3). Once validated, the combination of the 1D engine model and of the experimental CoV correlations allows the provision of a combustion optimization of the individual engine cylinder. In addition, this numerical methodology provides benefits in terms of engine fuel economy and cyclic dispersion level, as well. A detailed analysis of the employed numerical models, of their potentialities and limitations, are reported in the following sub-sections.
3.1. D Engine Modeling
The geometry of the analyzed engine is fully schematized in GT-Power 1D commercial code, through the combination of 0D and 1D modeling approaches. In particular, the intake and exhaust sub-systems described through a 1D approach to properly reproduce the flow and the pressure waves propagation. The typical flow equations (Navier–Stokes) are solved in each pipe of intake and exhaust manifolds. This means that the solutions of continuity, momentum, enthalpy and energy conservation equations are provided. The conservation equations solved by GT-Power are shown below:
Momentum:
where
ṁ,
m,
V,
p,
ρ,
e, H and u are mass flux, mass, volume, pressure, density, specific internal energy, enthalpy and velocity at boundary, respectively.
A and
As are the flow area and the heat transfer surface area,
Tfluid and
Twall the fluid and wall temperatures,
h the heat transfer coefficient and
D the equivalent diameter.
Cf and
Kp are the friction and pressure loss coefficients, while
dx and
dp represent the discretization length and the pressure differential across
dx.
The in-cylinder processes, including fuel evaporation, air/fuel mixture formation, turbulent combustion, knock and heat transfer are reproduced based on a 0D modeling. Concerning the port fuel injection, it is actuated by a typical “injector object” imposing the air-fuel ratio.
A value equal to 30% of the injected gasoline is assumed to instantaneously evaporate after the injection event, as results from the advised setting of the adopted 1D code. Furthermore, PFI injection is modeled by neglecting the liquid wall film generation along the intake pipes and the spray dynamics. The cylinder head flow permeability is described through the definition of the steady flow coefficients measured at the engine test bench, both in forward and reverse flow conditions. Turbocharger operation is characterized by means of the measured performance maps of compressor and turbine components. The mechanical friction losses of the engine are reproduced by an empirical correlation according to the Chen-Flynn model. Friction correlation includes the variability of the engine speed and on the in-cylinder peak pressure. This correlation is validated through the available experimental data, demonstrating a high accuracy level. The following friction correlation for FMEP (friction mean effective pressure) is employed here:
where
pmax,cyl is the cylinder peak pressure and
vpm the mean piston speed.
As detailed above, the in-cylinder phenomena are simulated by advanced sub-models, implemented into the code under user routines. The combustion event is reproduced by a 0D two zone (burned and unburned gas) sub-model, where the burning rate term is computed through the well-known ‘fractal’ approach. According to the fractal model, the burning rate term is written as:
where
ρu is the unburned gas density,
AL and
AT the area of the laminar and turbulent flame fronts, respectively,
SL the laminar flame speed (LFS) and Σ the wrinkling factor.
It was demonstrated to present a high level of accuracy in describing the turbulent flame front propagation inside the conventional combustion chamber of spark–ignition engines [
25]. As emerged from the fractal theory available in the scientific literature [
26], some relevant turbulence parameters are included into the wrinkling factor (Σ) of the fractal-derived burn rate expression. This requires a proper evaluation of the above mentioned in-cylinder turbulence variables by means of a phenomenological turbulence sub-model. To this aim, the combustion model is coupled to a turbulence one. The latter represents a K-k-T model, which solves three balance equations to furnish the engine cycle evolution of mean flow kinetic energy (K), turbulent kinetic energy (k) and tumble vortex momentum (T) [
27]. In previous authors’ works [
27,
28], the adopted turbulence model was proved to adequately estimate the in-cylinder turbulence parameters at varying the engine speeds and the valve strategies, without a model tuning variation. A kinetically-derived LFS correlation, included within the fractal burning rate, is adopted because of its better prediction capabilities with respect to the experimentally-derived LFS formulations [
29]. LFS correlation is obtained by fitting 1D LFS computations via a chemical kinetic solver and it accounts for the in-cylinder thermodynamic state, equivalence ratio and charge dilution.
Finally, AL is estimated by an automatic procedure implemented into CAD software processing the actual 3D geometry of the engine combustion chamber.
Referring to the cycle-to-cycle variation model, starting from the input data of CoV of the in-cylinder pressure peak (CoV
pmax), representative
faster-than-average and
slower-than-average cycles are computed basing on a proper algorithm. This algorithm, extensively discussed in [
30], derives
faster and
slower burning profiles by the average fractal-predicted burn profile through two stretch factors. The obtained burnt profiles (high, average and low) correspond to three pressure traces. For each in-cylinder pressure cycle, the related maximum value (
pmax) is computed. The developed CCV model automatically modifies the stretch factors until the target levels of p
max for high and low cycles are realized. In this way, the measured CoV
pmax imposed as input data in the model is numerically reproduced. It is worth emphasizing that the adopted CCV model was also demonstrated to be very efficient in terms of computational effort [
30].
Knock occurrence is detected in the model by the auto-ignition (AI) calculation of the unburned air/fuel mixture. AI is computed by using a tabulated approach [
31]. The AI table is obtained by chemical kinetics simulations of auto-ignition, performed in a homogeneous reactor at constant pressure (CP) conditions. In particular, AI table is generated through chemical kinetics simulations carried out by considering the kinetic scheme of Andrae [
32]. The AI time is stored in the corresponding table as a value depending on the in-cylinder thermodynamic condition (pressure and temperature), mixture quality (equivalence ratio), and residual content (internal EGR). Knock occurrence is recognized when the AI Integral exceeds a prescribed threshold level [
31]. Concerning the heat transfer modeling, the in-cylinder heat transfer (gas-to-wall) is described by the modified Hohenberg correlation [
33], while convective, conductive and radiative heat transfer models are considered for the exhaust pipes to improve the prediction of temperature at Turbine Inlet. A standard finite element (FEM) approach, implemented into the 1D code, allows the computation of both piston, cylinder liner and head temperatures by assigning reasonable initial temperature levels. The Hohenberg correlation includes the dependency on pressure and volume of gas and also accounts for the cylinder geometry (bore) and mean piston speed. The overall convection multiplier of the Hohenberg model was selected in order to reach a good experimental/numerical agreement for the in-cylinder pressure cycles at different speed/load points, especially in the expansion phase.
The convective heat transfer coefficients for engine coolants (water and oil) are estimated by proper simulations of coolant circuits and subsequently implemented into the 1D code, assuming a dependency on the engine speed according to an assigned power law [
34]. Cooling boundary conditions (temperatures for oil and water) are imposed in the model according to the levels recommended by the engine manufacturer.
The 0D quasi-dimensional combustion model was tuned by a trial-and-error procedure to achieve the best agreement with the in-cylinder pressure cycles. It should be stated that a unique set of tuning constants was selected for all the tested operating conditions.
3.2. Model Validation
The developed 1D model is utilized to simulate the measured operating points on the engine domain, as reported in
Table 3. Regarding the setup of the model, the experimental values of combustion phasing (MFB
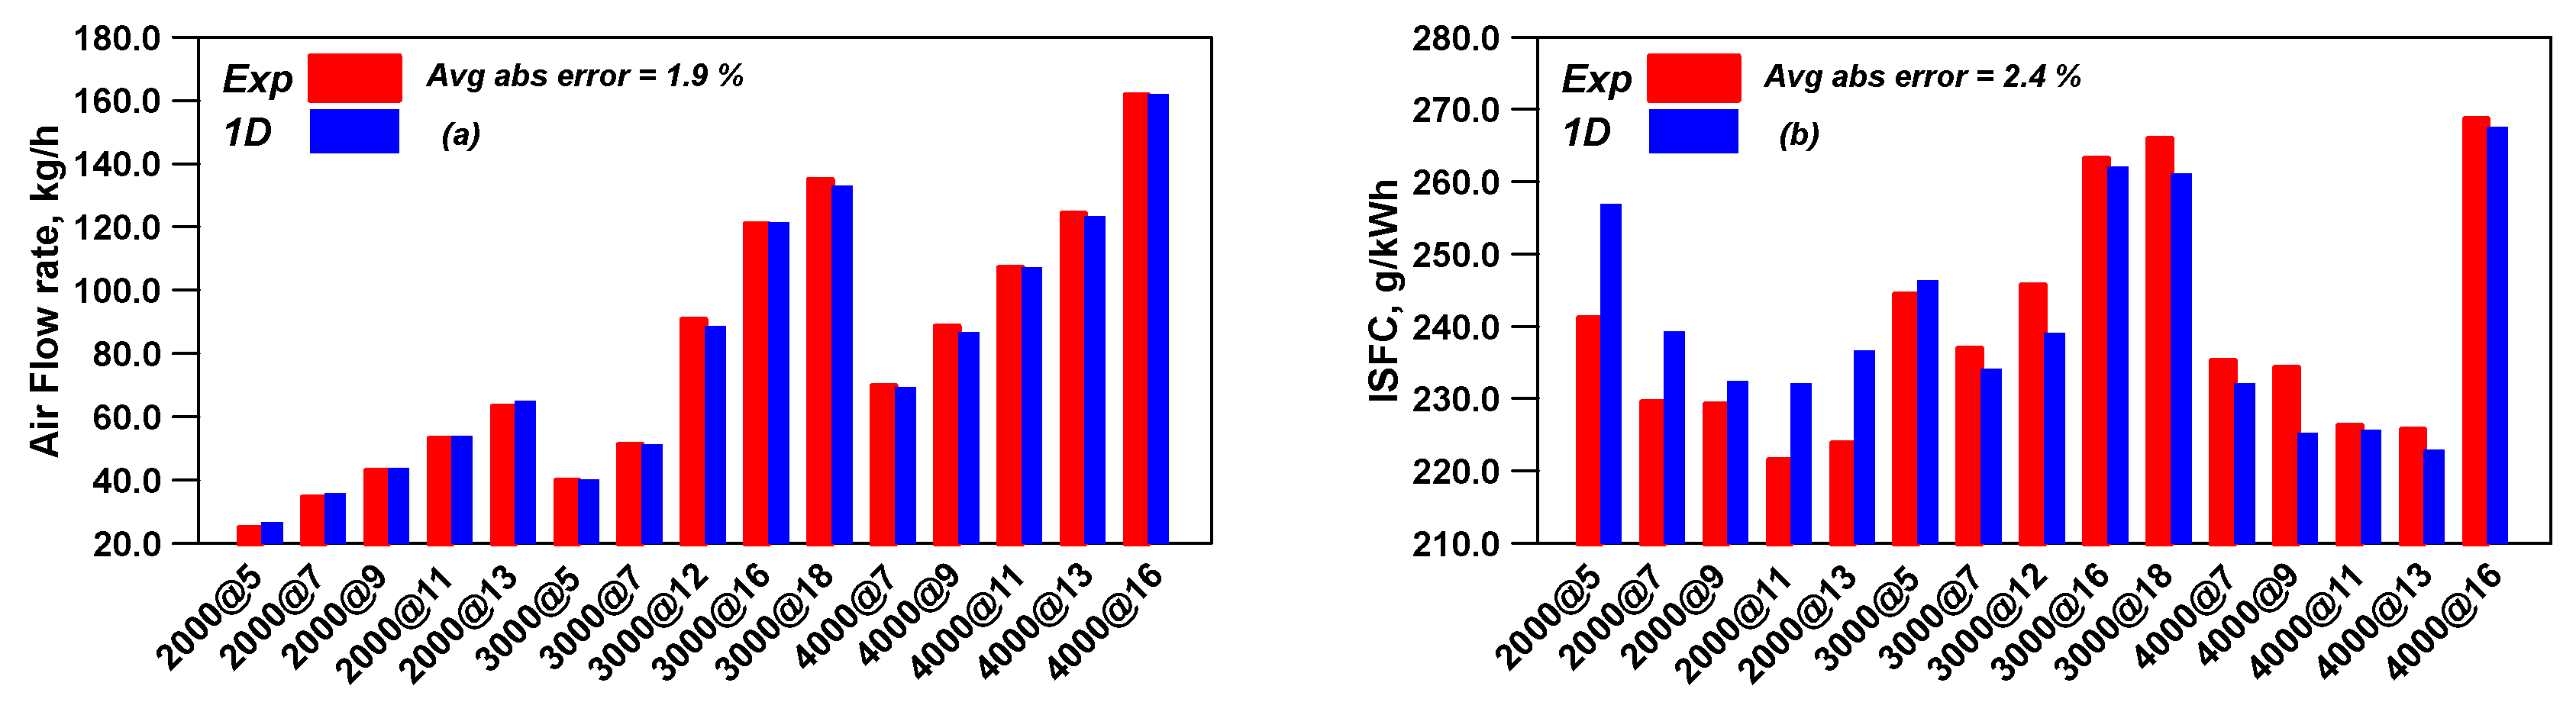
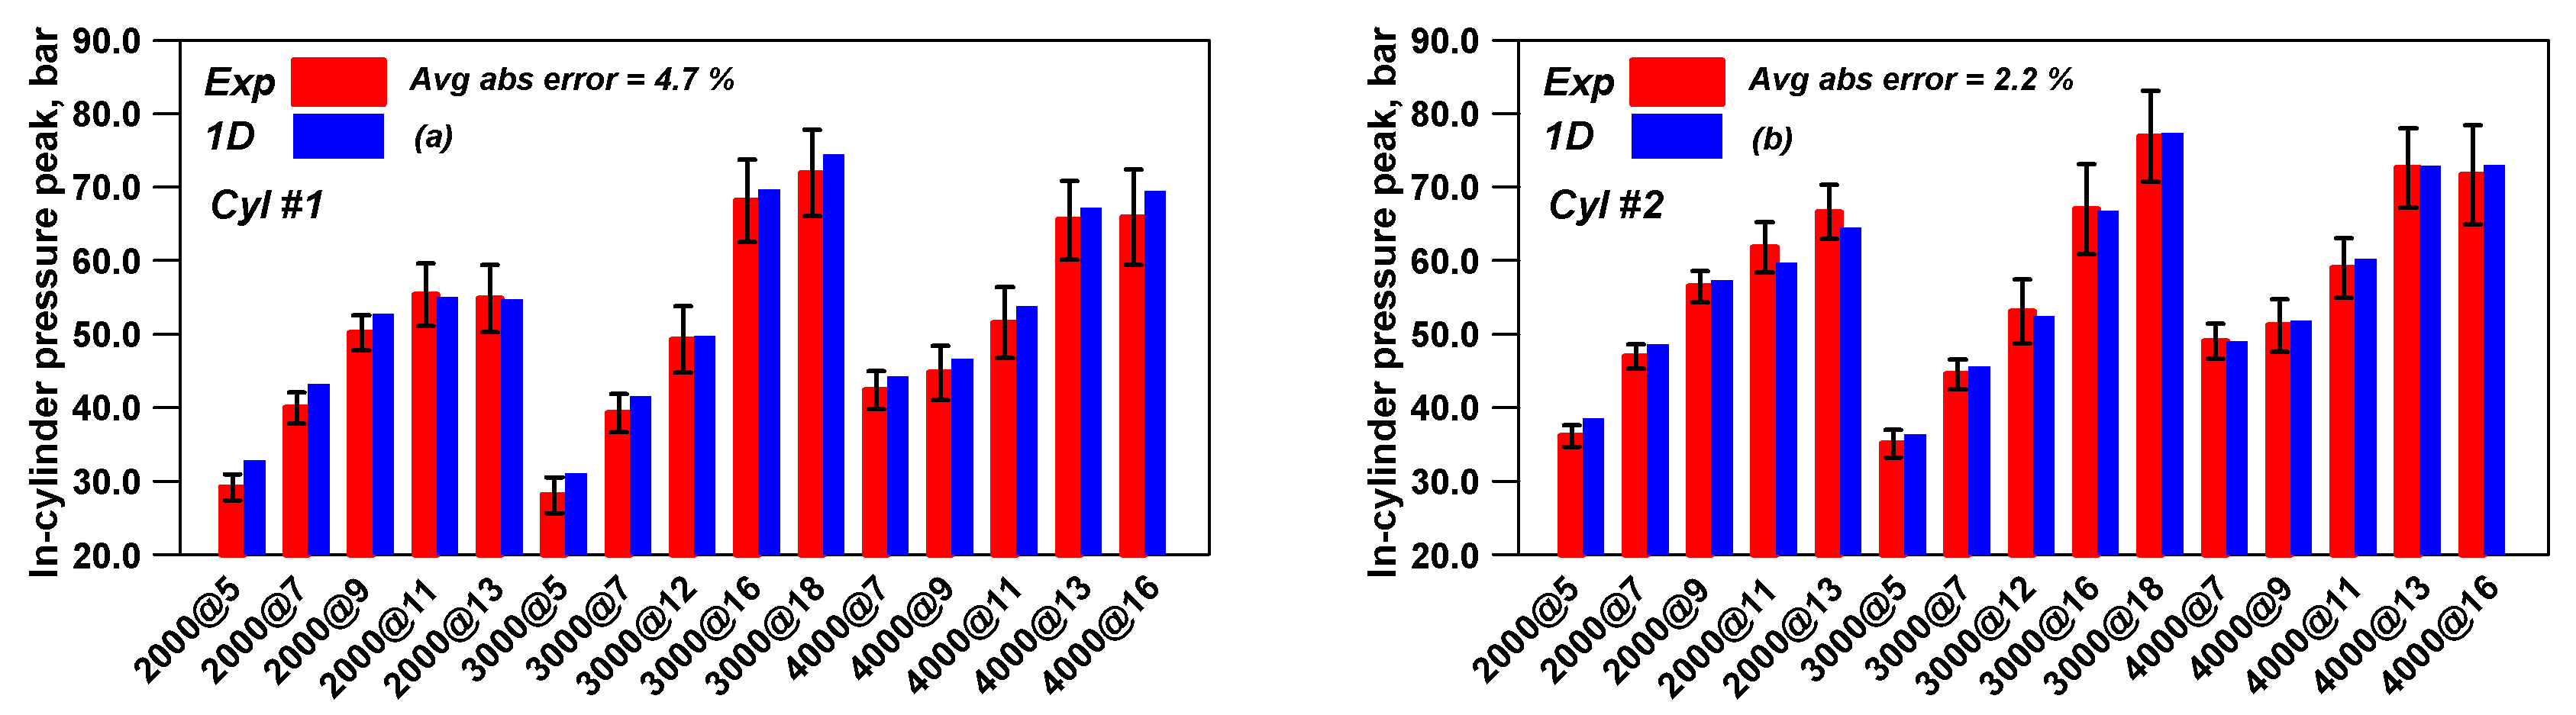
50), air/fuel (A/F) ratio and intake valve strategy (inlet valve closing, IVC) are imposed in the 1D model simulations. In addition, the measured IMEP level is matched by a proportional integral derivative (PID) controller acting on the throttle valve opening at low loads or on the waste-gate valve opening at high loads. EGR valve was not regulated during the simulation and it was fixed to a substantially closed setting since the experimental points to be reproduced were investigated at a null external EGR rate. The model reliability is proved here in terms of overall engine performance variables, combustion characteristics, in-cylinder pressure traces and cycle-to-cycle variation. The numerical/experimental assessments of global performance parameters such as Air flow rate, ISFC, and In-cylinder pressure peak for two cylinders are reported in
Figure 2 and
Figure 3.
The air flow rate (
Figure 2a) is predicted with an acceptable accuracy (average absolute percent error of 1.9%), denoting an adequate schematization of the engine geometry. A good experimental/numerical correlation is also realized for the ISFC (average absolute percent error of 2.4% in
Figure 2b), hence demonstrating the model capability to properly take into account the combined effects of flow, combustion, and in-cylinder heat transfer phenomena.
The numerical in-cylinder pressure peaks of two cylinders are in a satisfactory agreement with the experimental counterparts. Referring to the in-cylinder pressure peak predictions, larger errors arise for Cyl #1 compared to Cyl #2. However, the average absolute percent error for the Cyl #1 case is below the maximum allowable percent level of 5%, which is considered by the authors to preserve a valuable model accuracy.
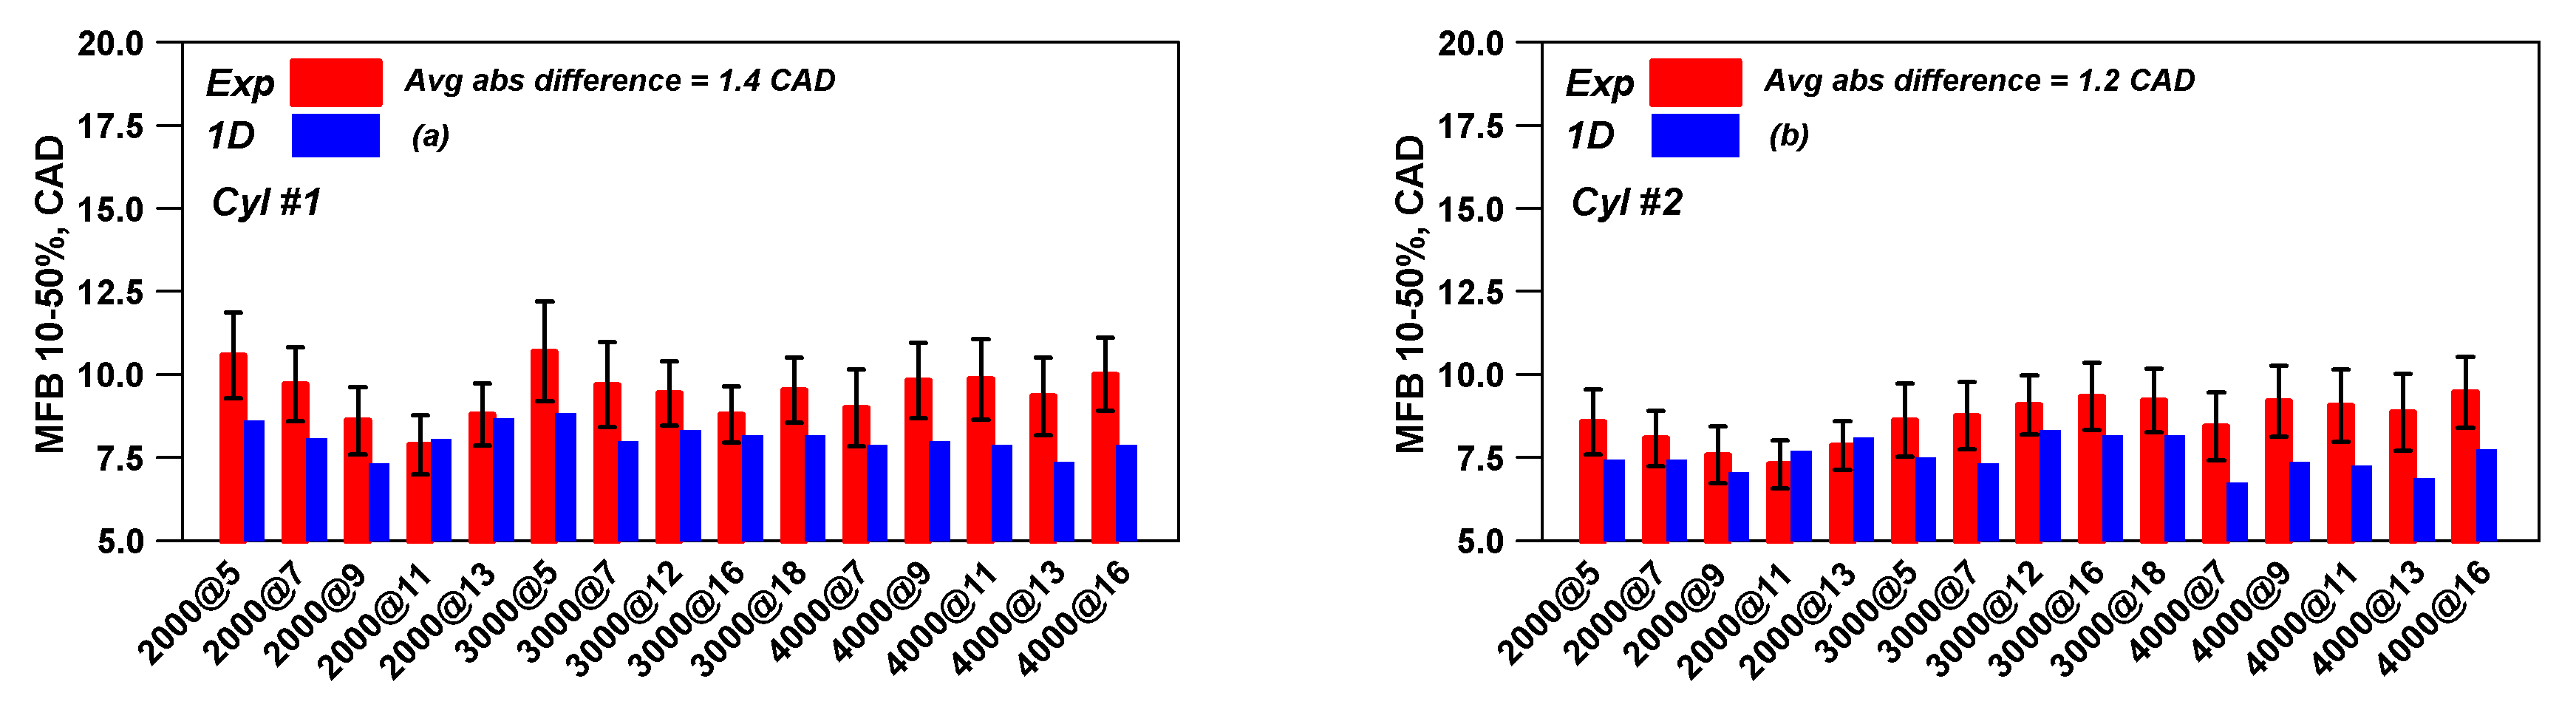
The reliability of the combustion modeling is demonstrated by the outcomes reported in
Figure 4a,b that shows the experimental/numerical assessments of the combustion core duration (MFB
10–50%) for Cyl #1 (
Figure 4a) and Cyl #2 (
Figure 4b). The combustion sub-model correctly reproduces the combustion development for the selected engine operating conditions (speed/load point, A/F ratio), mainly including the effects of IMEP variation on combustion evolution. It is should be highlighted that a reduced error in the reproduction of the combustion durations has to be considered a fundamental pre-requisite to ensure a proper application of the CCV correlations, as discussed in the next section. The predictivity of the combustion model is also proved by the experimental/numerical assessments of in-cylinder pressure traces for two cylinders shown in
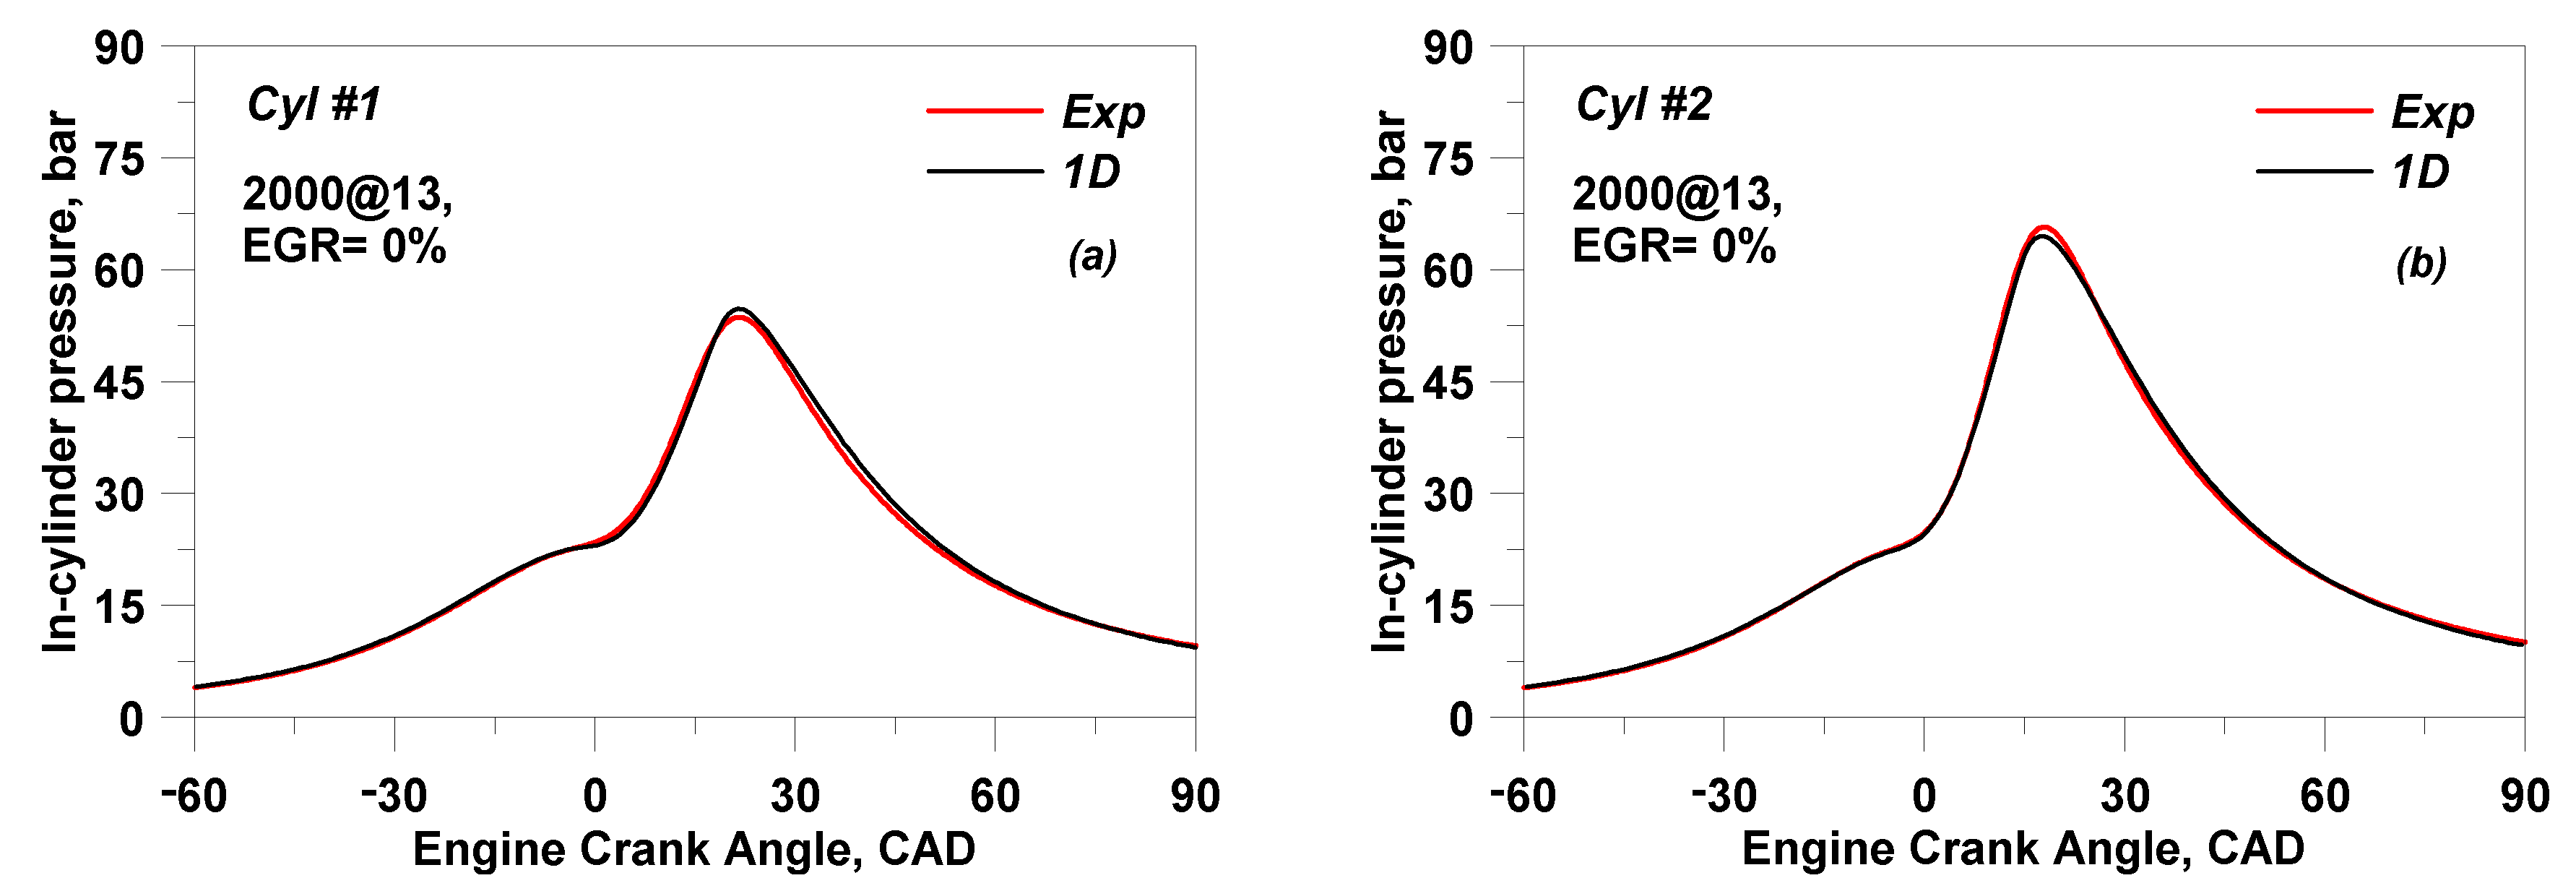
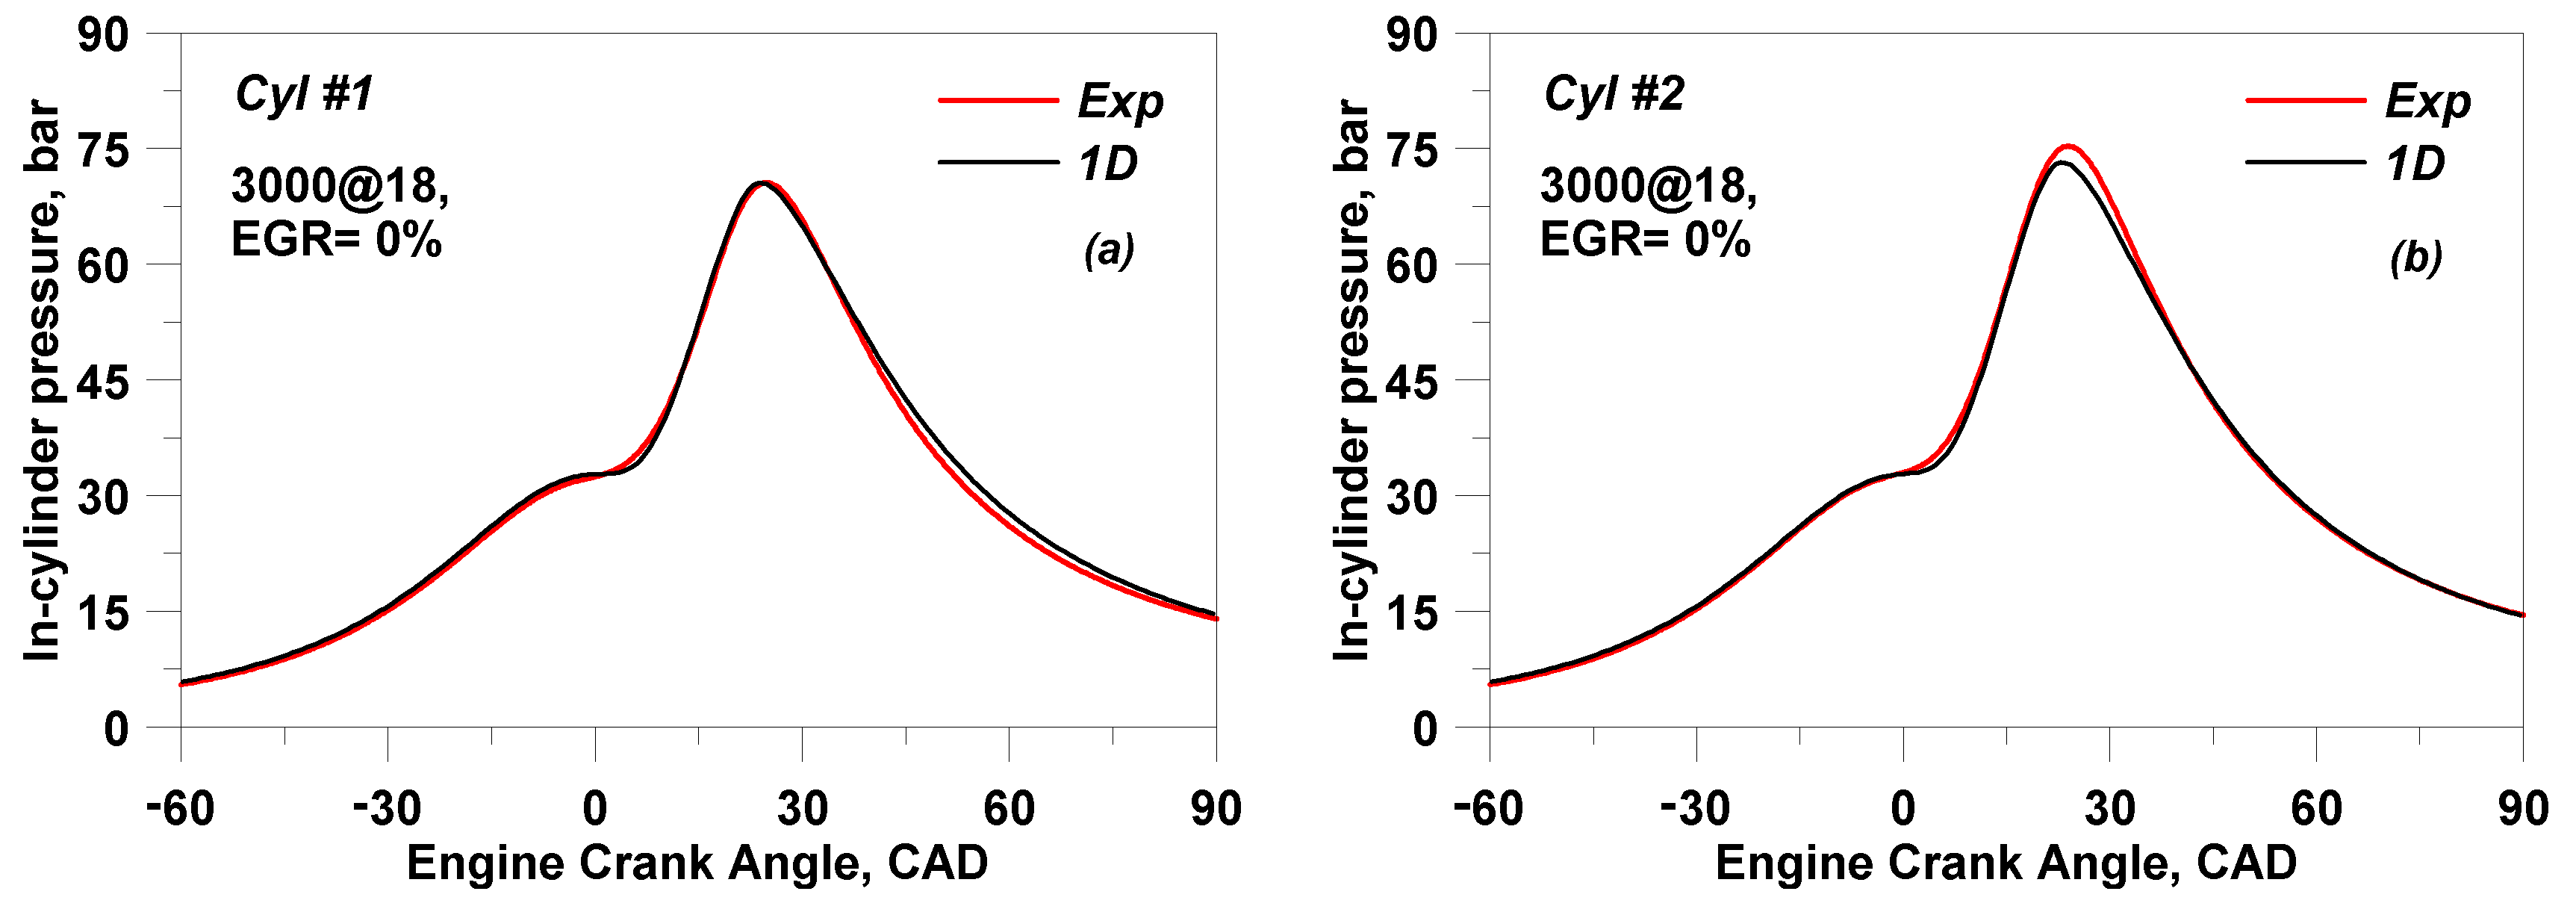
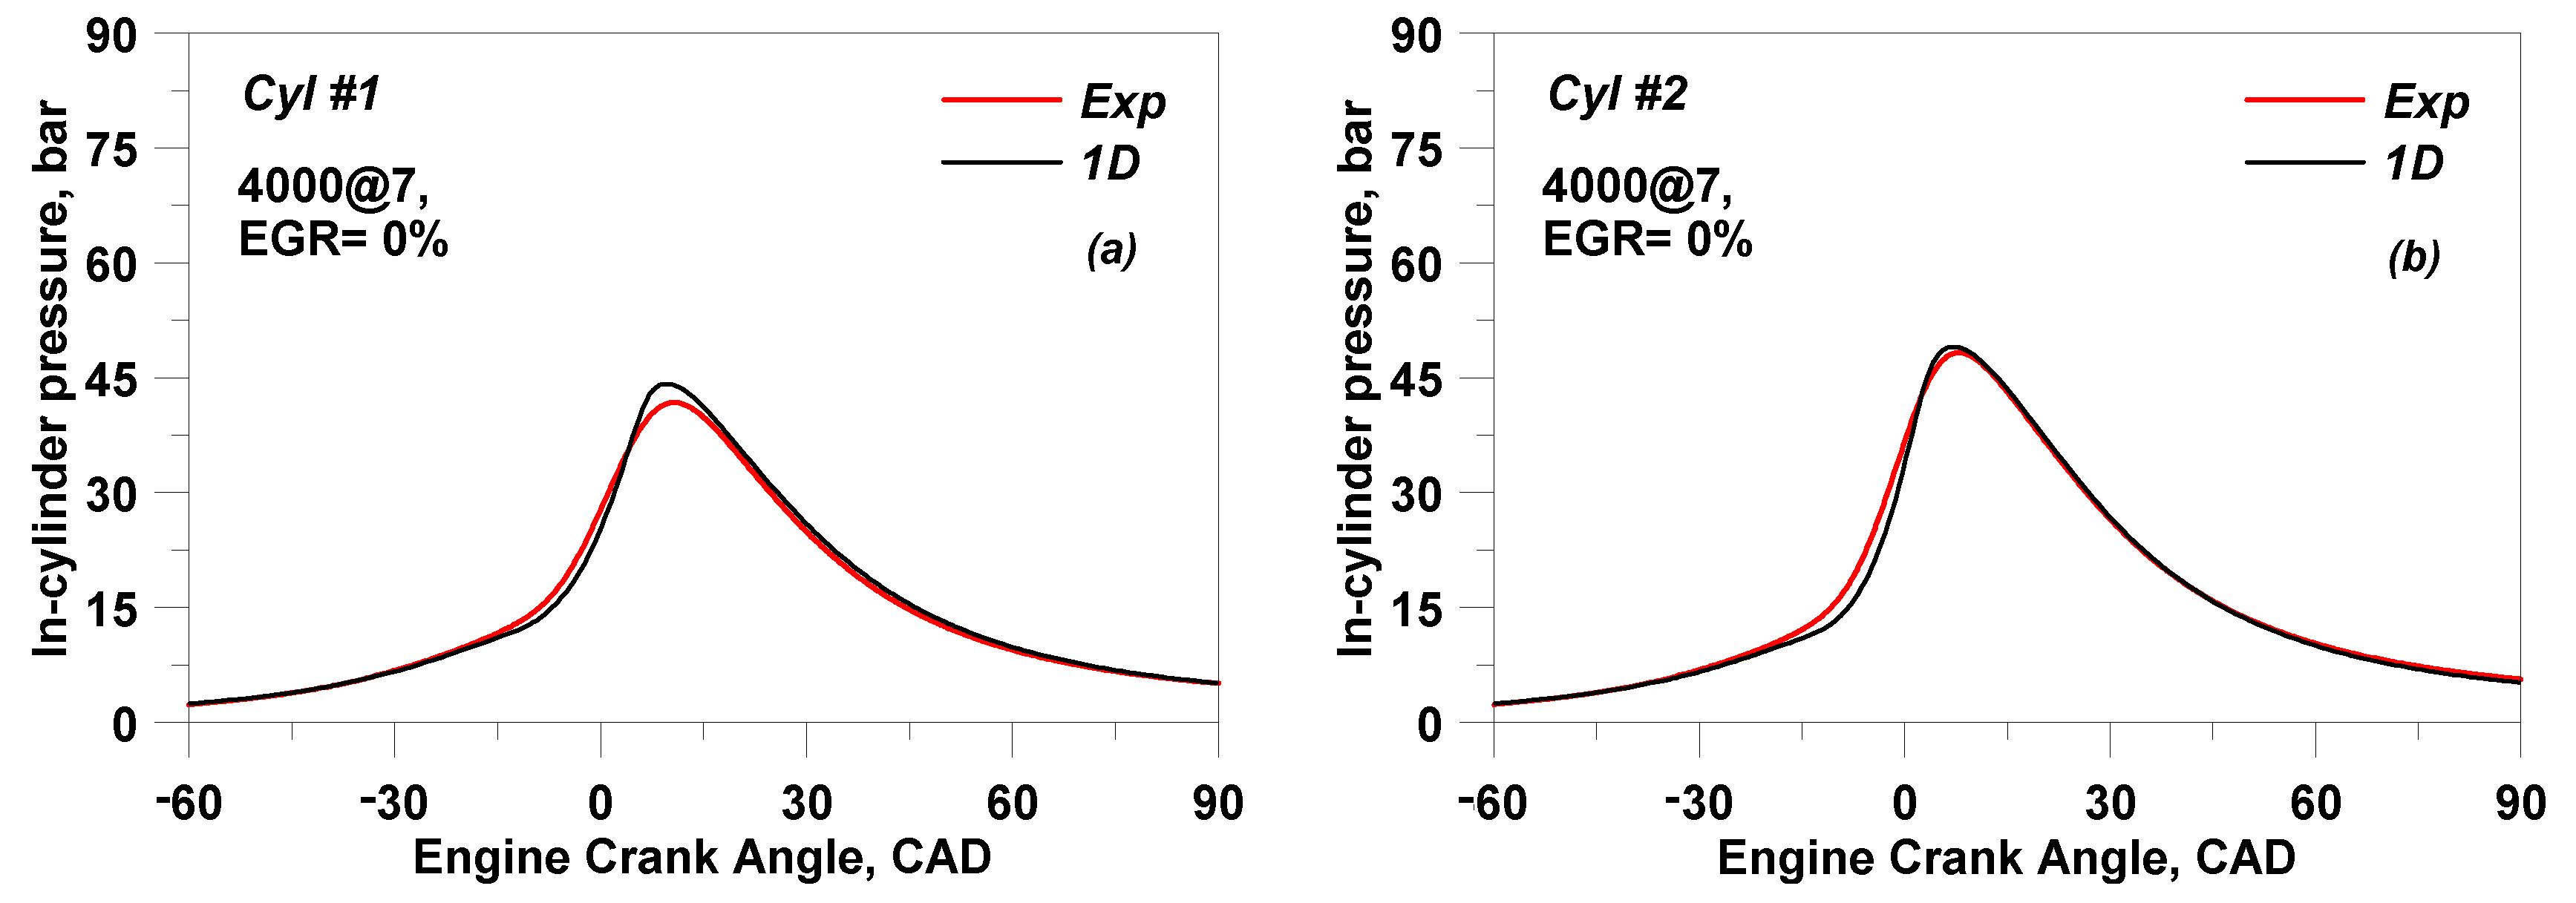
Figure 5,
Figure 6 and
Figure 7. They refer to three different engine speeds and loads, labelled as 2000@13, 3000@18 and 4000@7, without the activation of the external EGR circuit (i.e., e-EGR% = 0%). In the analyzed operating points, some disagreements arise along the expansion phase of pressure cycles for Cyl #1, probably due to minor inaccuracies in forecasting the combustion tail and/or the heat transfer. However, from a global point of view, numerical in-cylinder pressure cycles present a good agreement with the experimental traces. A similar accuracy is detected for the other investigated speed/load points (
Table 3), even if the related plots are not shown here for brevity. In addition, the CCV model is applied to the experimental operating points. To this aim, the experimentally derived coefficient of variation of the in-cylinder peak pressure (CoV
pmax) for two cylinders is imposed in the simulations and the computed cycles (high and low ones), representative of the cycle-to-cycle variation, and these are compared to the measured sequence of 270 consecutive pressure cycles. As an example,
Figure 8 shows the experimental/numerical assessments for pressure cycles in a medium/low load point and medium speed, i.e., 3000@7. The figure demonstrates that the numerical high and low cycles are in a satisfactory agreement with the extreme
faster-than-average and
slower-than-average experimental cycles, respectively. The consistency of the CCV modeling approach is also tested in other speed/load points listed in
Table 3. Although not reported here for brevity, in many cases the shape of numerical high and low cycles is close to the measured ones. Of course, inaccuracies in the computation of the ensemble-average in-cylinder pressure trace may reflect CCV prediction, too. Once validated, the CCV model can be used in a predictive way to reproduce the cycle-to-cycle variation of operating points different from those considered in the validation phase. To this aim, the CCV model requires the CoV equation capable of quantifying the variability on the in-cylinder pressure peak. The latter correlation together with the one of IMEP variability will be extensively discussed in terms of generation and validation in the next paragraph.
3.3. Experimentally-Derived Correlations for Cyclic Dispersion and Validation
In the present section, the experimental CCV is extensively analyzed with main aim to define its relationship with the representative engine combustion variables. For this purpose, it is worth underlining that CCV is usually quantified through the Coefficient of Variation (CoV) of the pressure-related parameters, such as the indicated mean effective pressure (IMEP) and the in-cylinder pressure peak (
pmax). In particular, the first one plays a certain role in the drivability of the engine, while the second one has an influence on the knock occurrence. Based on the available experimental results reported in
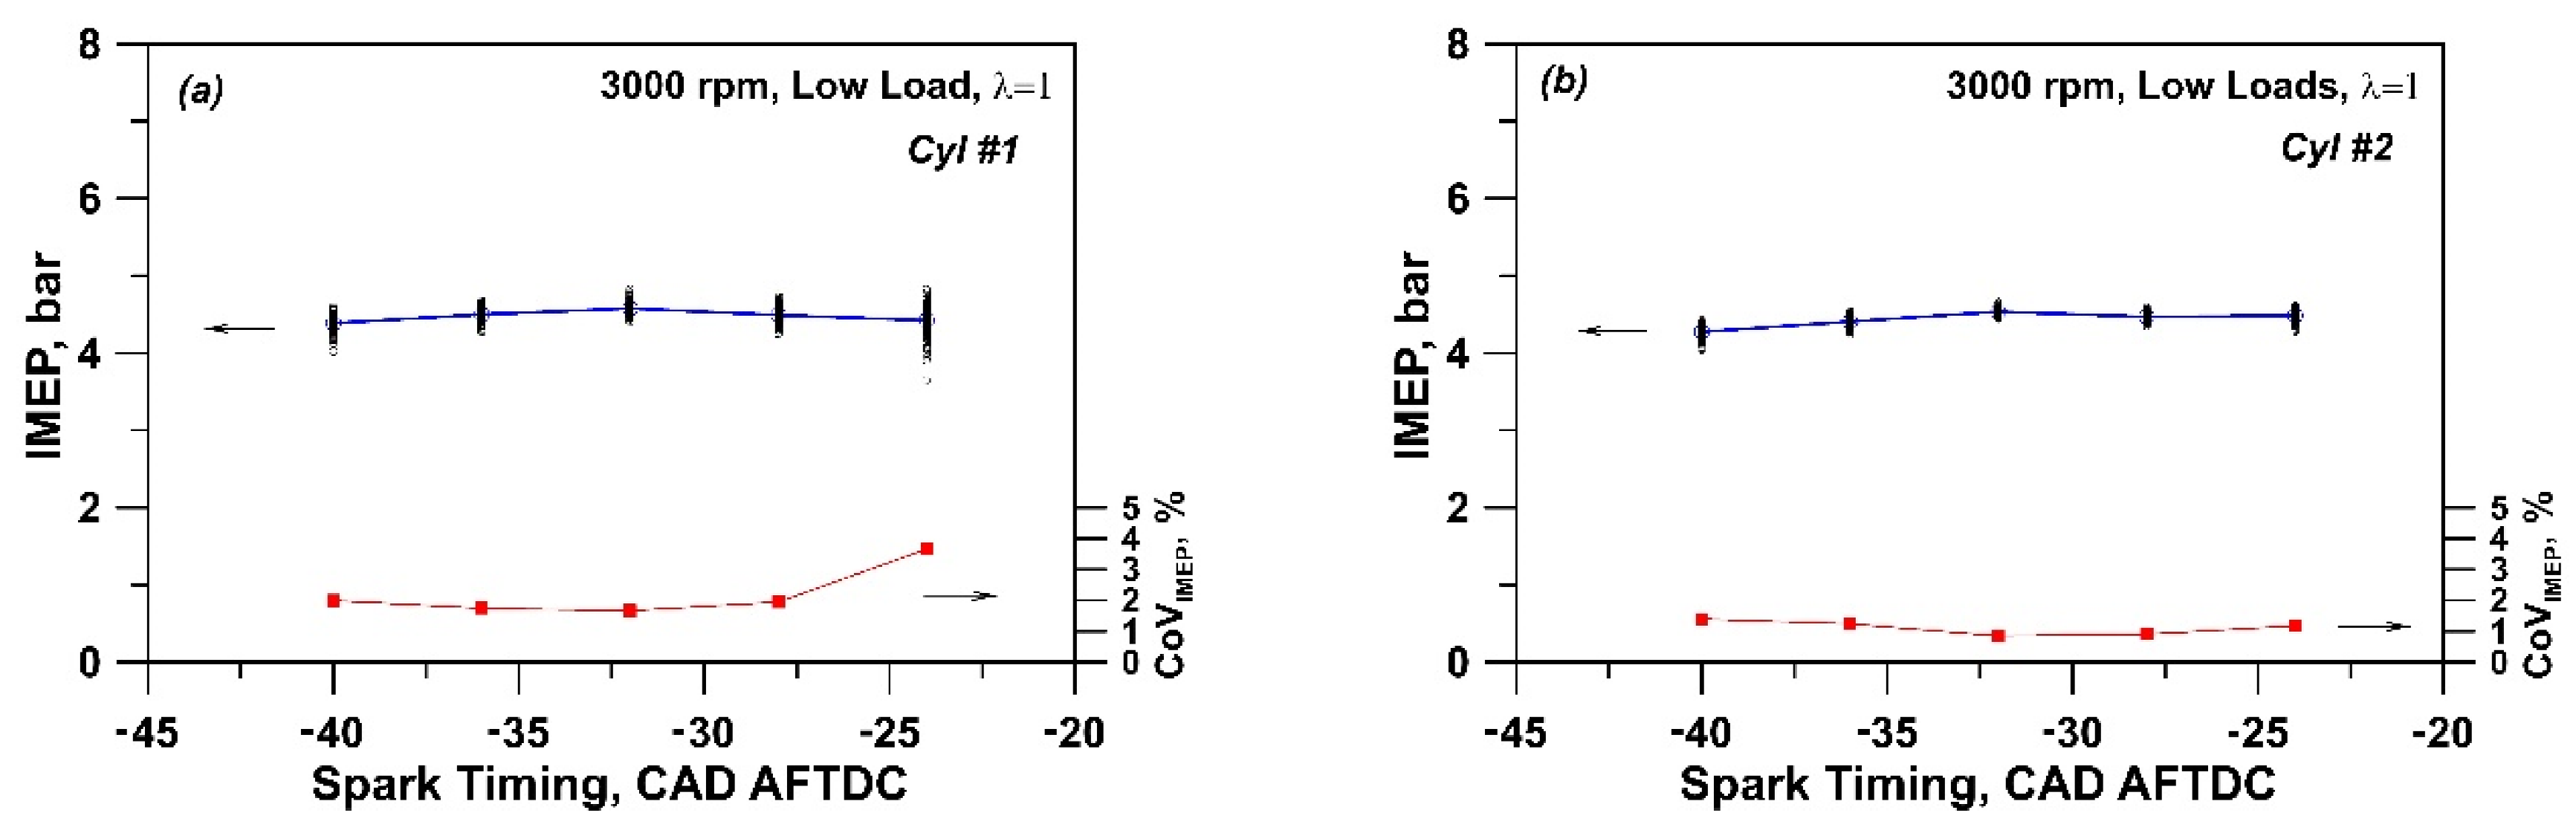
Table 2, the cycle-to-cycle variation was preliminarily analyzed for each engine cylinder at varying spark timing. As an example, the following
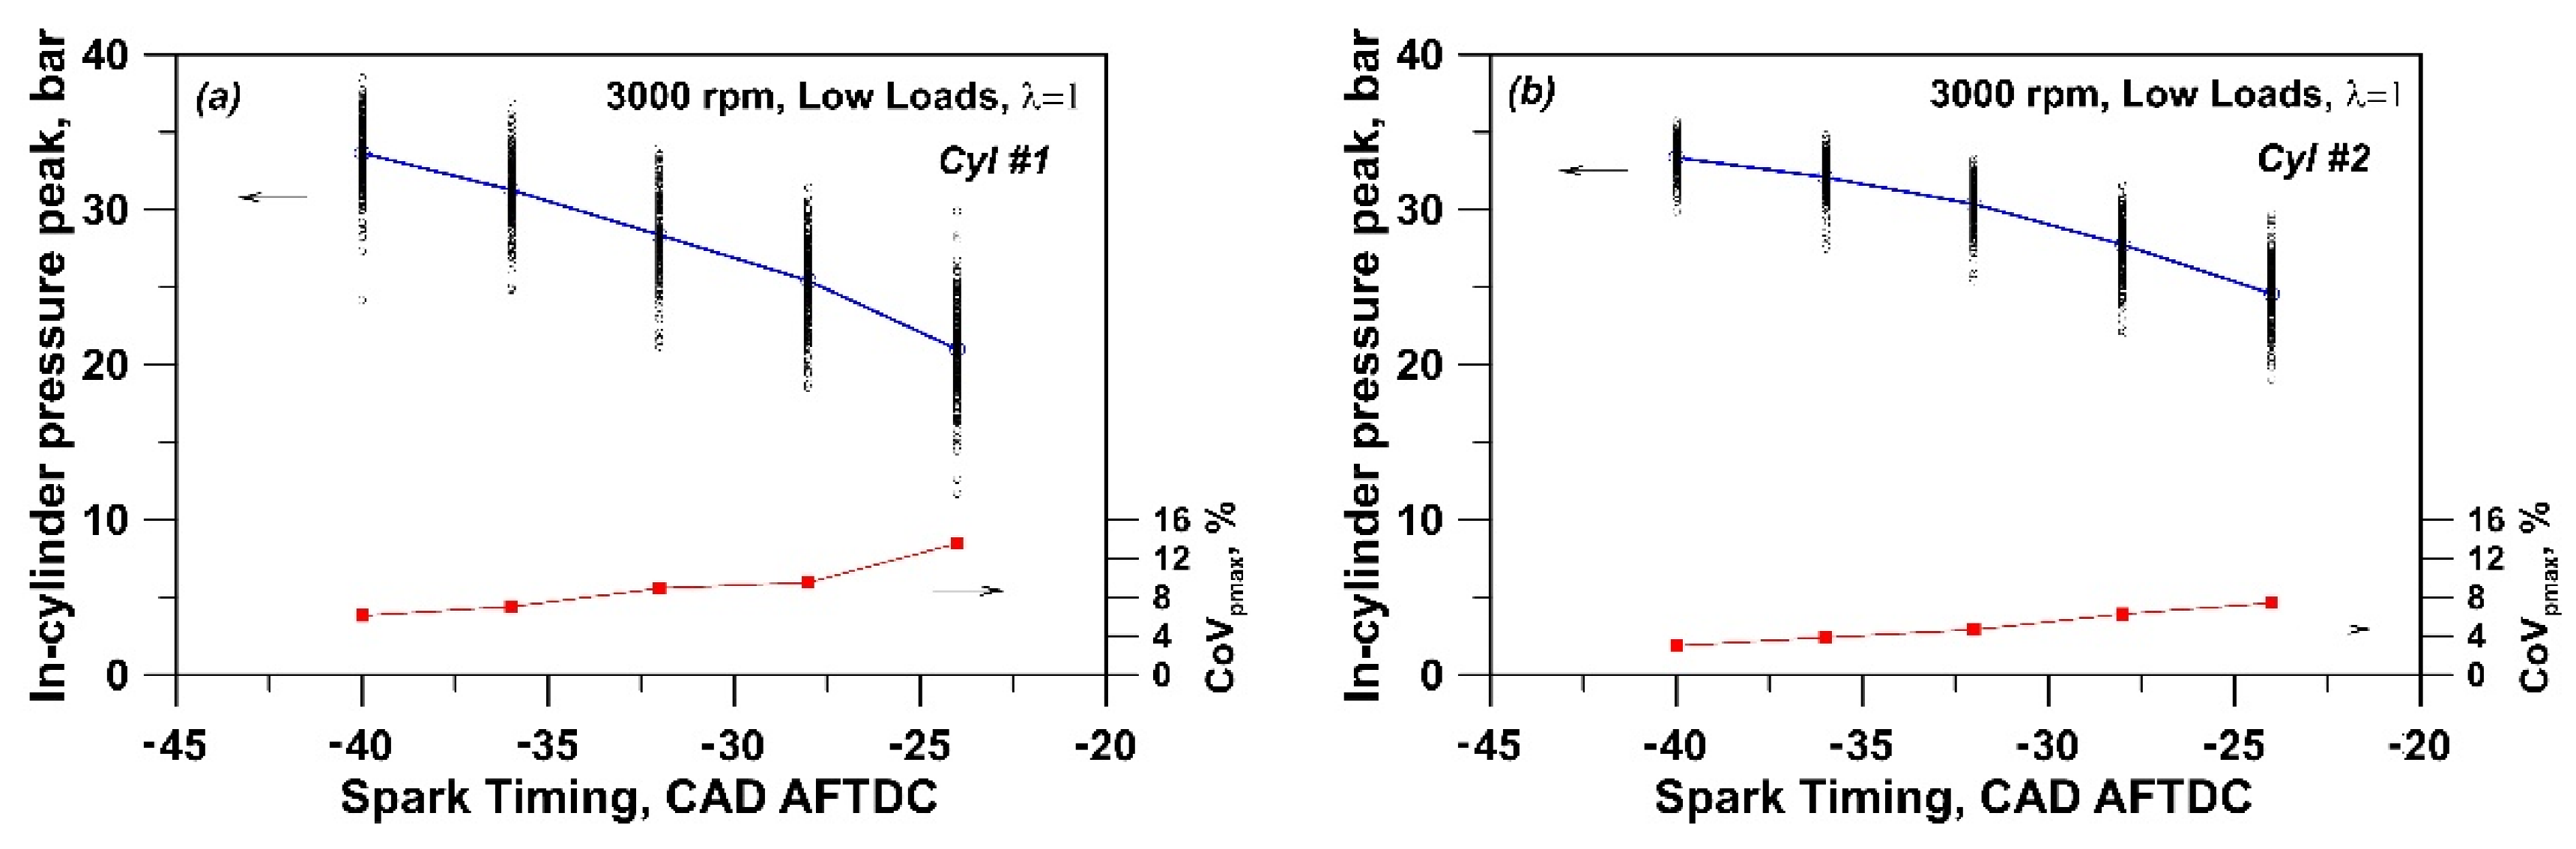
Figure 9a,b and
Figure 10a,b show the spark timing influence on the dispersions of IMEP and
pmax, considering operations at low load and at speed of 3000 rpm. In these figures, the average values of IMEP and
pmax and the related CoVs are reported as continuous lines while the corresponding cycle-derived levels as vertical dots.
As expected, an increasing cycle-to-cycle variation is observed moving the spark timing towards the expansion phase, due to the worsening in the combustion development. For each cylinder, a greater
pmax variation is realized with respect to the IMEP variation. A comparison between the outcomes of two cylinders (
Figure 9 and
Figure 10) highlights that Cyl #2 (rich A/F mixture) shows lower CoV levels than Cyl#1 (lean A/F mixture) when varying the spark timing.
Figure 9 and
Figure 10 also confirm the experimental evidence of higher IMEP and p
max values attained by the richer Cyl #2 if compared to those realized by Cyl #1.
Similar considerations can be applied to the other analyzed points of the spark timing sweep (
Table 2), but the related experimental outcomes are not reported here for sake of brevity. In addition, as already demonstrated in a previous authors’ work [
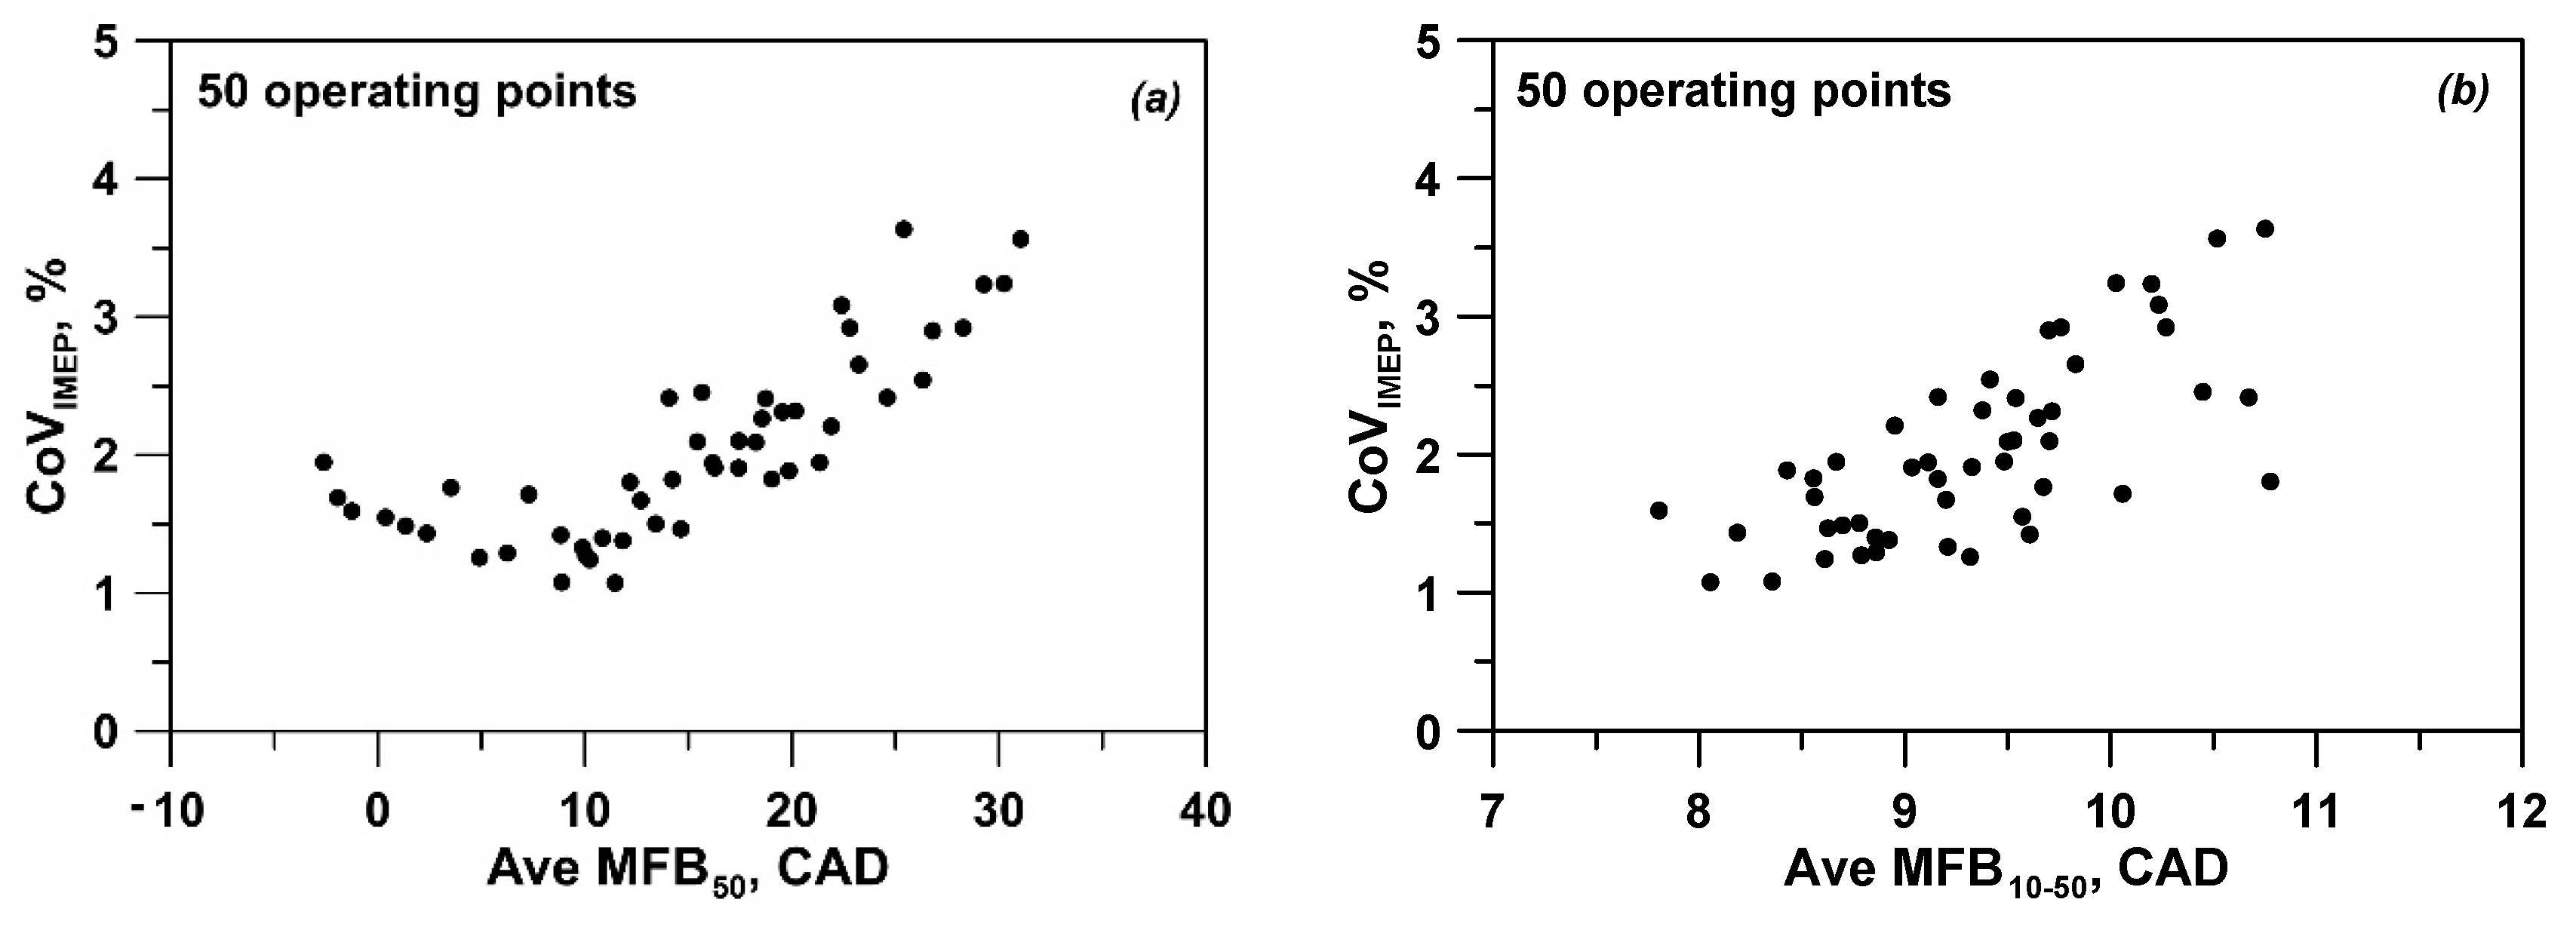
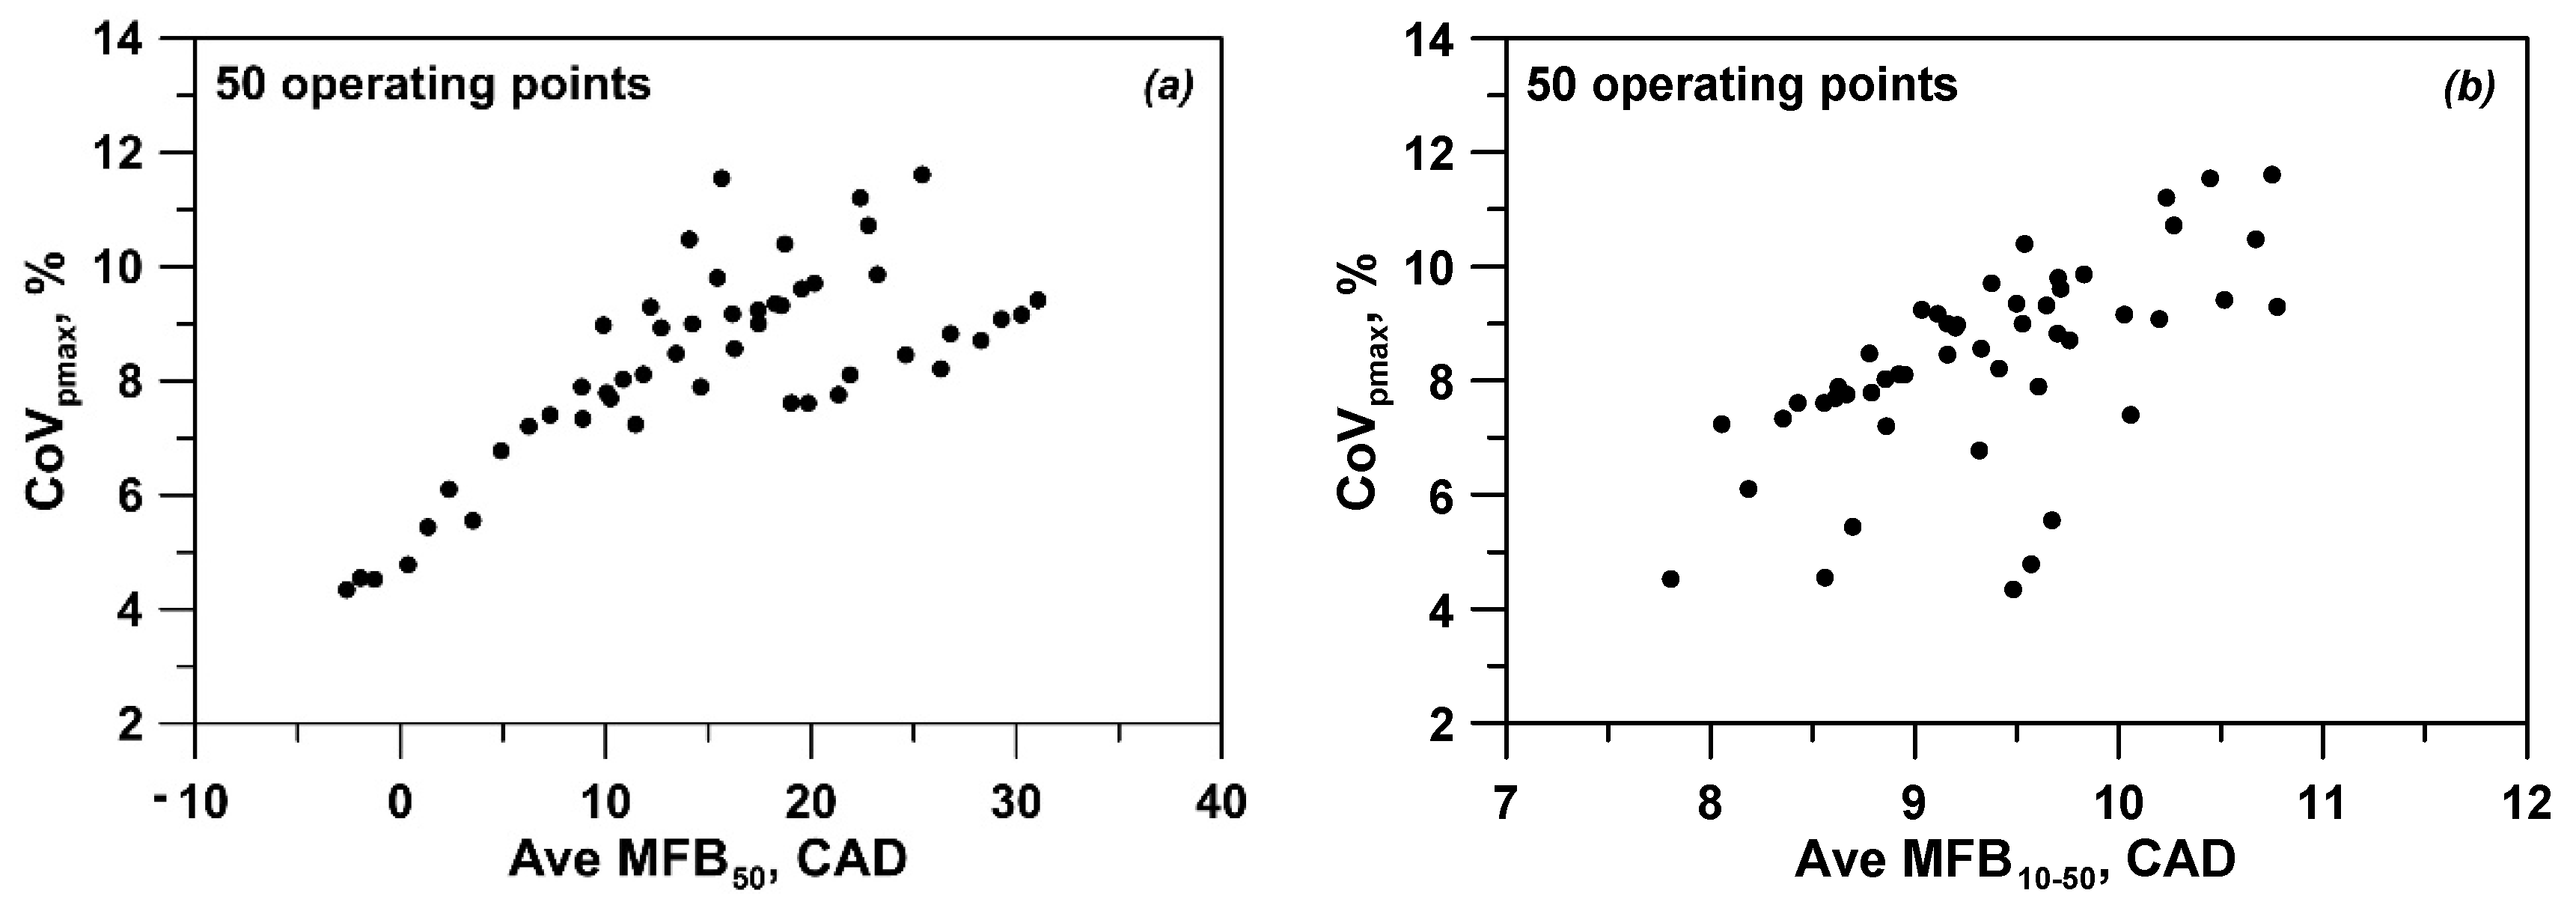
35], the CoV trend does not substantially depend on the engine speed. On the other hand, the cycle-to-cycle variation shows a certain dependency on the combustion-related parameters, i.e., combustion phasing and characteristic duration. In order to optimize the engine’s overall performance, the optimization of each cylinder operation was realized to eliminate the cylinder-to-cylinder non uniformities. In this perspective, the relationship between CCV characteristics and the combustion-related variables is analyzed here by averaging the experimental data of the two engine cylinders. In this way, experimental-derived CCV correlations can be defined and referred to the examined engine. Once validated, engine CCV correlations can be easily employed to forecast the cyclic dispersion under optimized operating conditions for both cylinders. Based on the above considerations, the following
Figure 11 and
Figure 12 show the dependency of the engine CoV
IMEP and CoV
pmax on the averaged combustion parameters, including 50 operating points (
Table 2) and the data measured in all cylinders.
Referring to the CoV
IMEP, higher values for delayed combustions are obtained (
Figure 11a). A minimum level is also detected at a combustion phasing substantially corresponding to the one realizing the MBT condition. CoV
IMEP also shows a clear increasing trend with the combustion core duration MFB
10–50 (
Figure 11b). Concerning the CoV
pmax, it increases with a more delayed combustion process (
Figure 12a), while a certain dispersed trend between
pmax variation and combustion core duration is established in
Figure 12b. However, a longer combustion phenomenon involves a greater CoV
pmax. The discussed experimental data on CCV in
Figure 11 and
Figure 12 were utilized to define proper correlations with averaged combustion parameters through the ‘curve fitting’ module available in the Matlab code. In particular, for the examined engine, two polynomial correlations were identified by linking the CoV levels with the averaged combustion phasing and core duration:
where a
i and b
i represent the constants for the best fit with the experimental outcomes. The proposed correlations (7) and (8) show a good coefficient of determination (
Table 4).
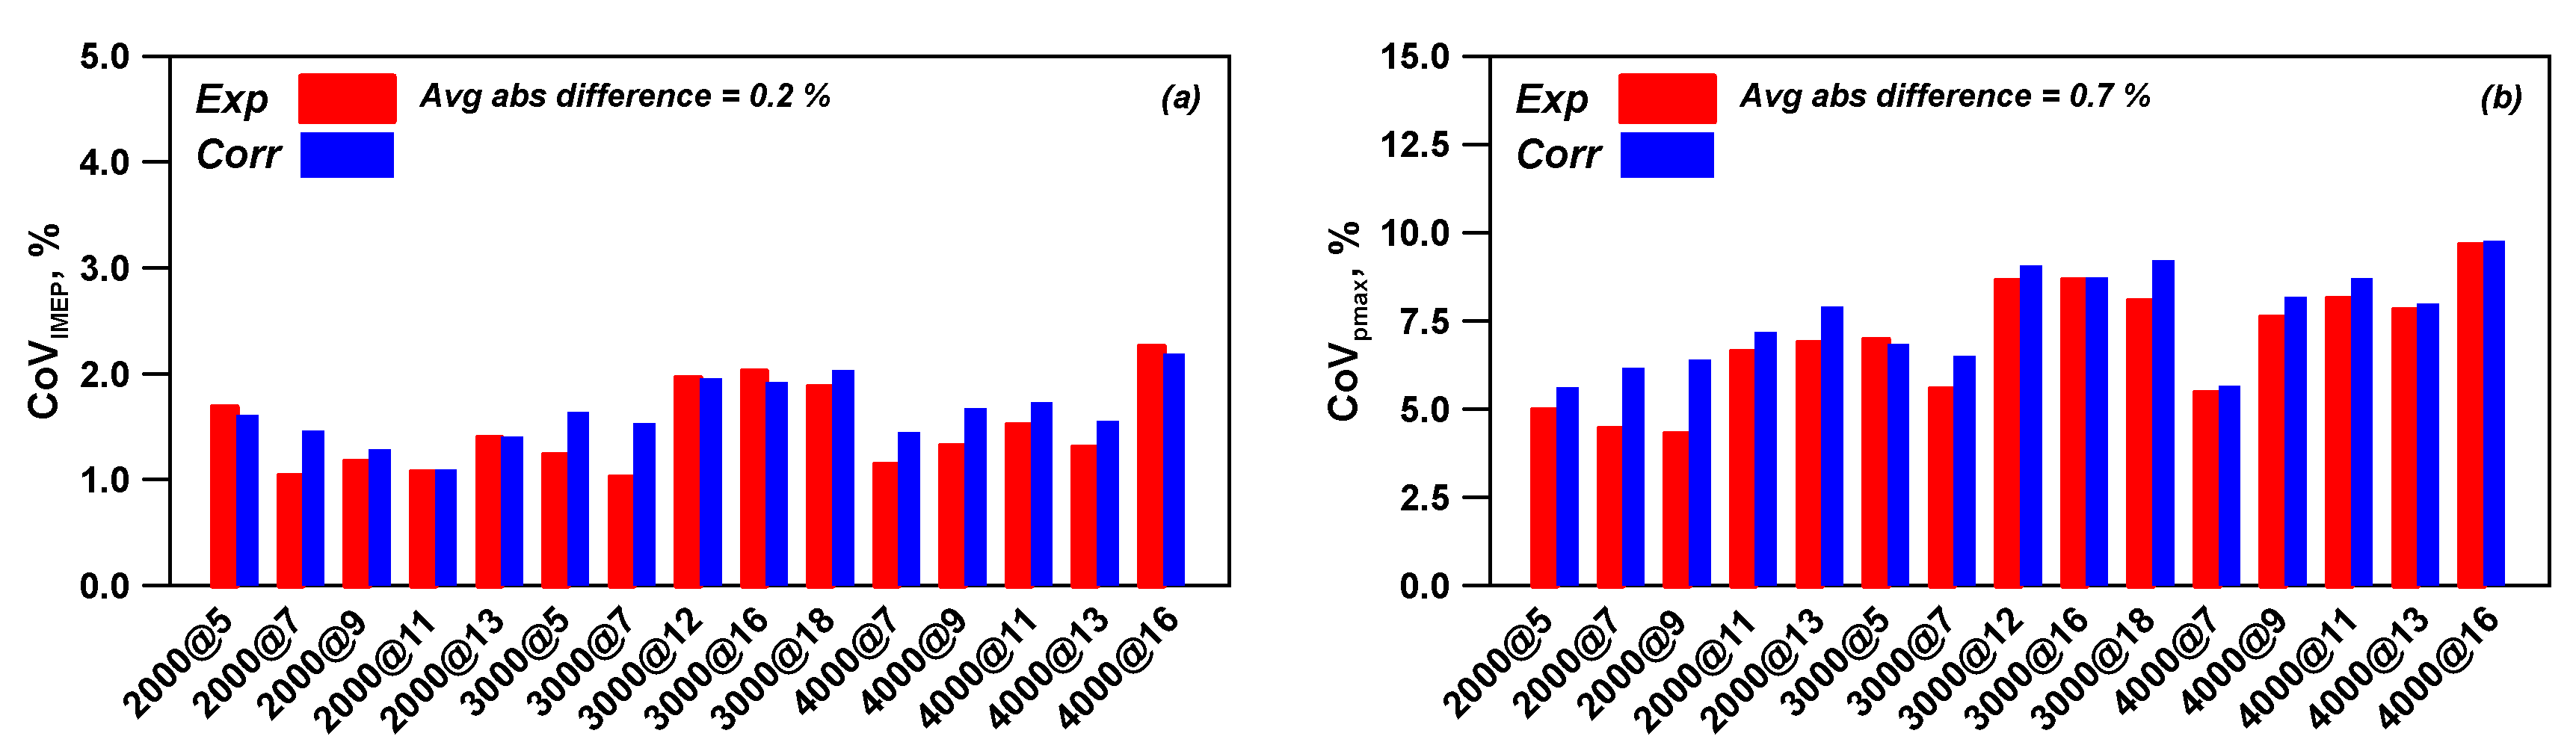
The reliability of the experimental-based CoV correlations (7) and (8) was tested against the measured CoV values. The numerical/experimental comparisons for CoV of IMEP and
pmax are reported in
Figure 13: satisfactory agreements are observed for both correlations changing the speed/load points and at a null external EGR rate. A slightly better prediction is realized for the CoV
IMEP. In agreement with the experimental literature [
35],
Figure 13 confirms that IMEP cyclic dispersion is lower than the corresponding in-cylinder pressure peak cyclic dispersion.
Once validated, the developed CoV correlations were linked to the 1D computed combustion parameters (average cycle) in order to provide a valuable prediction of the cycle-to-cycle variation in the operating conditions not explored during the experimental activity. To this aim, the adoption of refined combustion and turbulence sub-models is mandatory. As extensively discussed in the following section, the main use of the developed correlations will be the prediction of the CCV level in the numerically optimized engine points, where the individual cylinders show the same nominal operation.
4. Numerical Optimization of Combustion: Results and Discussion
As already reported in previous sections, the operating points measured in the entire engine domain (
Table 3) were considered to perform a combustion optimization, assuming the same behavior for each cylinder. This means that the numerical optimization process takes into account the absence of non-uniformities among cylinders, which practically requires only partial modifications to the existing fuel injection system of the original engine. The numerical optimization is performed by employing the validated 1D model and the validated CoV correlations referring to the examined engine. It consists of a virtual engine re-calibration, mainly acting on the fuel injection and on the spark timing. In particular, at each measured point in
Table 3, a stoichiometric A/F ratio is imposed in each cylinder by a refined control of injected gasoline mass. This condition eliminates the experimental cylinder-to-cylinder variation. At low loads, a PID controller acting on the throttle valve opening is used to match the prescribed IMEP while the waste-gate valve is fully opened. At high loads, a PID controller acts on the waste-gate valve opening to match the target IMEP, while the throttle valve is considered fully opened. The spark timing is modified with the aim to identify the MBT condition and in the case of knock occurrence it is automatically delayed to maintain the numerical knock index below a prescribed threshold level. In addition, at low engine speeds a safety margin is applied to the maximum boost pressure to avoid the compressor surge [
36]. At high loads, both the in-cylinder pressure peak and the temperature at turbine inlet are kept below maximum allowable levels to preserve the engine safety. The numerical results obtained by the model-related optimization (labelled as ‘Opt’) are compared to the model prediction based on the standard ECU calibration (labelled as ‘Base’). The above comparisons are realized with the aim to highlight the potential benefits arising from the optimal operation of the engine cylinders. These numerical-derived advantages are here presented in terms of combustion phasing (MFB
50) and core duration (MFB
10–50), ISFC, and cyclic dispersion levels (CoV
IMEP and CoV
pmax). The following
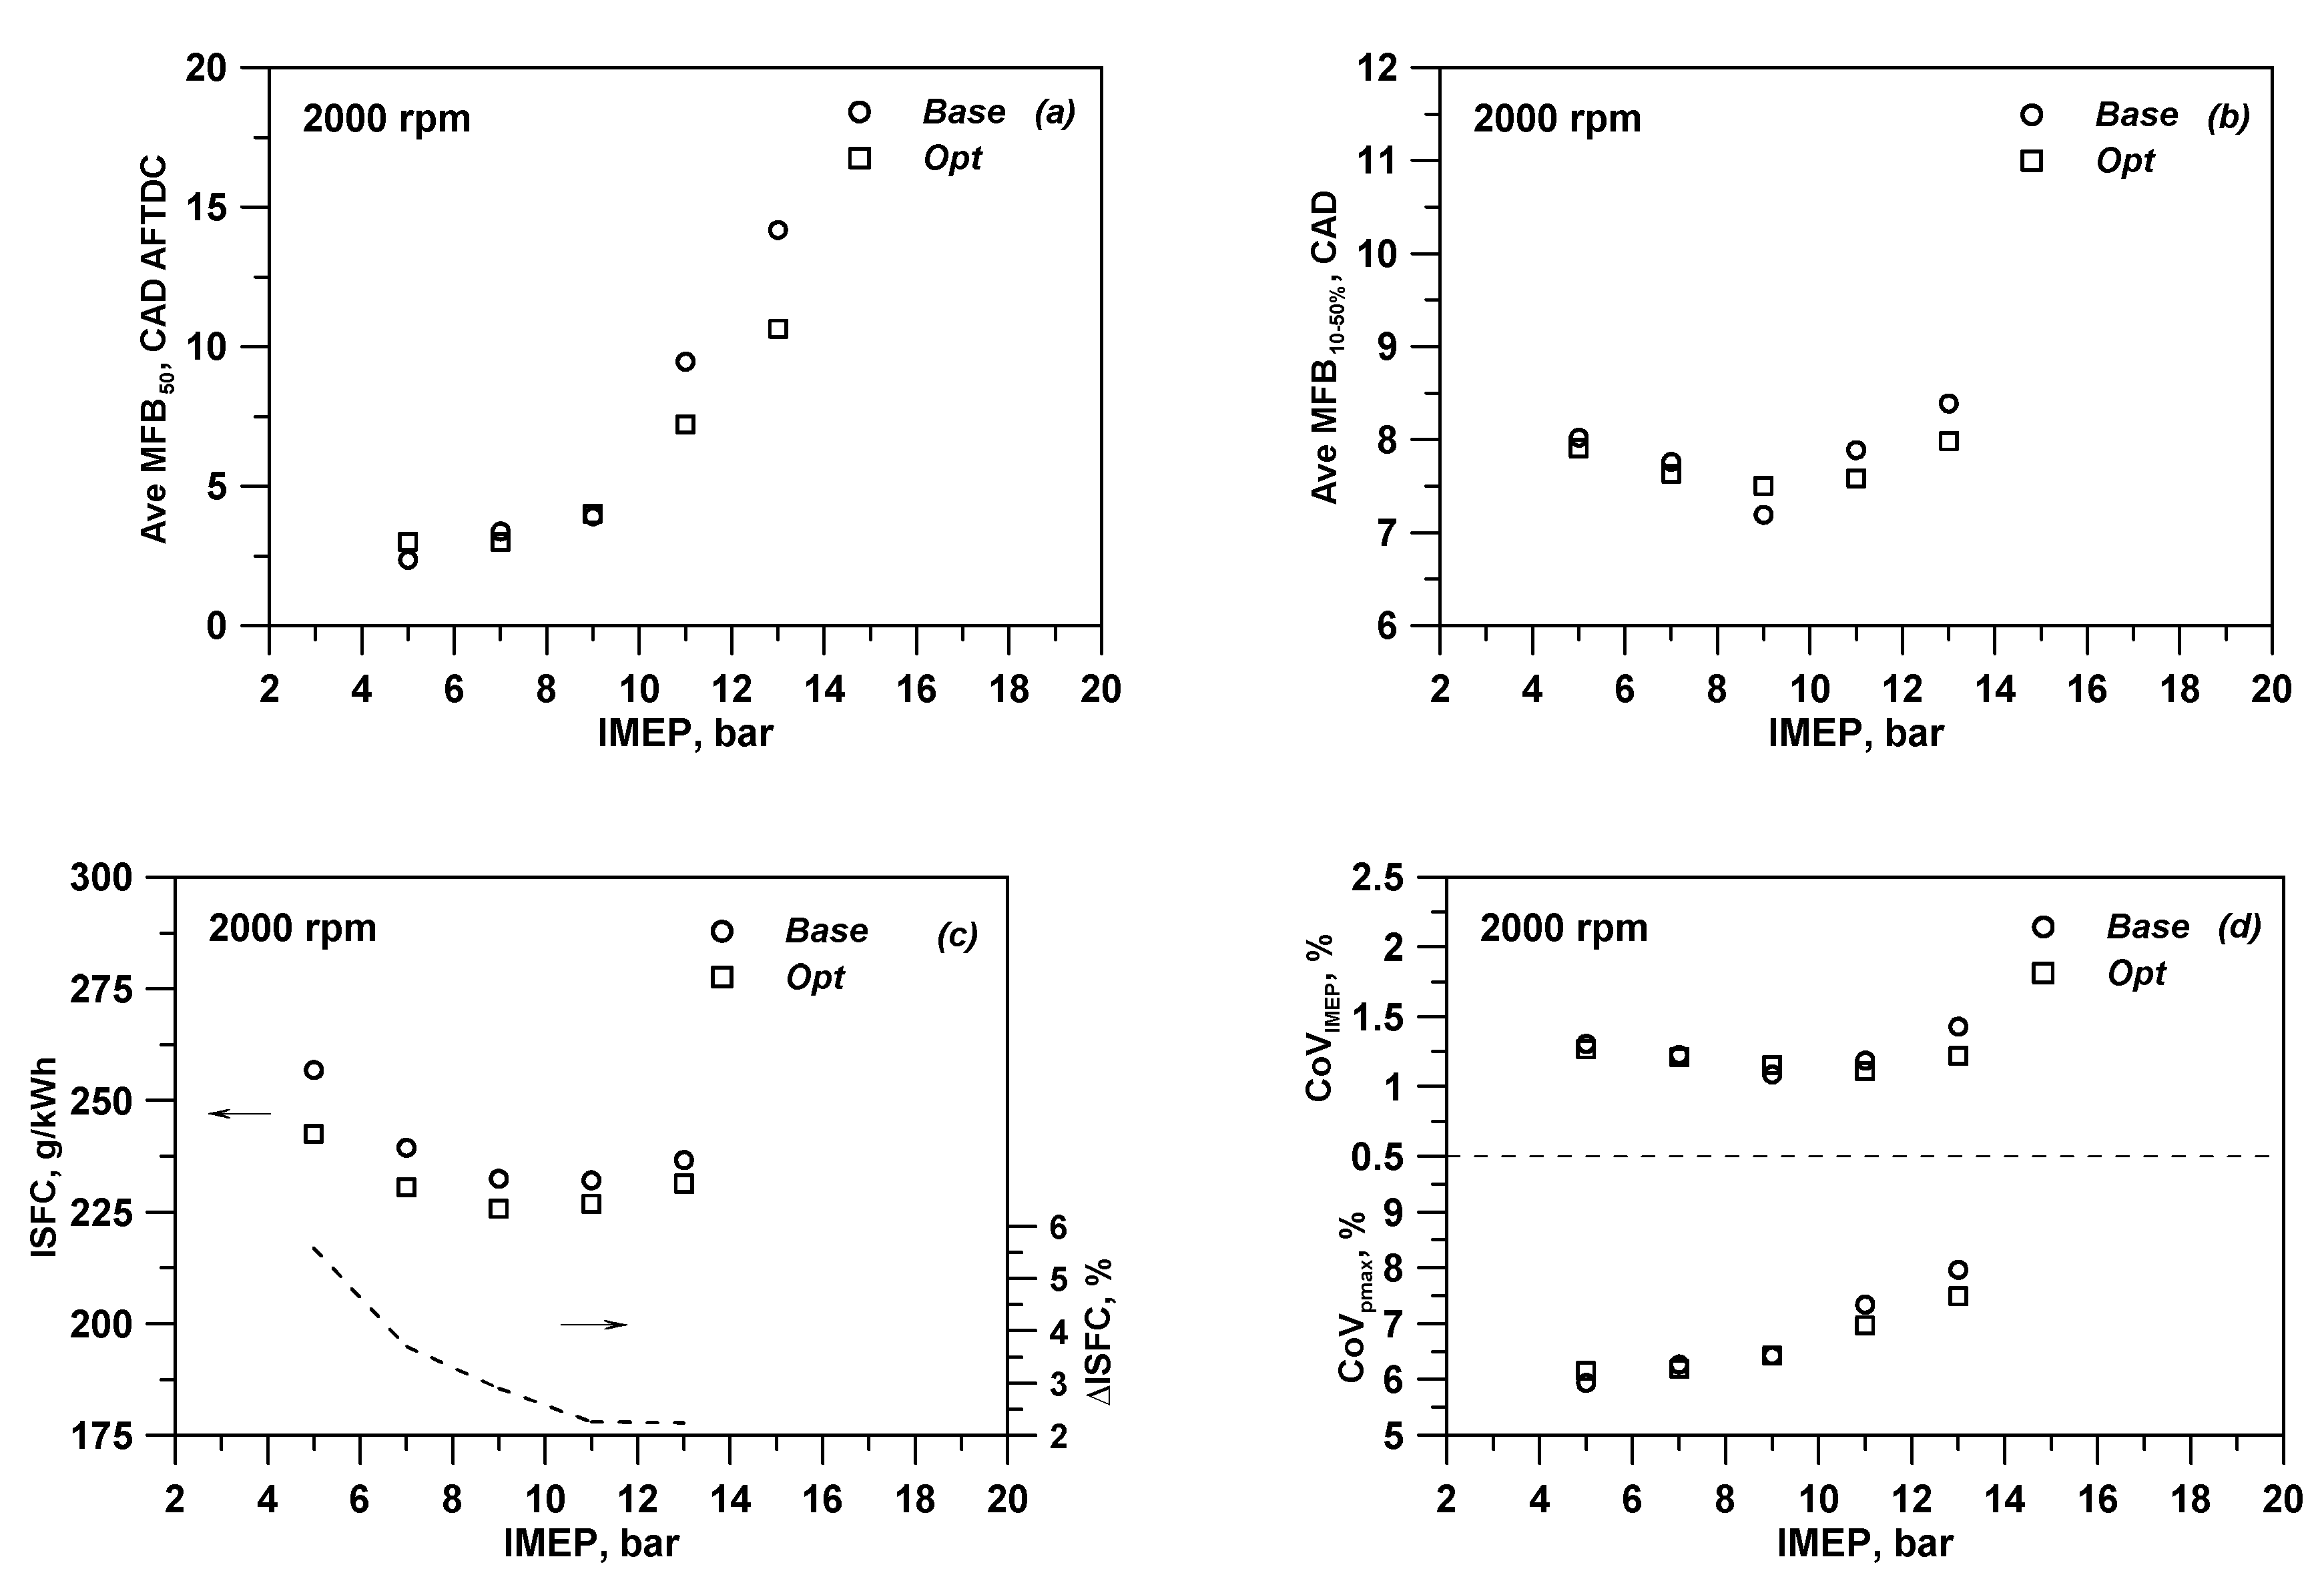
Figure 14,
Figure 15 and
Figure 16 show the comparison of ‘Base’ and ‘Opt’ numerical solutions for three different engine speeds (2000, 3000 and 4000 rpm) and at various IMEP values. For the knock-free part load points at 2000 rpm (below 9 bar IMEP), the model does not substantially improve the combustion process with respect to the Base combustion parameters (
Figure 14a,b). The latter are taken as the average of combustion variables between the two cylinders. The ISFC improvements at low loads (
Figure 14c) are exclusively to be attributed to the suppression of the A/F ratio unbalance between cylinders and a maximum percent gain of 5.6% at 2000@5 is reached. Conversely, at higher loads under knock-limited operation (2000@11 and 2000@13), a combustion phasing advance is realized (
Figure 14a), allowing a shortening of combustion core duration (
Figure 14b). ISFC benefits at high loads (2.2% for both 2000@11 and 2000@13 in
Figure 14c) have to be ascribed to an improved combustion process under in-cylinder stoichiometric mixture conditions. Obviously, the combustion optimization at high load also reflects on the reduction of CoV levels (
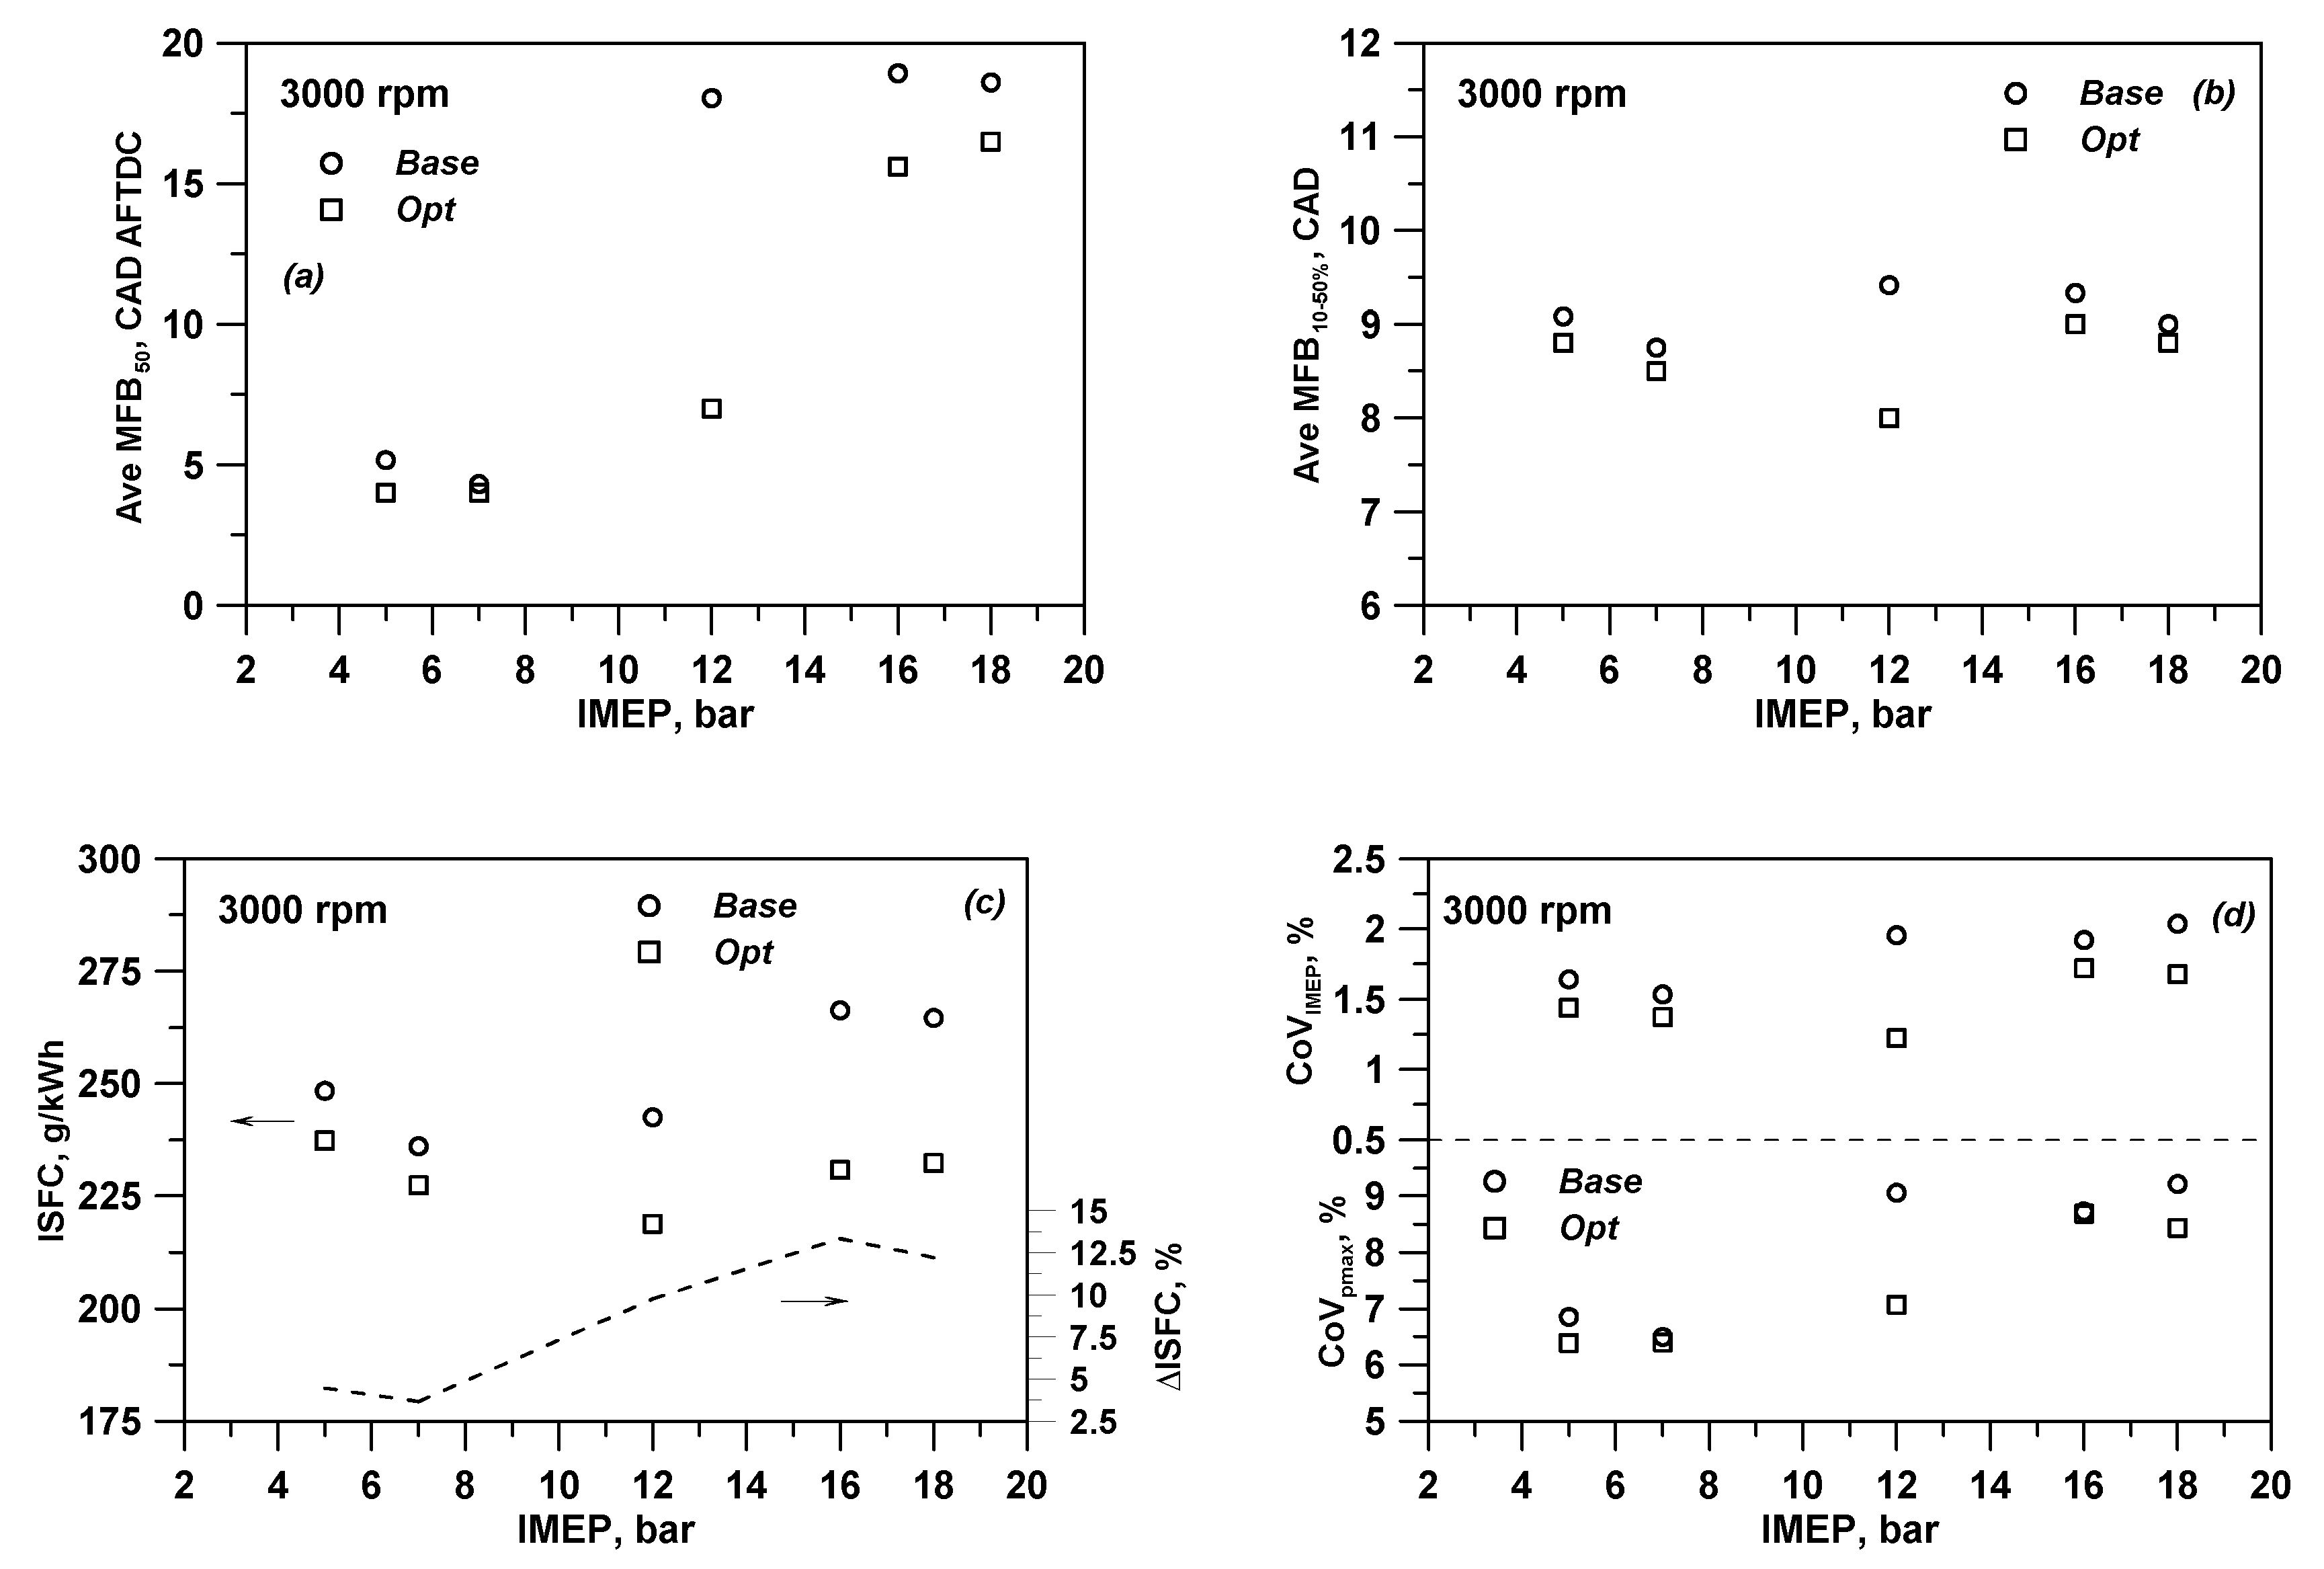
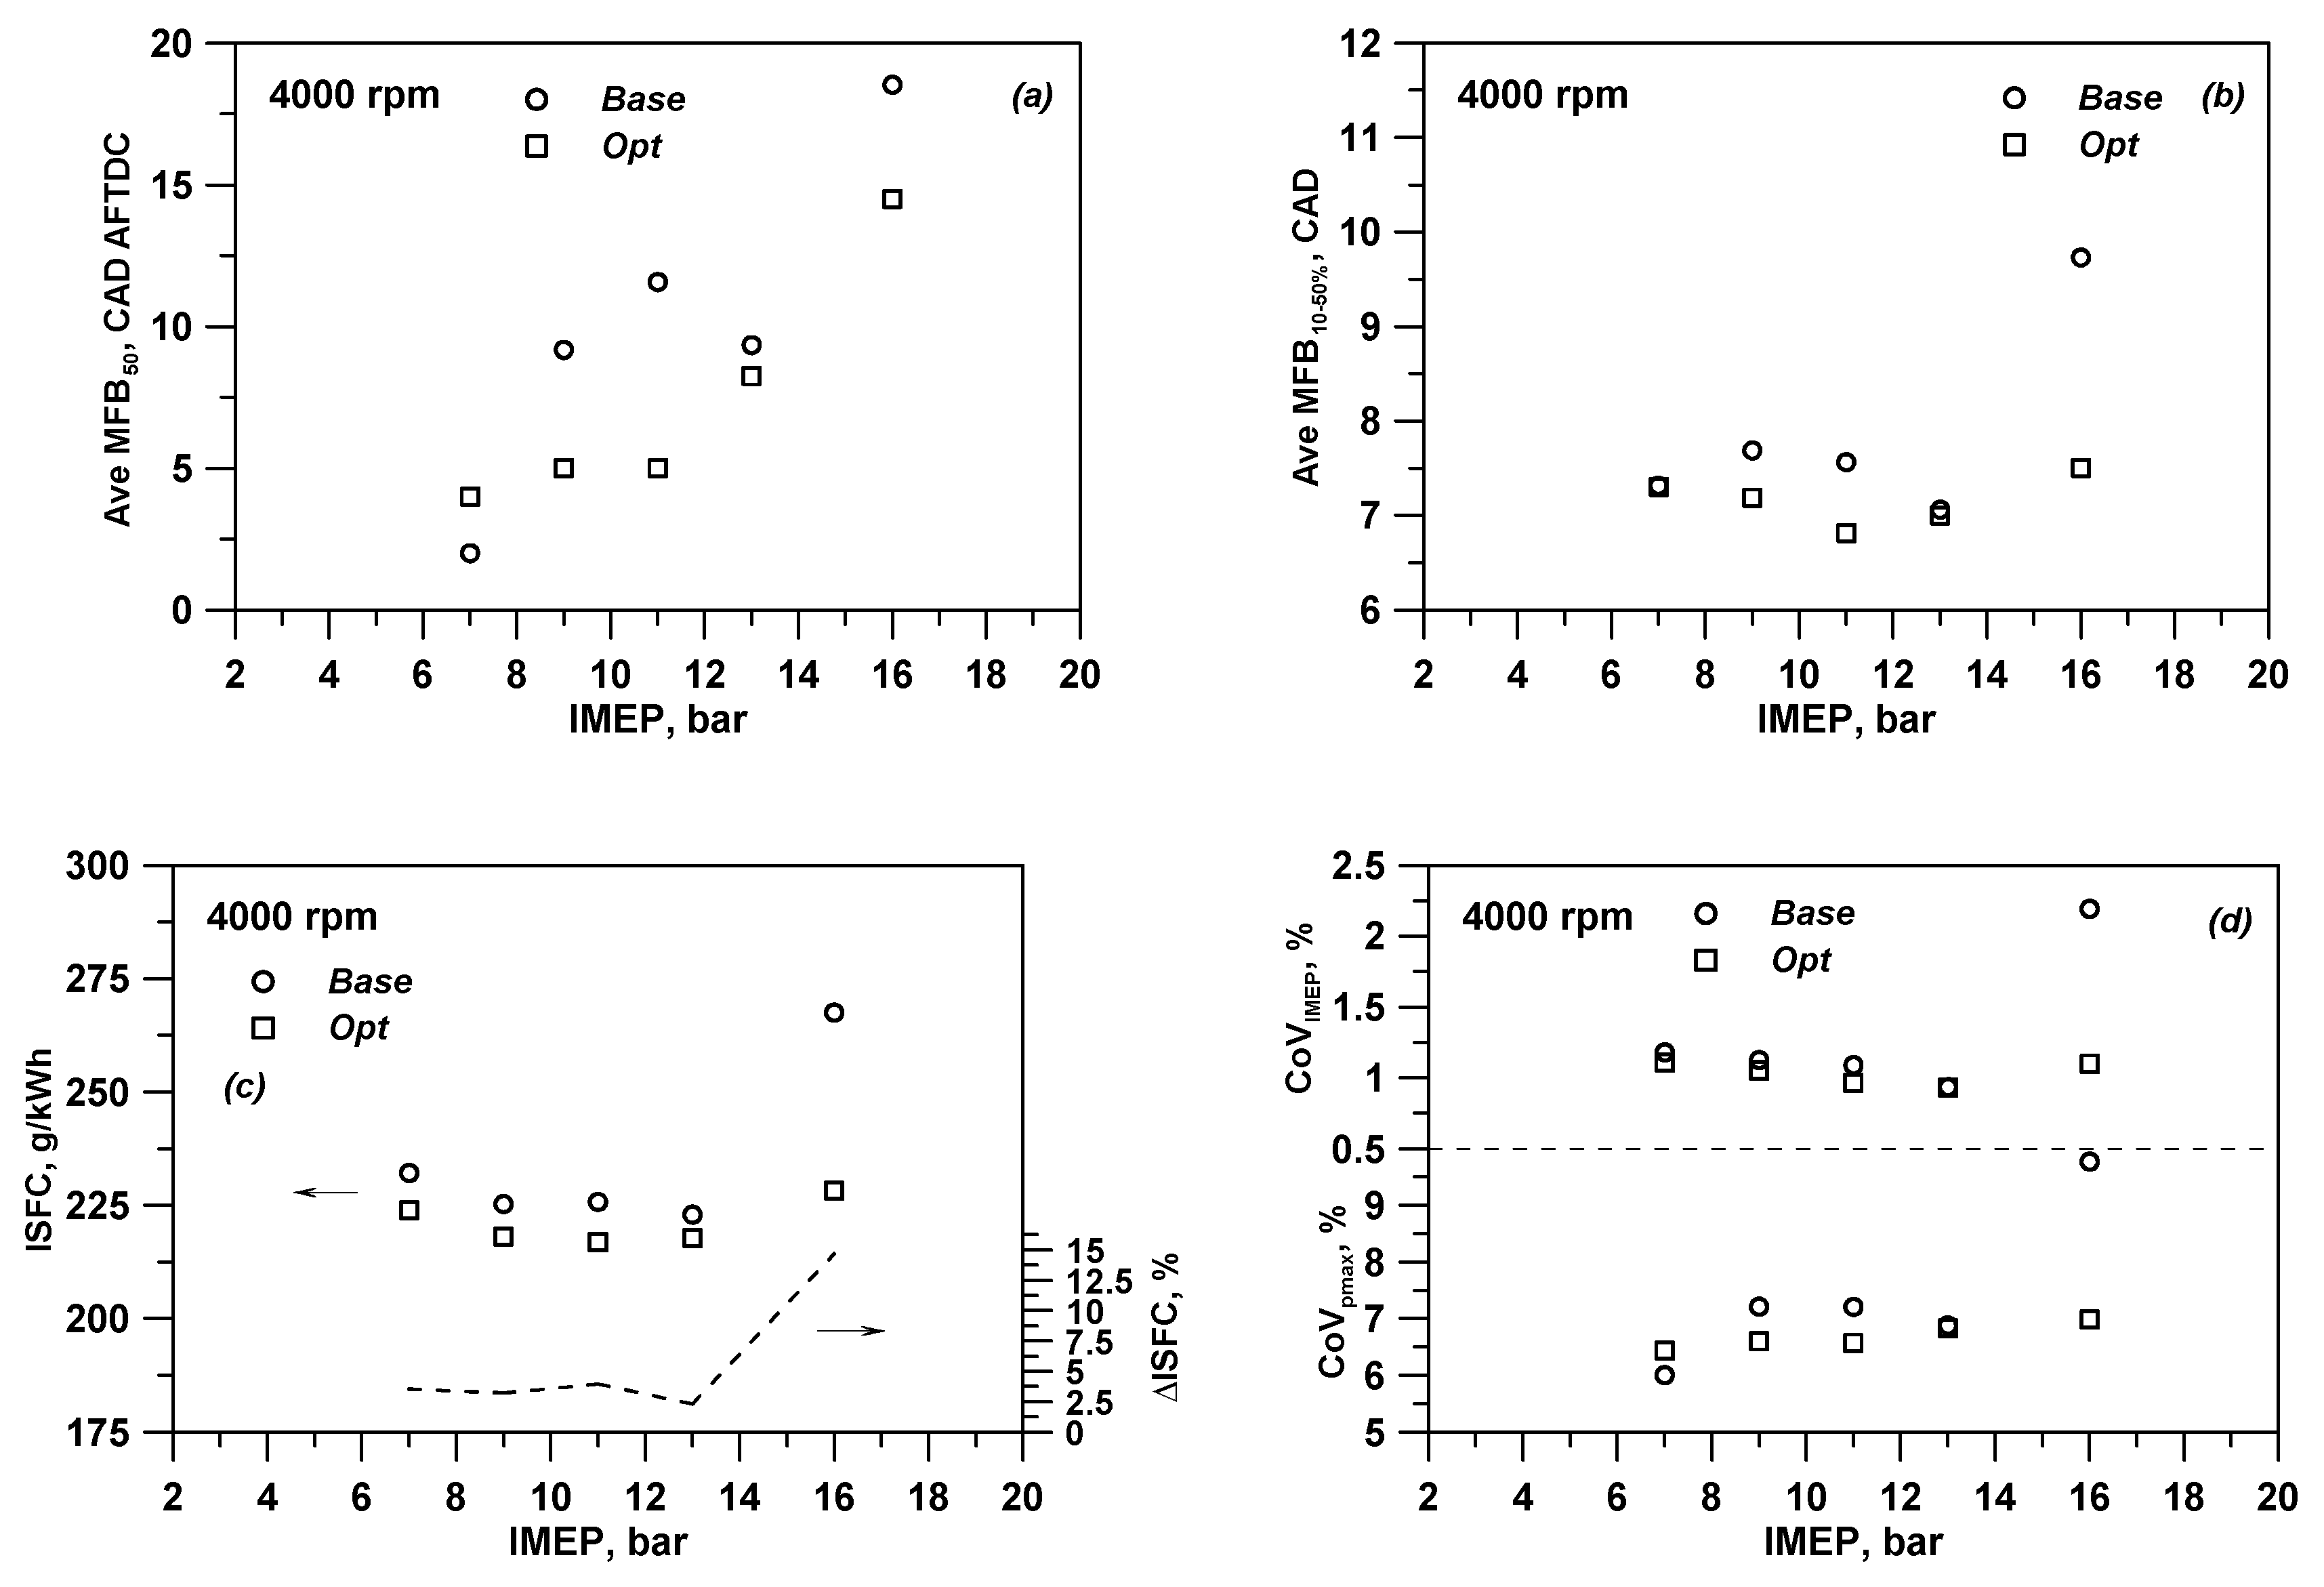
Figure 14d), while at knock-free loads the CCV remains unchanged. The numerical optimization outcomes at speeds of 3000 and 4000 rpm show similarities. Indeed, for both speeds and under knock-limited operations (above 12 bar IMEP at 3000 rpm and 11 bar IMEP at 4000 rpm), the identified optimal combustion phasing is advanced (
Figure 15a/
Figure 16a) with respect to the Base level and, consequently, the combustion core duration is also reduced (
Figure 15b/
Figure 16b). Lower CoV levels are predicted by the developed CCV correlations for the optimal solutions, mainly thanks to the improved combustion process (
Figure 15d/
Figure 16d). Concerning the ISFC advantages, the previous considerations for the case at low speed can be also applied for the medium and high speeds. It is worth highlighting that greater ISFC percent gains are realized in all the high load points where the ECU standard calibration required a rich combustion (
Table 3). As confirmed in
Figure 15c, higher ISFC benefits are achieved at 3000@12, 3000@16 and 3000@18 with gains of 9.7%, 13.3% and 12.2%, respectively. In a similar way,
Figure 16c shows a very high ISFC advantage (equal to 14.7%) only at 4000@16. Finally, at knock-free loads and medium/high speeds (3000@5, 3000@7, 4000@7 and 4000@9) limited improvements in the combustion process and CoV indexes are achieved through the optimization. In these cases, the fuel consumption is still improved (ISFC gain of 4.4% at 3000@5 in
Figure 15c and 3.5% at 4000@7 in
Figure 16c), due to the elimination of an uneven A/F ratio between cylinders. Summarizing, the suppression of cylinder-to-cylinder variation through the optimization of single cylinder operation demonstrated the possibility of achieving improvements in terms of combustion evolution and stability also contributing to reduced fuel consumption while preserving engine safety both in terms of mechanical and thermal stresses.
5. Conclusions
In this work, a small, turbocharged Spark Ignition engine is numerically and experimentally studied with the aim to optimize the individual cylinder combustion and, consequently, to reduce the engine fuel consumption and the cycle-to-cycle variation. In a first phase two different experimental steady analyses were carried out. In particular, a spark advance sweep was performed both at high and low loads, including various engine speeds and air/fuel mixture qualities. The acquired data were post-processed to find proper engine CoV correlations of IMEP and in-cylinder pressure peak with the average combustion phasing and core duration. A second experimental investigation was realized, mainly consisting of a load sweep at three different speeds (namely 2000, 3000 and 4000 rpm), covering both knock-free and knock-limited operations in the engine domain. The operating points considered in this phase of experiments correspond to the conditions imposed by the ECU in the commercial vehicle. The engine was schematized in a 1D model which was validated in terms of global performance variables, combustion evolution and average pressure cycles obtained from the above experimental IMEP sweep. Then, the developed CoV correlations were validated against the experimentally derived CoV values of measured IMEP-sweep points. Once validated, 1D model and the experimentally-related CoV correlations were coupled with the aim to realize a numerical optimization of the engine performance under knock-free and knock-limited conditions. The optimization process reveals that the individual cylinder operation can be considerably improved from ECU-defined settings, especially at high loads. The indicated specific fuel consumption is reduced if compared to the experimental calibration and an ISFC percent benefit ranging from 2.2% up to 14.7% is attained at varying the speed/load points. At low loads, the optimized ISFC level is reached mainly thanks to the possibility of stoichiometric A/F ratio operation in each cylinder. At high loads, ISFC is numerically optimized through the definition of a stoichiometric A/F ratio in each cylinder and an improvement in the combustion process. The optimization at high loads allows the definition of a new setting for the knock-limited spark advance (KLSA) which implies an advanced combustion phasing (MFB50) and a reduced combustion duration if compared to the experimental ECU-defined counterparts. Furthermore, the validated CoV correlations, starting from the numerically optimized combustion parameters, furnish an empirical-based prediction of the cycle-to-cycle variation improvement. Consistently with the combustion optimization, significant reduction in the cycle-to-cycle variation is achieved at high loads for each investigated speed. Summarizing, the adopted numerical procedure allows the identification of the optimal combustion operation, contributing to support the control of each cylinder operation. In this way, the proposed integrated numerical models represent a useful and valuable tool to limit the fuel consumption, the cycle-to-cycle and the cylinder-to-cylinder variations during the engine development phase.


