Article

Lumped Kinetics for Homogeneous Reactions of n-Hexadecane and n-Decene as Model Compounds for PE Pyrolysis Primary Tars

by
Osvalda Senneca
1,* and
Teresa Tucciullo
2
1
’Istituto di Scienze e Tecnologie per l’Energia e la Mobilità Sostenibili (STEMS), Consiglio Nazionale delle Ricerche, P.le V.Tecchio 80, 80125 Naples, Italy
2
Dipartimento di Ingegneria Chimica dei Materiali e della Produzione Industriale, Università degli Studi di Napoli Federico II, P.le V.Tecchio 80, 80125 Naples, Italy
*
Author to whom correspondence should be addressed.
Energies 2020, 13(20), 5466; https://doi.org/10.3390/en13205466
Submission received: 31 August 2020 / Revised: 8 October 2020 / Accepted: 13 October 2020 / Published: 19 October 2020
(This article belongs to the Special Issue Thermochemical Conversion of Biomass and Waste)

Abstract

:
The focus of this paper is to establish a lumped kinetic scheme for secondary reactions of tar produced from pyrolysis of plastics or polymer-based wastes. Notably, the focus is not on the detailed yield of all reaction intermediates and products but on the propensity to form soot. Based on the assumption that that primary tar from pyrolysis of plastic wastes is mostly formed by aliphatics which can undergo progressive aromatization to polycyclic aromatic hydrocarbons (PAHs) and soot, a reaction network with 198 species and 6307 reactions proposed by Ranzi and coworkers was lumped into a very simple five reaction mechanism. The lumped kinetic model has been used to predict PAHs and soot formation in different conditions and proved to be a good alternative to comprehensive kinetic models up for relatively low temperature and short residence times (of up to 1 min at 1200 K, up to 1 s at 1400 K). At higher temperature/longer residence times, the simplified model still provides reasonable qualitative trends but the amount of PAHs and soot is underestimated. The timescale of aromatization under inert conditions appears similar for all the alkanes and alkenes examined and also the yields in main reaction products seem to scale well with the number of carbon and hydrogen atoms of the parent alkane/alkene. Evolution of the young aliphatic tar into large aromatics is prevented as long as gaseous oxygen being available for oxidation. The lumped kinetic model has been used to highlight the effect of different modes of oxygen feeding and of incomplete mixing of fuel and oxygen on the formation of PAH and soot.

1. Introduction

Several well-known technologies for pyrolysis and gasification—such as entrained flow reactors, fluidized beds, rotary kilns, and fire grates—are nowadays receiving renewed attention as possible solutions to the problem of wastes disposal and for energetic exploitation of biomass and wastes. Within this context, considerable attention has been devoted to thermal recovery of plastic wastes [1,2,3,4,5,6,7,8,9,10,11,12,13,14,15,16,17,18,19,20,21,22,23,24]. However, processing of non-conventional fuels is not straightforward. In fact, it has been reported that upon thermal treatment of biomass and wastes—like plastics, tires, automotive shredder residues (ASR), etc.—production of harmful compounds such as polyciclic aromatic hydrocarbons (PAHs) can be even more serious than for fossil fuels [14,15,16,24]. PAHs increase with pyrolysis temperature [25,26,27,28]. Rausa and Pollesel [26] report that the share of PAHs and substituted benzenes in products exceeds 80 wt% for pyrolysis of automotive shredder residue (ASR) at 1123 K. It is suggested that PAH formations is due to secondary reactions, is favored by high temperatures (>973 K) and long residence times [27,28].
Predictive reactor models can be of great advantage in the design and operation of pyrolysis and gasification reactors and in the interpretation of experimental results. The advent of computational fluid-dynamic (CFD) tools has indeed encouraged this practice, although the usefulness of computational codes is often ruled out by the ability of the chemical and kinetic submodels to describe the complex chemistry of pyrolysis and gasification.
Several multistep mechanisms of pyrolysis of solid fuels have been proposed over the years. In particular, the FLASHCHAIN [29], FG-DVC [30], and CPD [31,32] model for coal, Ranzi et al.’s mechanism for hydrocarbon mixtures [33,34], pyrolysis of three butane isomers [35], and isobutene [36]. Other very detailed or semi-detailed schemes propose both oxidation and pyrolysis of hydrocarbons [37,38,39,40,41]. Unfortunately, inclusion of very detailed chemistry in CFD codes for the simulation of real reactors, which are characterized by large computational grids, is cumbersome; for this reason, very simplified kinetic approaches—such as one step kinetics—are still common in CFD works.
Some attempts have been made to find a trade-off between the oversimplified kinetic schemes, that miss important features of the chemical transformations, and too complex kinetic schemes which require excessive computational time. Ranzi and coworkers worked out their detailed pyrolysis mechanisms into more simplified ones [42,43]. For coal pyrolysis they proposed to group tar species in pseudo-components whose elemental composition reflects that of the corresponding reference coal, to lump all the C2–C5 hydrocarbons in a pseudo-component with the equivalent formula (–CH2) and to assimilate minor oxygenated species to an equimolar formaldehyde and methanol mixture. The BTX (benzene–toluene–xylene) fraction is also accounted in terms of a single lumped component. For biomass pyrolysis the recipe they proposed is to predict the yields and rates of primary pyrolysis products on account of the content of cellulose, hemicelluloses, and lignin, estimated from the elemental composition of the biomass. Volatile components are subject to 27 successive gas-phase pyrolysis and/or 28 oxidation reactions.
Some other kinetic models have been proposed in the literature with an even smaller number of species and reactions. The kinetic scheme of Jess et al. [44], taken after also by Umeki et al. [45], was used to simulate steam gasification of woody biomass and includes 11 reactions and 11 species. According to this mechanism, biomass decomposes to char, syngas, and tar, the latter being constituted by a mixture of acetol, toluene, and naphthalene. Corella et al. [46], in their model for a fluidized bed biomass gasifier, adopted a kinetic model of 12 reactions and 9 species. They assumed that a first step of devolatilization generates primary tar whose further thermal degradation generates secondary tar. They did not specify a chemical formula for these two products.
In the case of oil pyrolysis, Maki et al. [47] considered primary cracking reactions to occur instantly with tar formation and identified two kinds of tar: an aliphatic tar (C10) and an aromatic tar (mostly benzene and naphthalene). The aliphatic tar decomposes to produce hydrocarbon gases and aromatic tar. Aromatic tar then forms benzene and eventually coke. On this basis they considered 11 species and 9 reactions. Zou et al. [48] followed an even simpler approach to model oil pyrolysis: they assumed one reaction for primary decomposition and two reactions for coke formation from intermediate products, namely ethylene and aromatics. Jackson et al. [49] proposed a lumped kinetic model for n-hexadecane pyrolysis consisting of five first-order reactions.
The goal of the present paper is to derive a simple kinetic model describing the evolution of the tar produced from pyrolysis of plastics and polymeric waste streams into PAHs and soot, under different reaction conditions. Since the highly cited paper of Mastral et al. [30], the scientific community has produced an extensive literature on thermal conversion of plastics [1,2,3,4,5,6,7,8,9,10,11,12,13,14,15,16,17,18,19,20,21,22,23,24,25,26,27,28,29,30,50,51,52,53,54,55] including some recent reviews [7,8,9,10,11,12,24,50]. The literature agrees on the fact that decomposition of polyethylene takes place via homolytic rupture of covalent C-C bonds generating wax like linear hydrocarbons, which can further on undergo complex reactions. In fact, long alkanes and alkene are the main products of pyrolysis of PE at relatively low temperature (T < 773 K), while aromatics—such as benzene, toluene, and naphthalene—are abundant in the products of pyrolysis of plastic wastes at temperatures in the order of 1000–1100 K. In line with these results, in the present work a simplified reaction scheme is proposed which considers only three categories of pyrolysis products: primary pyrolysis products are assimilated with alkanes and alkenes chains, secondary products with small aromatics, such as benzene and naphthalene, while larger PAHs and soot will be considered as tertiary products. The kinetics of the reactions of these species under inert and oxidative conditions will be obtained by a combination of laboratory and computational experiments. The proposed lumped kinetic scheme is reported in Figure 1.

2. Experimental and Methods

2.1. Computational Experiments

Computational experiments have been carried out with the module Aurora of the software Chemkin, which simulates a closed perfectly mixed reactor. The kinetic mechanism proposed by Ranzi and coworkers [33] for high temperature pyrolysis and oxidation of hydrocarbons has been used. This includes 6307 reactions and 198 species up to C20.
Four set of computational experiments have been carried out:
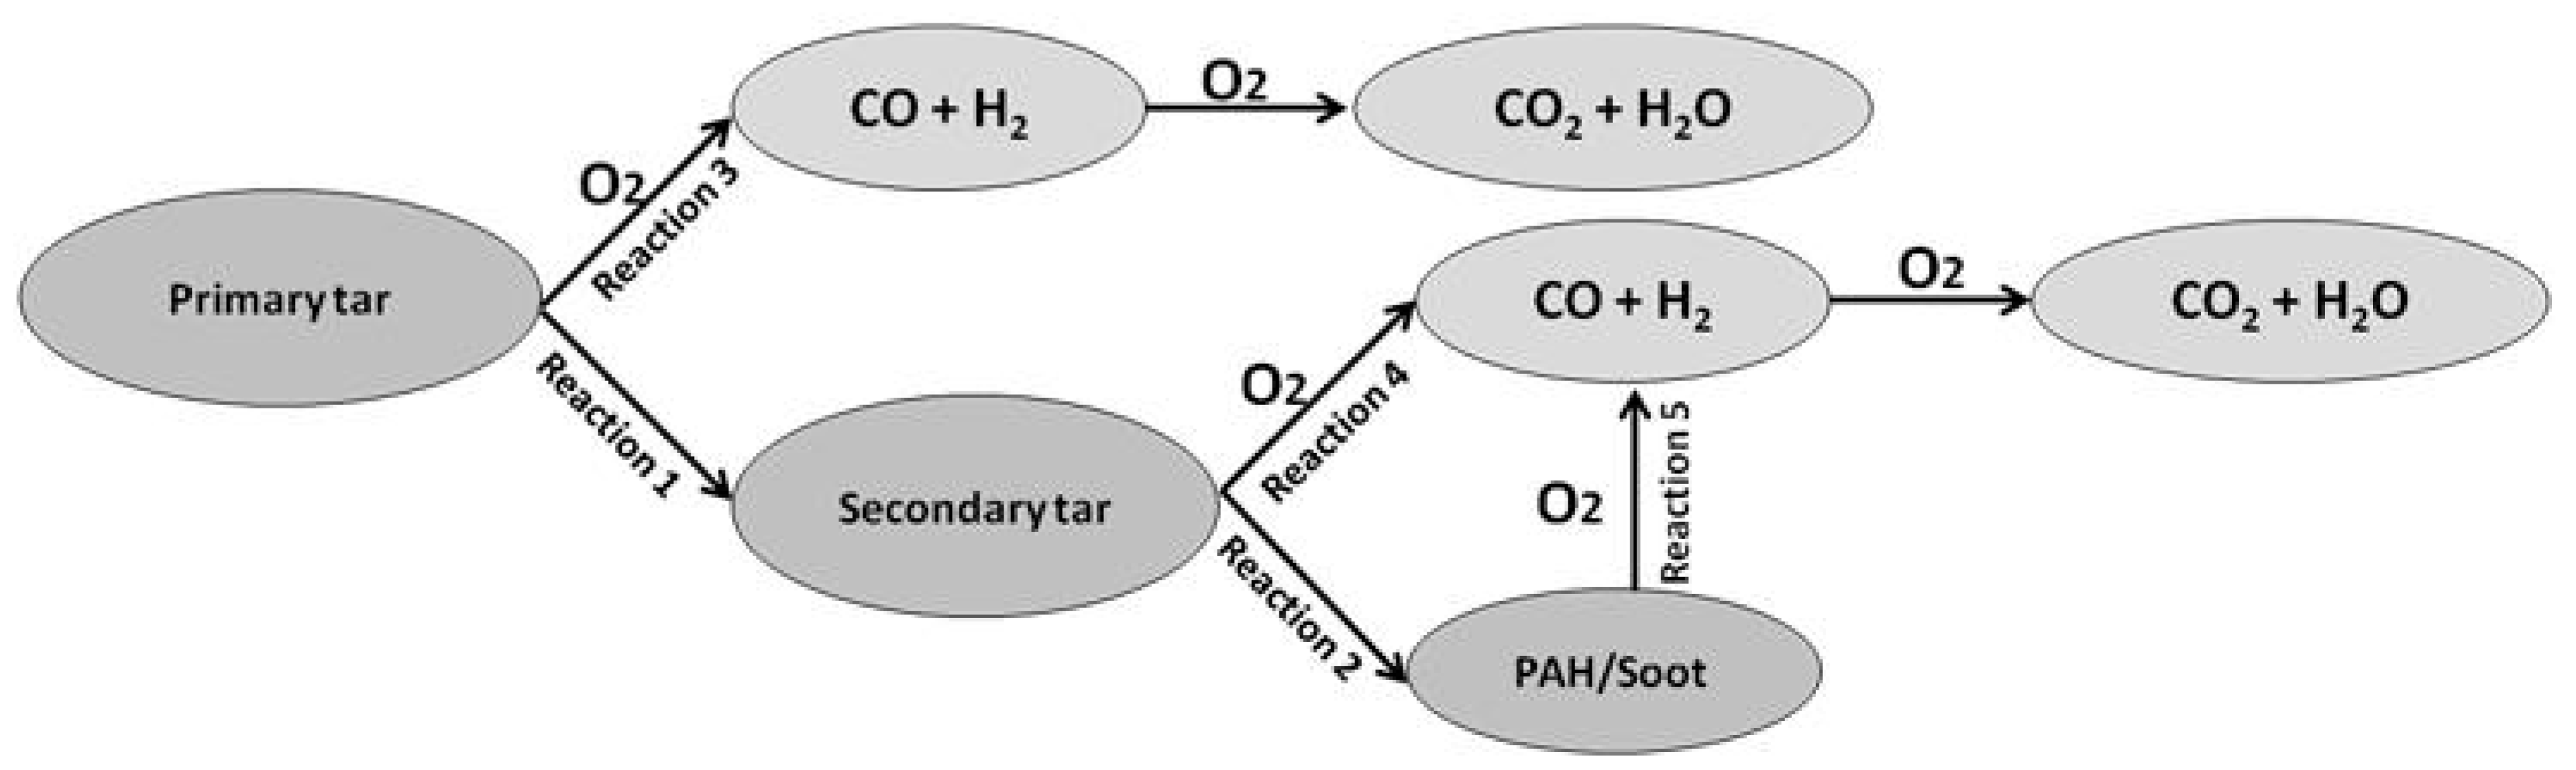
  • Reaction of primary tar under inert conditions
  • Reaction of secondary tar under inert conditions
  • Combustion of primary tar
  • Combustion of secondary tar
In the first set of experiments, alkanes and alkenes of different length (up to n-hexadecane and n-decene) have been tested. In the second set of experiments small aromatics such as benzene, toluene, and naphthalene have been tested. The third and fourth sets of experiments were carried out with the same hydrocarbons as in the sets of experiment 1 and 2, respectively. The initial concentration value of the hydrocarbon was set to values between 0.0001 and 0.1, the temperature was varied between 700 and 1900 K and the holding time was varied between 0.001 and 10000 s. The oxygen concentration was varied between 0% and 20%.

2.2. Laboratory Experiments

A sample of fine particulate matter was recovered during tests with a mixture of plastic wastes in a pilot scale rotary kiln reactor (capacity of 100 kg/h, reactor length 3 m). The reactor was operated under lean oxygen conditions (the molar O/C in the feed was 0.3) and reached peak solids temperatures around 1200 K. The sample was collected by an isokinetic probe, cooled down, and soaked with isopropanol prior to further analysis.
The SEM pictures of the sample reveal Figure 2a sooty like structure. The elemental analysis performed by CHN LECO Analyzer shows that the sample contains over 75 wt% of carbon and 1.3 wt% of hydrogen. Notably, the carbon content is small compared to that of soot produced from gaseous hydrocarbons, which is constituted by more than 90% of carbon; however, this value is not surprising because the sample is produced from pyrolysis of a mixture of plastic wastes, which not contain only carbon and hydrogen, but also mineral matter from additives, colorants, etc.
The sample has been analyzed in a Netzsch 409-C thermogravimetric apparatus. Approximately 10 mg of the sample were loaded into the pan and heated in air from ambient temperature to 1125 K at the rate of 5 K/min. Tests have been repeated three times. The mass loss data have been worked out to calculate the carbon conversion degree, X = (mo − m)/(mo − m) (where mo and m are the initial and final sample mass), and the instantaneous rate of carbon conversion: R = dX/dt, where t is time.

3. Results

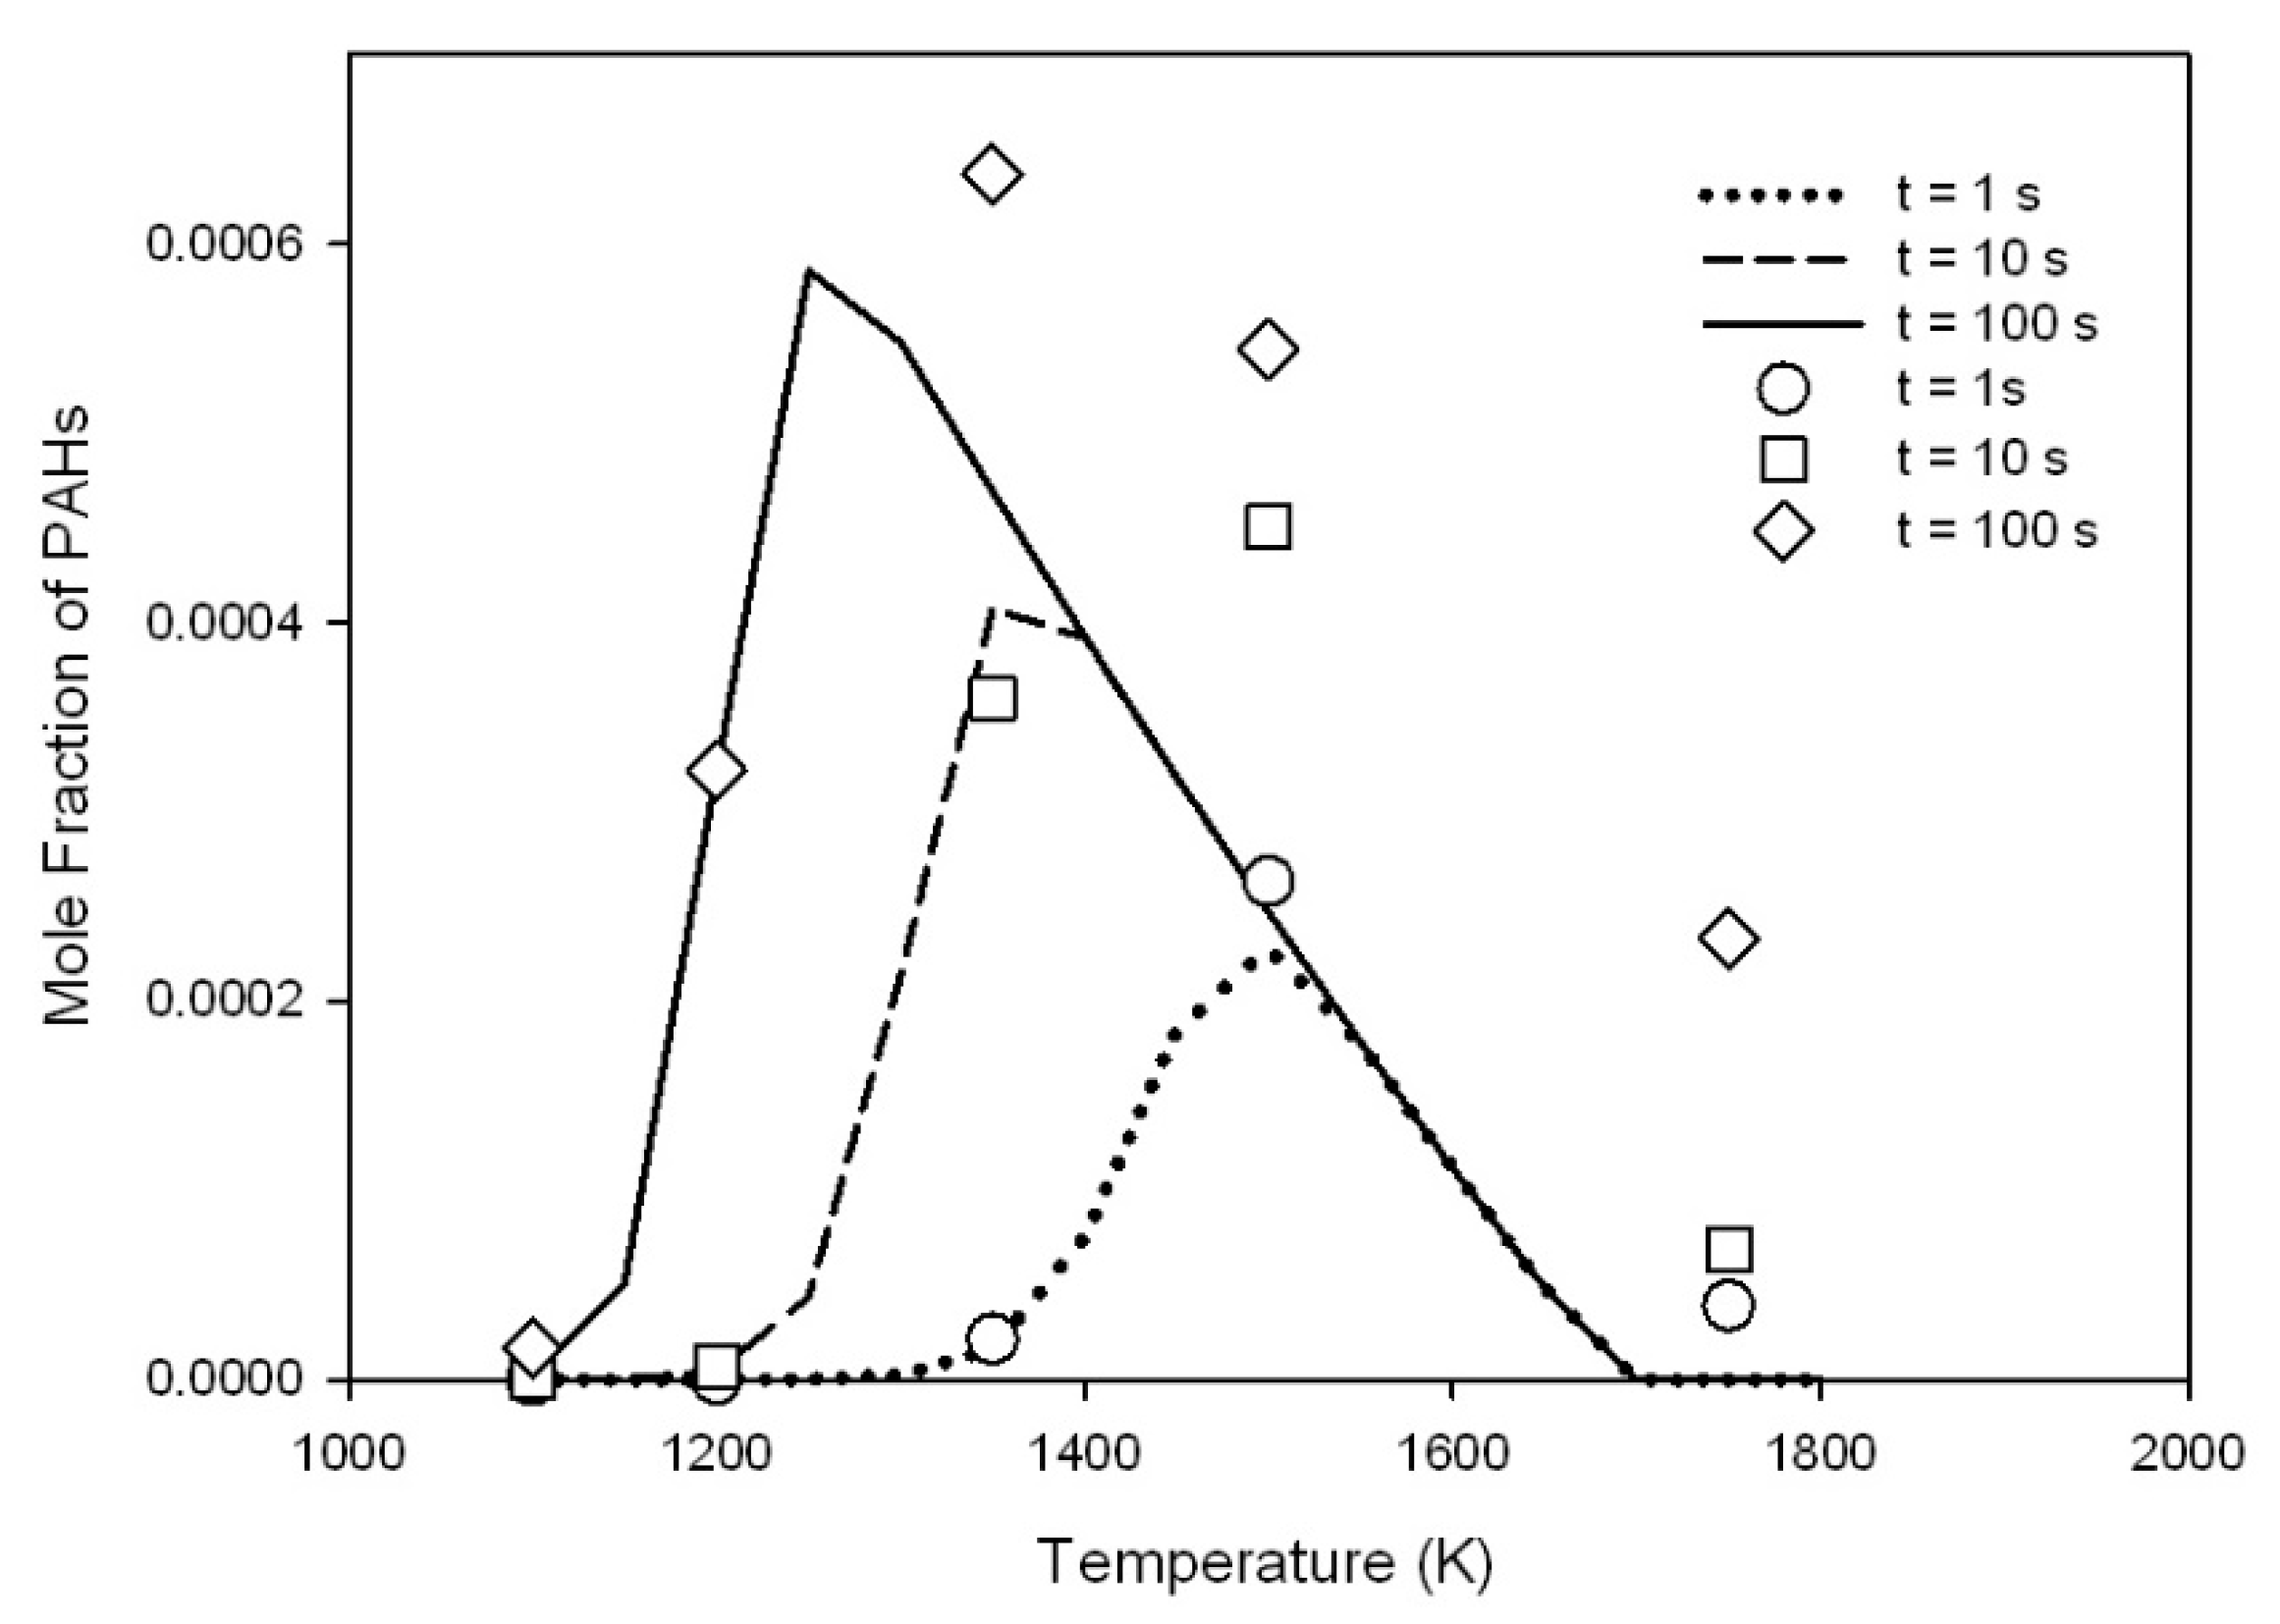
3.1. Reaction of Primary Tar Under Inert Conditions

As examples of results of computational pyrolysis experiments, Figure 3a–c show the concentration obtained with 0.1% n-hexadecane in nitrogen at 1200 and 1900 K. Hydrocarbon mole fractions have been multiplied by the number of carbon atoms in each molecule to normalize values on a carbon basis. At 1200 K (Figure 3a) n-hexadecane, in less than 1 ms, fragments into relatively small hydrocarbons (nC10H20, nC7H14). By the time of 2 milliseconds, further cracking leads to even smaller products: C2H4 appears to be the most abundant product. Over the timescale of few seconds (Figure 3a), further small alkanes, alkines, and aromatics are formed, in particular CH4, C6H6, and C2H2. Formation of C10H8 and of progressively larger aromatics takes on over longer times. Production of C10H8 is indeed maximum at 52 s. Notably the kinetic mechanism used for Chemkin simulations does not include aromatics larger than C20, therefore the appearance of C20H10 has been assumed in the present work as indicative of the formation of progressively larger PAHs and eventually soot. Hydrogen is produced at all stages of reaction as a consequence of cracking and dehydrogenation. For temperatures up to 1600 K, the general trend is similar but reaction time scales are shorter, maximum production of naphthalene occurring at approximately 0.2 s at 1500 K. For higher temperatures, formation of C2H2 is predominant over PAHs (Figure 3c).
Results of pyrolysis experiments with n-decene resemble those observed in Figure 3a, since n-hexadecane transforms into n-decene in the very early instances of reaction.
Based on the above considerations the following simplified reactions have been assumed to describe pyrolysis of n-hexadecane (reaction 1a) and n-decene (reaction 1b)
C 16 H 34 34 a H 2 + 16 b C 10 H 8 + 16 c C H 4 + 16 d C 2 H 4 + 16 e C 2 H 2
C 10 H 20 20 a H 2 + 10 b C 10 H 8 + 10 c C H 4 + 10 d C 2 H 4 + 10 e C 2 H 2
Notably, all aromatics have been represented as C10H8, in accordance with the simplified reaction scheme of Figure 1. This simplification required some minor adjustment of the stoichiometric factors in order to respect the elemental mass balance.
The general formula of Equations (1) and (2) can be expressed as:
C n H m m a H 2 + n b C 10 H 8 + n c C H 4 + n d C 2 H 4 + n e C 2 H 2
The time τ when concentration of C10H8 is maximum can be roughly assumed as the timescale of formation of secondary tar according to pyrolysis Equation (1) or (2) The stoichiometric coefficients of reaction products have been obtained from the concentration of the different species measured at time τ normalized with respect to n and m.
The values of the normalized stoichiometric coefficients (a to e) obtained at different temperatures have been plotted in Figure 4 for n-C16H34 and n-C10H20. Notably results obtained for the two hydrocarbons are very similar. Best fit curves of values of a, b, c, d, and e as a function of temperature are reported in Figure 4 as solid lines and the corresponding expressions are reported in Table 1. From the analysis of the trends of Figure 4, it can be noted that H2 and C2H2 progressively increase with temperature, while other products decrease.
The expressions obtained from the fit of stoichiometric coefficients of reaction 1 as a function of temperature are reported in Table 1.

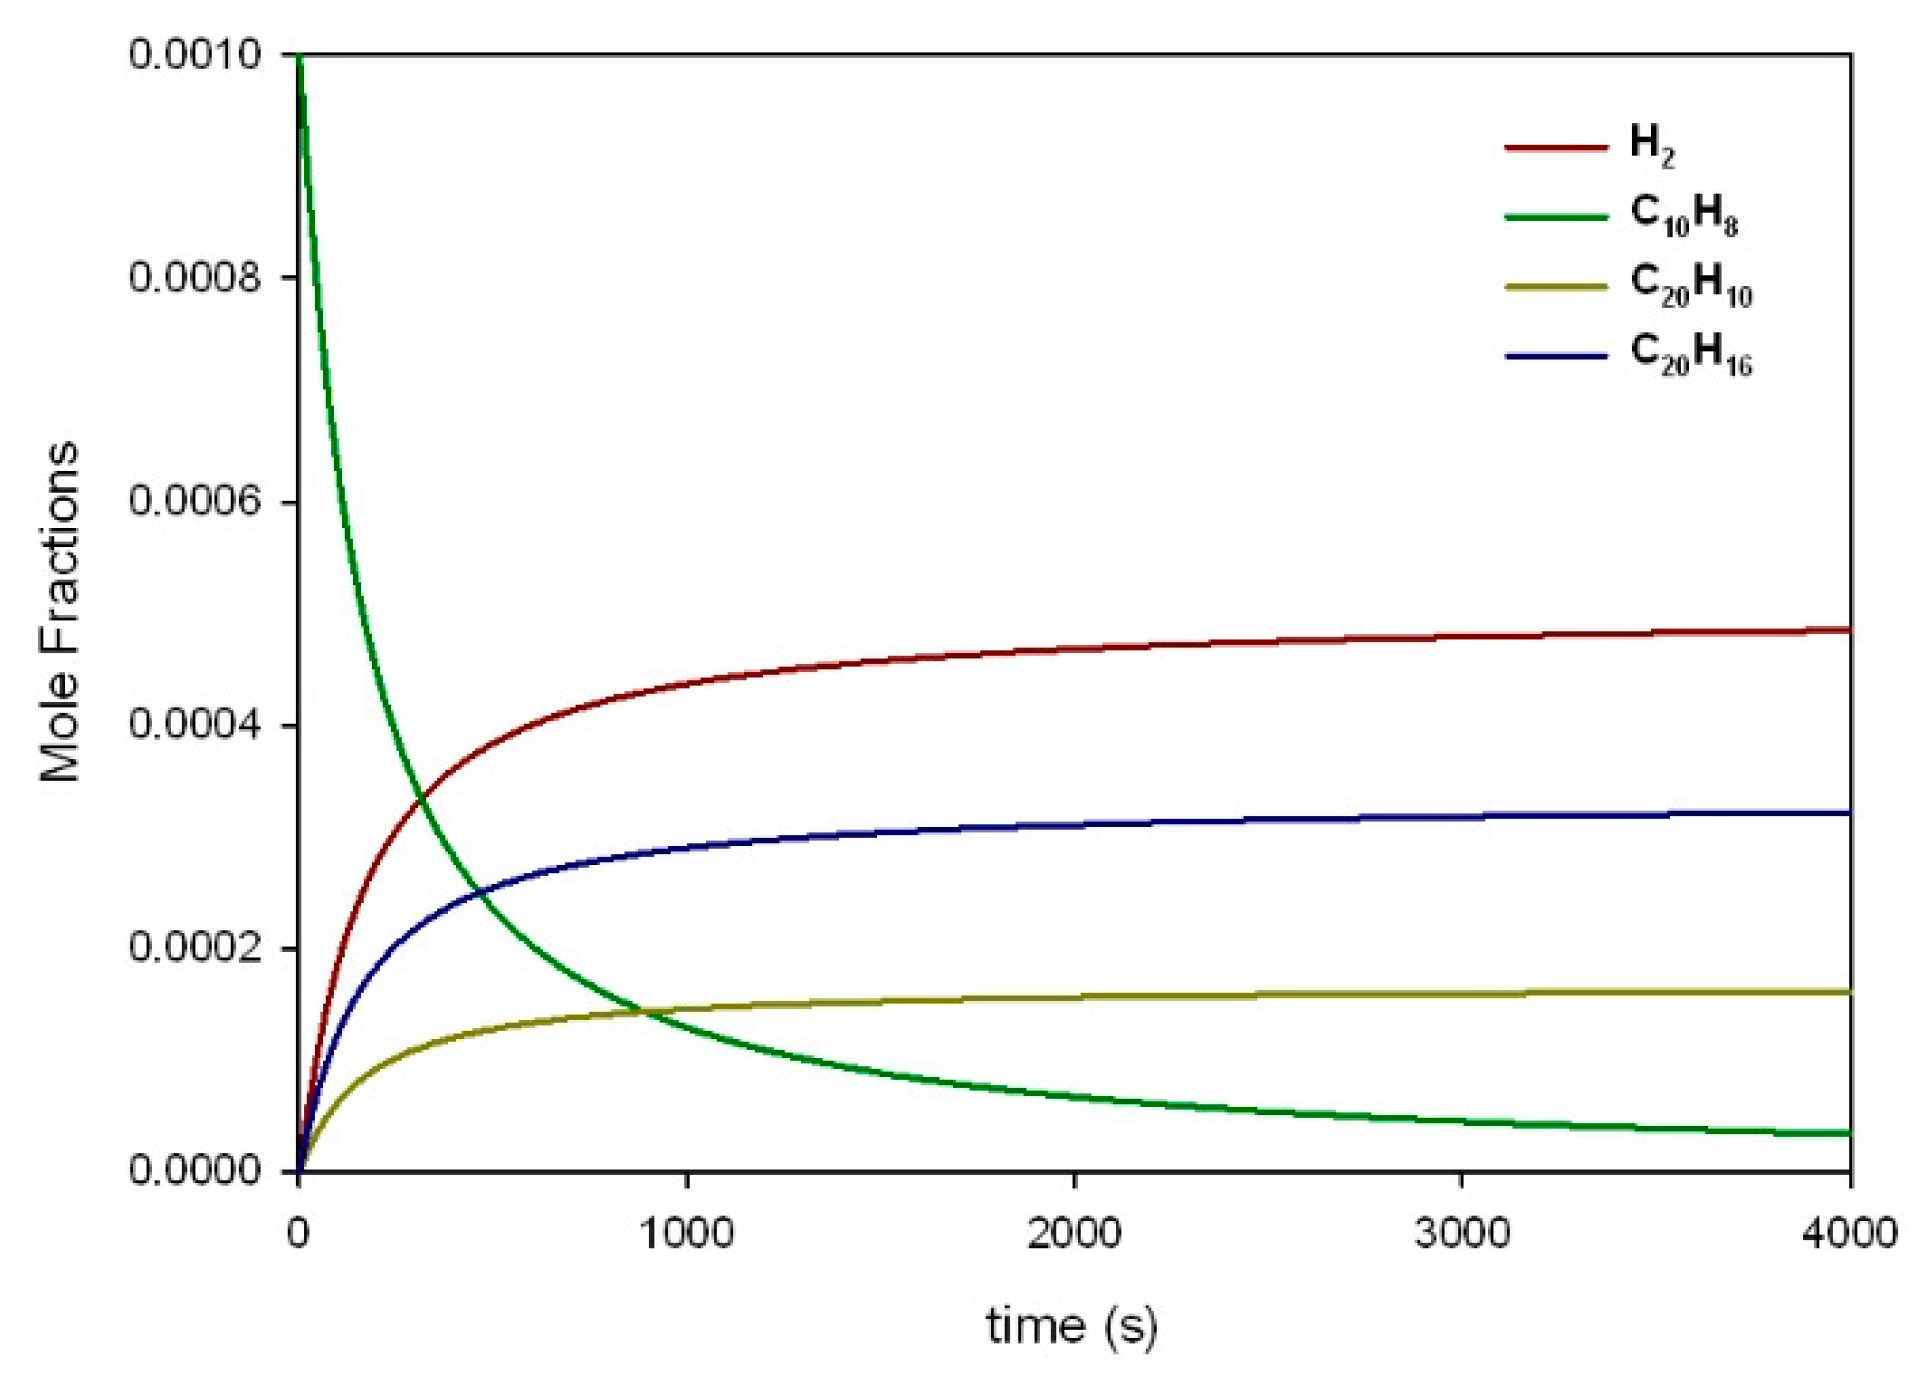
3.2. Reaction of Secondary Tar Under Inert Conditions

The formation of PAHs from secondary tar is addressed in Figure 5 and Figure 6a,b. It is recalled that in the present work C10H8 has been chosen as representative of secondary tar. However, as shown in previous figures, naphthalene is formed along with C2H2. In order to investigate PAHs formation from secondary tar, computational experiments have been performed with C10H8 alone in nitrogen and with mixtures of naphthalene and acetylene in nitrogen at different concentration values.
As an example, results of pyrolysis of 0.1% naphthalene in nitrogen at 1200 K are shown in Figure 5. We can observe a progressive increase of C20H10, C20H16 and H2 as naphthalene is consumed. The timescale of reaction at 1200 K is in the order of 1000. For the sake of brevity, results of computational experiments of secondary tar reactions at higher temperature have not been reported, since the trends of concentration profiles are quite similar, but reaction timescales sensibly decrease with temperature, dropping to 10 s at 1500 K.
In Figure 6a, we report results of the computational experiment with 0.033% naphthalene and 0.1% acetylene in nitrogen at 1200 K. We chose these values for concentration of naphthalene and acetylene in order to respect the ratios between the stoichiometric coefficients measured at this temperature (see Table 1). Apparently, naphthalene and acetylene initially form C12H8 which further on evolve into C14H10 and eventually PAHs. Increasing the temperature up to 1900 K (Figure 5), we observe that naphthalene is consumed in about 20 ms while acetylene concentration tends to a constant value and PAHs are formed only by naphthalene.
Stoichiometric coefficients for conversion of naphthalene are reported in the following formulas:
C 10 H 8 0.5   C 20 H 10 + 1.5 H 2
C 10 H 8 + 5 C 2 H 2 C 20 H 10 + 4 H 2

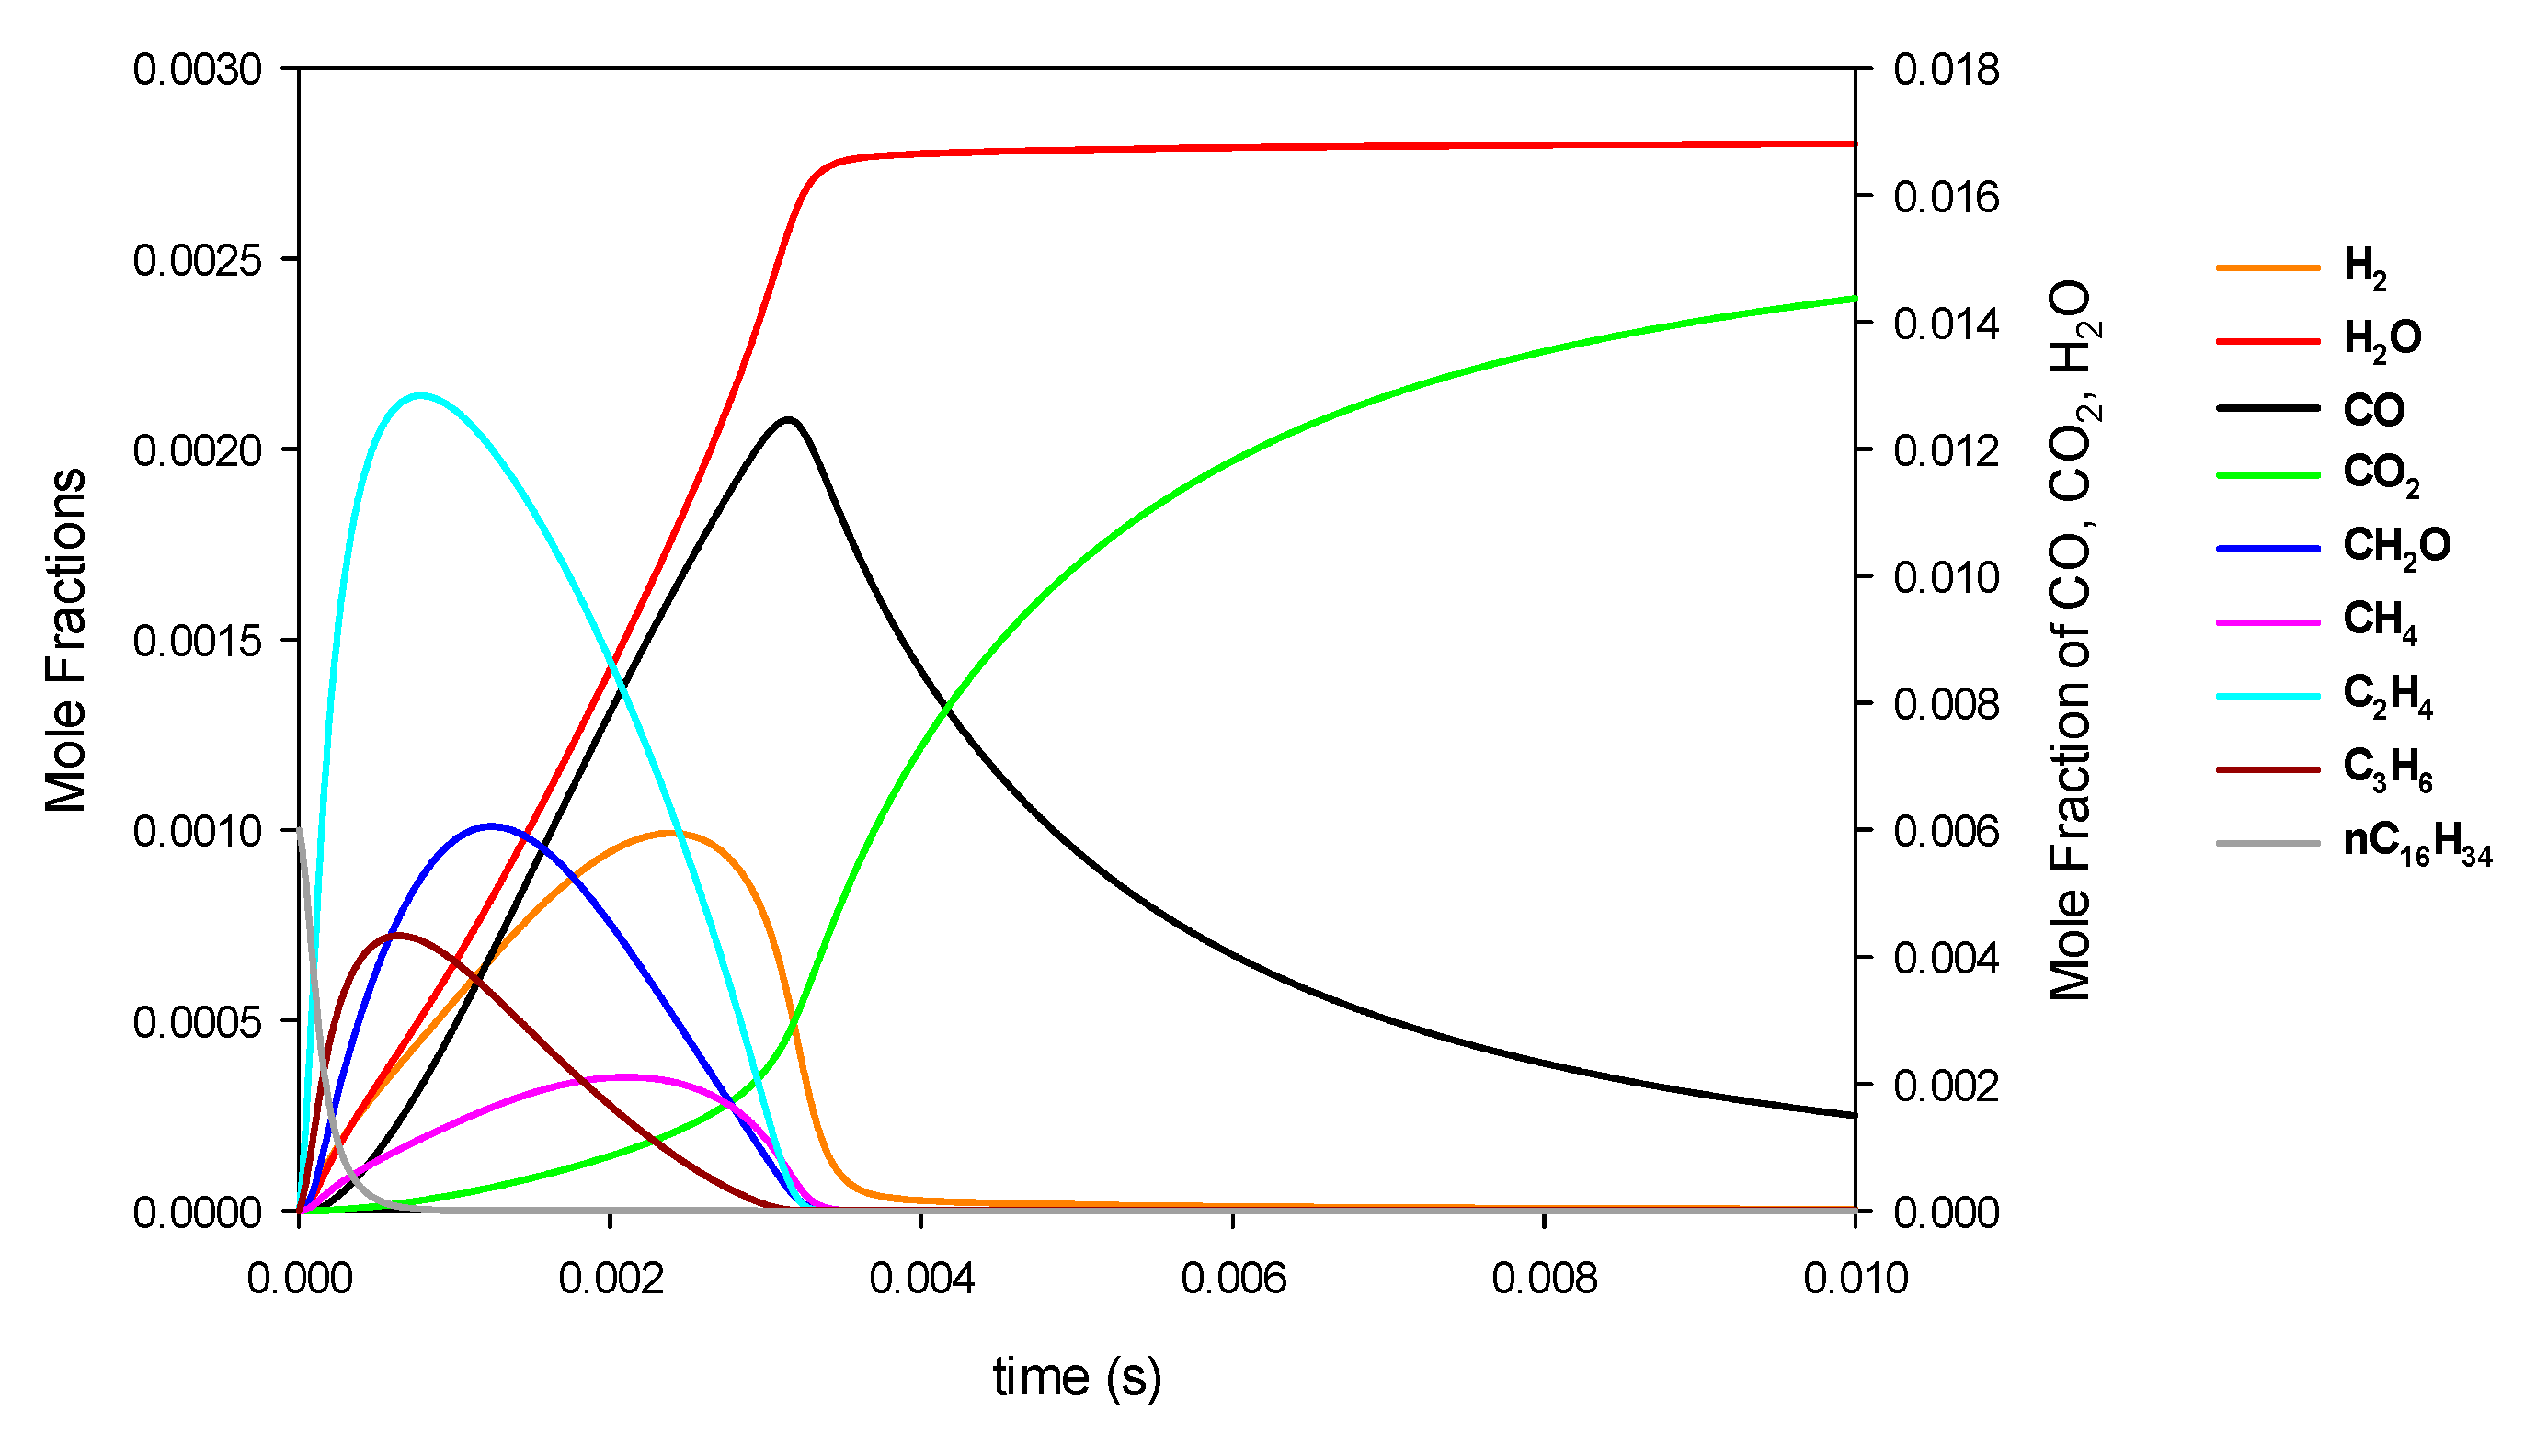
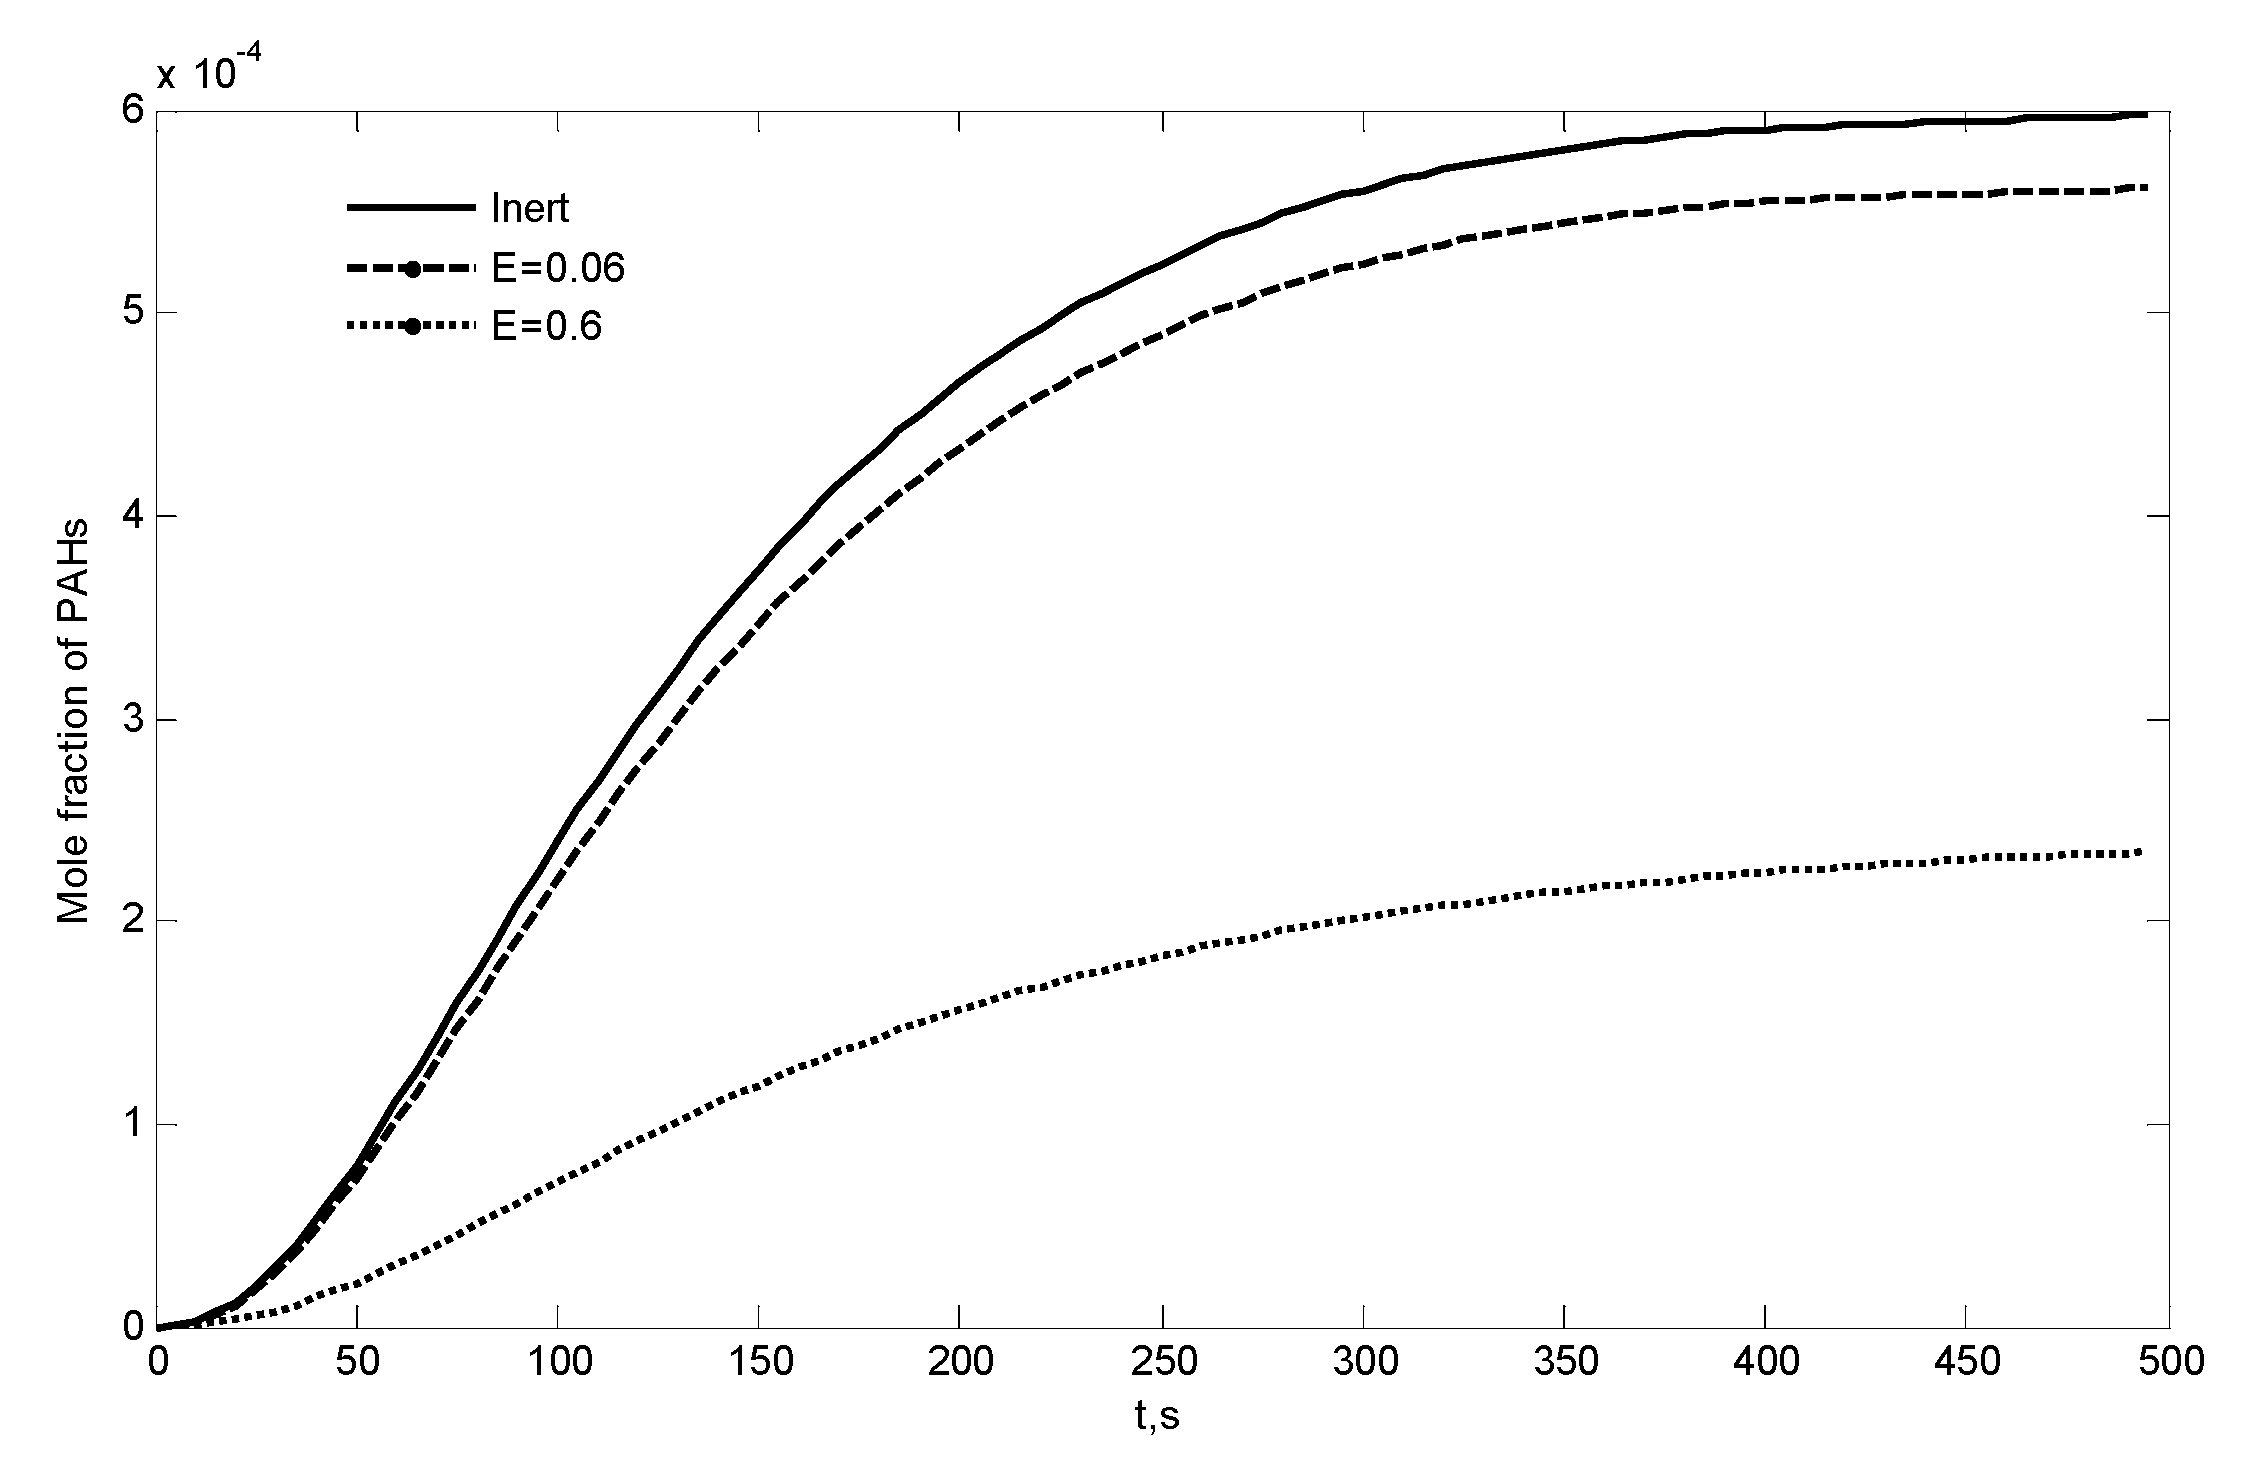
3.3. Combustion of Primary Tar

For sake of brevity only the results of computational experiments of combustion of n-hexadecane (Figure 7) and of naphthalene (Figure 8) at 1200 K and 20% oxygen are reported. Under these conditions n-hexadecane decomposes in less than 1 ms (Figure 7) forming mainly smaller alkenes (C2H4, C3H6, and n-decene), CH2O, CO, and H2. Soon after C2H4, CH2O, and C3H6 start to decrease followed by CH4, H2, and CO, while CO2 and H2O progressively increase. Oxidation is complete within few milliseconds with a maximum in CO production at t = 3 ms.
Similar results are obtained for n-decene which at 1200 K decomposes in a time of the order of 0.5 ms forming mainly C2H4, CH2O, and C3H6. These species start to decrease after 2 ms while CH4, H2, CO, and H2O increase. CH4, H2, and CO start to decrease after 3 ms forming CO2 and H2O. Formation of CO is complete by 3 ms. The effect of reaction temperature is to accelerate reactions: at 900 K with 20% of oxygen decomposition of n-hexadecane, for instance, requires 1 s and the maximum in CO production occurs at t = 2 s. At 1500 K thermal cracking occurs almost instantaneously (in roughly 0.01 ms) and oxidation requires less than 0.05 ms.
Increasing the oxygen concentration above 20% does not significantly affect the reaction times and path. The only effect that can be observed is an acceleration of the formation of H2O at the expense of H2. Reducing the value of oxygen concentration, instead, has a remarkable effect. For instance, at 1200 K when the oxygen concentration is reduced from 20% to 5% and 2% the time of maximum formation of CO from n-hexadecane increases from 3 ms to 9 ms and 60 ms. Further decrease of oxygen concentration below stoichiometric conditions results in patterns approaching those of pyrolysis experiments.

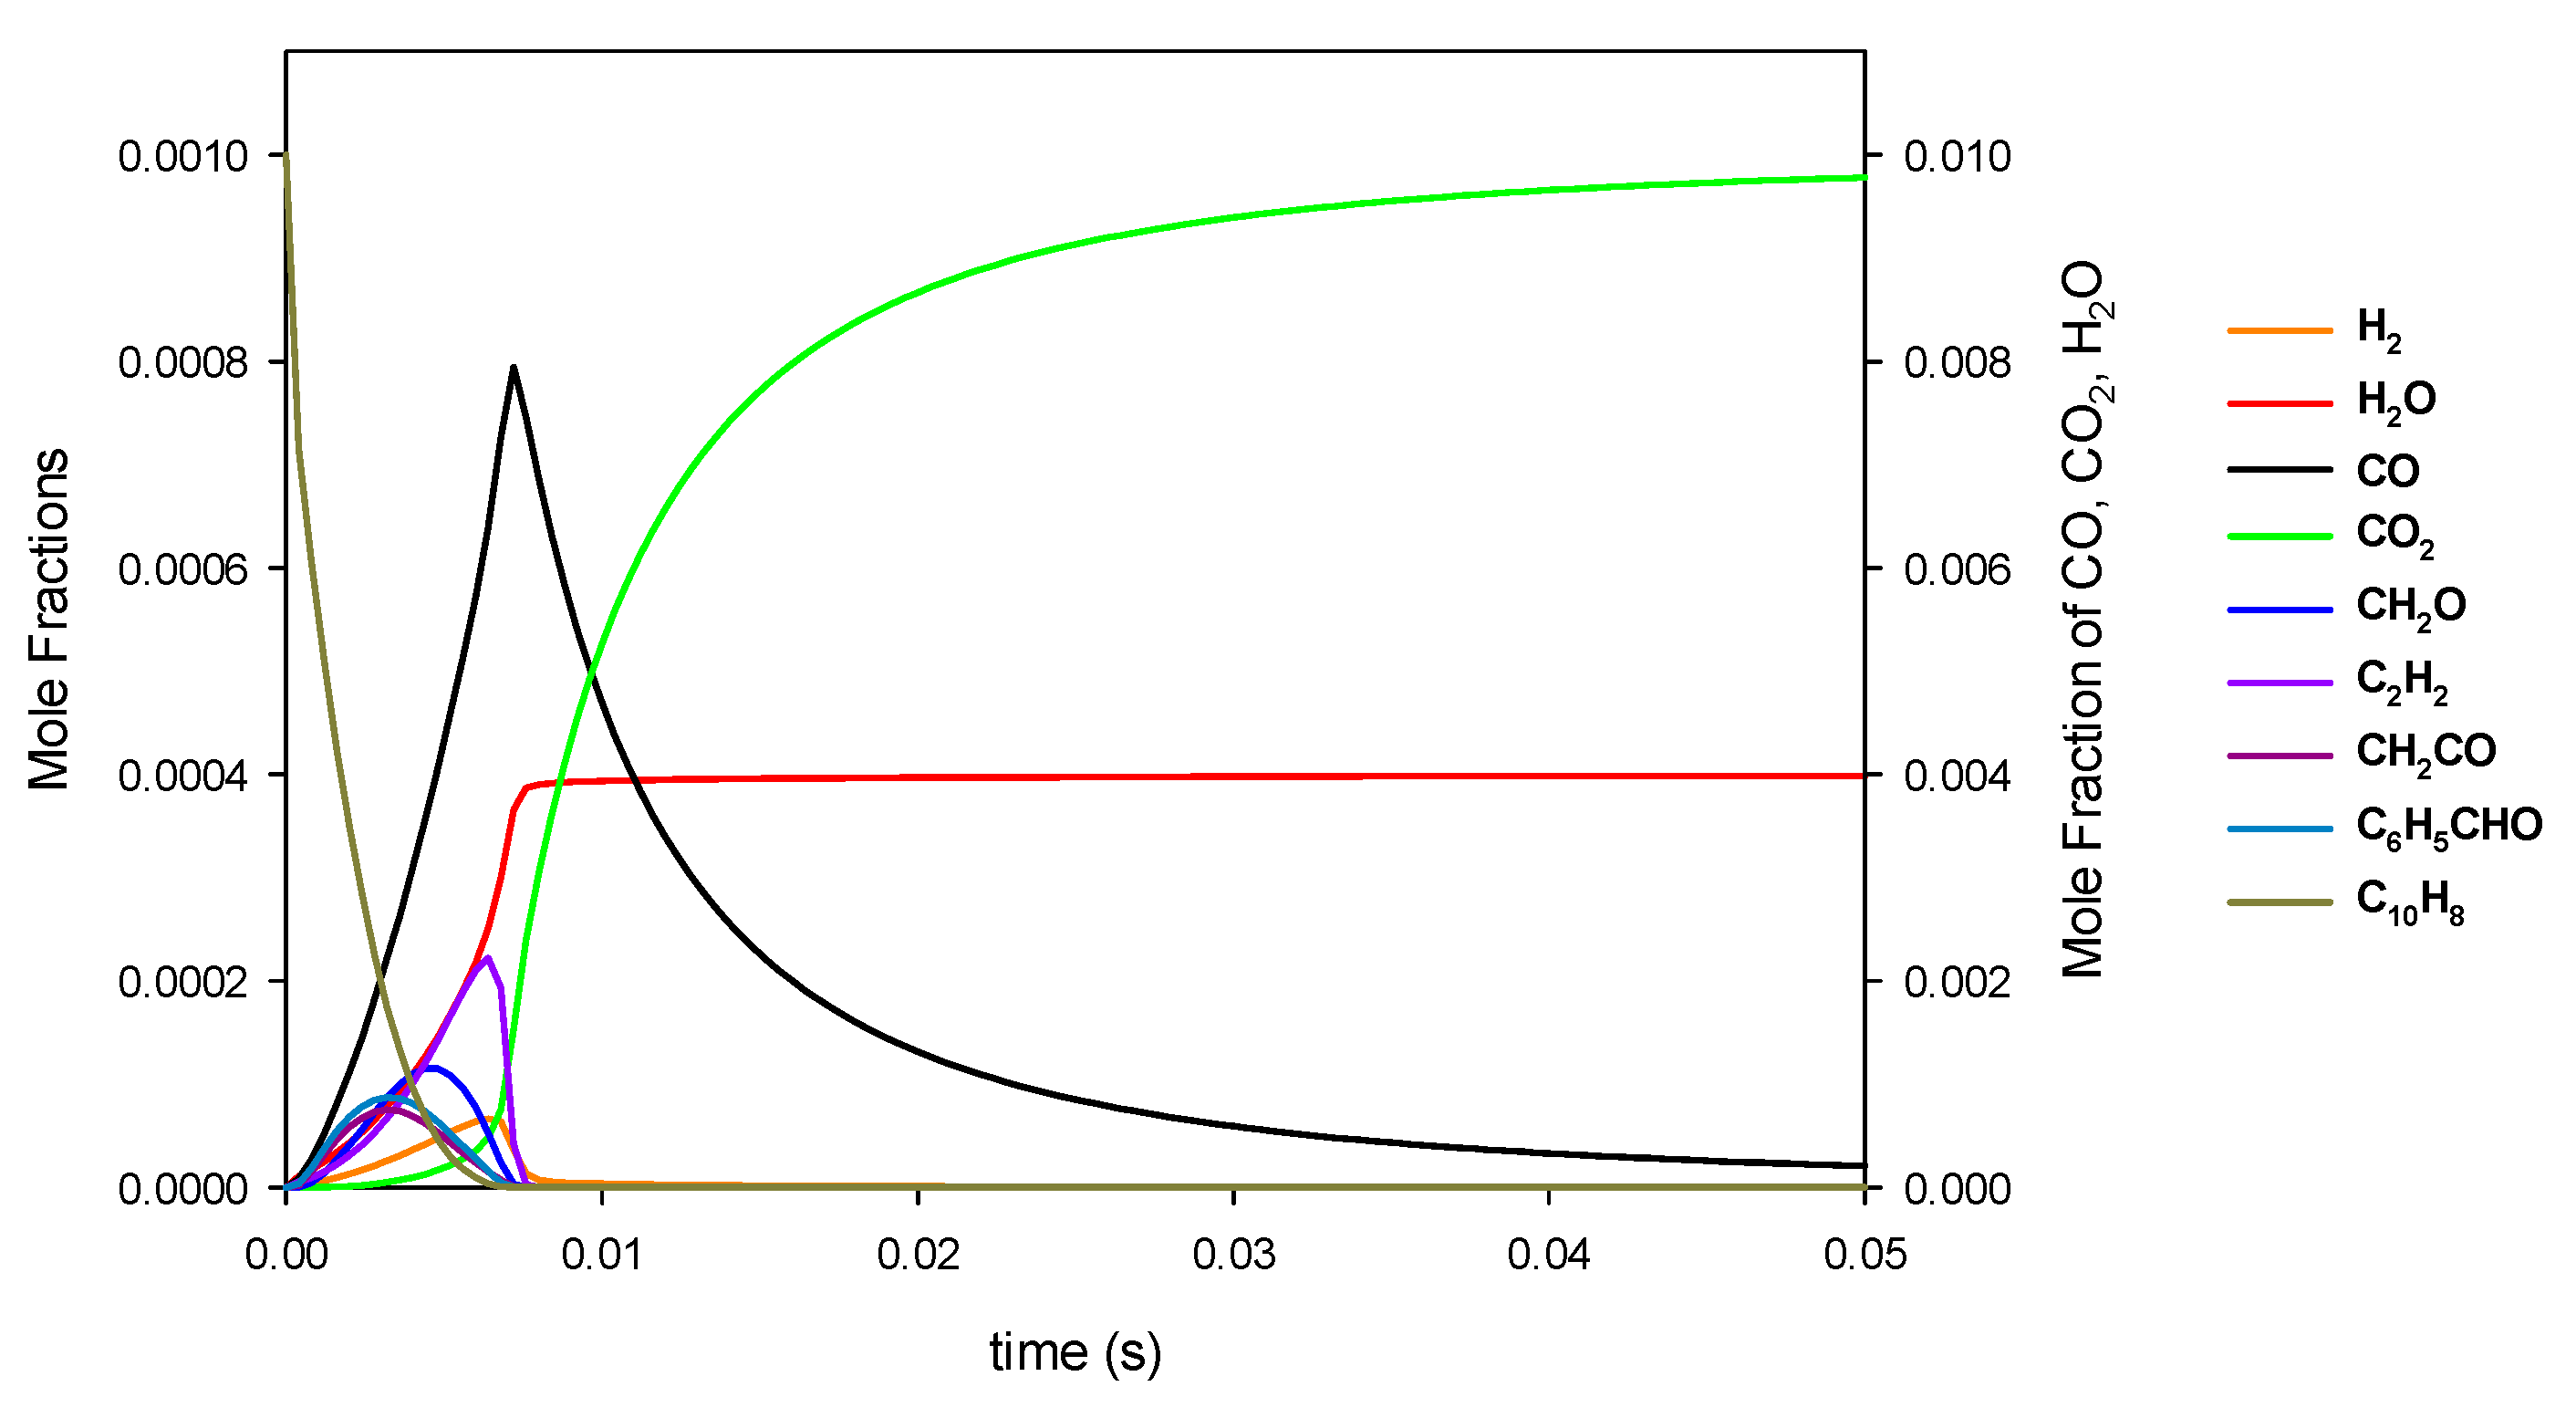
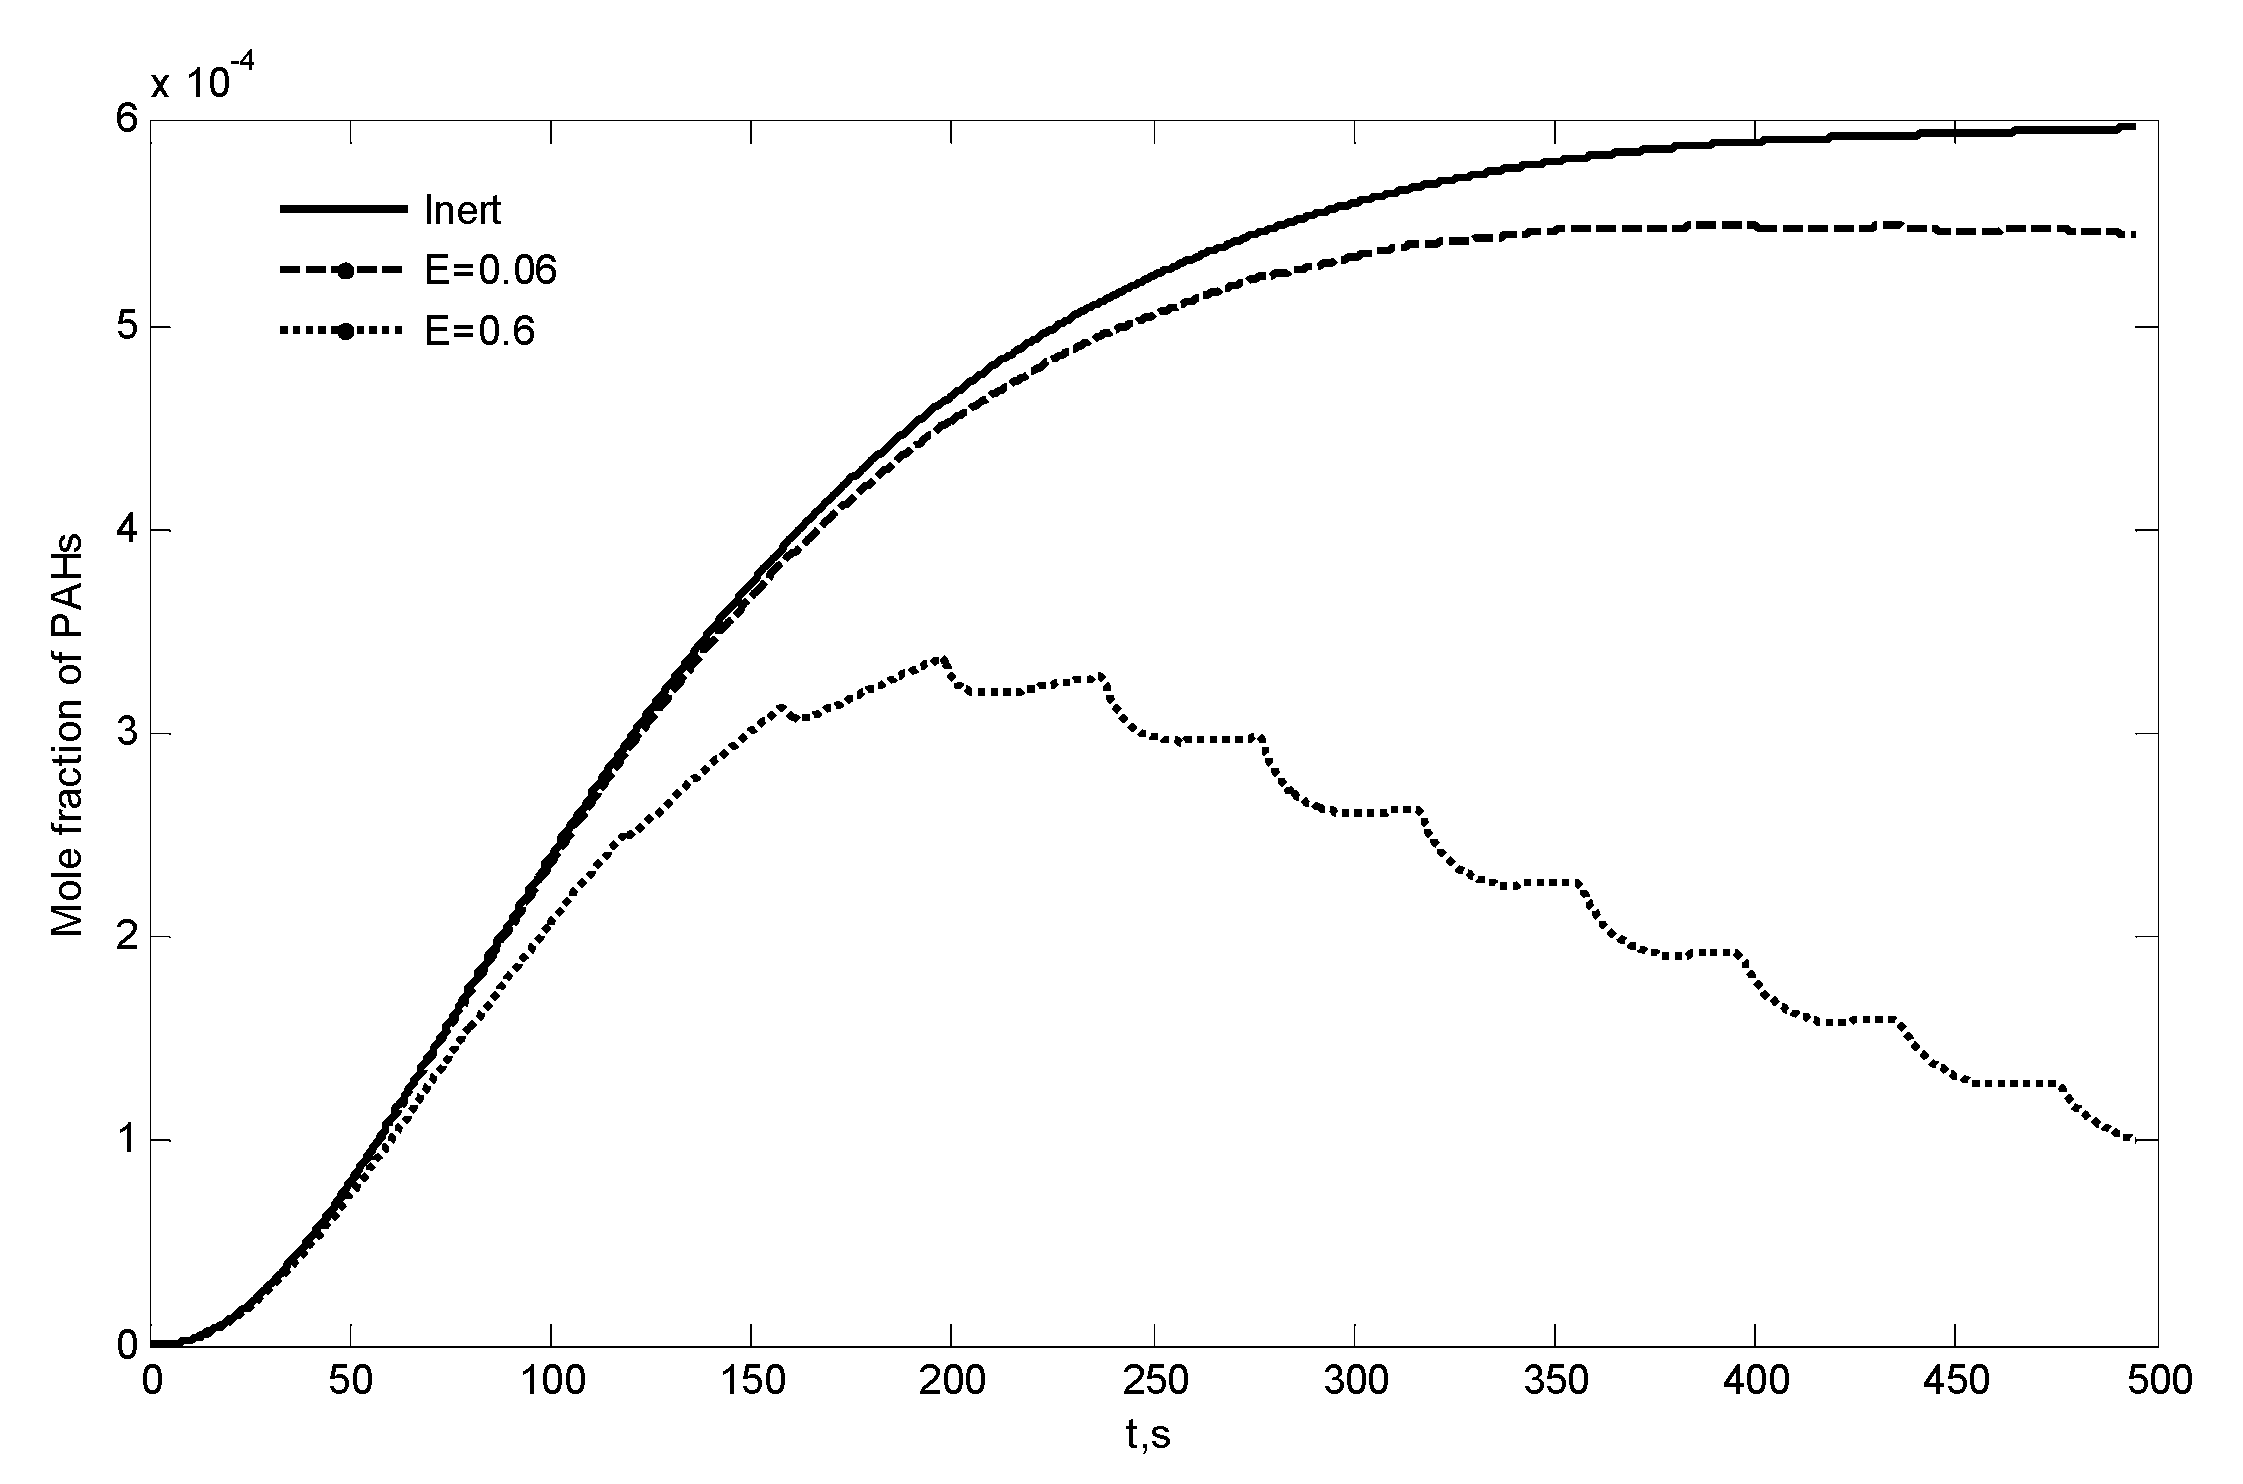
3.4. Combustion of Secondary Tar

Combustion of naphthalene (Figure 8) requires longer times compared to n-hexadecane and n-decene formation of smaller alkenes (C2H6, C3H3) is not evident, whereas CO and H2 seem to be the main products in the first milliseconds. The presence of ketene (CH2CO) is also observed in the initial stages. Formation of CO is completed at 1200 K by 9 ms (against the 3 ms obtained for n-decene and n-hexadecane). At longer times, complete combustion takes on producing CO2 and H2O.

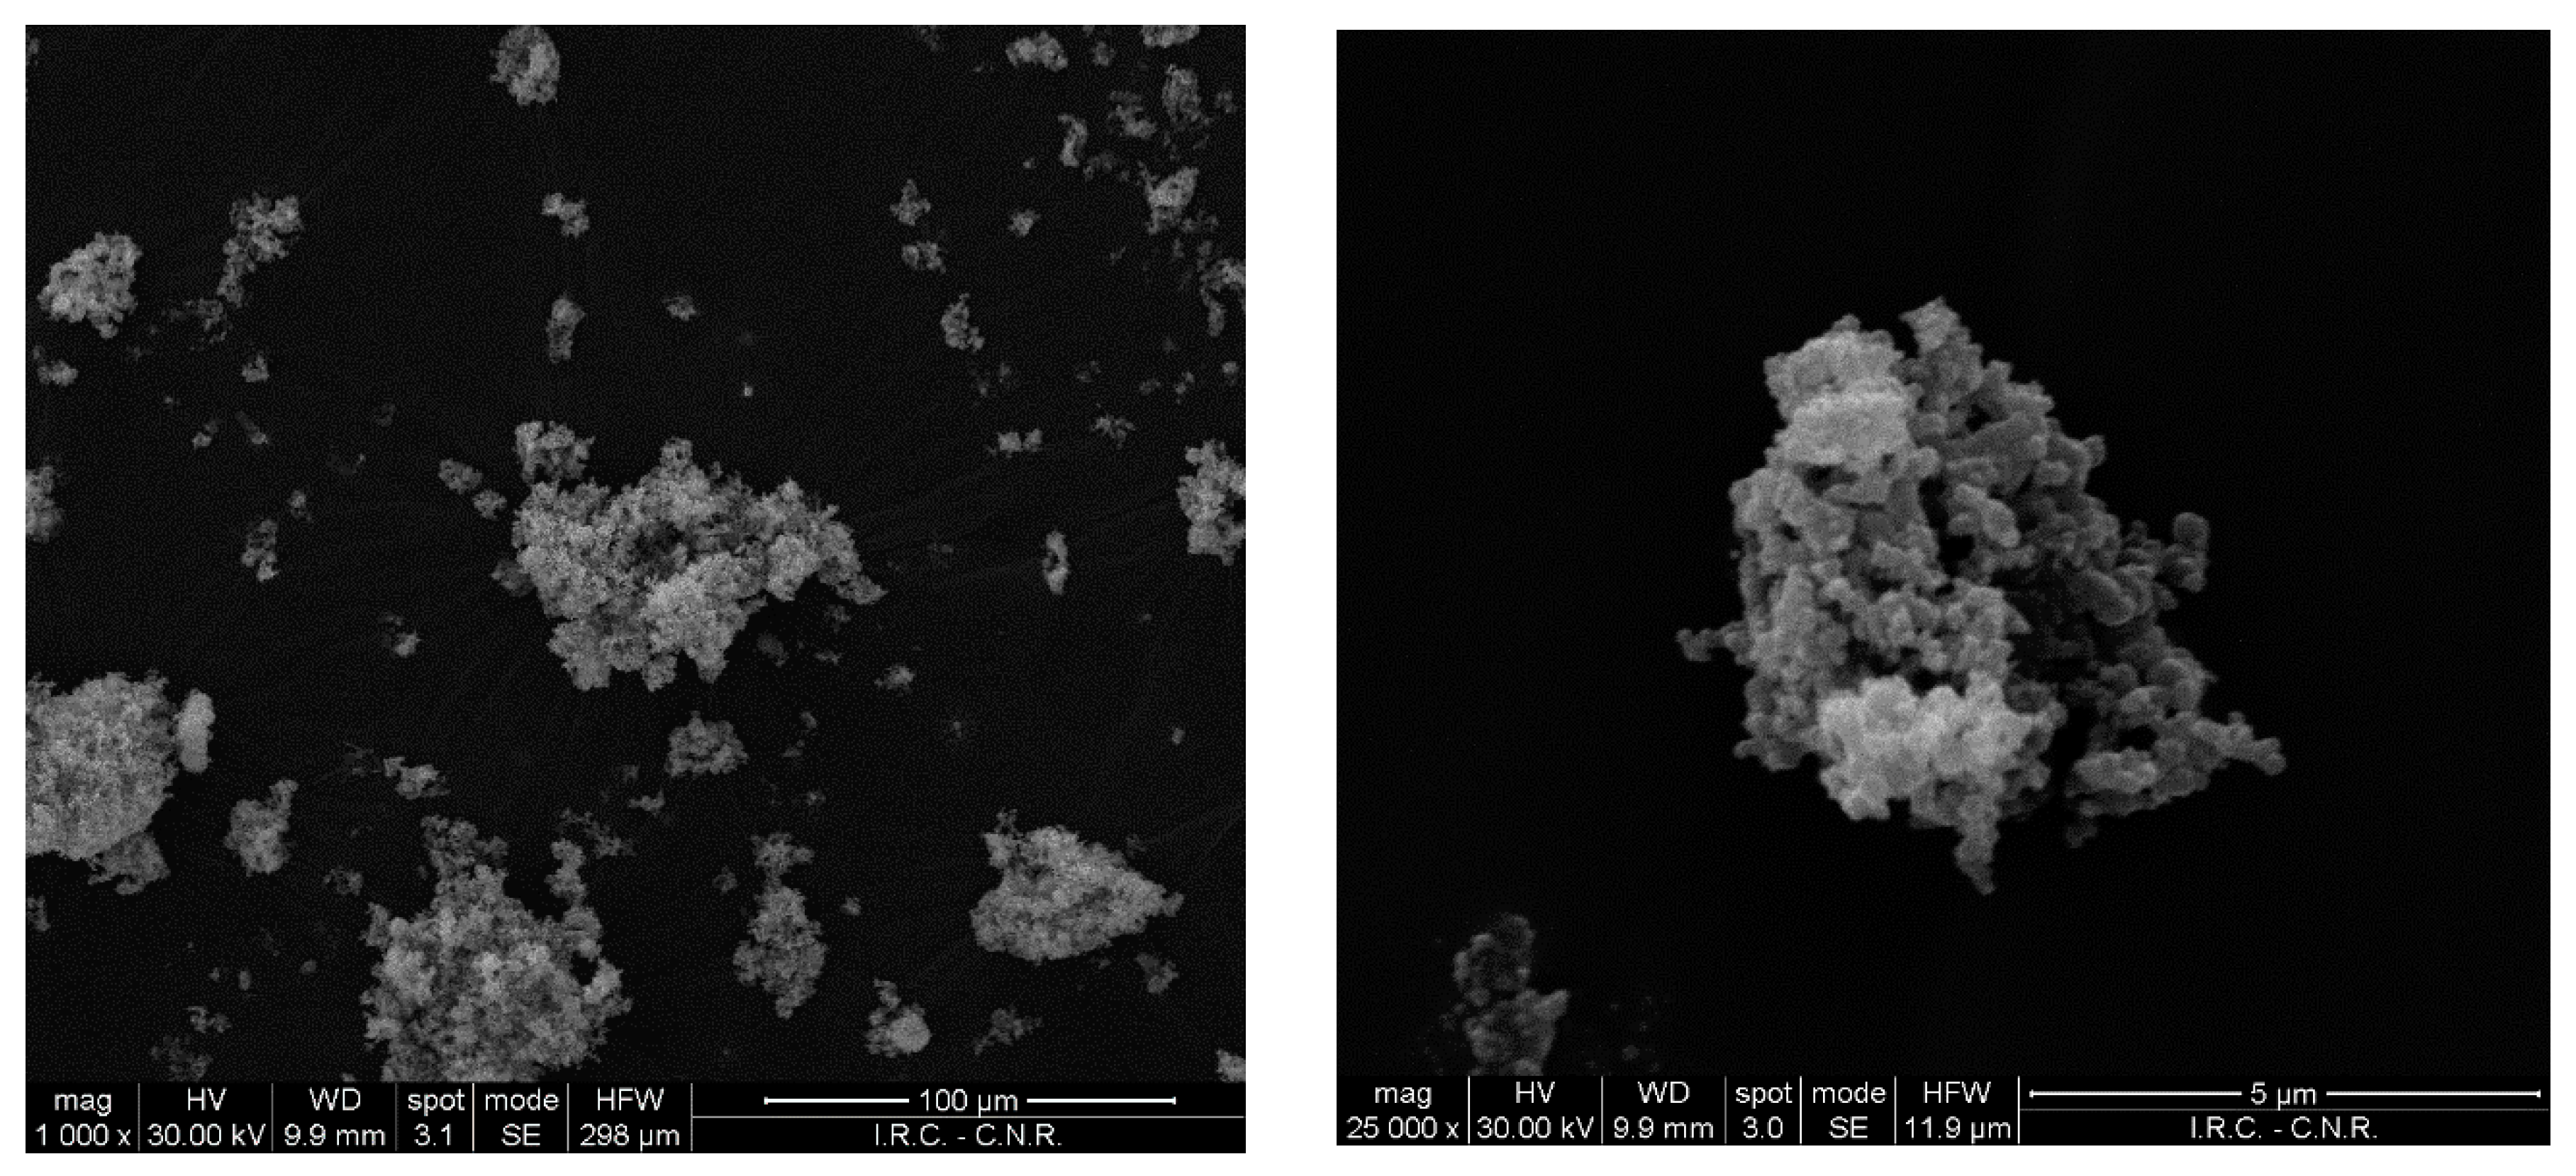
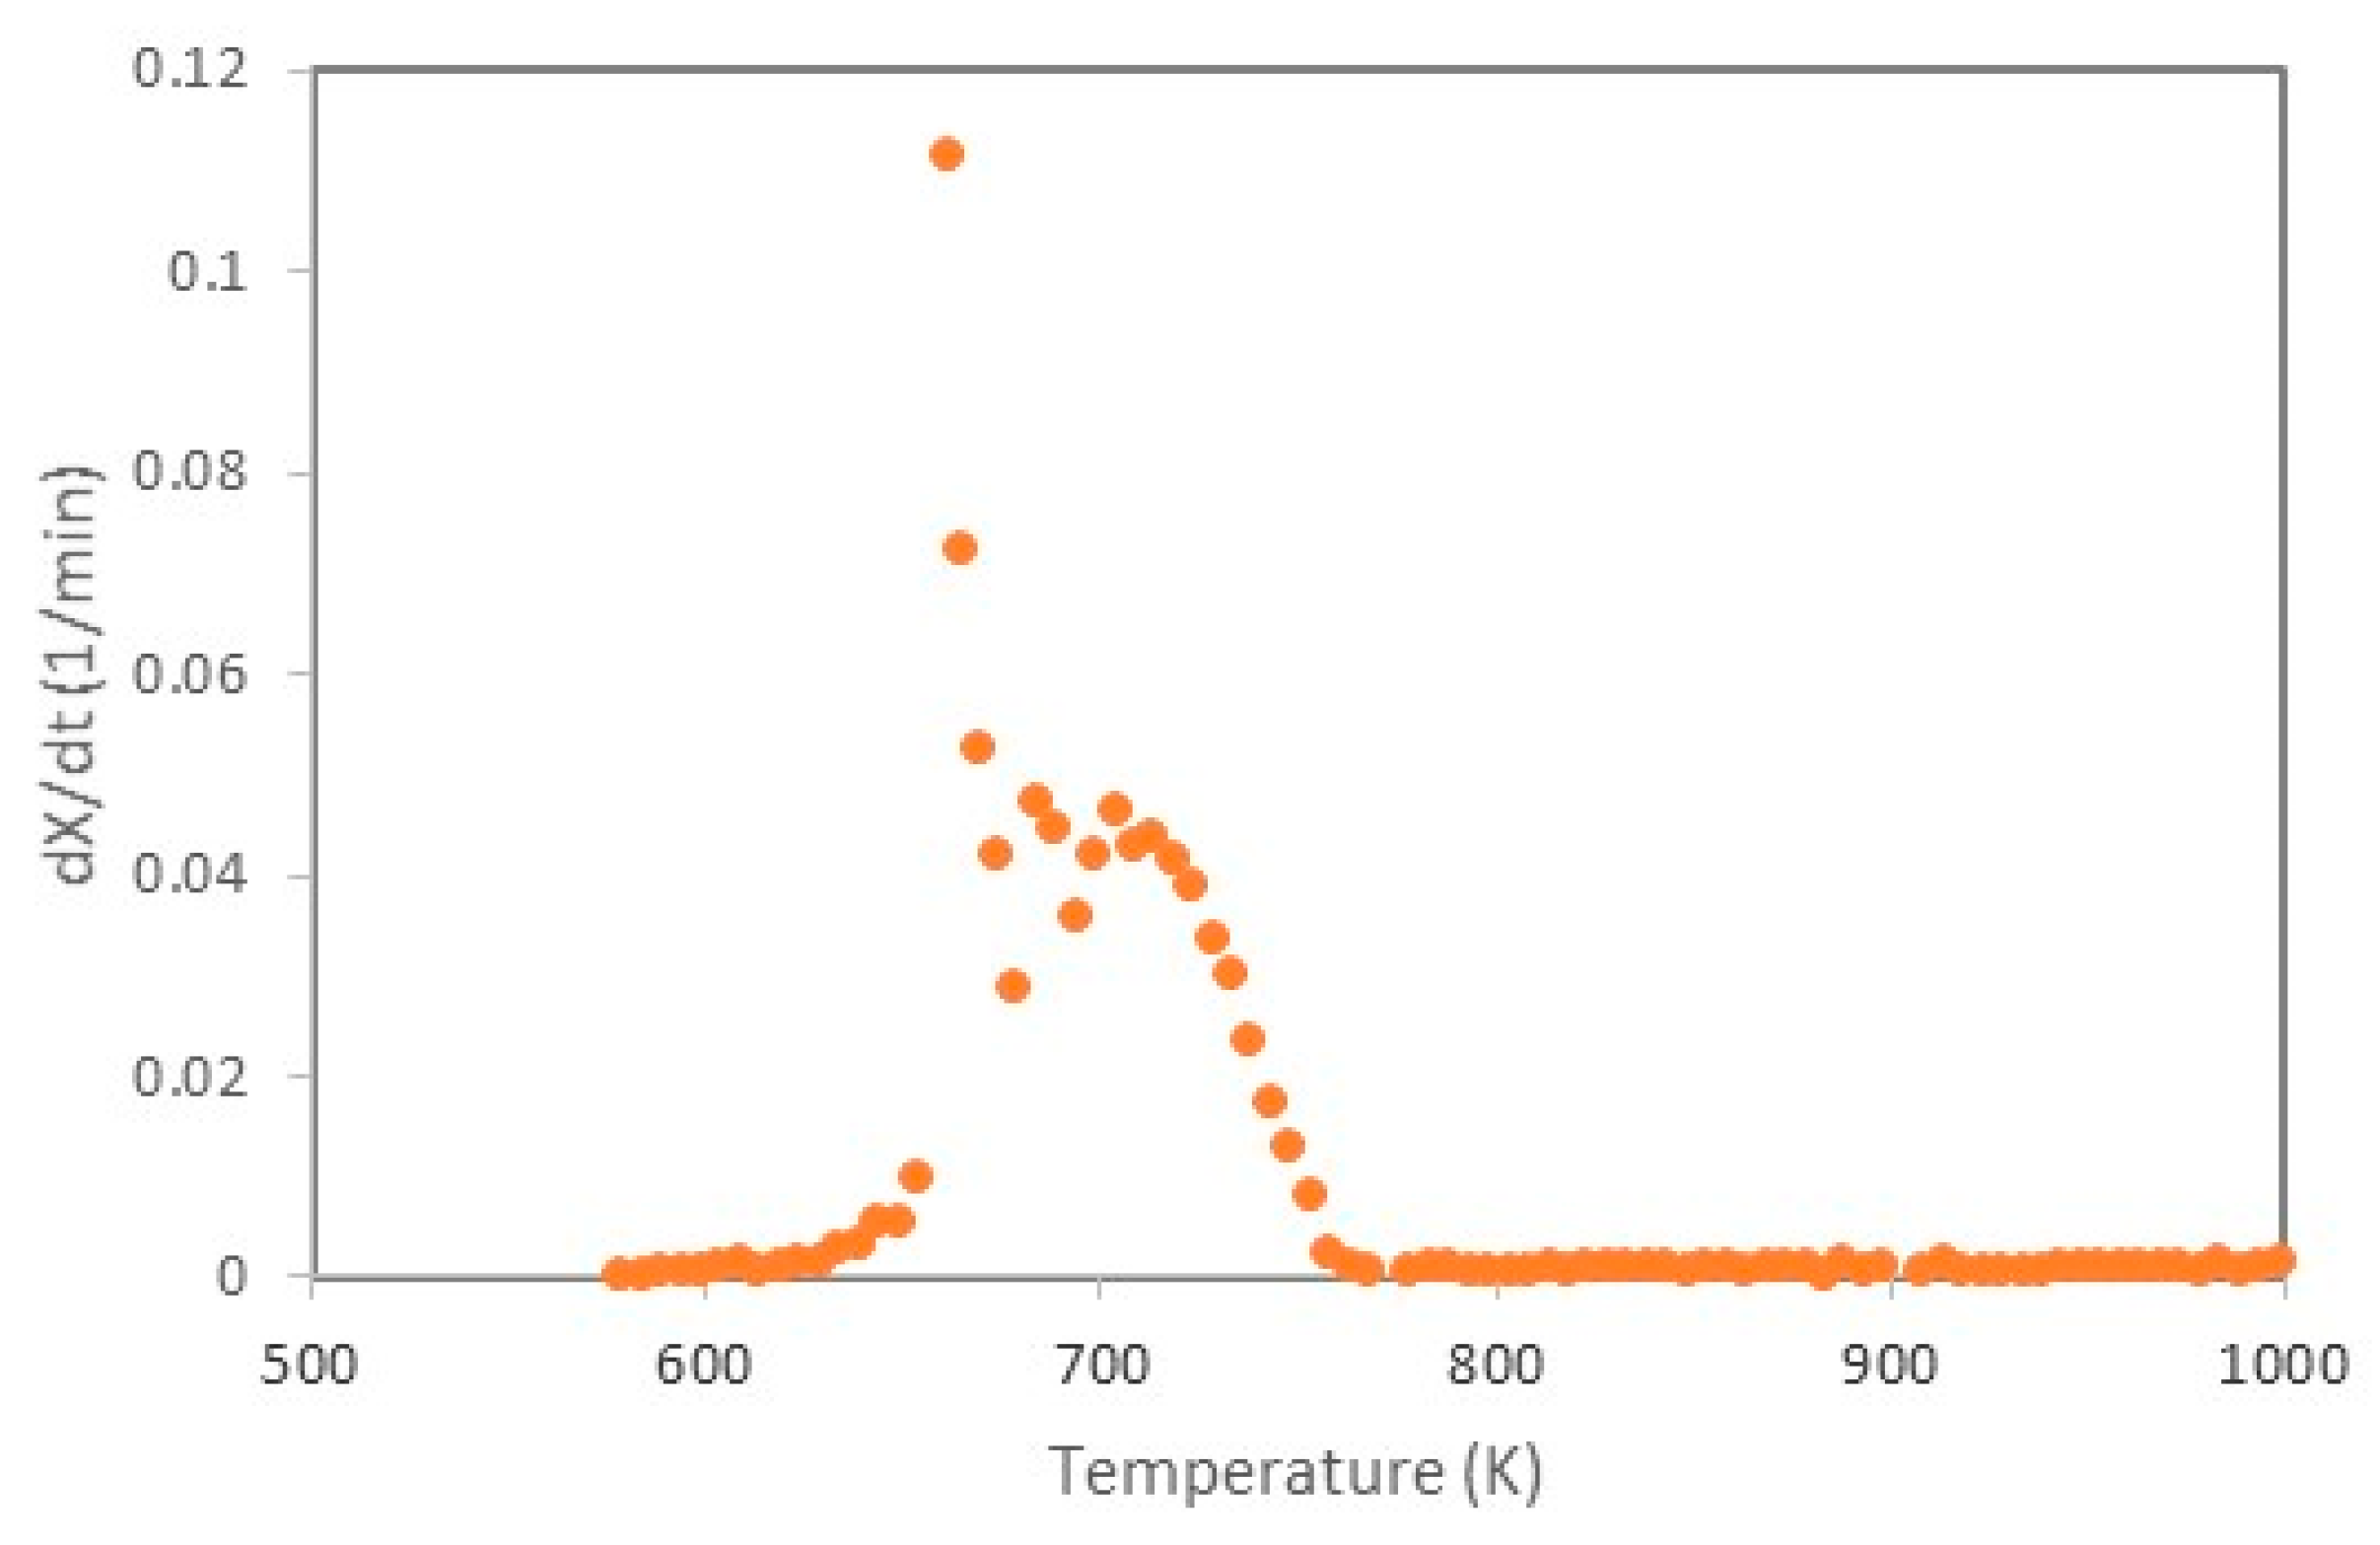
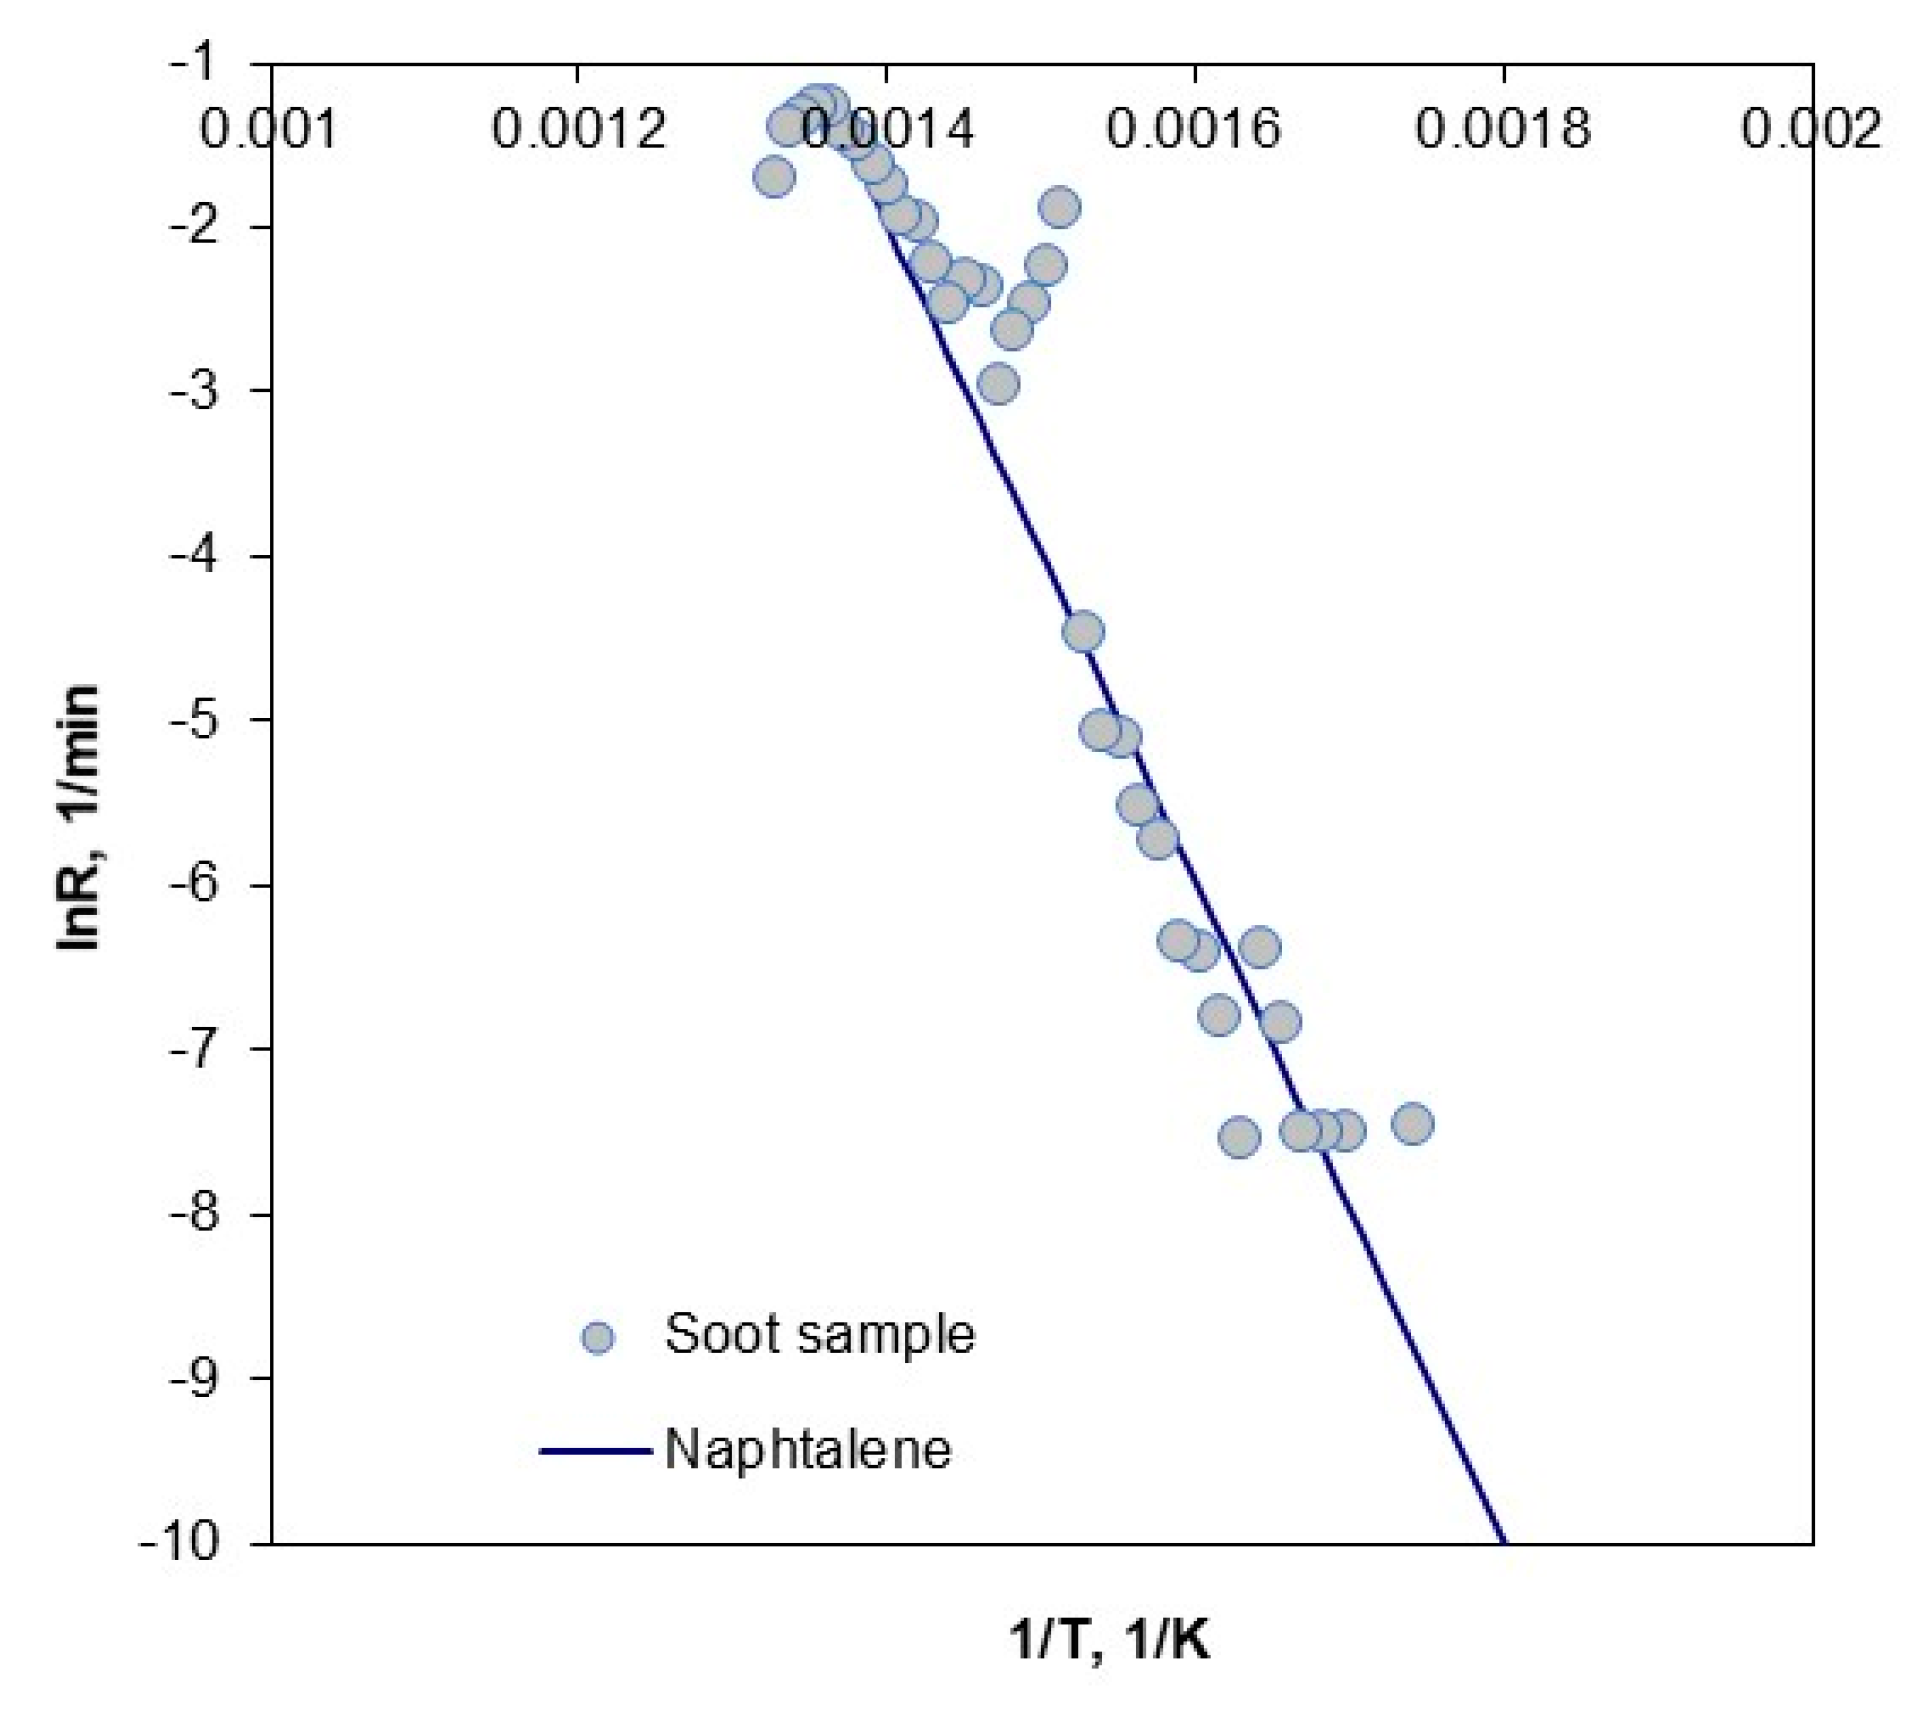
3.5. Combustion of Soot

Figure 9 reports the DTG curve (dX/dt versus T) obtained from thermogravimetric experiment in air on the soot like sample produced from pyrolysis of plastics in rotary kiln. The derivative curve shows a first sharp peak at T = 660 K, followed by a well-resolved peak at 710 K. The first peak accounts for a mass loss of less than 10% and is likely associated to some residual tar survived on the sample. The second peak is more likely due to combustion of the sooty carbon.

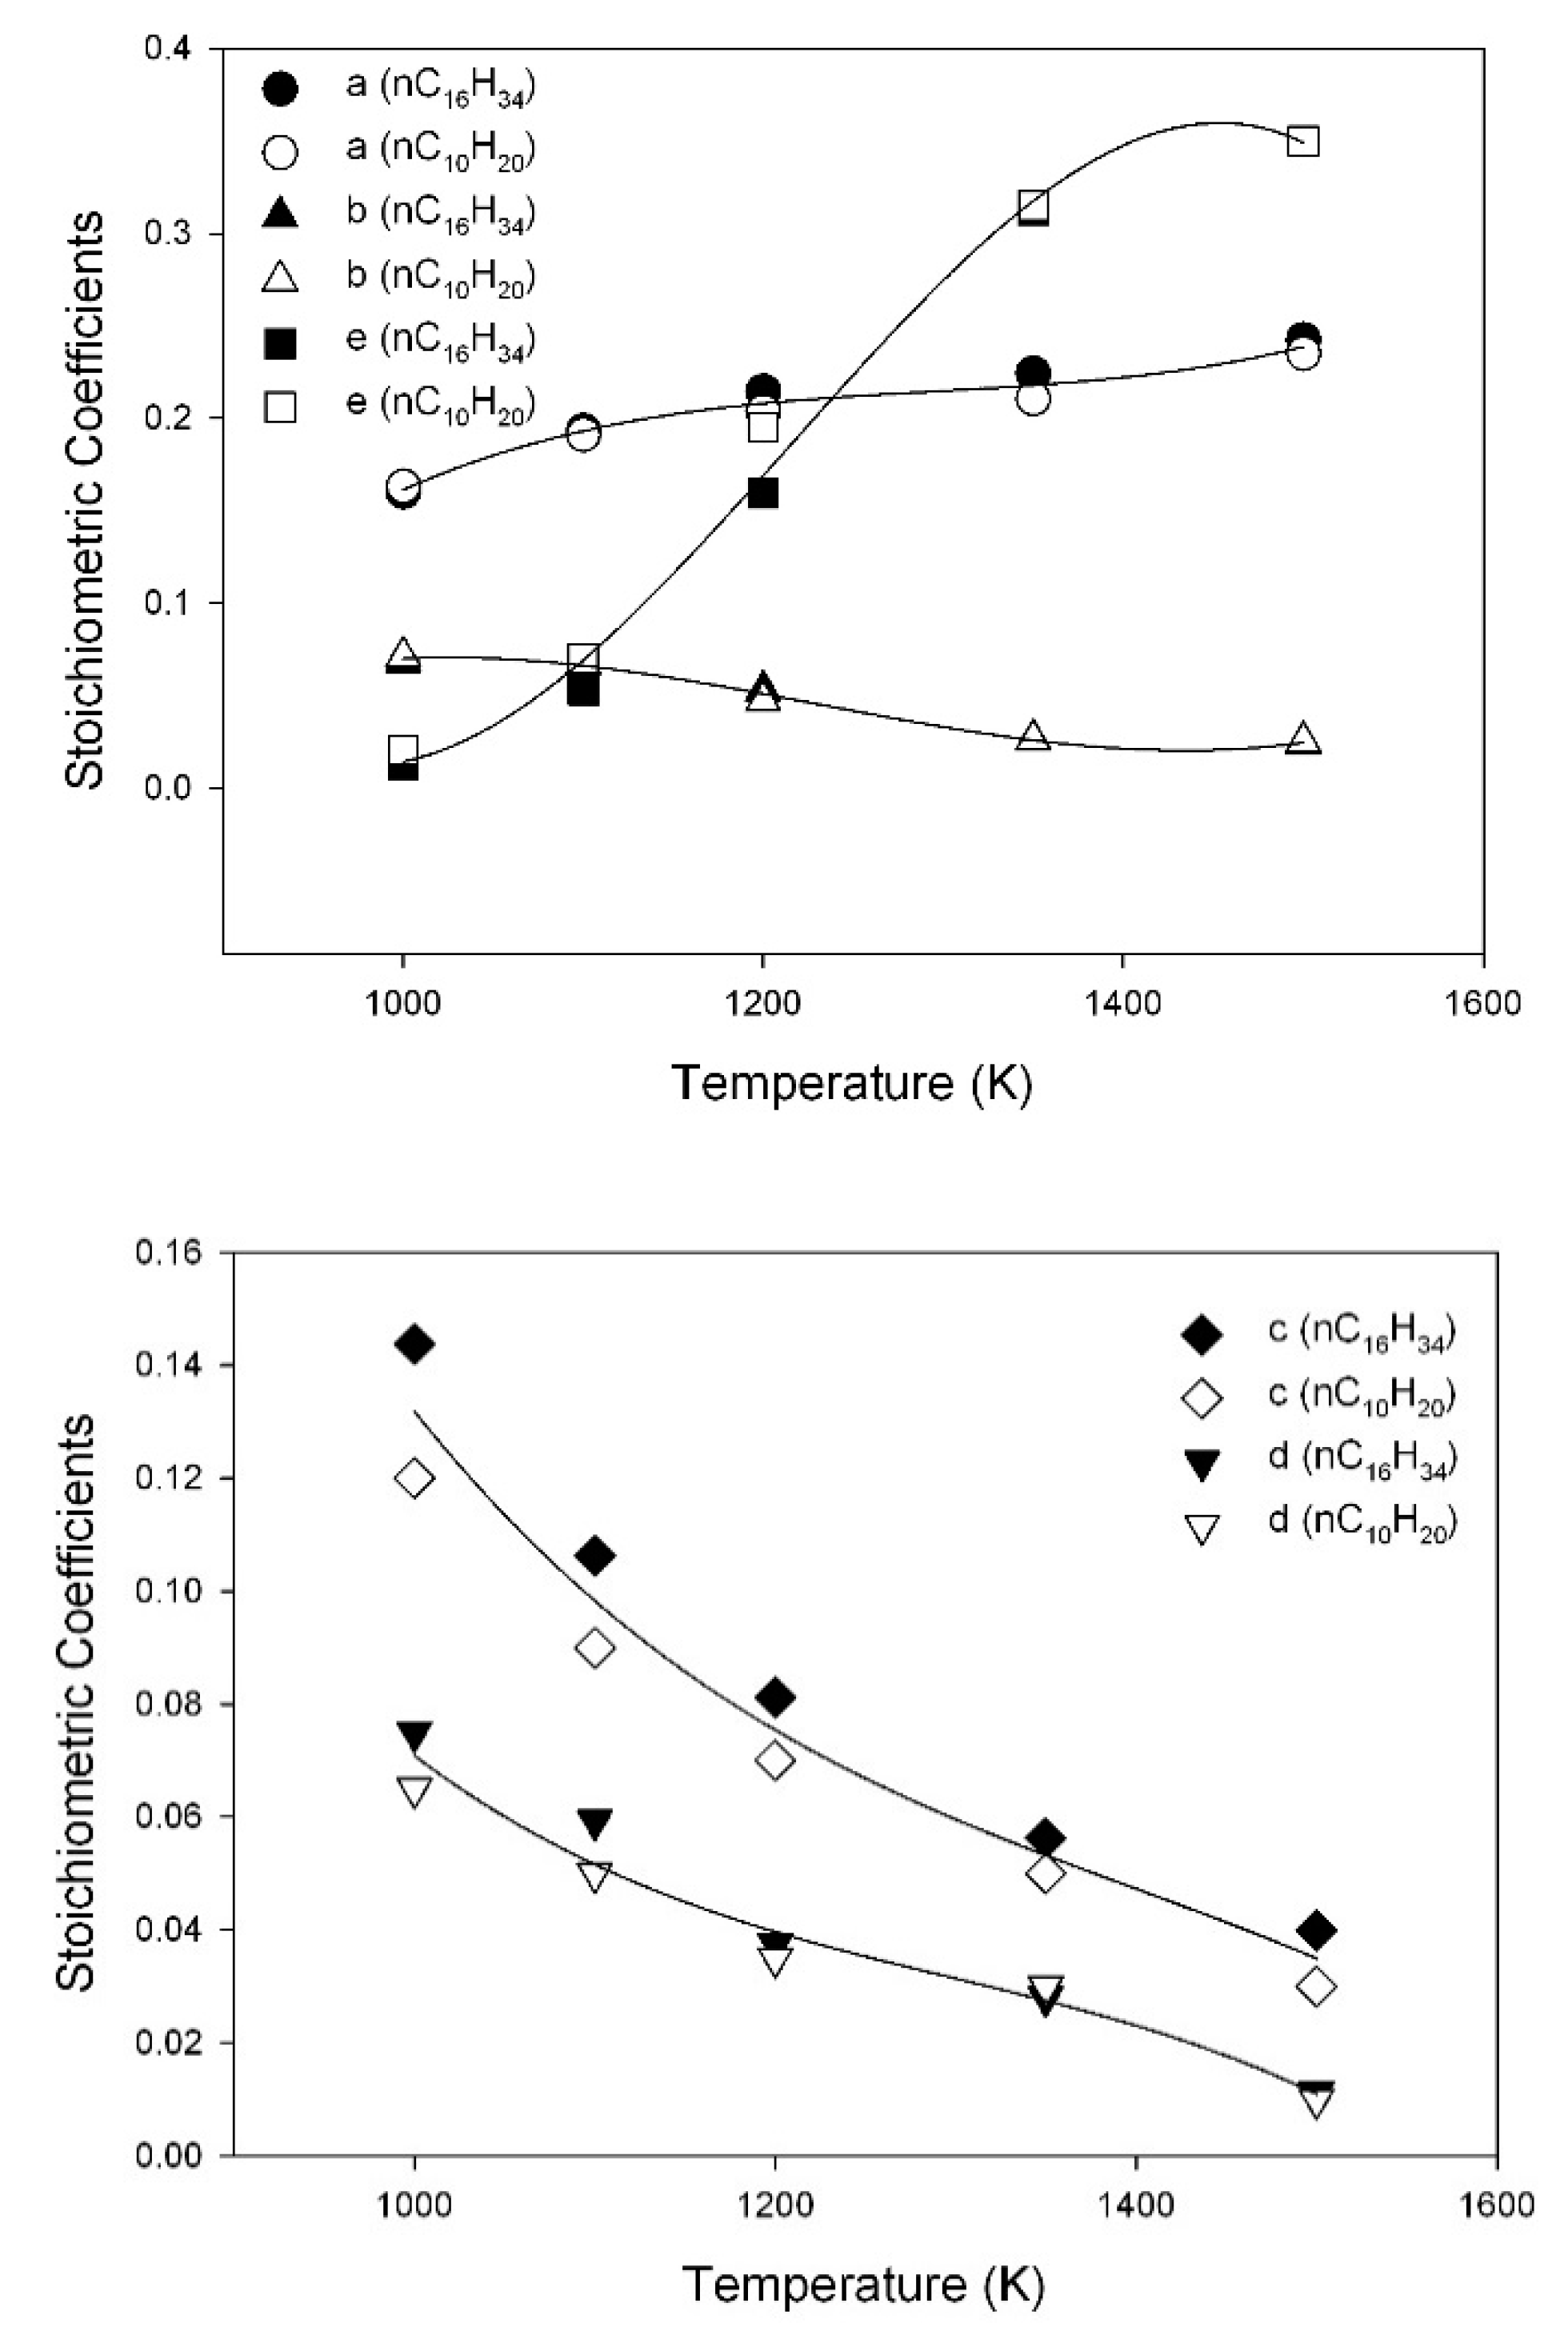
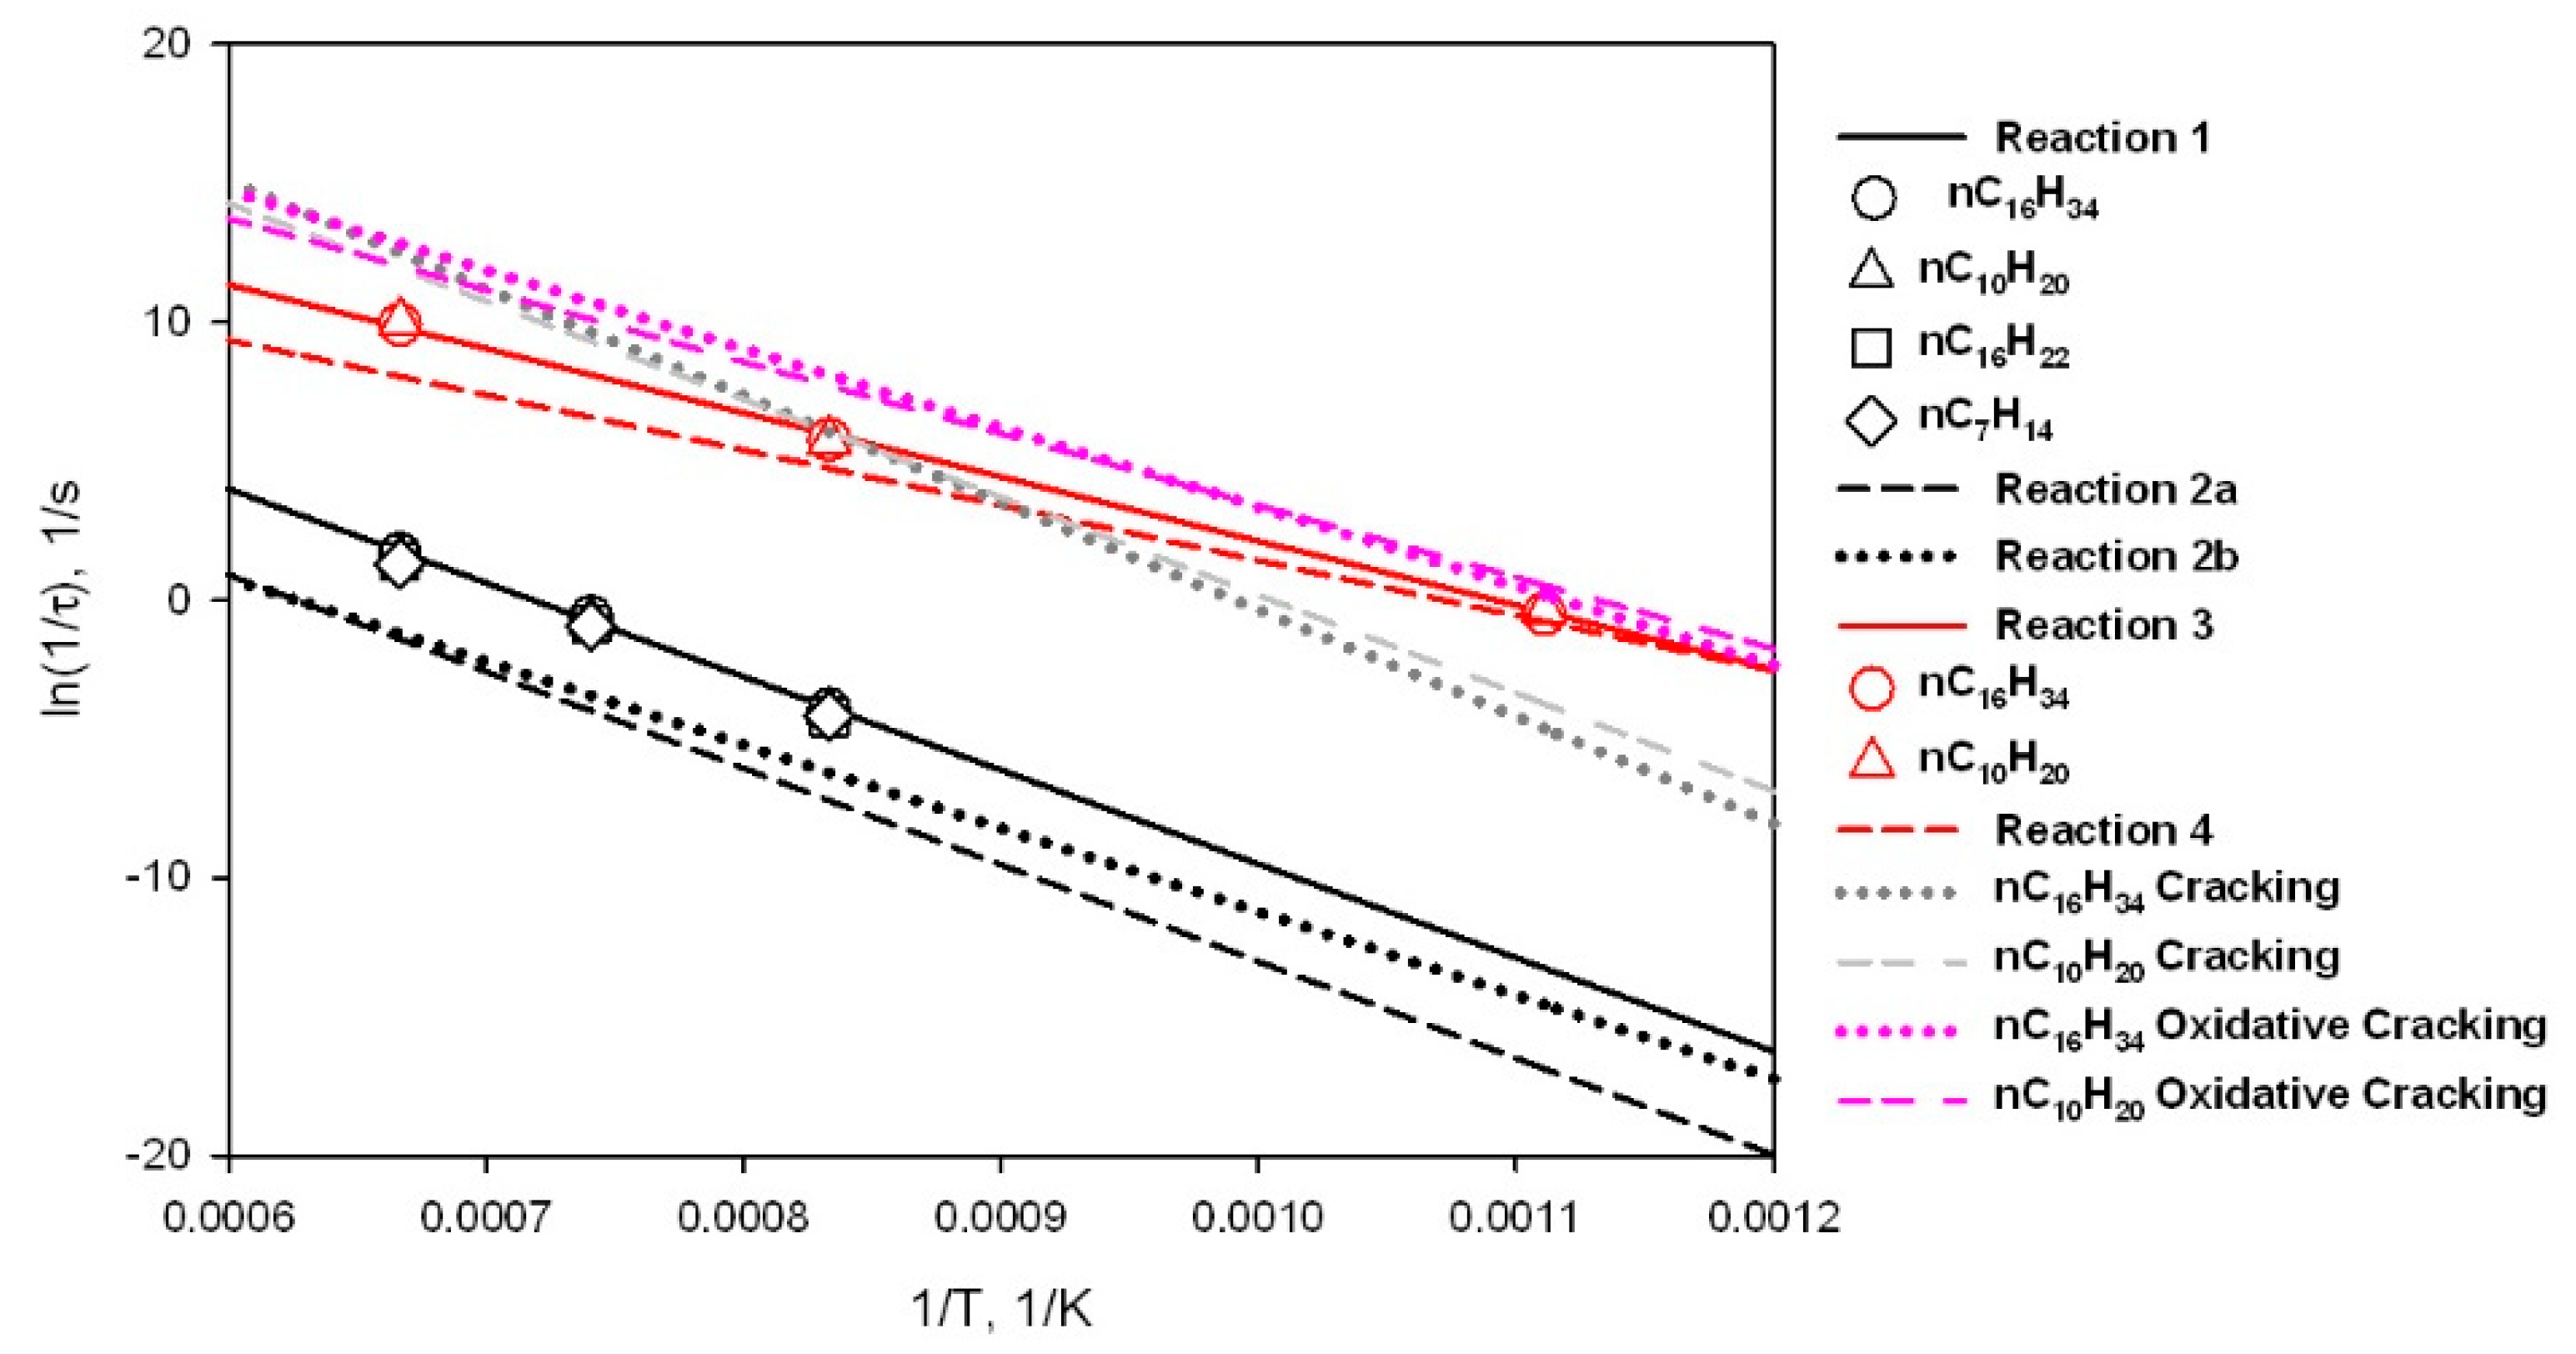
3.6. Assessment of Kinetic Rate Expressions

Results of the computational experiments carried out for different hydrocarbons and operative conditions have been worked out in order to estimate lumped kinetic expressions for the reactions indicated as 1, 2, 3, 4 in Figure 1 and describing, respectively, the formation of aromatics from primary tar (reaction 1), evolution into PAHs/Soot (reaction 2), oxidation of primary (reaction 3), and secondary tar (reaction 4).
A first order approximation of the timescale of reaction 1 (primary tar → secondary tar) has been obtained from the computational experiments of hydrocarbons pyrolysis as the time τ required to reach the maximum concentration of C10H8. This species was selected as representative of secondary tar. It can be observed that this choice is of course arbitrary. Smaller building blocks such as C6H6 might have been chosen as well. Notably, in order to check if this timescale is affected by the length of the original hydrocarbon, we have carried out computational experiments also with smaller alkanes and alkenes, such as nC10H22 and nC7H14. The concentration profiles obtained from these experiments have been worked out by the same procedure to calculate the reaction times τ and results are reported as data points in the Arrhenius plot of Figure 10. It can be observed that the timescale of reaction 1 is very similar for all the alkenes and alkanes investigated, regardless of the length of hydrocarbon, so much so that—for sake of simplicity and within the scope of the present work—a single set of kinetic parameters could be used to describe the rate of reaction 1, regardless of the specificity of primary tar. The solid line plotted in Figure 10 and labeled as reaction 1 is in fact the result of the linear regression performed over the data points relative to all the alkanes and alkenes investigated.
It is worth underlining that, by reaction 1, we mean the formation of aromatics (in particular naphthalene) from the original hydrocarbon. This process must be distinguished from thermal cracking of the original hydrocarbon into smaller fragments, which is in fact a much faster process, and therefore has not been explicitly considered in the reaction scheme of Figure 1, but rather included in reaction 1. In order to check the validity of this approach, the timescale of thermal cracking of hydrocarbons has also been estimated from the computational experiments as the time required to decompose 95% of the original hydrocarbon into smaller alkanes, alkenes, and alkines. At 1200 K, thermal cracking occurs over the timescale of 1 ms (see Figure 3, Figure 4, Figure 5 and Figure 6) for the alkanes and alkenes. The regression line over the data points obtained from the computational experiments for thermal cracking is plotted in Figure 10 as a function of temperature, in order to compare the timescale of thermal cracking with the timescale of reaction 1 over a broad temperature range (the individual data points have not been reported, instead, to improve the readability of the figure). It can be observed that thermal cracking is moderately slower for alkenes than for alkanes, but it is always faster than formation of aromatics (reaction 1) by at least an order of magnitude.
The timescales of Equations (2a) (secondary tar → PAHs) and (2b) (naphthalene + acetylene → PAHs) have been obtained from computational experiments of C10H8 pyrolysis and reaction between C10H8 and C2H2 respectively, as the time τ required to obtain 95% conversion of naphthalene. Results for Equations (2a) and (2b) (for a concentration of acetylene equals to 0.1%) are reported in the Arrhenius plot of Figure 10.
The timescale of oxidation of primary tar and secondary tar (reaction 3 and 4) has been assumed equal to the time required to reach the maximum of CO concentration. Data for reactions 3 and 4 have also been reported in the Arrhenius plots of Figure 10. For primary tar, the timescales evaluated from computational experiments with both n-hexadecane and n-decene and 20% oxygen are shown as data points. It can be noted that the timescale of oxidation of alkanes and alkenes is quite similar (and lower than that of naphthalene by a factor of 10) so much so that for sake of simplicity and within the scope of the present work, a single set of kinetic parameters could be used to describe the timescale of reaction 3, regardless of the specificity of primary tar, similarly to what already suggested for reaction 1. Oxidation reactions 3 and 4 are two-to-three orders of magnitude faster than reactions 1 and 2, suggesting that under oxidative conditions evolution of primary tar into PAHs would be prevented by combustion. It is worth underlining that, by reaction 3–4, we mean the formation of CO from original hydrocarbon. This process must be distinguished from thermal cracking of the hydrocarbon into smaller fragments, which occurs in the first instances of reaction. The timescale of thermal cracking of hydrocarbons under oxidative conditions has also been calculated from the computational experiments under oxidative conditions as the time required to decompose 95% of the original hydrocarbon into smaller species. The result of linear regression over these results is also plotted in the Arrhenius plot of Figure 10 (again the individual data points have not been reported to improve the readability of the figure). It can be observed that oxidative cracking is moderately faster than cracking under inert conditions at the lower temperatures investigated. Differences level off at 1500 K. For both alkenes and alkanes, oxidative cracking is faster than the oxidation reaction 3 by an order of magnitude, and therefore can be included in reaction 3.
Regression over experimental results allowed estimating kinetic expressions of each reaction assuming a typical Arrhenius law. The kinetic parameters are reported in Table 2 and have been used to calculate the rates shown as solid lines Figure 10. Notably for the combustion reactions, the dependence of the rate of reaction from oxygen concentration has been found negligible for values of oxygen concentration above 20% consistently with the fact that only minor differences have been observed in the overall rate of combustion form computational experiments with different, but large values of O2 concentration. At much lower values of oxygen, the dependence of the rate of combustion from oxygen concentration is instead relevant.
The rate of reaction 5 of soot combustion has been obtained from results of TGA on the carbon rich sample recovered from pyrolysis in the rotary kiln. The Arrhenius plot obtained from TGA is reported in Figure 11. The same figure reports also the rate of naphthalene combustion obtained from computational experiment. Interestingly the rate of soot combustion from TGA and the rate of naphthalene combustion from computational experiments nicely overlap, for this reason the same kinetics have been used in the model for reactions 4 and 5.

4. Discussion

In order to check the ability of the simplified kinetics of scheme in Figure 1, to predict PAHs and soot formation, calculations have been performed in MATLAB of the fate of nC16H34 at different temperature and holding times. Oxidizing vs. inert conditions have also been considered. For a stirred tank reactor (STR) or equivalently a plug flow reactor (PFR), the following set of equations applies when the reaction scheme of Figure 1 is used. The change of overall volume due to reaction is neglected since very diluted conditions are considered:
d x C 16 H 34 d t = k 1 e x p ( E 1 R T ) x C n H m k 3 e x p ( E 3 R T ) x C 16 H 34 x O 2 α
d x C 10 H 8 d t = n b k 1 e x p ( E 1 R T ) x C 16 H 34 k 2 a e x p ( E 2 a R T ) x C 10 H 8 k 2 b e x p ( E 2 b R T ) x C 10 H 8 x C 2 H 2 0.5 k 4 e x p ( E 4 R T ) x C 10 H 8 x O 2 α
d x C 2 H 2 d t = n e k 1 e x p ( E 1 R T ) x C 16 H 34 5 k 2 b e x p ( E 2 b R T ) x C 10 H 8 x C 2 H 2 0.5 k 3 e x p ( E 3 R T ) x C 2 H 2 x O 2 α
d x P A H d t = 0.5 k 2 a e x p ( E 2 a R T ) x C 10 H 8 + k 2 b e x p ( E 2 b R T ) x C 10 H 8 x C 2 H 2 0.5 k 4 e x p ( E 4 R T ) x P A H x O 2 α
d x O 2 d t = 16.5 k 3 e x p ( E 3 R T ) x C 16 H 34 x O 2 α 7 k 4 e x p ( E 4 R T ) x C 10 H 8 x O 2 α 1.5 k 3 e x p ( E 3 R T ) x C 2 H 2 x O 2 α 12.5 k 4 e x p ( E 4 R T ) x P A H x O 2 α
The stoichiometric coefficients and kinetic parameters reported in Table 1 and Table 2 have been used in the calculations.
The maximum value of PAHs predicted under inert conditions are reported in Figure 12 as a function of holding time and temperature and compared with the corresponding results obtained using the original comprehensive kinetic scheme of Ranzi and coworkers with 6307 reactions [33]. For a holding time of 1 s, typical of flow reactors, the simplified and the comprehensive kinetic schemes provide results in good agreement. The PAHs concentration increases with temperature up to 1500 K and then decreases as a result of the competitive effect of PAHs and C2H2 formation. For holding times of 10 s and 100 s, more typical of fixed beds, both the simplified and the comprehensive kinetic schemes predict higher values of the PAHs’ maximum and a shift towards lower temperatures. The simplified model apparently underestimates the amount of PAHs at large residence times and high temperature, probably because the simplified model considers only the main path of formation of PAHs, that is from naphthalene and acetylene, whereas the comprehensive kinetic schemes include also other paths of formation which become more important the longer the holding time and the higher the temperature.
Under oxidative conditions, the formation of PAHs decreases thanks to the competition between reactions leading to PAHs formation (reactions 1 and 2) and combustion reactions (reactions 3 and 4). Figure 13 compares the formation of PAHs at 1200 K under inert conditions with formation of PAHs when oxygen is fed to the reactor, together with C16H34 at the reactor inlet, or distributed along the reactor. The molar fraction of nC16H34 in the feed is fixed at 0.001, and the oxygen molar fraction is either 0.001 or 0.01. In both cases the feed of oxygen is understoichiometric: 6% and 60% of the oxygen necessary for oxidation of nC16H34 to CO and H2O are fed respectively (E   = 0.06   a n d   0.6 ) . In the first case, the amount of the PAHs formed under inert conditions is reduced by 6% and in the second case it is reduced by 60%. Figure 14 shows the case of oxygen being added in 13 steps throughout the reaction time/reactor length, keeping the same cumulative amount of fed oxygen. The idea is to investigate the effect of ineffective mixing with alternation of inert and oxidative regions or the case of purposely distributed oxygen feed. It can be observed that PAHs initially increase but eventually are consumed by combustion reactions. The decrease of PAHs compared to inert conditions is approximately 10% and 85% when oxygen is distributed; therefore, it is larger than in the case of a single oxygen feed. Results can be explained by the fact that the presence of oxygen does not only consume PAHs but to some extent prevents its very formation throughout the process.

5. Conclusions

Laboratory and computational experiments carried out in present work did not aim to a detailed speciation of the gaseous and liquid products of pyrolysis of plastics, but rather to investigate the possibility of formation of PAHs and soot from primary pyrolysis tar over its residence time in a reactor where fuel rich conditions establish or where incomplete mixing determines fuel rich/fuel lean regions. Primary tar was considered to be constituted mainly by aliphatics. n-hexadecane and n-decene were chosen as representative compounds but similar results have been obtained regardless of the length of the alkanes and alkenes. After a very fast cracking event, all alkanes and alkenes undergo a similar destiny: in the absence of oxygen they evolve into progressively larger aromatics and over prolonged time into PAHs and soot. Naphthalene can be assumed as representative of small aromatic-intermediate products. The timescale of initial aromatization is similar for the different alkanes and alkenes considered and drops from 100 s at 1200 K to 0.2 s at 1500 K. The timescale of further evolution into larger aromatics is larger by approximately a factor of 10. Similar yields in reaction products as a function of temperature have also obtained when they are normalized with respect to the number of carbon and hydrogen atoms of the parent fuel. Oxidation reactions of primary (reaction 3) and secondary tar (reaction 4) are order of magnitude faster than reactions 1 and 2 respectively, therefore evolution of the young aliphatic tar into aromatics is prevented as long as gaseous oxygen is available for oxidation. Similarly, combustion of young aromatic is always much faster and favored over reactions of PAH formation, provided oxygen is available for oxidation.
From the kinetic point of view evolution of primary tar into secondary tar and ultimately into PAHs can be described by two consecutive lumped reactions each characterized by first order kinetics, with activation energy in the order of 67–69 kcal/mol and different pre exponential factors. Oxidation reactions are also described by power law kinetics, with activation energy of 46 kcal/mol. The reaction order with respect to oxygen is 1.4–1.5 at low values of oxygen concentration. An increase of oxygen concentration above 20% does not have further effect on the rate of combustion.
The lumped kinetic model has been used to estimate the tendency to produce PAHs and soot in different conditions and, in particular, to highlight the effect of different modes of oxygen feeding and of incomplete mixing of fuel and oxygen. The simplified approach proved to be a good alternative to comprehensive kinetic models up to 1400 K and for relatively small residence times as far as the propensity to for PAHs and soot is concerned. At higher temperature and long residence times, the simplified model still provides reasonable qualitative trends but formation of PAHs and soot is underestimated compared to more comprehensive kinetic schemes.

Author Contributions

O.S.: conceptualization, writing original draft, writing review and editing, supervision, methodology. T.T.: investigation, conceptualization, data curation. All authors have read and agreed to the published version of the manuscript.

Funding

Funding within the project PON BIOFEEDSTOCK ARS01_00985 (Sviluppo di piattaforme tecnologiche integrate per la valorizzazione di biomasse residuali) is gratefully acknowledged.

Acknowledgments

The soot sample was supplied by Giovanna Ruoppolo and Paola Ammendola who sampled it during their own experimental campaigns. Discussions and suggestions with Piero Salatino, Fabio Mantagnaro, Claudio Tregambi, Giovanna Ruoppolo, Paola Ammendola and Riccardo Chirone are gratefully acknowledged.

Conflicts of Interest

The authors declare no conflict of interest.

References

  1. Fivga, A.; Dimitriou, I. Pyrolysis of plastic waste for production of heavy fuel substitute: A techno-economic assessment. Energy 2018, 149, 865–874. [Google Scholar] [CrossRef]
  2. Sharuddin, S.D.A.; Abnisa, F.; Daud, W.M.A.W.; Aroua, M.K. Pyrolysis of plastic waste for liquid fuel production as prospective energy resource. IOP Conf. Ser. Mater. Sci. Eng. 2018, 334. [Google Scholar] [CrossRef]
  3. Antelava, A.; Pallari, E.; Manos, G.; Constantinou, A. Design and limitations in polymer cracking fluidized beds for energy recovery. Plast. Energy Fuel Chem. Sustain. Implic. 2018, 221–231. [Google Scholar] [CrossRef]
  4. Al-Salem, S.M. Feedstock and optimal operation for plastics to fuel conversion in pyrolysis. Plast. Energy Fuel Chem. Sustain. Implic. 2018, 117–146. [Google Scholar] [CrossRef]
  5. Czajczyńska, D.; Anguilano, L.; Ghazal, H.; Krzyżyńska, R.; Reynolds, A.J.; Spencer, N.; Jouhara, H. Potential of pyrolysis processes in the waste management sector. Therm. Sci. Eng. Prog. 2017, 3, 171–197. [Google Scholar] [CrossRef]
  6. Lopez, G.; Artetxe, M.; Amutio, M.; Alvarez, J.; Bilbao, J.; Olazar, M. Recent advances in the gasification of waste plastics. A critical overview. Renew. Sustain. Energy Rev. 2018, 82, 576–596. [Google Scholar] [CrossRef]
  7. Gopinath, K.P.; Nagarajan, V.M.; Krishnan, A.; Malolan, R. A critical review on the influence of energy, environmental and economic factors on various processes used to handle and recycle plastic wastes: Development of a comprehensive index. J. Clean. Prod. 2020, 274. [Google Scholar] [CrossRef]
  8. Lopez, G.; Artetxe, M.; Amutio, M.; Bilbao, J.; Olazar, M. Thermochemical routes for the valorization of waste polyolefinic plastics to produce fuels and chemicals. A review. Renew. Sustain. Energy Rev. 2018, 73, 346–368. [Google Scholar] [CrossRef]
  9. Miandad, R.; Barakat, M.A.; Aburiazaiza, A.S.; Rehan, M.; Nizami, A.S. Catalytic pyrolysis of plastic waste: A review. Process. Saf. Environ. Prot. 2016, 102, 822–838. [Google Scholar] [CrossRef]
  10. Al-Salem, S.M.; Antelava, A.; Constantinou, A.; Manos, G.; Dutta, A. A review on thermal and catalytic pyrolysis of plastic solid waste (PSW). J. Environ. Manag. 2017, 197, 177–198. [Google Scholar] [CrossRef] [PubMed]
  11. Anuar Sharuddin, S.D.; Abnisa, F.; Wan Daud, W.M.A.; Aroua, M.K. A review on pyrolysis of plastic wastes. Energy Convers. Manag. 2016, 2016 115, 308–326. [Google Scholar] [CrossRef]
  12. Dwivedi, P.; Mishra, P.K.; Mondal, M.K.; Srivastava, N. Non-biodegradable polymeric waste pyrolysis for energy recovery. Heliyon 2019, 5. [Google Scholar] [CrossRef] [PubMed] [Green Version]
  13. Thunman, H.; Berdugo Vilches, T.; Seeman, M.; Nguyen, H.N.T. Circular use of plastics-transformation of existing petrochemical clusters into thermochemical recycling plants with 100% plastics recovery. Sustain. Mater. Technol. 2019, 22. [Google Scholar] [CrossRef]
  14. Garrido, M.A.; Font, R.; Conesa, J.A. Pollutant emissions during the pyrolysis and combustion of flexible polyurethane foam. Waste Manag. 2016, 52, 138–146. [Google Scholar] [CrossRef] [PubMed] [Green Version]
  15. Moltó, J.; López-Sánchez, B.; Domene-López, D.; Moreno, A.I.; Font, R.; Montalbán, M.G. Pollutant emissions during the pyrolysis and combustion of starch/poly(vinyl alcohol) biodegradable films. Chemosphere 2020, 256. [Google Scholar] [CrossRef]
  16. Nedjalkov, I.; Yoshiie, R.; Ueki, Y.; Naruse, I. Tar and soot generation behaviors from ABS, PC and PE pyrolysis. J. Mater. Cycles Waste Manag. 2017, 19, 682–693. [Google Scholar] [CrossRef]
  17. Russell, J.M.; Gracida-Alvarez, U.R.; Gracida-Alvarez, U.R.; Winjobi, O.; Winjobi, O.; Shonnard, D.R.; Shonnard, D.R. Update to Effect of Temperature and Vapor Residence Time on the Micropyrolysis Products of Waste High Density Polyethylene. Ind. Eng. Chem. Res. 2020, 59, 10716–10719. [Google Scholar] [CrossRef]
  18. Yan, G.X.; Jing, X.D.; Han, Q.Z.; Wen, H.; Xiang, S.G. Thermal cracking of HDPE/PP mixtures. Gao Xiao Hua Xue Gong Cheng Xue Bao J. Chem. Eng. Chin. Univ. 2015, 29, 571–577. [Google Scholar] [CrossRef]
  19. Abbas-Abadi, M.S. The effect of process and structural parameters on the stability, thermo-mechanical and thermal degradation of polymers with hydrocarbon skeleton containing PE, PP, PS, PVC, NR, PBR and SBR. J. Therm. Anal. Calorim. 2020. [Google Scholar] [CrossRef]
  20. Quesada, L.; Calero, M.; Martín-Lara, M.A.; Pérez, A.; Blázquez, G. Characterization of fuel produced by pyrolysis of plastic film obtained of municipal solid waste. Energy 2020, 186. [Google Scholar] [CrossRef]
  21. Ayodele, T.R.; Durodola, O.; Ogunjuyigbe, A.S.; Lange Munda, J. Effects of operating factors on the bio-oil produced from pyrolysis of plastic wastes using response surface methodology. In Proceedings of the IEEE PES/IAS PowerAfrica Conference: Power Economics and Energy Innovation in Africa, PowerAfrica, Abuja, Nigeria, 20–23 August 2019; pp. 527–532. [Google Scholar] [CrossRef]
  22. Hasan, N.U.; Rahman, M.M.; Rahat, R.I. Characteristics comparison of pyrolysed oils obtained from waste of plastic, tyres and biomass solid. In Proceedings of the (2017) 4th International Conference on Advances in Electrical Engineering (ICAEE) 2017, Dhaka, Bangladesh, 28–30 September 2017; pp. 450–454. [Google Scholar] [CrossRef]
  23. Vijayakumar, A.; Sebastian, J. Pyrolysis process to produce fuel from different types of plastic—A review. IOP Conf. Ser. Mater. Sci. Eng. 2018, 396. [Google Scholar] [CrossRef]
  24. Mastral, A.M.; Callea, M.S. A Review on Polycyclic Aromatic Hydrocarbon (PAH) Emissions from Energy Generation. Environ. Sci. Technol. 2000, 34, 3057. [Google Scholar] [CrossRef]
  25. Williams, P.T.; Besler, S. Polycyclic aromatic hydrocarbons in waste derived pyrolytic oils. J. Anal. Appl. Pyrolysis 1994, 30, 17–33. [Google Scholar] [CrossRef]
  26. Rausa, R.; Pollesel, P. Pyrolysis of automotive shredder residue (ASR) Influence of temperature on the distribution of products. J. Anal. Appl. Pyrolysis 1997, 40–41, 383–401. [Google Scholar] [CrossRef]
  27. Elliott, D.C. Pyrolysis Oils from Biomass, Producing, Analysing and Upgrading; Soltes, J., Milne, T.A., Eds.; ACS Symp. Ser. 376; American Chemical Society: Washington, DC, USA, 1995. [Google Scholar]
  28. Mastral, J.F.; Esperanza, E.; García, P.; Juste, M. Pyrolysis of high-density polyethylene in a fluidised bed reactor. Influence of the temperature and residence time. J. Anal. Appl. Pyrolysis 2002, 63, 1–15. [Google Scholar] [CrossRef]
  29. Niksa, S.; Kerstein, A.R. Flashchain Theory for Rapid Coal Devolatilization Kinetics. 1. Formulation. Energy Fuels 1991, 5, 647–664. [Google Scholar] [CrossRef]
  30. Solomon, P.R.; Hamblen, D.G.; Carangelo, R.; Serio, M.; Deshpande, G.V. General Model of Coal Devolatilization. Energy Fuels 1988, 2, 405. [Google Scholar] [CrossRef]
  31. Fletcher, T.H.; Kerstein, A.R.; Pugmire, R.J.; Grant, D.M. Chemical Percolation Model for Devolatilization. 2. Temperature and Heating Rate Effects on Product Yields. Energy Fuels 1990, 4, 54–60. [Google Scholar] [CrossRef]
  32. Grant, D.M.; Pugmire, R.J.; Fletcher, T.H.; Kerstein, A.R. Chemical Model of Coal Devolatilization Using Percolation Lattice Statistics. Energy Fuels 1989, 3, 175–186. [Google Scholar] [CrossRef]
  33. Ranzi, E.; Frassoldati, A.; Grana, R.; Cuoci, A.; Faravelli, T.; Kelley, A.P.; Law, C.K. Hierarchical and comparative kinetic modeling of laminar flame speeds of hydrocarbon and oxygenated fuels. PECS 2012, 38, 468–501. [Google Scholar] [CrossRef]
  34. Ranzi, E.; Dente, M.; Goldaniga, A.; Bozzano, G.; Faravelli, T. Lumping procedures in detailed kinetic modeling of gasification, pyrolysis, partial oxidation and combustion of hydrocarbon mixtures. Prog. Energy Combust. Sci. 2001, 27, 99–139. [Google Scholar] [CrossRef]
  35. Zhang, Y.; Cai, J.; Zhao, L.; Yang, J.; Jin, H.; Cheng, Z.; Li, Y.; Zhang, L.; Qi, F. An experimental and kinetic modeling study of three butene isomers pyrolysis at low pressure. Combust. Flame 2012, 159, 905–917. [Google Scholar] [CrossRef]
  36. Al-Salem, S.M. Thermal pyrolysis of high density polyethylene (HDPE) in a novel fixed bed reactor system for the production of high value gasoline range hydrocarbons (HC). Process. Saf. Environ. Prot. 2019, 127, 171–179. [Google Scholar] [CrossRef]
  37. Bradley, J.N. A General Mechanism for the High-Temperature Pyrolysis of Alkanes. The Pyrolysis of Isobutane. Proc. R. Soc. London A 1974, 337, 199–216. [Google Scholar]
  38. Held, T.J.; Marchese, A.J.; Dryer, F.L. A semi-empirical reaction mechanism for n-heptane oxidation and pyrolysis. Combust. Sci. Technol. 1997, 123, 107–146. [Google Scholar] [CrossRef]
  39. Zeppieri, S.P.; Klotz, S.D.; Dryer, F.L. Modeling concepts for larger carbon number alkanes: A partially reduced skeletal mechanism for n-decane oxidation and pyrolysis. Proc. Combust. Inst. 2000, 28, 1587. [Google Scholar] [CrossRef]
  40. Ranzi, E.; Frassoldati, A.; Granata, S.; Faravelli, T. Wide-range kinetic modeling study of the pyrolysis, partial oxidation, and combustion of heavy n-alkanes. Ind. Eng. Chem. Res. 2005, 44, 5170–5183. [Google Scholar] [CrossRef]
  41. Granata, S.; Faravelli, T.; Ranzi, E. A wide range kinetic modeling study of the pyrolysis and combustion of naphthenes. Combust. Flame 2003, 132, 533–544. [Google Scholar] [CrossRef]
  42. Maffei, T.; Frassoldati, A.; Cuoci, A.; Ranzi, E.; Faravelli, T. Predictive one step kinetic model of coal pyrolysis for CFD applications. Proc. Combust. Inst. 2013, 34, 2401–2410. [Google Scholar] [CrossRef]
  43. Ranzi, E.; Cuoci, A.; Faravelli, T.; Frassoldati, A.; Migliavacca, G.; Pierucci, S. Chemical kinetics of biomass pyrolysis. Energy Fuels 2008, 22, 4292–4300. [Google Scholar] [CrossRef]
  44. Jess, A. Mechanisms and kinetics of thermal reactions of aromatic hydrocarbons from pyrolysis of solid fuels. Fuel 1996, 75, 1441–1448. [Google Scholar] [CrossRef]
  45. Umeki, K.; Yamamoto, K.; Namioka, T.; Yoshikawa, K. High temperature steam-only gasification of woody biomass. Appl. Energy 2010, 87, 791–798. [Google Scholar] [CrossRef]
  46. Corella, J.; Sanz, A. Modeling circulating fluidized bed biomass gasifiers. A pseudo-rigorous model for stationary state. Fuel Process. Technol. 2005, 86, 1021–1053. [Google Scholar] [CrossRef]
  47. Maki, T.; Miura, K. A simulation model for the pyrolysis of oil emulsion. Energy Fuels 1996, 11, 819–824. [Google Scholar] [CrossRef]
  48. Zou, B.; Lou, Q.; Mo, S.; Feng, S. Study of a kinetic model of atmospheric gas oil pyrlolysis and coke deposition. Ind. Eng. Chem. Res. 1993, 32, 843–847. [Google Scholar] [CrossRef]
  49. Jackson, K.J.; Burnham, A.K.; Braun, R.L.; Knauss, K.G. Temperature and pressure dependence of n-hexadecane cracking. Org. Geochem. 1995, 23, 941–954. [Google Scholar] [CrossRef]
  50. Kumar, S.; Panda, A.K.; Singh, R.K. A review on tertiary recycling of high-density polyethylene to fuel. Resour. Conserv. Recycl. 2011, 55, 893–910. [Google Scholar] [CrossRef]
  51. Conesa, J.A.; Font, R.; Marcilla, A.; García, A.N. Pyrolysis of polyethylene in a fluidized bed reactor. Energy Fuels 1994, 8, 1238–1246. [Google Scholar] [CrossRef]
  52. Walendziewski, J. Engine fuel derived from waste plastics by thermal treatment. Fuel 2000, 81, 473–481. [Google Scholar] [CrossRef]
  53. Walendziewski, J. Continuous flow cracking of waste plastics. Fuel Process. Technol. 2005, 86, 1265–1278. [Google Scholar] [CrossRef]
  54. Seo, Y.H.; Lee, K.H.; Shin, D.H. Investigation of catalytic degradation of high-density polyethylene by hydrocarbon group type analysis. J. Anal. Appl. Pyrolysis 2003, 70, 383–398. [Google Scholar] [CrossRef]
  55. Wu, Y.; Isarov, A.V.; Connell, C.O. Thermal analysis of high density polethylene-maple woodflour composites. Thermochim. Acta 1999, 340–341, 205–220. [Google Scholar] [CrossRef]
Figure 1. Lumped reaction scheme.
Energies 13 05466 g001
Figure 2. SEM images of the soot sample.
Energies 13 05466 g002
Figure 3. Pyrolysis of n-hexadecane. (a) 1200 K, short times; (b) 1200 K, long times; (c) 1900 K.
Energies 13 05466 g003
Figure 4. Stoichiometric coefficients for reaction C n H m m a H 2 + n b C 10 H 8 + n c C H 4 + n d C 2 H 4 + n e C 2 H 2 for CnHm = nC16H34 and nC10H20.
Energies 13 05466 g004
Figure 5. Pyrolysis of naphthalene at 1200 K.
Energies 13 05466 g005
Figure 6. Reaction of naphthalene and acetylene. (a) 1200 K; (b) 1900 K.
Energies 13 05466 g006aEnergies 13 05466 g006b
Figure 7. Combustion of 0.1% n-hexadecane at 1200K with 20% oxygen.
Energies 13 05466 g007
Figure 8. Combustion of 0.1% naphthalene at 1200K with 20% oxygen.
Energies 13 05466 g008
Figure 9. DTG curves on the soot sample in air at 5 K/min.
Energies 13 05466 g009
Figure 10. Comparison of the rate of different reactions.
Energies 13 05466 g010
Figure 11. Arrhenius plots for combustion of the soot sample in TGA, compared with Arrhenius plots of combustion of naphthalene from computational experiments.
Energies 13 05466 g011
Figure 12. Formation of PAHs predicted by comprehensive kinetic model [33] (data points) and present simplified model (lines).
Energies 13 05466 g012
Figure 13. PAH formed at 1200 K by feeding C16H34 with molar fraction of 0.001 with different oxygen feeds: no oxygen in the feed; oxygen fed together with the fuel at partial pressure of 0.001 (E = 0.06); oxygen fed together with the fuel at partial pressure of 0.01 (E = 0.6).
Energies 13 05466 g013
Figure 14. PAH formed at 1200 K by feeding C16H34 with molar fraction of 0.001 with different oxygen feeds: no oxygen in the feed; oxygen fed in 13 steps for a cumulative value of E = 0.06; oxygen fed in 13 steps for a cumulative value of E = 0.6.
Energies 13 05466 g014
Table 1. Stoichiometric coefficients of reaction 1.
C n H m m a H 2 + n b C 10 H 8 + n c C H 4 + n d C 2 H 4 + n e C 2 H 2
a 2.9961 + 0.0073 T 5.624 · 10 6 T 2 + 1.449 · 10 9 T 3
b 2.4690 + 0.0065 T 5.437 · 10 6 T 2 + 1.474 · 10 9 T 3
c 1.8297 0.0036 T + 2.479 · 10 6 T 2 5.903 · 10 10 T 3
d 1.4871 0.0032 T + 2.414 · 10 6 T 2 6.197 · 10 10 T 3
e 10.4433 0.0275 T + 2.353 · 10 5 T 2 6.454 · 10 9 T 3
Table 2. Kinetic parameters.
k0 (1/s)Ea (kcal/mol)
Reaction 1
d x T A R 1 d t = k 0 e x p ( E a R T ) x T A R 1 , 1 / s
3.32 × 101067.0
Reaction 2a
d x P A H d t = k 0 e x p ( E a R T ) x c 10 H 8 ,   1 / s
2.86 × 10969.1
Reaction 2b
d x P A H d t = k 0 e x p ( E a R T ) x C 2 H 2 0.5 x C 10 H 8 ,   1 / s
1.90 × 101059.6
Reaction 3
d x T A R 1 d t = k 0 e x p ( E a R T ) x T A R 1 x O 2 a
8.6 × 101045.80 (xO2 > 0.2)
8.4 × 101145.81.4 (xO2 < 0.2)
Reaction 4–5
d x T A R 2 d t = k 0 e x p ( E a R T ) x T A R 1 x O 2 a
1.7 × 10939.40 (xO2 > 0.2)
1.9 × 101039.41.5 (xO2 < 0.2)
Publisher’s Note: MDPI stays neutral with regard to jurisdictional claims in published maps and institutional affiliations.

