Abstract
The purpose of the “Made in China 2025” strategy is to enhance the innovation capabilities of the local manufacturing industry and achieve green and sustainable development. The role of innovation in the development of manufacturing is a hotspot in academic research, though only a few studies have analyzed the interaction between green technology manufacturing efficiency and its external innovation capabilities. This study used the 2011–2017 Chinese A-share listed manufacturing companies as samples to discuss whether regional innovation capabilities can promote the improvement of green technology manufacturing efficiency. The results showed that a significant spatial correlation between regional innovation capability and green technology manufacturing efficiency was prevalent within spatial heterogeneous bounds. In addition, regional innovation capability directly promoted the effective manufacturing of green technology efficiency, which was strongest in the eastern region of the country. Regional innovation capabilities also had a positive effect on human capital and government revenue, thereby further enhancing the green technology efficiency of manufacturing through the intermediary effect. Based on the above conclusions, some policy recommendations are put forward to facilitate the improvement of China’s regional innovation capabilities in terms of green technology efficiency in manufacturing.
1. Introduction
Over the past few decades, many countries have begun to take sustainable action in anticipation of environmental backlash [1]. Global climate change is the basis for a universal awareness of environmental protection for future generations. It also encourages innovation in various facets of human life. Previous research from India highlighted that changes within the energy industry strongly interlinked energy, population, and urbanization [2]. In terms of reducing environmental impacts, the emergence of “green innovation” has increasingly become a popular trend in research, as well as a point of discussion for academics, industry partners, and politicians alike [3,4]. Schiederig et al. [5] summarized green innovation into six essential elements: innovation object (i.e., product, process, service, and method), market orientation, innovation environment, its full life cycle (i.e., as the central consideration for material flow reduction), intention toward the reduction of economic or ecological demands, and green standards (i.e., in terms of the firm). Despite this, the implementation of green innovation often encounters challenges when applied in non-green industries due to the limitation of new resources and the competencies and capabilities of the industry in terms of changes to the production processes [6]. In the application of green innovation, modifying many factors, as well as the role of participants, should be the first step in terms of developing an environmental protection-based system. Reciprocally, the use of the sustainable resources and green technological processes of the system should be highly dependent (i.e., correlative) to the product market [6,7]. As such, green technology plays a vital role in achieving green sustainable development programs.
The National Bureau of Statistics of China announced that China’s total manufacturing volume has been ranked first in the world for many consecutive years, in which the added value from the manufacturing industry accounted for 27.17% of GDP in 2019. China’s economic growth is greatly influenced by developments in the manufacturing industry. However, its manufacturing industry has a weak independent innovation capacity and a low resource utilization rate, causing a series of environmental pollution-related problems. As a result, the Chinese government has been focusing on formulating policies to increase research and development investment specific to this field [8,9]. In terms of reducing greenhouse gas emissions, as well as pushing for renewable energy, China has begun to develop renewable energy sectors more actively since 2005. This was marked by the issuance of supporting measures and regulations for stimulating renewable energy development [10,11]. Apart from the many factors that motivated the formulation of policies in terms of stimulating these sectors, increases in the budgetary allotment have been extraordinary and have become essential in supporting the effort to save the environment. Innovations in the field of green technology have also led to more effective, efficient, and economical systems [12]. Thus, conducting research on the manufacturing industry’s green technology efficiency in correlation with innovation in China, including green technology and its application to support the sustainability of green development programs, is crucial.
The application of green technology in China has been a growing concern for the Chinese government, which has been working on encouraging many enterprises to apply this technology to activities in all regions [13]. With the widespread application of green technology throughout many industries nationwide, a key issue is how to formulate the development of green technology efficiency and measure regional differences in terms of implementation. It becomes apparent that the spatial correlation between the developing regional innovation and the efficiency of applied green technology overlaps. Previous studies have discussed enterprise preparedness for green innovation in terms of technological, environmental, organizational, and policy constraints [11,13,14]. However, limited studies have been conducted to reveal the regional innovation related to green technology efficiency and its implementation. First, most of the studies on the relationship between innovation and technological efficiency are from the perspective of enterprise innovation investment, with limited studies from a research perspective. Second, the evaluation indicators of existing regional innovations are expressed mostly in terms of the number of published papers or patent authorizations. The indicator system is relatively unrepresentative, which makes it difficult to reflect upon the actual (i.e., complete) regional innovation capability. Finally, the role of geographic space is generally ignored, and the regional heterogeneity and spatial correlation between research elements are not considered. Listed companies, as representatives of high-quality enterprises, need to accept external auditing, which involves disclosing its information publicly such that its data is transparent and easily accessible.
This study used the spatial autocorrelation and Tobit model to select 2011–2017 Chinese A-share listed manufacturing companies as the research sample to answer whether regional innovation ability directly affects the green technology efficiency of China’s manufacturing industry. In addition, regional innovation has a significant spillover effect that inevitably affects factors such as human capital, government revenue, and the waste treatment rate [15]. Can changes in the above factors indirectly affect the green technology efficiency of manufacturing? Differences in resource endowments in various regions will cause differences in innovation capability and technical efficiency [16]. As such, it is necessary to explore the heterogeneity of the impact of different regions’ innovation capabilities on their green technology manufacturing efficiency. Thus, the foregoing is an attempt to analyze the impact of regional innovation capabilities on the efficiency of green technology in China’s manufacturing industry, where three aspects are examined: (1) direct effects, (2) spatial heterogeneity, and (3) indirect effects. The specific research framework is shown in Figure 1.
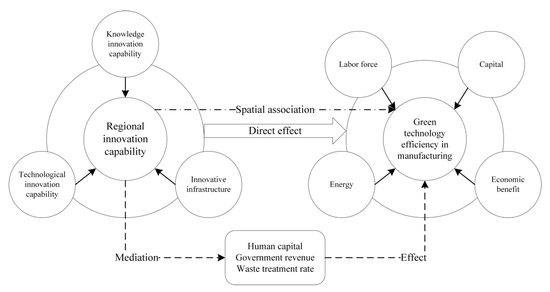
Figure 1.
Research framework.
The contributive factors of this research were central to the following three viewpoints. First, it combined geographical and economic methods to comprehensively explore the interaction between regional innovation capabilities and green technology manufacturing efficiency, as well as compensated for the shortcomings of the existing literature. Second, it innovatively explored the effects of manufacturing external innovation capability on its green technology efficiency, broke the constraints of traditional enterprise perspective research, focused on urban units, and expanded the research perspective of the interaction between innovation and technological efficiency. Third, it sorted out the direct and intermediate roles between regional innovation capabilities and green technology manufacturing efficiency by providing theoretical and practical guidance for enterprises and government, which can help with decision-making and efficiency. The paper is organized as follows: Section 2 reviews the literature, Section 3 introduces the indicator construction and data sources, Section 4 lists the research methods, Section 5 illustrates the spatial correlation and empirical analysis results regarding regional innovation capability and green technology efficiency of China’s manufacturing industry, and Section 6 elucidates the concluding remarks and policy implications.
2. Literature Review and Theoretical Framework
2.1. Literature Review
The significant impact of climate change has brought forth a worldwide paradigm shift, especially in terms of the use of green technology. Previous research has shown that a government’s essential role in encouraging the application of green technology in industry varies greatly [17,18]. The application of green technology will differ and be influenced by the capacity and ability of institutions that are specific to each country. Green technology policy requires not only consistency from the industry but also political stability from political actors in a country. The framework of its development plan needs to be sustainable, as well as flexible, and should not be changed due to political intervention [17]. Therefore, political, economic, and sustainable promotion in a country should encourage the industry and society at large to create more effective and efficient innovations in the field of green technology.
Since 2006, when the Chinese government began to adopt strategic policies, by encouraging innovation-driven development, it began driving significant social and economic development by focusing on industries such that they could develop rapidly through extraordinary innovation [19,20]. Government funding and tax incentives played, and continue to play, an important role in promoting green technology innovation. This interaction, i.e., between government regulations and government research, has been a vital part of promoting green product innovation [18]. Various studies have indicated that government regulations contribute significantly to low-carbon technology innovation compared with technology pushes and the market [21]. Based on the evidence, the importance of government regulations and initiatives to promote innovation (i.e., especially in terms of green technology applications) in industry can be observed.
According to the results of a study conducted in a democratic country, no direct correlation between democracy and innovation could be found [22]. The national innovation activities are located mostly in areas where companies, universities, and governments interact directly and the encouragement of the local government in such innovation is crucial [23]. Thus, understanding how the influence of innovation in certain regions effectively and efficiently supports and maintains the sustainable implementation of green technology becomes paramount to its realization and advancement [22,23].
In terms of China, the manufacturing industry has not only become its main economic contributor but also the most important contributor to energy consumption and environmental pollution, which has signaled an urgency for the development of green technologies in manufacturing [24]. Previous studies showed that the development of green growth was influenced considerably by a paradigm shift in China’s manufacturing industry, which had begun to move toward a green-oriented focus regarding innovation. At the same time, however, the disparity in the inefficiencies between the western and eastern regions of China was also increasing [8,25]. Different research concluded that green growth performance in China is profoundly influenced by regional innovation capacity, technological innovation, and the technical and institutional instrument coordination [26]. Based on this evidence, regional innovation is also key to the success of green technology implementation. However, differing results experienced in each region due to varying causes, e.g., geographical location, economic development, flexible innovation mechanisms, the role of a strong market economy, intellectual property protection, corporate credit, market financing, and government public education investment, should be taken into account [26,27].
Strict environmental regulations and openness to external international policies have encouraged, and to some degree compelled, the application of green technology in China’s manufacturing industry. This increase in green development, especially in China’s high-end manufacturing industry, is not in line with the innovation and efficiency of green technology compared with the traditional manufacturing industry [28]. This continual adjustment has resulted in a win–win scenario for its manufacturing industry. Other research from Shenzhen showed that regional innovation is significantly dominated by large, high-tech firms and the dynamics of high-tech entrepreneurship, which is closely related with high impact human capital (i.e., high-quality talents) [29]. In summary, the topic of green development, which includes innovation and green technology and development, has attracted the attention of many scholars, industry, and the government. The growing awareness and importance within the field exemplify key issues in terms of environmental and human sustainability for future generations. Further research recommendations include conducting more in-depth, innovation-oriented, region-based studies and exploring the effects on the efficiency of green technology, as well as how the effects of intermediary variables and many others have been echoed [29,30]. Based on a review of the existing literature, this research sought to contribute to the knowledge base and fill the literature gap with a focused study on manufacturing industries in China. This is important because this industry is not only a significant contributor to the economic growth of China but also a significant contributor to pollution and related environmental issues.
2.2. Theoretical Framework
2.2.1. Direct Effect
Regional innovation is the fundamental driving force for promoting social and economic development. It started with investments in technology development, with the ultimate goal of converting technological outputs into commercial value [31]. The direct impact of regional innovation capability on the efficiency of manufacturing green technology is mainly manifested in (1) enterprises innovating energy-saving and environmental protection technologies that change production methods and eliminating high-energy-consuming old technologies through new technologies, and (2) reducing energy consumption and pollutant emissions in the production process and realizing the improvement of green technology efficiency in manufacturing [32]. Based on these direct effects, this study proposed:
Hypothesis 1.
Regional innovation capabilities can directly promote the progress of green technology manufacturing efficiency.
2.2.2. Spatial Heterogeneity
The location conditions of different spatial regions are heterogeneous because different locations have different attributes or qualifications and the elements provided for human production are also different [33]. The geographical differences in the manufacturing industry will lead to differences in the number of universities and scientific research institutes, traffic accessibility, government technology policies, infrastructure, and other innovation factors, which will affect the differences in the absorption, creation, and transformation of green technology efficiency in different regions. Therefore, in terms of spatial heterogeneity, this study proposed:
Hypothesis 2.
The impact of different regional innovation capabilities on the efficiency of manufacturing green technology has spatial heterogeneity.
2.2.3. Indirect Effect
Regional innovation capabilities have an important impact on human capital, government revenue, and waste treatment rates, and these factors inevitably have an indirect spillover effect on green technology manufacturing efficiency. First, regions with a higher level of regional innovation capability can attract more high-quality talents who bring advanced production technology and management experience to promote the improvement of green technology efficiency in manufacturing [34]. Second, the improvement of regional innovation capability adds vitality to social and economic development, thereby promoting the increase of government revenue, and providing strong support and guarantees for the update of green technology manufacturing efficiency. Third, the innovation of resource recycling and waste treatment technology can improve the reuse and distribution of resources, increase the efficiency of raw materials and energy use, and thus promote the progress of green technology efficiency in manufacturing [35]. As a result of these indirect effects, this study proposed:
Hypothesis 3.
Regional innovation capabilities can indirectly promote the progress of green technology efficiency in manufacturing through human capital, government revenue, and the waste treatment rate.
3. Indicator Construction and Data Sources
3.1. Construction of a Green Technology Efficiency Index System for China’s Manufacturing Industry
The green technology efficiency of the manufacturing industry is essential for obtaining the largest possible economic output (i.e., in terms of manufacturing) with the least input from production factors and the lowest environmental cost, thereby reflecting the relationship between the manufacturing economy and resource utilization and environmental protection [36]. Jorgenson [37] decompose inputs into three major elements: labor force, capital, and energy. This study took the total number of employees, fixed asset net worth, and hydroelectric energy consumption of the listed companies in the manufacturing industry as input indicators, as well as the operating income as the measure of economic benefit output, to build the green technology efficiency index system of Chinese manufacturing, based on input–output theory. The methods of measuring industrial technical efficiency were divided into data envelopment analysis and stochastic frontier analysis. Because traditional data envelopment analysis cannot process time series data, it is not suitable for the study of efficiency-influencing factors using panel data and ignores the effects of random factors on the efficiency estimation; contrarywise, the stochastic frontier analysis method compensates for the above shortcomings and is employed as a viable measuring approach.
3.2. Construction of the Regional Innovation Capability Index System
Regional innovation capability is aimed at enhancing the driving force of regional economic growth, giving full play to the enthusiasm of regional innovation behaviors, efficiently allocating regional innovation resources, and transforming innovative ideas into the comprehensive capabilities of new technologies, new products, new processes, and new services [38]. This study referred to the index systems of the OECD Innovation Index and the China Science and Technology Development Strategy Research Group. Based on the principles of scientificity and representativeness, this research comprehensively built a regional innovation capability index system from the three dimensions of knowledge production capability, technological innovation capability, and innovative infrastructure, with a total of 12 indicators (Table 1). Then, the entropy method was used to calculate the comprehensive index of each city’s innovation capability (INN).

Table 1.
Index system for innovation capacity.
3.3. Control Variable Setting
Controlling other variables that affect the efficiency of green technology in the manufacturing industry is necessary to obtain unbiased estimation results. This research systematically and comprehensively selected control variables from the perspective of manufacturing (i.e., city) and itself (i.e., industry). First, the economic development level in the form of regional gross domestic product (GDP) and foreign cooperation (FC) indicators were selected at the city level. Economic development provides abundant capital support for the rise of green technology efficiency, and regions with high levels of economic development having higher levels of industrialization and relatively complete environmental policies. Hence, regional GDP was used to measure the level of urban economic development [39]. The cooperation between local and foreign enterprises, and as a result, the knowledge and technology spillover effect in mutual exchange may promote the improvement of production efficiency. However, when foreign capital enters, it will also squeeze the market share of domestic enterprises, thereby inhibiting their development, which is not conducive to the improvement of the local green technology manufacturing efficiency. The number of foreign direct investment contract projects was used to measure the variables of foreign cooperation. Second, government subsidies (GI) and manufacturing scale (MS) indicators were selected at the industrial level. Government grants to enterprises reduce the cost and risk of upgrading the technology efficiency of enterprises but they may also have a “crowding out effect” [40]. The level of government subsidies to manufacturing is measured by government investment in enterprises. If a certain scale of the manufacturing industry is formed in the city, it will inevitably bring about the concentration of enterprises in the upstream and downstream industrial chains and the improvement of the infrastructure level, which will contribute to the improvement of the technological efficiency of those enterprises [28]. On the downside, the continuous expansion of the manufacturing industry in cities may bring about environmental pollution, vicious competition, and reduction of market management and control capabilities, which will damage the efficiency of green technology. As a result, the value of the total assets of manufacturing enterprises was employed to represent the manufacturing scale variables.
3.4. Selection of Intermediary Variables
Human capital, government revenue, and the waste treatment rate as intermediary variables were used to explore the indirect impact mechanisms of regional innovation capability on green technology manufacturing efficiency. Human capital (HC) was measured using the number of students in ordinary colleges and universities. Innovation activities require a large number of high-quality, professional talent, and as such, the improvement of human capital will promote the upgrading of green technology manufacturing efficiency [35]. Government revenue (GR) was characterized by public fiscal revenue. Schumpeter’s innovation theory states that innovation is the endogenous driving force for economic development. The improvement of the economic development level will inevitably bring about an increase in government revenue. The government builds a complete green ecology for the manufacturing industry through fiscal and tax policies [39]. The waste treatment rate (WTR) variable was obtained using the entropy method to comprehensively calculate the three indicators of general industrial solid waste: comprehensive utilization rate, centralized treatment rate of the sewage treatment plant, and harmless treatment rate of domestic garbage. Innovation promotes the technological upgrading of the waste treatment industry, while the technological innovation of the waste treatment rate promotes the improvement of the overall green technology efficiency of the manufacturing industry.
3.5. Data Sources
This study merged listed manufacturing companies in Chinese prefecture-level cities and above as research units. The Renminbi common stocks (i.e., A-shares) only include companies registered in mainland China, Chinese Taiwan, Hong Kong, and Macau were temporarily not listed as analysis objects. The observation period of this study was 2011–2017 to address the issues on the availability and completeness of data since Chinese listed companies had fewer requirements regarding the disclosure of environmental information before 2011. The data of listed companies in China’s manufacturing industry were obtained from the Choice database (i.e., http://choice.eastmoney.com/), and the total amount of urban patents obtained was from the Chinese Research Data Service Platform (i.e., https://www.cnrds.com/Home/Index/). All other data were derived from the “China City Statistical Yearbook” of the corresponding year. The missing data were extrapolated according to the interpolation method. The vector data of national boundaries and territorial boundaries were derived from the national 1:1 million basic geographic databases published by the China National Basic Geographic Information Center in 2017 (i.e., http://www.webmap.cn/).
4. Research Methods
4.1. Entropy Method
The entropy method determines the weight of an index based on the influence of the relative change degree of the index on the overall system. It is an objective weighting method that comprehensively considers various factors and is suitable for multiple indicators. The entropy method has certain objectivity and scientific characteristics because it can overcome randomness problems in terms of subjective weighting and solve the problem of information overlap between multiple index variables. Taking this into account, this study constructed a regional innovation capability index system, standardized the original data, and used the entropy method to calculate the innovation capability of each city. The calculation steps of the entropy method are as follows.
First, calculate the proportion of the th index in city (i.e., Equation (1)); second, calculate the entropy value of the indicator (i.e., Equation (2)); third, calculate the information utility value of the th indicator (i.e., Equation (3)); fourth, calculate the weight of the index (i.e., Equation (4)); finally, calculate the level of innovation capability of each city (i.e., Equation (5)).
4.2. Stochastic Frontier Analysis
The stochastic frontier production function model was originally proposed by Aigner et al. [41]. It is a typical parameter efficiency measurement method that can distinguish production function errors into two parts: random errors caused by uncontrollable random factors and management errors caused by technical inefficiency. Battese and Coelli [42] introduced panel data and proposed that the BC model of stochastic frontier analysis be used to measure the industrial technical efficiency, resource utilization efficiency, and urban development efficiency. This study drew on the research method of Yang et al. [43] to construct a stochastic frontier production function to measure the green technology efficiency of China’s manufacturing industry. The formulation, i.e., Equations (6)–(10), was as follows:
where is the output variable; is an input variable; is a research unit; is time; represents the time trend of technological changes; is the intercept term; , , and denote the parameters to be estimated; is a random error term subject to a normal distribution ; denotes a non-negative management error term, subject to a non-negative truncated normal distribution ; indicates the technical efficiency value.
4.3. Spatial Autocorrelation Method
Spatial dependence means that a certain element does not exist independently in a spatial unit but is instead related to the adjacent spatial unit, where spatial autocorrelation is a quantitative index to check the strength of the association between the attribute value of a certain element and the attribute value of the adjacent space [44].
4.3.1. Local Indicators of Spatial Association (LISA)
Local spatial autocorrelation is used to measure the degree of similarity (i.e., positive correlation) or difference (i.e., negative correlation) of a certain attribute at its local position with its neighboring spatial unit attributes. The heterogeneous characteristics of spatial elements can be understood more fully, including how spatial dependence changes with location [45]. The use of local spatial autocorrelation methods to explore the spatial distribution characteristics of the regional innovation capability and the green technology efficiency of Chinese manufacturing was applied. Local Moran’s I is a quantitative index of local spatial autocorrelation; its calculation is formulated using Equation (11):
where indicates the total number of observation points; is the space weight; and denote the spatial elements and of the attribute, respectively; represents the average value of the attribute; is the variance of the attribute.
4.3.2. Bivariate Moran′s I
A bivariate global spatial autocorrelation can be used to show the overall agglomeration characteristics and spatial correlation between two attributes. The expression can be found in Equation (12):
where is a bivariate global spatial autocorrelation coefficient that represents the correlation between the overall spatial distribution of the independent variable of spatial element and the dependent variable of the spatial element , and are the spatial elements and of the attribute, and other symbols are the same as in Equation (11) above [46].
4.3.3. Bivariate Local Moran′s I
A bivariate global spatial autocorrelation can be used to show the overall agglomeration characteristics and spatial correlation between two attributes. Equation (13) was used, as follows:
where and represent the standardized variance values of the spatial elements and , respectively, and is the local correlation between the independent variable of region and the dependent variable of region , according to which, the spatial elements can be divided into the four types of agglomeration, namely, H–H (high–high), L–L (low–low), H–L (high–low), and L–H (low–high). The H–H cluster means the independent variable value of spatial element and the dependent variable value of spatial element are both high, the L–L cluster means that both attribute values are low, where the H–H and L–L clusters mean that the independent variable of space element has a positive effect on the dependent variable of spatial element [47].
4.4. Empirical Methods
In this study, the explained variable of China’s green technology efficiency in manufacturing had an obvious range limit. This value was represented in the range of zero to one. The results of the traditional ordinary least squares method may be biased. Therefore, our benchmark regression used Tobit estimation, a common processing method for censored data, and considered the upper and lower thresholds of the data. Based on the aforementioned literature, the following direct impact measurement model was constructed:
where represents city ’s green technology manufacturing efficiency level during period , measures the innovation capability index of the city in period , is the intercept term, denotes the regression coefficient of the innovation ability for the green technology manufacturing efficiency, is the set of control variables, and is a random disturbance.
This study added intermediary variables to construct the following intermediary effect measurement model to further explore the indirect effect of the regional innovation capability on the green technology efficiency of manufacturing, as formulated in Equations (15) and (16):
Some unobservable missing variables or a two-way causal relationship between innovation capabilities and green technology manufacturing efficiency may lead to endogenous problems. This study referenced Lin and Tan [48] to add terrain slope tool variables and used a panel data two-stage least squares method to solve possible endogenous problems. The model settings, i.e., Equation (17), were applied as follows:
5. Research Results
5.1. Spatial Association Pattern
5.1.1. Spatial Correlation Distribution Characteristics of Green Technology Efficiency and Innovation Capability in the Manufacturing Industry
First, the applicability of the method was checked. The global spatial autocorrelation Moran’s I indices of China’s green technology manufacturing efficiency and the urban innovation capacity were calculated from 2011 to 2017 with the help of ArcGIS 10.2 software (Environmental Systems Research Institute, Redlands, CA, USA). The results showed that the Moran’s I estimates passed the significance level test with a confidence level of 99%, indicating that China’s green technology manufacturing efficiency and urban innovation capacity were spatially clustered. Thus, local spatial autocorrelation analysis could be used. This study selected 2011 and 2017 as the beginning and end time nodes, respectively, and drew the LISA cluster map of China’s manufacturing industry’s green technology efficiency, as well as its regional innovation capability level in terms of the spatial autocorrelation (Figure 2 and Figure 3). This study divided the local spatial units into four types: high–high cluster (i.e., H–H), high–low cluster (i.e., H–L), low–high cluster (i.e., L–H), and low–low cluster (i.e., L–L) to reveal their degree of association and distribution in the local spatial position pattern.
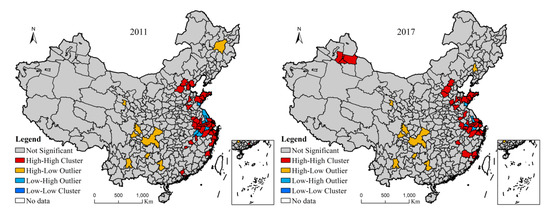
Figure 2.
Local indicators of spatial association (LISA) pattern of green technology efficiency in China’s manufacturing industry.
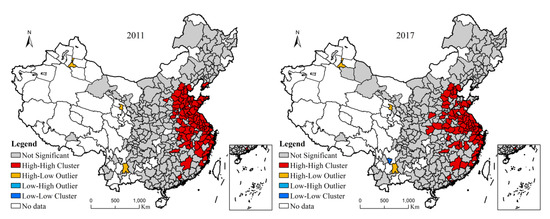
Figure 3.
LISA pattern of regional innovation capability.
In general, the local correlation pattern of the green technology efficiency in China’s manufacturing industry was characterized by “a large agglomeration and a small dispersion.” The H–H cluster areas were located in some cities along the eastern coast of Beijing-Tianjin-Hebei, Shandong Peninsula, Yangtze River Delta, Fujian Province, and Guangdong Province. Such regions had a high level of economic development; large industrial scale; abundant capital; rich, high-quality talent; top infrastructure; advanced and sophisticated industrial technology; a large output of economic benefits, and thus, the green technology manufacturing efficiency levels were in the lead position. The H–H cluster areas in the Pearl River Delta were gradually decreasing, while the number of high and high-concentration areas in inland Xinjiang increased. On the one hand, because of the overall “large input and low output” phenomenon in the Pearl River Delta, the input of production factors, such as labor, land rent, water supply, and electricity, increased such that the traditional manufacturing industry moved out in large numbers, the overall output scale declined, and high-tech industries are still to be developed; as a result, various factors weakened the green technology efficiency in the manufacturing industry throughout the Pearl River Delta region. On the other hand, as the core area of the “Belt and Road” strategy, Xinjiang attracted a large number of manufacturing industries with its preferential policies, low labor and land rents, and abundant resources, which led to the formation of the H–H cluster area of manufacturing industrial green technology efficiency in Urumqi and its surrounding cities.
The L–H cluster areas were attached to the surrounding areas of H–H cluster areas, such as Yancheng, Zhenjiang, Taizhou, Huzhou, Zhoushan, Huangshan, Chizhou, Rizhao, and Ma'anshan. Such cities had relatively poor industrial economic benefits, an irrational industrial structure, and a weak “diffusion effect” from the surrounding developed cities, resulting in a large gap between the green technology efficiency value of neighboring H–H cluster cities, and thus, a “collapsed” formation in terms of space. However, the number of L–H cluster areas gradually decreased, indicating that the technology spillover effect of surrounding cities increased over time and the regional “unbalanced” problem has been alleviated to a certain extent. The H–L cluster areas were scattered in the provincial capital of central cities in the west and northeast, including Chongqing, Chengdu, Guiyang, Kunming, Xining, Harbin, and Shenyang. As an administrative center in less developed regions, the efficiency of green technology is closer to the frontier of production than other surrounding cities. With the existence of the “siphon effect,” promoting the improvement of green technology efficiency in the surrounding cities is difficult and the “Matthew effect” eventually appears in the region. During the study period, the spatial units of the H–L cluster did not change and the L–L cluster areas did not appear.
The regional spatial agglomeration characteristics of China’s regional innovation capability were remarkable and the H–H cluster was the main distribution type. In 2011, H–H cluster areas were distributed in a “planar form” in Beijing, Tianjin, Hebei, Shandong, Jiangsu, Anhui, Zhejiang, Fujian, Jiangxi, Henan, and Guangdong provinces, with a total of 78 spatial units. In 2017, the number of spatial units in the H–H cluster area decreased to 67 but a trend extending from the coast to the inland “axial belt” was observed. The H–H cluster area continued to expand to central and western provinces, such as Hunan, Hubei, Shaanxi, and Shanxi. The conditions of innovation resources, platforms, and the milieu in the above regions were relatively superior, and the strong intercity spatial linkages enabled it to acquire more knowledgeable flows. Hence, the development level of innovation capabilities was higher. Figure 2 shows that the H–L cluster area appeared in the capital cities of the western region, namely, Kunming, Xining, and Urumqi. Most western cities had relatively low levels of innovation capacity, while the province’s main innovation factors and social development resources were concentrated in the provincial capital cities, thereby forming a “polarized” differentiation pattern with a high middle and low surrounding. Only Panzhihua city in Sichuan Province had a positive correlation of low innovation capacity. The generally low efficiency of knowledge creation and knowledge flow in the surrounding areas eventually led to Panzhihua becoming a low-concentration depression.
5.1.2. Bivariate Spatial Correlation Distribution Characteristics of Green Technology Manufacturing Efficiency and Innovation Capability
A Geoda 1.14 software (developed by Dr. Luc Anselin and his team, University of Chicago, Chicago, IL, United States) spatial analysis module was used to calculate the bivariate Moran’s I value of China’s regional innovation capability and green technology manufacturing efficiency in 2011–2017. It explored the overall spatial correlation characteristics and changes between the two elements. The results showed that the bivariate Moran’s I estimates were positive during the study period, fluctuating between 0.1034 and 0.1347. With a highly correlative (i.e., passing) significance level test of 0.01, it can be inferred that China’s regional innovation capability and green technology manufacturing efficiency had a spatially significant positive correlation.
A bivariate global autocorrelation Moran’s I can determine whether an aggregation characteristic of this phenomenon exists in space but it cannot indicate the location of the aggregation exactly. The local spatial correlation characteristics and distribution pattern between the two variables were explored and 2011 and 2017 were selected as the time nodes. The Geoda software was used to conduct a bivariate local spatial autocorrelation analysis of China’s regional innovation capability and green technology manufacturing efficiency indicators. The results are shown in Figure 4. The bivariate LISA agglomeration map of China’s regional innovation capability and green technology manufacturing efficiency was based mainly on H–H cluster (i.e., core areas) and L–L cluster (i.e., edge districts) spatial units. The spatial evolution characteristics were as follows: the number of core areas rose slowly and the number of edge districts declined rapidly. Specifically, the core areas were distributed in eastern cities, such as Beijing, Yantai, Qingdao, Shanghai, Suzhou, Jiaxing, Shaoxing, and Dongguan, in which urban innovation played a significant role in promoting the improvement of green technology efficiency in the manufacturing industry. Specifically, it was found that innovation factors became increasingly important for improving the green technology manufacturing efficiency in Shandong Province. In contrast, the bottleneck of Guangdong’s (i.e., except Shenzhen) manufacturing industry’s green technology efficiency was difficult to break through and the spatial core area shrunk gradually due to a series of locking effects that hampered the development path of the manufacturing industry; these effects included an excessive reliance on capital and labor-intensive industries and various problems that hindered the upgrading of the industrial structure, such as the imperfect transformation mechanism of scientific and technological achievements, wasted research and development investment in innovation, lack of core technology, population, and the disappearance of policy “dividends.” The fringe areas were distributed in a scattered manner in the northeastern, central, and western regions of China. With time, the fringe areas narrowed gradually in size, shifting from northeast and central areas to the west, indicating that after a period of development in China, the “double-low” areas with a low innovation capability and a low green technology manufacturing efficiency were decreasing, but the effects of innovation in the western region on green technology manufacturing efficiency remained weak.
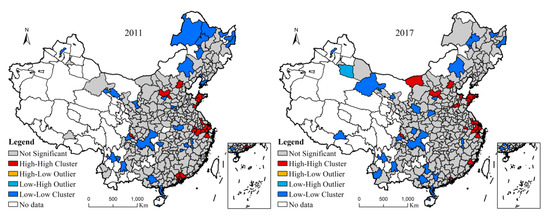
Figure 4.
LISA bivariate spatial correlations between green technology efficiency and innovation capability in the manufacturing industry.
5.2. Empirical Analysis and Testing
5.2.1. Benchmark Regression Results
A random effect panel Tobit model regression was used to examine the direct effect of the regional innovation capability on the green technology efficiency of China’s manufacturing industry. The results are shown in Table 2.
Table 2.
Regression results for the direct effect.
In Table 2, only the innovation capability variables were added to column 1 and column 2, hence the result of introducing the control variables of the economic development level, foreign cooperation, government subsidies, and manufacturing scale were exercised. The addition of control variables had little effect on the regression coefficients of the innovation ability variables, which indicated that the research results were robust. The regression coefficients of the innovation capacity variables in columns 1 and 2 were positive and significant, indicating that the overall regional innovation had a significant role in promoting the green technology efficiency of China’s manufacturing industry and innovation had become a key power-driver force for improving green technology efficiency in the contemporary era. Therefore, Hypothesis 1 proved to be correct. This conclusion was consistent with the conclusions based on other research fields [49,50]. The regression results of the ordinary least-squares fixed-effect model of the regional innovation capacity and green technology efficiency of manufacturing in Table 2 column 3 also verified the above findings.
From the perspective of regional heterogeneity, columns 4–7 reflect the estimated results of the effects of innovations on the green technology efficiency in the four major sectors of East, Central, West, and Northeast China. The innovation in the central and western regions and the green technology efficiency showed an insignificant positive correlation, while the innovation capacity variable in the northeastern region had an insignificant negative relationship. This result indicated that the innovation capabilities of China’s central, western, and northeastern regions had not achieved the effect of promoting green technology efficiency in manufacturing within the study period. The above results corroborated the conclusions obtained in Figure 3 and also proved that Hypothesis 2 was valid. First, the eastern region had strong scientific research strength and a huge technological innovation platform. The scientific research funds and talents were used mostly in the field of experimental development, which was highly relevant to production activities. Therefore, its innovation had a strong spillover bonus to green technology efficiency, which was generally higher than the level of other regions in the country. Second, because of the constraints of the level of economic development of the central and western regions, insufficient investment in scientific and technological innovation, less high-quality knowledge innovation output, and the scarcity of green and efficient high-tech enterprises inhibited the positive effects of innovation on the green technology efficiency of manufacturing. Finally, the northeast region was once China’s largest old industrial base but the emergence of the “resource curse” phenomenon caused the northeast economy to show a “cliff-like” downward trend since 2013 [51]. The system and mechanism reform in this area lagged and the manufacturing industry was mostly high-energy-consuming heavy industry, where the development mode was extensive. As a result, one-third of the country’s total, i.e., 24 cities, are resource-depleted and face the problem of lagging behind the development of innovative capabilities and green technology efficiency [52].
Among the control variables, government subsidies and manufacturing scale variables deserve further attention. Column 2 shows that the variable sign of the government subsidies was negative and significant at the level of 10%, indicating that the subsidies granted by the Chinese government to manufacturing companies had a significant inhibitory effect on the improvement of green technology efficiency. The reason for this may be that the government subsidies crowded out the private green input of enterprises (crowding-out effect). Enterprises rely heavily on government subsidies, reducing their enthusiasm for green production activities, and the green technology efficiency that was improved by the government investment was offset in whole or in part by the reduction in private investment. In addition, it may also be because China’s manufacturing industry is currently at the low-end of the international division of labor. Short-term economic benefits are more attractive than green technology upgrades that have a “large investment and a long payback period.” Government subsidies are used mostly to purchase raw materials and expand production, while green technology transformation expenditure accounts for a relatively small amount. China’s manufacturing industry has fallen into a path dependence that involves low-tech production models, which hinders the improvement of green technology efficiency. The results in column 7 show that the government subsidies in the northeast region were negatively correlated with the technological efficiency of the manufacturing industry, thereby verifying the above views, while the variables of the government subsidies in columns 4–7 were not significant. From the regression results in columns 2–7, the effects of the manufacturing scale on green technology efficiency were negative, passing the 1% significance level test, and the regression coefficient was significantly higher than for other variables. This finding shows that the larger the scale of manufacturing, the lower the efficiency of green technology in manufacturing. On the one hand, the larger the scale of the enterprise, the lower the production flexibility, and the decreasing effect of scale inhibited the improvement of the green technology efficiency. On the other hand, the extensive development model of high pollution, high energy consumption, and high emissions in China’s manufacturing industry restricted the “green” transformation and upgrading of the manufacturing industry.
5.2.2. Mediation Effect Regression Results
This study referred to Wen et al.’s [53] intermediary three-step test method. First, we determined whether the regional innovation capability could promote the improvement of green technology efficiency in China’s manufacturing industry. Second, this study examined the role of regional innovation capacity on the intermediary variables. Finally, it explored whether regional innovation capacity and intermediary variables could simultaneously affect the green technology efficiency in manufacturing. According to Muller et al. [54], the existence of intermediary effects must meet the following conditions. First, when no intermediary variables are added, regional innovation capacity has a significant positive effect on the green technology efficiency of manufacturing. Second, this effect is weakened after the intermediary effects are added. Third, regional innovation capacity has a positive effect on intermediary variables. Finally, intermediary variables have a positive effect on the green technology efficiency of manufacturing. Human capital, government revenue, and the waste treatment rate were selected as intermediary variables, and the core explanatory variables and explained variables were consistent with the above. The human capital interpretation index was the number of students in colleges and universities, considering that it will take a certain amount of time for students to convert into labor, i.e., one year from the time of graduation before entering the job market. The statistics of government revenue funds were generally lagging, and thus, we set this indicator to lag one year. The mixed Tobit model was used to test the mediation effect in which the Sobel test results were given (Table 3).
Table 3.
Regression results for the mediation effect.
The results in column 1 of Table 3 were similar to the previous findings, and thus, the regional innovation capability had a significant positive effect on the green technology efficiency of China’s manufacturing industry. Columns 2 and 3 give the regression results with human capital as an intermediary variable. Column 2 shows that the regression coefficient of innovation capability on human capital was positive and highly significant at 1%, indicating that regional innovation capability significantly promoted the improvement of the human capital level. The regression coefficient of human capital on green technology manufacturing efficiency in column 3 was also significantly positive, which indicated that regional innovation capability can promote the progress of green manufacturing efficiency in China’s manufacturing industry through the positive impact of human capital. Specifically, under the condition that other factors remained unchanged, each additional unit of regional innovation capacity directly promoted the green technology efficiency of the manufacturing industry by 0.684 units while promoting the level of human capital by 0.901 units, and thus, the green technology efficiency of the manufacturing industry was increased indirectly by 0.609 units (0.901 ×0.676 = 0.609). The total effect (1.293) was the sum of indirect effect and direct effect, where the indirect effect accounted for 47% of the total effect. Columns 4 and 5 show the estimates of the government’s public fiscal revenue as an intermediary variable. The results showed that regional innovation capacity had a positive effect on government revenue. Government fiscal revenue also has a positive effect on the green technology manufacturing efficiency. Compared with column 1, the regression coefficient of the regional innovation capability in column 5 decreased after adding the intermediary variables, thereby indicating that government fiscal revenue was one of the channels for regional innovation capability to promote green technology efficiency in manufacturing. The indirect effect of government fiscal revenue accounted for 19% of the total effect and the intermediary effect was relatively weak compared with human capital. The results of the waste treatment rate as an intermediary variable are listed in columns 6 and 7. Column 6 shows the effect of regional innovation capability on the waste treatment rate and column 7 shows the combined effect of regional innovation capability and the waste treatment rate on the green technology manufacturing efficiency. The results showed that the waste treatment rate did not have a significant effect on regional innovation capability and the green technology manufacturing efficiency, and thus, the waste treatment rate was not a medium for regional innovation capability to promote the green technology manufacturing efficiency. Based on the above results, Hypothesis 3 was partially verified.
5.2.3. Robustness and Endogenous Test
To test the reliability of the above results, i.e., the ability of regional innovation to have a significant positive effect on the progress of the green technology efficiency in China’s manufacturing industry, the following robustness tests were conducted. Cities with a special administrative status have comprehensive resource advantages that are unmatched by ordinary prefecture-level cities. Column 1 in Table 4 shows the results of the re-measurement regression after excluding China’s municipalities and provincial capital cities. Next, to verify whether the effect of innovation on green production efficiency made a difference with time, column 2 of Table 4 shows the results of randomly deleting the samples of time nodes in 2012, 2014, and 2016 for re-estimation. Then, we investigated whether the core explanatory variables still had a positive effect on the explained variables under different indicator systems. Column 3 of Table 4 shows the effect of replacing the core explanatory variables with urban innovation capability indicators in the “China Urban and Industrial Innovation Capability Report” published by the Industrial Development Research Center of Fudan University in China to estimate the robustness. Finally, outliers and non-randomness affected the regression results adversely. Column 4 in Table 4 shows the results of the core explanatory variables and the explained variables being subjected to the winsorized process of 1% up and down and re-evaluating the regression.
Table 4.
Regression results of robustness and endogeneity tests.
The above robust regression results maintained a high degree of consistency with the benchmark regression, where regional innovation capabilities still had a significant role in promoting the progress of China’s green technology manufacturing efficiency. Therefore, the conclusions of this study were stable for different model settings and time interval selections. The regression coefficient of the innovation capacity variable in the basic regression was 0.211, and the regression coefficient of the innovation capacity variable after replacing the core explanatory variables with the “China Urban and Industrial Innovation Capacity Report” was 0.214. The comparison found that the regression results were extraordinarily similar, and all passed the 1% significance level test. Consequently, the multi-dimensional and comprehensive index system of the innovation capability level constructed in this study had strong rationality.
Potential sources of endogeneity include missed variable bias. Although we added as many control variables as possible in the model, because the data used in this study were panel data of China’s prefecture-level cities and China is a vast territory, certain gaps may exist in the data statistics in which important control variables may be missed. The inclusion of these missing variables in the random error term will cause endogenous problems, resulting in the overestimation or underestimation of the regression coefficient of innovation ability variables. The sources of endogeneity also have mutual causality. It is generally believed that an endogenous relationship exists between innovation and green technology efficiency, i.e., innovation capacity will affect green technology efficiency, whereas regions with a higher green technology efficiency generally have a stronger innovation capacity. Hence, to solve the errors caused by the endogenous problem, the use of the instrumental variable method was tested. The ideal instrumental variable should have a strong correlation with the endogenous variable and must meet the exogenous requirements that are not related to the disturbance term. Geographical indicators are naturally formed and do not affect various indicators in the existing economic system directly, thereby satisfying the exogenous conditions. Lin and Tan [55] used terrain fluctuations as a tool variable for analyzing the effects of the economic aggregation on the efficiency of the green economy. The urban slope is a geographically existing factor that does not affect the green technology efficiency of manufacturing directly but the urban slope is related closely to the urban population, transportation, and other innovative factors. Accordingly, this study used the average slope of the city as a tool variable for innovation ability and used the two-stage least-squares and instrumental variables (IV)–Tobit methods to further identify the causal relationship between innovation ability and green technology manufacturing efficiency.
Column 6 of Table 4 is the result of adopting the two-stage least-squares method with all control variables added. The innovation capability still had a significant positive effect on the green technology efficiency of the manufacturing industry. Moreover, the regression coefficient of innovation ability was improved significantly compared to the estimated value of the benchmark regression coefficient, indicating that benchmark regression underestimated the positive effect of innovation ability on the green technology efficiency of manufacturing. The F-test value of the first stage was 25.84, which was greater than 10, which indicated that there was no weak instrumental variable problem. This study also attempted to use the IV–Tobit method for testing. The results in column 7 of Table 4 show that innovation capability was also conducive to improving the efficiency of green technology in manufacturing.
6. Conclusions and Discussion
Based on the 2011–2017 panel data of prefecture-level cities in China, this study used a spatial autocorrelation method and a Tobit model to analyze the effects of regional innovation capacity on the green technology efficiency of China’s manufacturing industry and drew the following conclusions. First, the local correlation pattern of green technology efficiency in China’s manufacturing industry was characterized by “large agglomeration and small dispersion.” The H–H clusters areas were concentrated in cities along the eastern coast of Beijing–Tianjin–Hebei, Shandong Peninsula, Yangtze River Delta, Fujian Province, and Guangdong Province. The L–H clusters areas were attached around the H–H clusters areas, and H–L clusters areas were scattered in the provincial capital of central cities in the west and northeast. The above conclusion was consistent with that of Wang et al. [56]. Second, Wang et al. [56] viewed the innovation capability gap as an important factor in the imbalance between regions in China. We further found that the regional spatial agglomeration characteristics of China’s regional innovation capability were noteworthy, with H–H clusters as the main distribution type. The characteristics of the spatial pattern were distributed as “planar” contiguous patches and the trend inward, extending from the coast to the inland “axial band,” appeared gradually. H–L cluster areas all appeared in the capital cities of the western region and only Panzhihua City in Sichuan Province had a positive correlation with low innovation capacity. Third, the regional innovation capacity had a positive spatial correlation with the green technology efficiency of China’s manufacturing industry. Specifically, the eastern region had a more prominent role, while the western region had a weaker effect. Fourth, regional innovation had a significant direct promotion effect on the green technology efficiency of China’s manufacturing industry. Innovation has become a key driving force in the improvement of green technology efficiency in the contemporary era but the regional differences between the four major sectors were still very significant. The intermediary effect indicated that the regional innovation capacity had a positive effect on the green technology manufacturing efficiency through human capital and government revenue and that the waste treatment rate was not a medium for the regional innovation capacity to promote the green technology manufacturing efficiency. Finally, the various robust regression results maintained a high degree of consistency with the benchmark regression, indicating that the conclusion of this article is credible. After using the instrumental variables, the estimated value of the innovation coefficient of the benchmark regression was found to be improved significantly, and to a certain extent, the positive effect of innovation capacity on the green technology efficiency of the manufacturing industry was underestimated.
The research conclusion of this article has obvious policy implications. First, upgrading the innovation capabilities of the central, western, and northeastern regions is urgently needed. The construction of innovative basic platforms, such as national engineering laboratories and national key laboratories in the central, western, and northeastern regions should be strengthened, along with the dominant position of enterprises in technological innovation. The industrial technology innovation in terms of strategic alliances with universities and research institutes in the eastern region should continue to be built, and the innovation network that collaborates with industry chains across regions should be reinforced to accelerate research and development of key technologies in manufacturing. Policy support for innovation should be increased, intellectual property protection bolstered, further innovation reform programs should be formulated, and the overall innovation ecosystem should be improved. Second, human resource reserves should be consolidated, and priority should be given to the development of education. Basic education should be promoted to improve quality and efficiency, accelerate the development of modern vocational education, and build a new system of industrial talent training. A higher education innovation consortium should be created and support should be provided to local universities and internationally renowned universities to jointly carry out teaching and scientific research activities such that they can strive to cultivate a batch of internationally-renowned strategic scientific and technological talents, as well as high-level innovation-based teams. Finally, the transformation and upgrading of manufacturing green industries should be promoted. The implementation of “Made in China 2025” should be accelerated and energy-saving and environmental protection, new materials, new energy, and other emerging industries should be explored through the use of big data, cloud computing, blockchain, and other new technologies to promote enterprise products to the middle and high ends of the market. Furthermore, high pollution, high-energy-consuming industries should be eliminated gradually by creating an industrial chain of resource recycling in enterprise parks, improving the level of harmless treatment and comprehensive utilization of waste, reducing energy and material consumption, implementing cleaner production supervision, and improving green technical efficiency.
Although some possible problems with the study have been considered, further deficiencies include certain limitations of the data, as well as its focus on only A-share listed companies in the manufacturing industry. As a result, the study does not comprehensively analyze the green technology efficiency of all manufacturing industries in China. Moreover, since 2017, the statistical caliber of the China City Statistical Yearbook has changed, where important factors, such as transportation, population density, and fixed asset investment, were now being considered as control variables. Subsequent research can be carried out from the following aspects: comparing the heterogeneous effects of innovation capabilities on the efficiency of different types of green manufacturing technologies and clarifying the in-depth mechanism of the differences of the effects of regional innovation capabilities on green technology manufacturing efficiency in the different regions in China. This would provide theoretical support for the government to formulate scientific and technological innovation strategies and manufacturing industry planning for the future.
Author Contributions
In this research study, T.W. conceived the study and polished the language; A.S. wrote the introduction and conducted the literature review; Y.F. analyzed the data and wrote the paper. L.W. and G.T.C. made suggestions and edited the paper. All authors have read and agreed to the published version of the manuscript.
Funding
This research was supported by the National Natural Science Foundation of China (grant no. 41471103) and Major Projects of Philosophy and Social Science Research in Universities of Jiangsu Province (grant no. 2020SJZDA135).
Conflicts of Interest
The authors declare no conflict of interest.
References
- UNECE. 20 Years of Environmental Performance Reviews: Impacts, Lessons Learned and the Potential to Integrate the Sustainable Development Goals; Batumi, Georgia, 27 May 2016; Available online: www.unece.org/fileadmin/DAM/env/documents/2016/ece/ece.batumi.conf.2016.inf.5.e.pdf (accessed on 18 October 2020).
- Avtar, R.; Tripathi, S.; Aggarwal, A.K. Assessment of energy-population-urbanization. Land 2019, 8, 124. [Google Scholar] [CrossRef]
- El-kassar, A.; Kumar, S. Green innovation and organizational performance: The influence of big data and the moderating role of management commitment and HR practices. Technol. Forecast. Soc. Chang. 2018, 1–16. [Google Scholar] [CrossRef]
- Li, Y. Environmental innovation practices and performance: Moderating effect of resource commitment. J. Clean. Prod. 2014, 66, 450–458. [Google Scholar] [CrossRef]
- Schiederig, T.; Tietze, F.; Herstat, C. What is green Innovation? A quantitative literature review. Working Paper 63. In Proceedings of the XXII ISPIM Conference, Hamburg, Germany, 12–15 June 2011. [Google Scholar]
- Calza, F.; Parmentola, A.; Tutore, I. Types of green innovations: Ways of implementation in a non-green industry. Sustainability 2017, 9, 1301. [Google Scholar] [CrossRef]
- Fernando, Y.; Wah, W.X. The impact of eco-innovation drivers on environmental performance: Empirical results from the green technology sector in Malaysia. Sustain. Prod. Consum. 2017, 12, 27–43. [Google Scholar] [CrossRef]
- Wang, W.; Yu, B.; Yan, X.; Yao, X.; Liu, Y. Estimation of innovation’s green performance: A range-adjusted measure approach to assess the unified efficiency of China’s manufacturing industry. J. Clean. Prod. 2017, 149, 919–924. [Google Scholar] [CrossRef]
- Nahm, J.; Steinfeld, E.S. Reinventing mass production: China’s specialization in innovative manufacturing. Engineering 2012. [Google Scholar] [CrossRef]
- Zhang, D.; Cao, H.; Zou, P. Exuberance in China’s renewable energy investment: Rationality, capital structure and implications with firm level evidence. Energy Policy 2016, 95, 468–478. [Google Scholar] [CrossRef]
- Zhang, Y.; Xing, C.; Wang, Y. Does green innovation mitigate financing constraints? Evidence from China’s private enterprises. J. Clean. Prod. 2020, 264, 121698. [Google Scholar] [CrossRef]
- Qingqing, W.; He, X.; Yijuan, J. Growing a green economy in China. Environ. Earth Sci. 2008, 12, 052082. [Google Scholar] [CrossRef]
- Kong, T.; Feng, T.; Ye, C. Advanced manufacturing technologies and green innovation: The role of internal environmental collaboration. Sustainability 2016, 8, 1056. [Google Scholar] [CrossRef]
- Zhang, Y.; Sun, J.; Yang, Z.; Wang, Y. Critical success factors of green innovation: Technology, organization and environment readiness. J. Clean. Prod. 2020, 264, 121701. [Google Scholar] [CrossRef]
- Aldieri, L.; Kotsemir, M.N.; Vinci, C.P. Knowledge spillover effects: Empirical evidence from Russian regions. Qual. Quant. 2018, 52, 2111–2132. [Google Scholar] [CrossRef]
- Auteri, M.; Guccio, C.; Pammolli, F.; Pignataro, G.; Vidoli, F. Spatial heterogeneity in non-parametric efficiency: An application to Italian hospitals. Soc. Sci. Med. 2019, 239, 112544. [Google Scholar] [CrossRef] [PubMed]
- Cirone, A.E.; Urpelainen, J. Technovation Political market failure? The effect of government unity on energy technology policy in industrialized democracies. Technovation 2013, 33, 333–344. [Google Scholar] [CrossRef]
- Guo, Y.; Xia, X.; Zhang, S.; Zhang, D. Environmental regulation, government R&D funding and green technology innovation: Evidence from China provincial data. Sustainability 2018, 10, 940. [Google Scholar] [CrossRef]
- Gu, S.; Schwag Serger, S.; Lundvall, B.Å. China’s innovation system: Ten years on. Innov. Manag. Policy Pract. 2016, 18, 441–448. [Google Scholar] [CrossRef]
- Gu, S.; Lundvall, B.Å.; Ju, L.; Malerba, F.; Serger, S.S. China’s system and vision of innovation: An analysis in relation to the strategic adjustment and the medium- to long-term S&T development plan (2006-20). Ind. Innov. 2009, 16, 369–388. [Google Scholar] [CrossRef]
- Bi, K.; Huang, P.; Wang, X. Technological forecasting & social change innovation performance and in fluencing factors of low-carbon technological innovation under the global value chain: A case of Chinese manufacturing industry. Technol. Forecast. Soc. Chang. 2016. [Google Scholar] [CrossRef]
- Gao, Y.; Zang, L.; Roth, A.; Wang, P. Does democracy cause innovation? An empirical test of the popper hypothesis. Res. Policy 2017, 46, 1272–1283. [Google Scholar] [CrossRef]
- The Council on Competitiveness. Measuring Regional Innovation: A Guide Book for Conducting Regional Innovation Assesment, 1st ed.; The Council on Competitiveness: Washington, DC, USA, 2005; ISBN 1889866261. [Google Scholar]
- Qu, Y.; Yu, Y.; Appolloni, A.; Li, M.; Liu, Y. Measuring green growth efficiency for Chinese manufacturing industries. Sustainability 2017, 9, 637. [Google Scholar] [CrossRef]
- Du, J. Assessing regional differences in green innovation efficiency of industrial enterprises in China. Int. J. Environ. Res. Public Health 2019, 16, 940. [Google Scholar] [CrossRef] [PubMed]
- Hu, S.; Liu, S.; Li, D.; Lin, Y. How does regional innovation capacity affect the green growth performance? Empirical evidence from China. Sustainability 2019, 11, 5084. [Google Scholar] [CrossRef]
- Chen, X.; Liu, Z.; Ma, C. Chinese innovation-driving factors: Regional structure innovation effect, and economic development-empirical research based on panel data development-empirical research based on panel data. Ann. Reg. Sci. 2017, 59, 43–68. [Google Scholar] [CrossRef]
- Li, T.; Liang, L.; Han, D. Research on the efficiency of green technology innovation in China’s provincial high-end manufacturing industry based on the RAGA-PP-SFA Model. Math. Probl. Eng. 2018, 9463707. [Google Scholar] [CrossRef]
- Motohashi, K. The regional innovation system in China: Regional comparison of technology, venture financing, and human capital focusing on Shenzhen. RIETI Policy Discuss. Pap. Ser. 2018, 18-P-012. Available online: https://www.rieti.go.jp/jp/publications/pdp/18p012.pdf (accessed on 18 October 2020).
- Yuan, B.; Xiang, Q. Environmental regulation, industrial innovation and green development of Chinese manufacturing: Based on an extended CDM model. J. Clean. Prod. 2018, 176, 895–908. [Google Scholar] [CrossRef]
- Min, S.; Kim, J.; Sawng, Y.W. The effect of innovation network size and public R&D investment on regional innovation efficiency. Technol. Forecast. Soc. Change 2020, 155, 119998. [Google Scholar] [CrossRef]
- Zhang, J.; Chang, Y.; Zhang, L.; Li, D. Do technological innovations promote urban green development?—A spatial econometric analysis of 105 cities in China. J. Clean. Prod. 2018, 182, 395–403. [Google Scholar] [CrossRef]
- Brakman, S.; Marrewijk, C. Introduction: Heterogeneity at different spatial scales. J. Reg. Sci. 2009, 49, 607–615. [Google Scholar] [CrossRef]
- Wei, Z.; Song, X.; Xie, P. How does management innovation matter for performance: Efficiency or legitimacy? Chinese Manag. Stud. 2019, 25, 275–296. [Google Scholar] [CrossRef]
- Miao, C.; Fang, D.; Sun, L.; Luo, Q. Natural resources utilization efficiency under the influence of green technological innovation. Resour. Conserv. Recycl. 2017, 126, 153–161. [Google Scholar] [CrossRef]
- Hou, S.; Yao, M. Spatial-temporal evolution and trend prediction of agricultural eco-efficiency in China: 1978–2016. Acta Geogr. Sin. 2018, 73, 2168–2183. [Google Scholar] [CrossRef]
- Jorgenson, D.; Gollop, F.; Fraumeni, B. Productivity and U.S. Economic Growth, 1st ed.; Elsevier: Duivendrecht, The Netherlends, 2016. [Google Scholar]
- He, S.; Du, D.; Jiao, M.; Lin, Y. Spatial-temporal characteristics of urban innovation capability and impact factors analysis in China. Sci. Geogr. Sin. 2017, 37, 1014–1022. [Google Scholar] [CrossRef]
- Liu, C.; Gao, X.; Ma, W.; Chen, X. Research on regional differences and influencing factors of green technology innovation efficiency of China’s high-tech industry. J. Comput. Appl. Math. 2020, 369, 112597. [Google Scholar] [CrossRef]
- Li, C.; Li, M.; Zhang, L.; Li, T.; Ouyang, H.; Na, S. Has the high-tech industry along the belt and road in China achieved green growth with technological innovation efficiency and environmental sustainability? Int. J. Environ. Res. Public Health 2019, 16. [Google Scholar] [CrossRef] [PubMed]
- Aigner, D.; Lovell, C.A.K.; Schmidt, P. Formulation and estimation of stochastic frontier production function models. J. Econom. 1977, 6, 21–37. [Google Scholar] [CrossRef]
- Battese, G.E.; Coelli, T.J. Frontier production functions, technical efficiency and panel data: With application to paddy farmers in India. J. Product. Anal. 1992, 3, 153–169. [Google Scholar] [CrossRef]
- Yang, Y.; Deng, X.; Li, Z.; Wu, F.; Li, X. Impact of land use change on grain production efficiency in North China Plain during 2000–2015. Geogr. Res. 2017, 36, 2171–2183. [Google Scholar] [CrossRef]
- Zhou, R.; Zhuang, R.; Huang, C. Pattern evolution and formative mechanism of aging in China. Acta Geogr. Sin. 2019, 74, 2163–2177. [Google Scholar] [CrossRef]
- Yuan, H.; Zhang, T.; Feng, Y.; Liu, Y.; Ye, X. Does financial agglomeration promote the green development in China? A spatial spillover perspective. J. Clean. Prod. 2019, 237, 117808. [Google Scholar] [CrossRef]
- Anselin, L.; Syabri, I.; Smirnov, O. Visualizing multivariate spatial correlation with dynamically linked windows. Urbana 2002, 51, 61801. [Google Scholar]
- Xu, D.; Huang, Z.; Huang, R. The spatial effects of haze on tourism flows of Chinese cities: Empirical research based on the spatial panel econometric model. Acta Geogr. Sin. 2019, 74, 814–830. [Google Scholar] [CrossRef]
- Lin, B.; Tan, R. Economic agglomeration and green economy efficiency in China. Econ. Res. J. 2019, 54, 119–132. [Google Scholar]
- Miao, C.; Fang, D.; Sun, L.; Luo, Q.; Yu, Q. Driving effect of technology innovation on energy utilization efficiency in strategic emerging industries. J. Clean. Prod. 2018, 170, 1177–1184. [Google Scholar] [CrossRef]
- Sun, H.; Edziah, B.K.; Sun, C.; Kporsu, A.K. Institutional quality, green innovation and energy efficiency. Energy Policy 2019, 135. [Google Scholar] [CrossRef]
- Fan, J.; Liu, H.; Wang, Y.; Zhao, Y.; Chen, D. “The northeast china phenomenon” and prejudgment on economic revitalization in northeast China: A primary research on stable factors to impact national spatial development and protection pattern. Sci. Geogr. Sin. 2016, 36, 1445. [Google Scholar] [CrossRef]
- Jin, F.; Wang, J.; Yang, Y.; Ma, L.; Qi, Y. The paths and solutions of innovation development in northeast China. Sci. Geogr. Sinica 2016, 36, 1285–1292. [Google Scholar] [CrossRef]
- Wen, Z.; Chang, L.; Hua, K.-T.; Liu, H. Testing and application of the mediating effects. Acta Psychol. Sin. 2004, 36, 614–620. [Google Scholar]
- Muller, D.; Judd, C.M.; Yzerbyt, V.Y. When moderation is mediated and mediation is moderated. J. Pers. Soc. Psychol. 2005, 89, 852–863. [Google Scholar] [CrossRef]
- Lin, B.; Tan, R. Organized crime and business subsidies: Where does the money go? J. Urban Econ. 2015, 86, 98–110. [Google Scholar] [CrossRef]
- Wang, K.; Yu, S.; Zhang, W. China’s regional energy and environmental efficiency: A DEA window analysis based dynamic evaluation. Math. Comput. Model. 2013, 58, 1117–1127. [Google Scholar] [CrossRef]


Publisher’s Note: MDPI stays neutral with regard to jurisdictional claims in published maps and institutional affiliations. |
© 2020 by the authors. Licensee MDPI, Basel, Switzerland. This article is an open access article distributed under the terms and conditions of the Creative Commons Attribution (CC BY) license (http://creativecommons.org/licenses/by/4.0/).