Article

Energy Performance and Radial Force of Vertical Axis Darrieus Turbine for Ocean Energy

1
State Key Laboratory of Hydroscience and Engineering, Beijing Key Laboratory of CO2 Utilization and Reduction Technology, Department of Energy and Power Engineering, Tsinghua University, Beijing 100084, China
2
College of Water Resources and Architectural Engineering, Northwest A & F University, Xianyang 712100, China
*
Authors to whom correspondence should be addressed.
Energies 2020, 13(20), 5412; https://doi.org/10.3390/en13205412
Submission received: 25 August 2020 / Revised: 30 September 2020 / Accepted: 1 October 2020 / Published: 16 October 2020
(This article belongs to the Section A3: Wind, Wave and Tidal Energy)

Abstract

:
Vertical axis Darrieus turbine is the key component for ocean energy conversion and utilization. In the present work, the energy performance, flow pattern, and radial force for a vertical axis Darrieus turbine were investigated. The experimental measurements and numerical simulations were in good agreement, which validates the accuracy and reliability of the numerical method. The results showed that the power coefficient gradually increased with the increase of tip speed ratio λ, and the power coefficient had three peaks in a revolution of runner due to three blades. The complex vortex induced by the turbine revolution mainly includes the blade tip vortex and blade surface vortex, which are related to the turbine rotation and flow separation on blade surface. The vorticity transport equation was first introduced to analyze the mechanism and evolution of vortex in a vertical axis Darrieus turbine, and the results revealed that the relative vortex elongation term is the main driving force for the formation and development of the blade surface vortex. The radial force of the Darrieus turbine gradually increases with the increase in tip speed ratio, and it is symmetrical with three humps due to three blades.

1. Introduction

Global carbon dioxide emissions have been increasing every year because of the extensive use of traditional fossil energy, which has triggered the greenhouse effect and brought huge environmental problems. Therefore, new types of clean, renewable, and sustainable energies are exploring and developing around the world [1,2]. Among them, ocean energy, as a new type of renewable energy with great reserves, is focused and researched by scholars.
The marine energy turbines are usually employed to develop ocean energy and are mainly divided into horizontal axis hydrokinetic turbines and vertical axis hydrokinetic turbines (VAHT). Compared with the horizontal axis hydrokinetic turbine, the VAHT is more suitable for the development and utilization of ocean tidal energy under complex ocean conditions in the deep sea due to its low cost and simple structure [3].
As an important type of VAHT, the Darrieus turbine has attracted attention because of its higher energy utilization rate. Kiho et al. [4] did cross-strait experiments by installing a Darrieus turbine with a diameter of 1.6 m in the Kurushima Strait, the highest efficiency was 56% in the flow rate of 1.1 m/s. Then, Matsushita et al. [5] studied the influence of blade tip clearance using a NACA0018 blade linear Darrieus rotor on power efficiency by experiments. After that, Dai et al. [6] experimentally investigated the energy performance of four groups of NACA0025 blade hydrofoils with different chord lengths and radii, and the results revealed that the larger the rotor, the higher the power efficiency. Moreover, Furukawa et al. [7,8] studied the turbine performance with or without a draft tube by changing the gap between the turbine and blade tip, and the maximum power efficiency was 57% with the NACA0018 hydrofoil. Results showed that the use of a draft tube can improve the efficiency. Meanwhile, they proposed that the draft tube and runner casing can be replaced by the water inlet, which can obtain more energy and increase the torque and self-starting ability of the water turbine. Additionally, a new Darrieus type was proposed by Shimokawa [9], which is suitable for extremely low water head (2 m). Results showed that installing an inlet nozzle upstream can improve the performance of the hydraulic turbine. In addition, Benzerdjeb et al. [10] discussed the influence of blade attack angle on its energy performance through experiments, and the results showed that when the blade angle was 1.75, the flow pattern was stable and the output power of turbine was the best. Roa et al. [11] found that the structure with the shrouded configuration could improve the energy performance of the Darrieus turbine. Zhen et al. [12] discovered the power coefficients of different startup modes for Darrieus turbines. Marsh et al. [13,14] compared straight blades with spiral blades and found that Darrieus turbines with straight blades were more suitable for ocean current power. They also found that different connecting arms could affect the power output coefficients of turbines [15]. Gruillaud et al. [3] studied the optimal power coefficient of the Darrieus turbine by using the method of large eddy simulation and found that the maximum power coefficient could be obtained at optimal conditions. Khanjanpour et al. [16] discussed the influence of turbine surface roughness on its power coefficient and found that reducing surface roughness could improve the energy conversion efficiency of the turbine.
Aside from studying the energy performance of the Darrieus turbine, researchers have also carried out a series of investigations on the vortex dynamics mechanism of the Darrieus turbine. In the vertical axis hydrokinetic turbine, when the blades move to the upstream of the rotor, stall shedding vortex generates, and the vortex will move to the tail along with the flow of water. Meanwhile, other blades and shafts influence the movement and development of the stall shedding vortex, and generate a flow-around shedding vortex, which act on the flow of the downstream rotor together with the stall shedding vortex and generate wake vortex and develop backward. Manganga et al. [17] proved the dominant influence of turbulence intensity on the wake recovery length. Later, Mercier et al. [18] used LDV (laser doppler velocimetry) to conduct experimental research on the wake shedding vortex of three-blade Darrieus turbine, which proved the accuracy of the computational fluid dynamics (CFD) method in predicting the Darrieus wake vortex. After that, Li Y et al. [19] analyzed the three-dimensional effect of the Darrieus turbine by means of experimental measurements and numerical simulations. The authors found that the three-dimensional effect was significant when the turbine height was less than twice the radius. Then, Gorle et al. [20] investigated the performance of a Darrieus turbine in limited flow area through numerical simulation and drag test and found that the numerical simulation had high consistency with the experimental results. Furthermore, Ouro et al. [21,22] found that the stall characteristic was more obvious at low tip speed ratio. The wake vortex recovery was studied through experiments, and three wake regions were determined, a near-wake region (2D, D is rotor diamonds), a transition region (2D–5D), and a far-wake region (5D). Pellone [23,24] and Marsh [25] discovered that the two-dimensional model was difficult to capture depth vortex and the three-dimensional model significantly improved the performance prediction of the model through experiments and numerical calculation. The authors concluded that the horseshoe vortex generated at the trailing edge of the blade was the main reason affecting the calculation accuracy. Later, Mejia et al. [26] found that the detached eddy simulation (DES) model improved the recognition of the vortex structure scale and could capture the flow phenomenon in the wake of the Darrieus turbine. Laín S et al. [27] made a visual analysis of the change of vorticity at different rotational speeds and found that the omega vortex had a negative influence on turbine output power. Furthermore, in the stall regime, the length of the tip vortices increases with decreasing TSR.
The radial force of rotating hydraulic machinery will cause vibration, noise. and even fatigue failure of the turbine, which has great influence on the operation stability of the turbine [28]. For a vertical axis Darrieus turbine, the radial force will affect the friction damage at the mechanical joint of the rotating shaft and the service life of the metal structure. Therefore, the research on radial force is significant and indispensable. From the above discussions, the energy performance and flow structure of Darrieus turbines have been investigated by many scholars, but there are a few relevant literatures studying the radial force, vortex structure characteristics, and their correlation mechanism.
The aim of this study was to investigate the energy performance, radial force, and the correlation mechanism between them by numerical simulation. First, the power coefficient curve of the numerical simulation was compared with that of the experimental results to validate the numerical method. Second, the radial force on the impeller was obtained, and the correlation mechanism between the radial force and the total power output was researched. Then, the vorticity transport equation was introduced, and the influence of vortex on the radial force of turbine investigated. Finally, the correlation mechanism between the radial force and vortex was studied.

2. Numerical Methodology

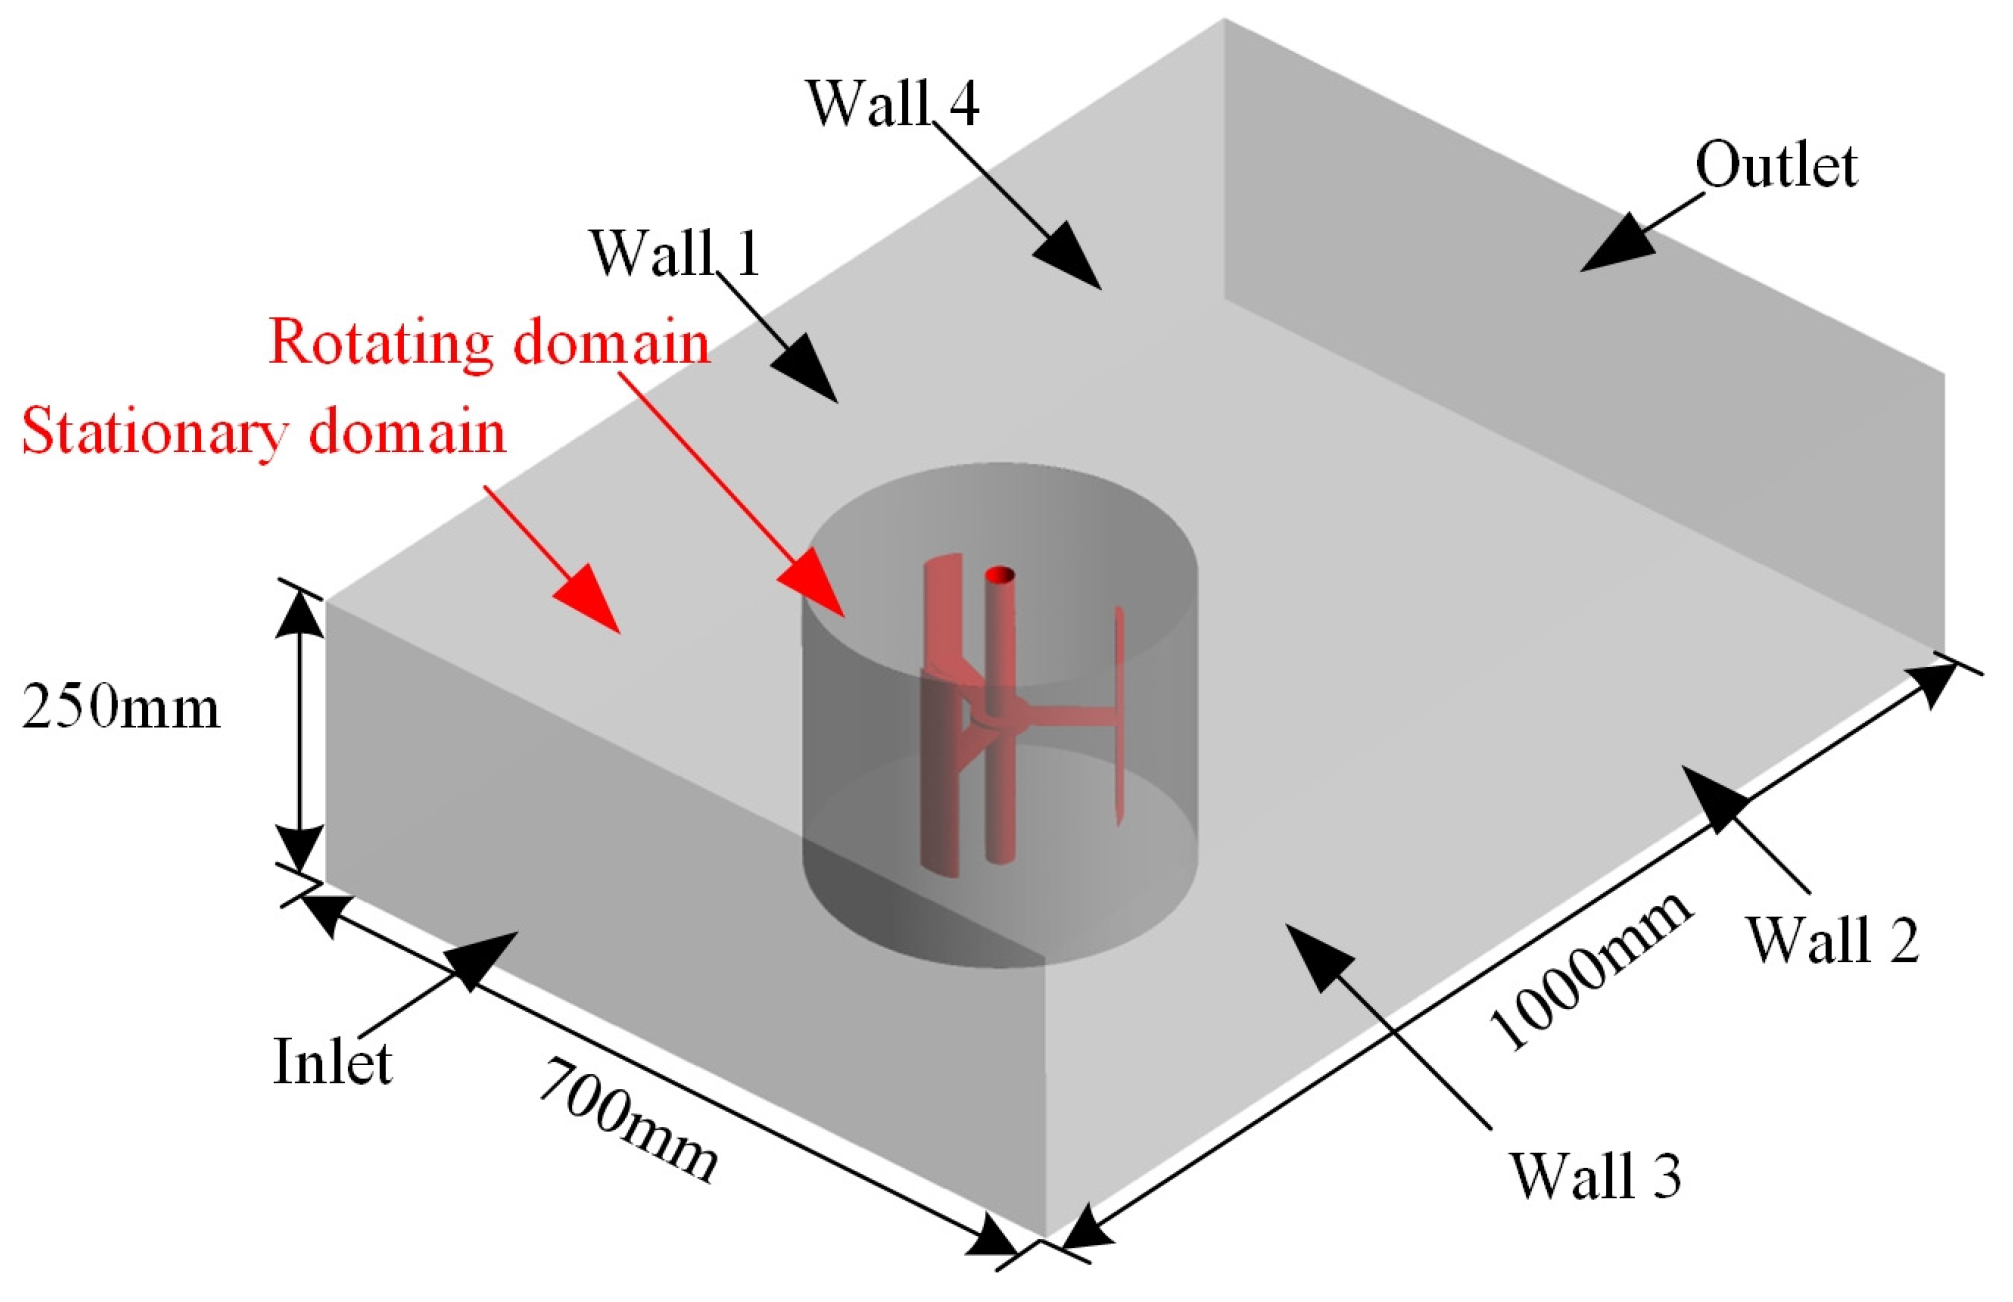
2.1. Geometry and Computational Domain of Darrieus Turbine

In the present work, the vertical axis Darrieus turbine with a straight blade was tested in the French LEGI laboratory [23,24]. The turbine included three straight blades, which were NACA0018 hydrofoils with height H = 175 mm and diameter D = 175 mm, the blade chord length was c = 32 mm, and the shaft diameter was 22 mm. The computational domain of the turbine model are shown in Figure 1. The computation domain of turbine consists of the fixed and rotating domains. The water tunnel in the LEGI laboratory was set at a length of 1000 mm, width of 700 mm, and height of 250 mm. The turbine was located downstream 350 mm from the tunnel inlet and symmetrical to sidewalls.

2.2. Characteristic Parameter

In the vertical axis turbine, the operation condition is mainly expressed by tip speed ratio λ, which can be expressed as:
λ = r ω v
where ω is the turbine rotational rate and r denotes the turbine radius.
The power coefficients Cp to evaluate the turbine energy characteristics is defined as follows:
C p = P 0.5 ρ v 3 S
where P is the output power of turbine; ρ is the water density; and S is the turbine frontal area. The blade attack angle α decreases with the increase of λ, and it can be defined as:
α = arctan ( sin θ cos θ + λ )
where θ is the blade phase angle.

2.3. Numerical Method

In the present work, CFX 17.0 was employed for the numerical simulation of the turbine. The Unsteady Reynolds-averaged Navier-Stokes (URANS)-based k-ω shear stress transport turbulence (SST) model was used to solve the second-order difference calculation based on the finite element finite volume method. It has the advantages of fast solution speed, high accuracy, and strong convergence. Therefore, it is suitable for the numerical simulation of flow field in rotating machinery.
For the discrete processing of pressure gradient terms, the second-order upwind style was adopted to ensure its simulation accuracy. The transient rotor-stator model was utilized to simulate rotation at each time step. The rotation interface model was set as a general grid interface (GGI), which connects the fixed domain and rotation domain.
The boundary conditions were set according to the experimental results in the LEGI laboratory. The inlet velocity was set as 2.3 m/s, and the outlet pressure was set as 1 atm, and the wall was set as a no slip wall condition.

2.4. Independence Test of Mesh Number

In the present work, four sets of grids were used to test the mesh number independence. The results under different grid numbers are shown in Figure 2. When the number of grids reached 8.01 million, the difference in energy capture coefficient Cp for the maximum two cases was below 0.04%. Therefore, the mesh with 8.01 million elements was chosen in the following calculation.

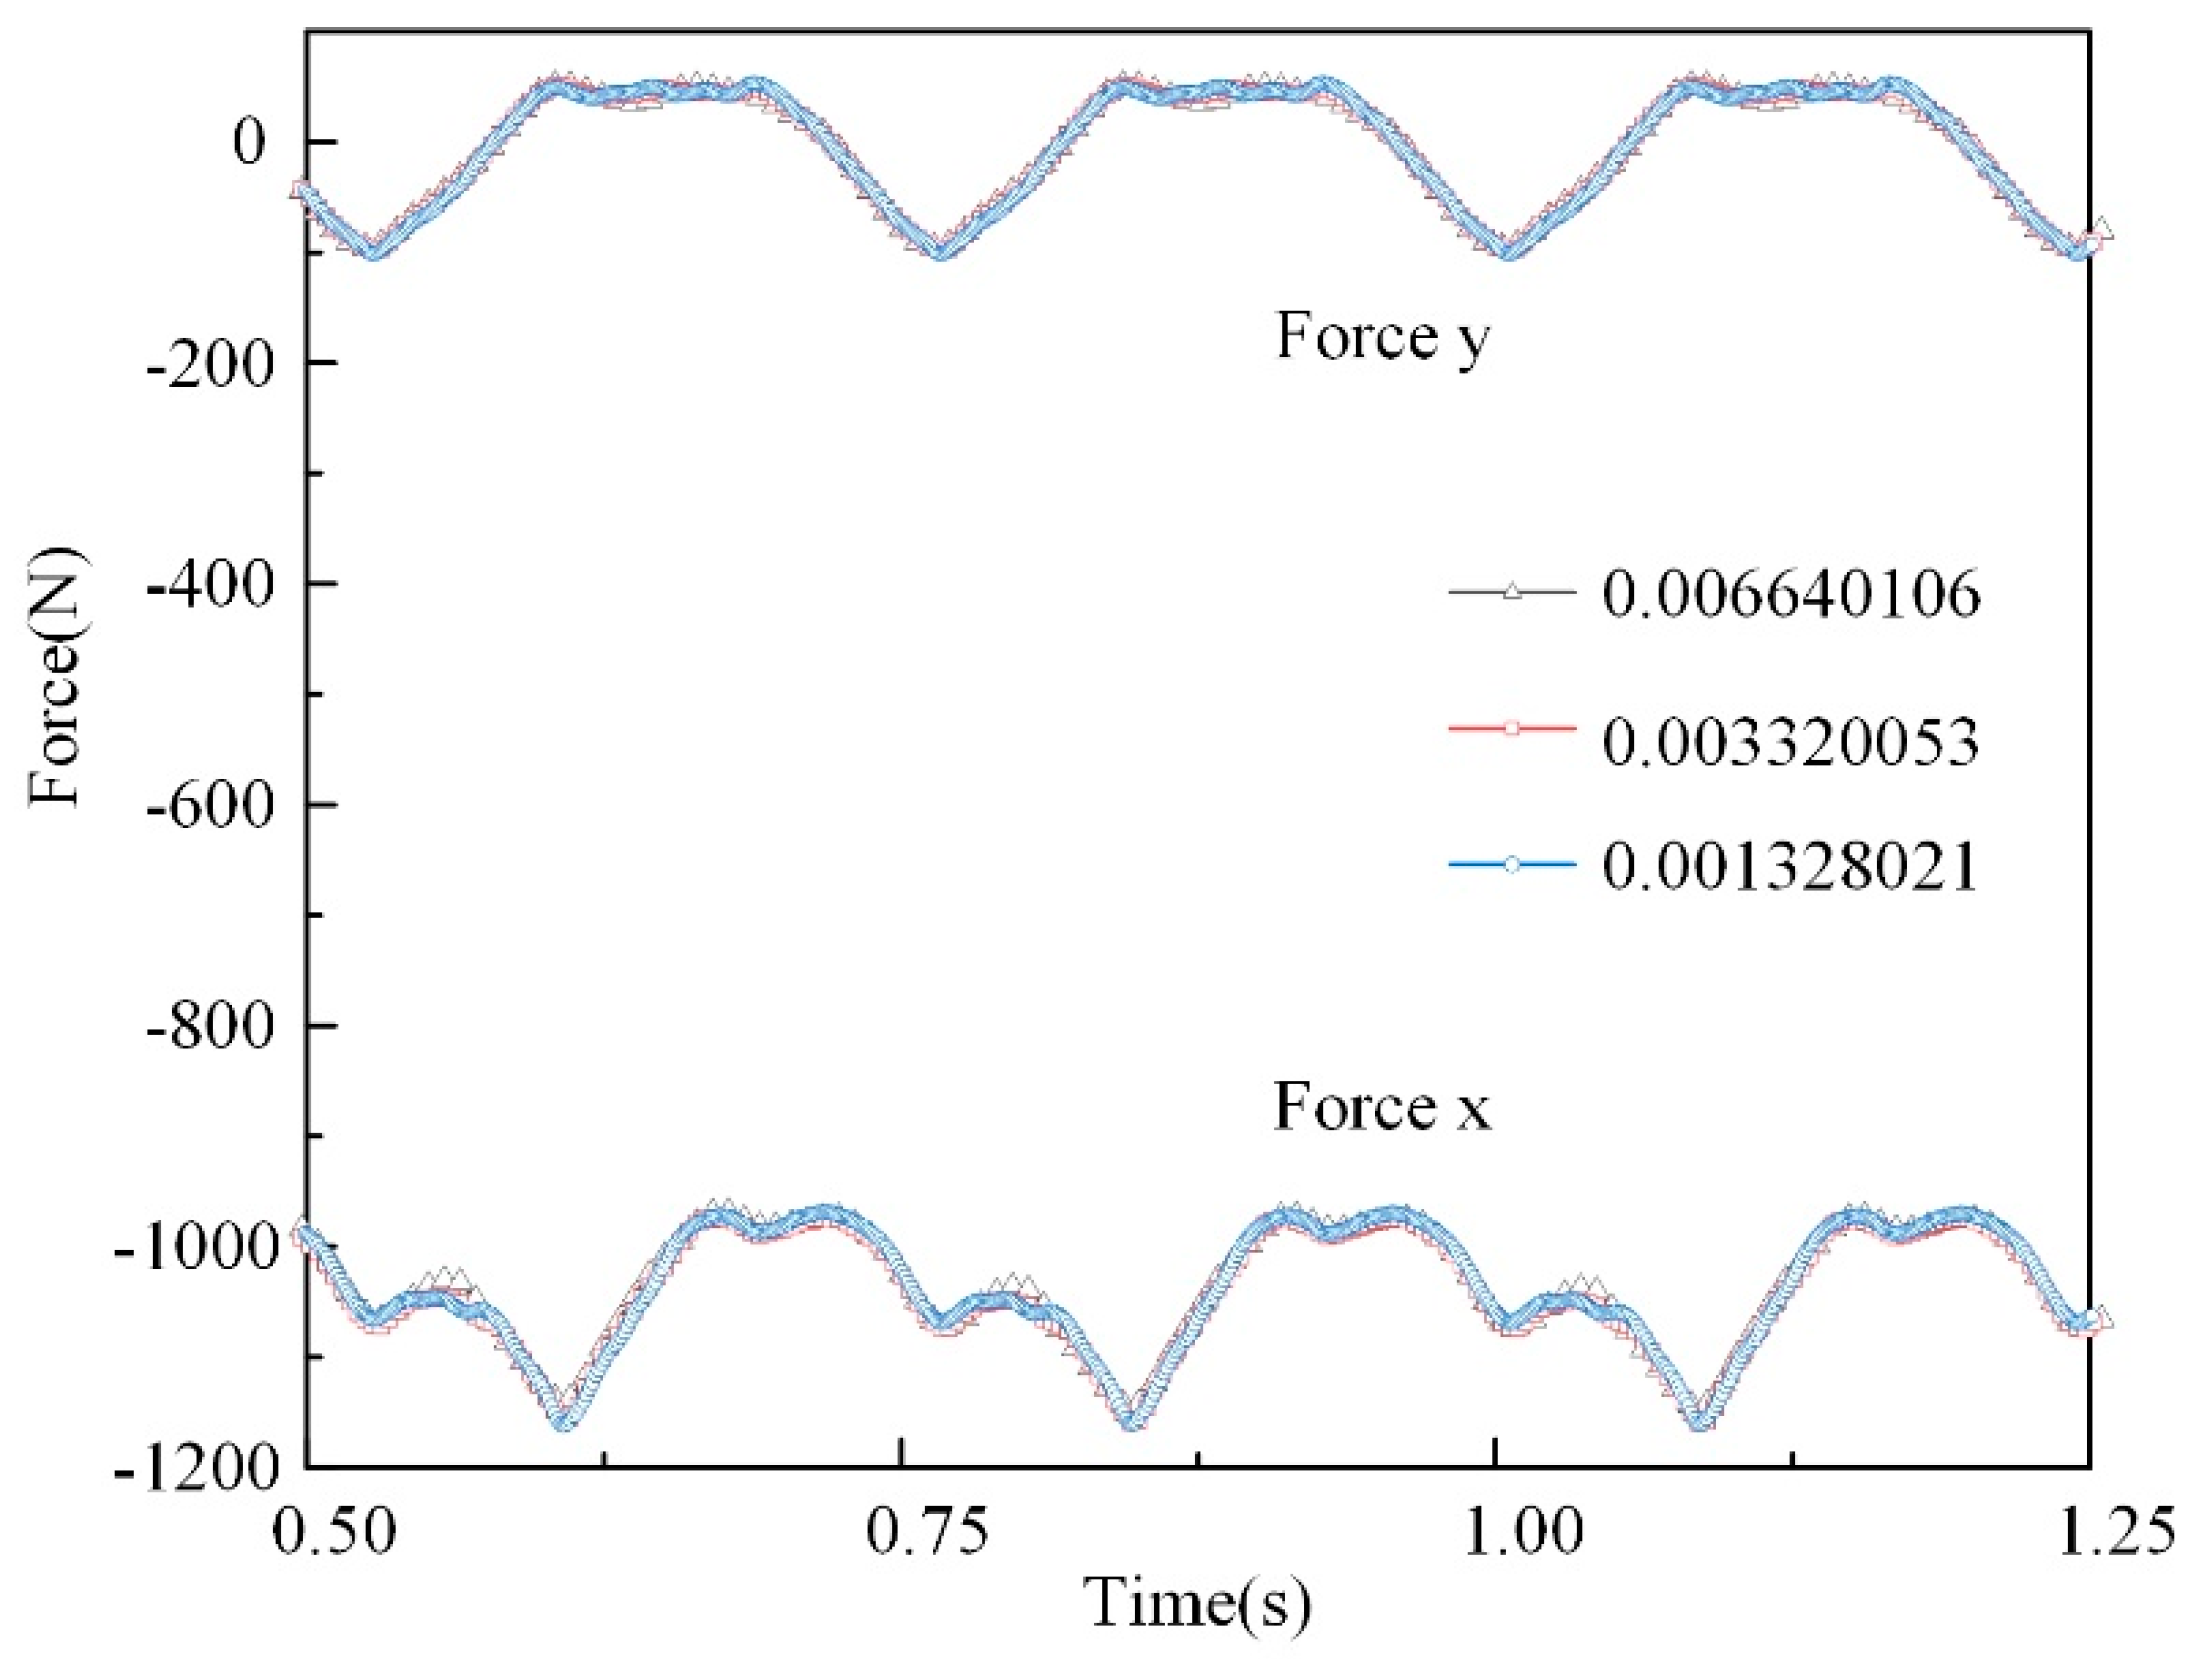
2.5. Independence Test of Time Step

Three groups of time step were employed to test the independence test of time step, 6.6401 × 10⁻³ s, 3.3200 × 10⁻³ s, and 1.3280 × 10⁻³ s. Figure 3 shows the force of turbine in the x and y direction. It can be seen that results under the three time steps were nearly the same. As a result, the time step 3.3200 × 10⁻³ s was chosen in the following investigation.

3. Result and Discussion

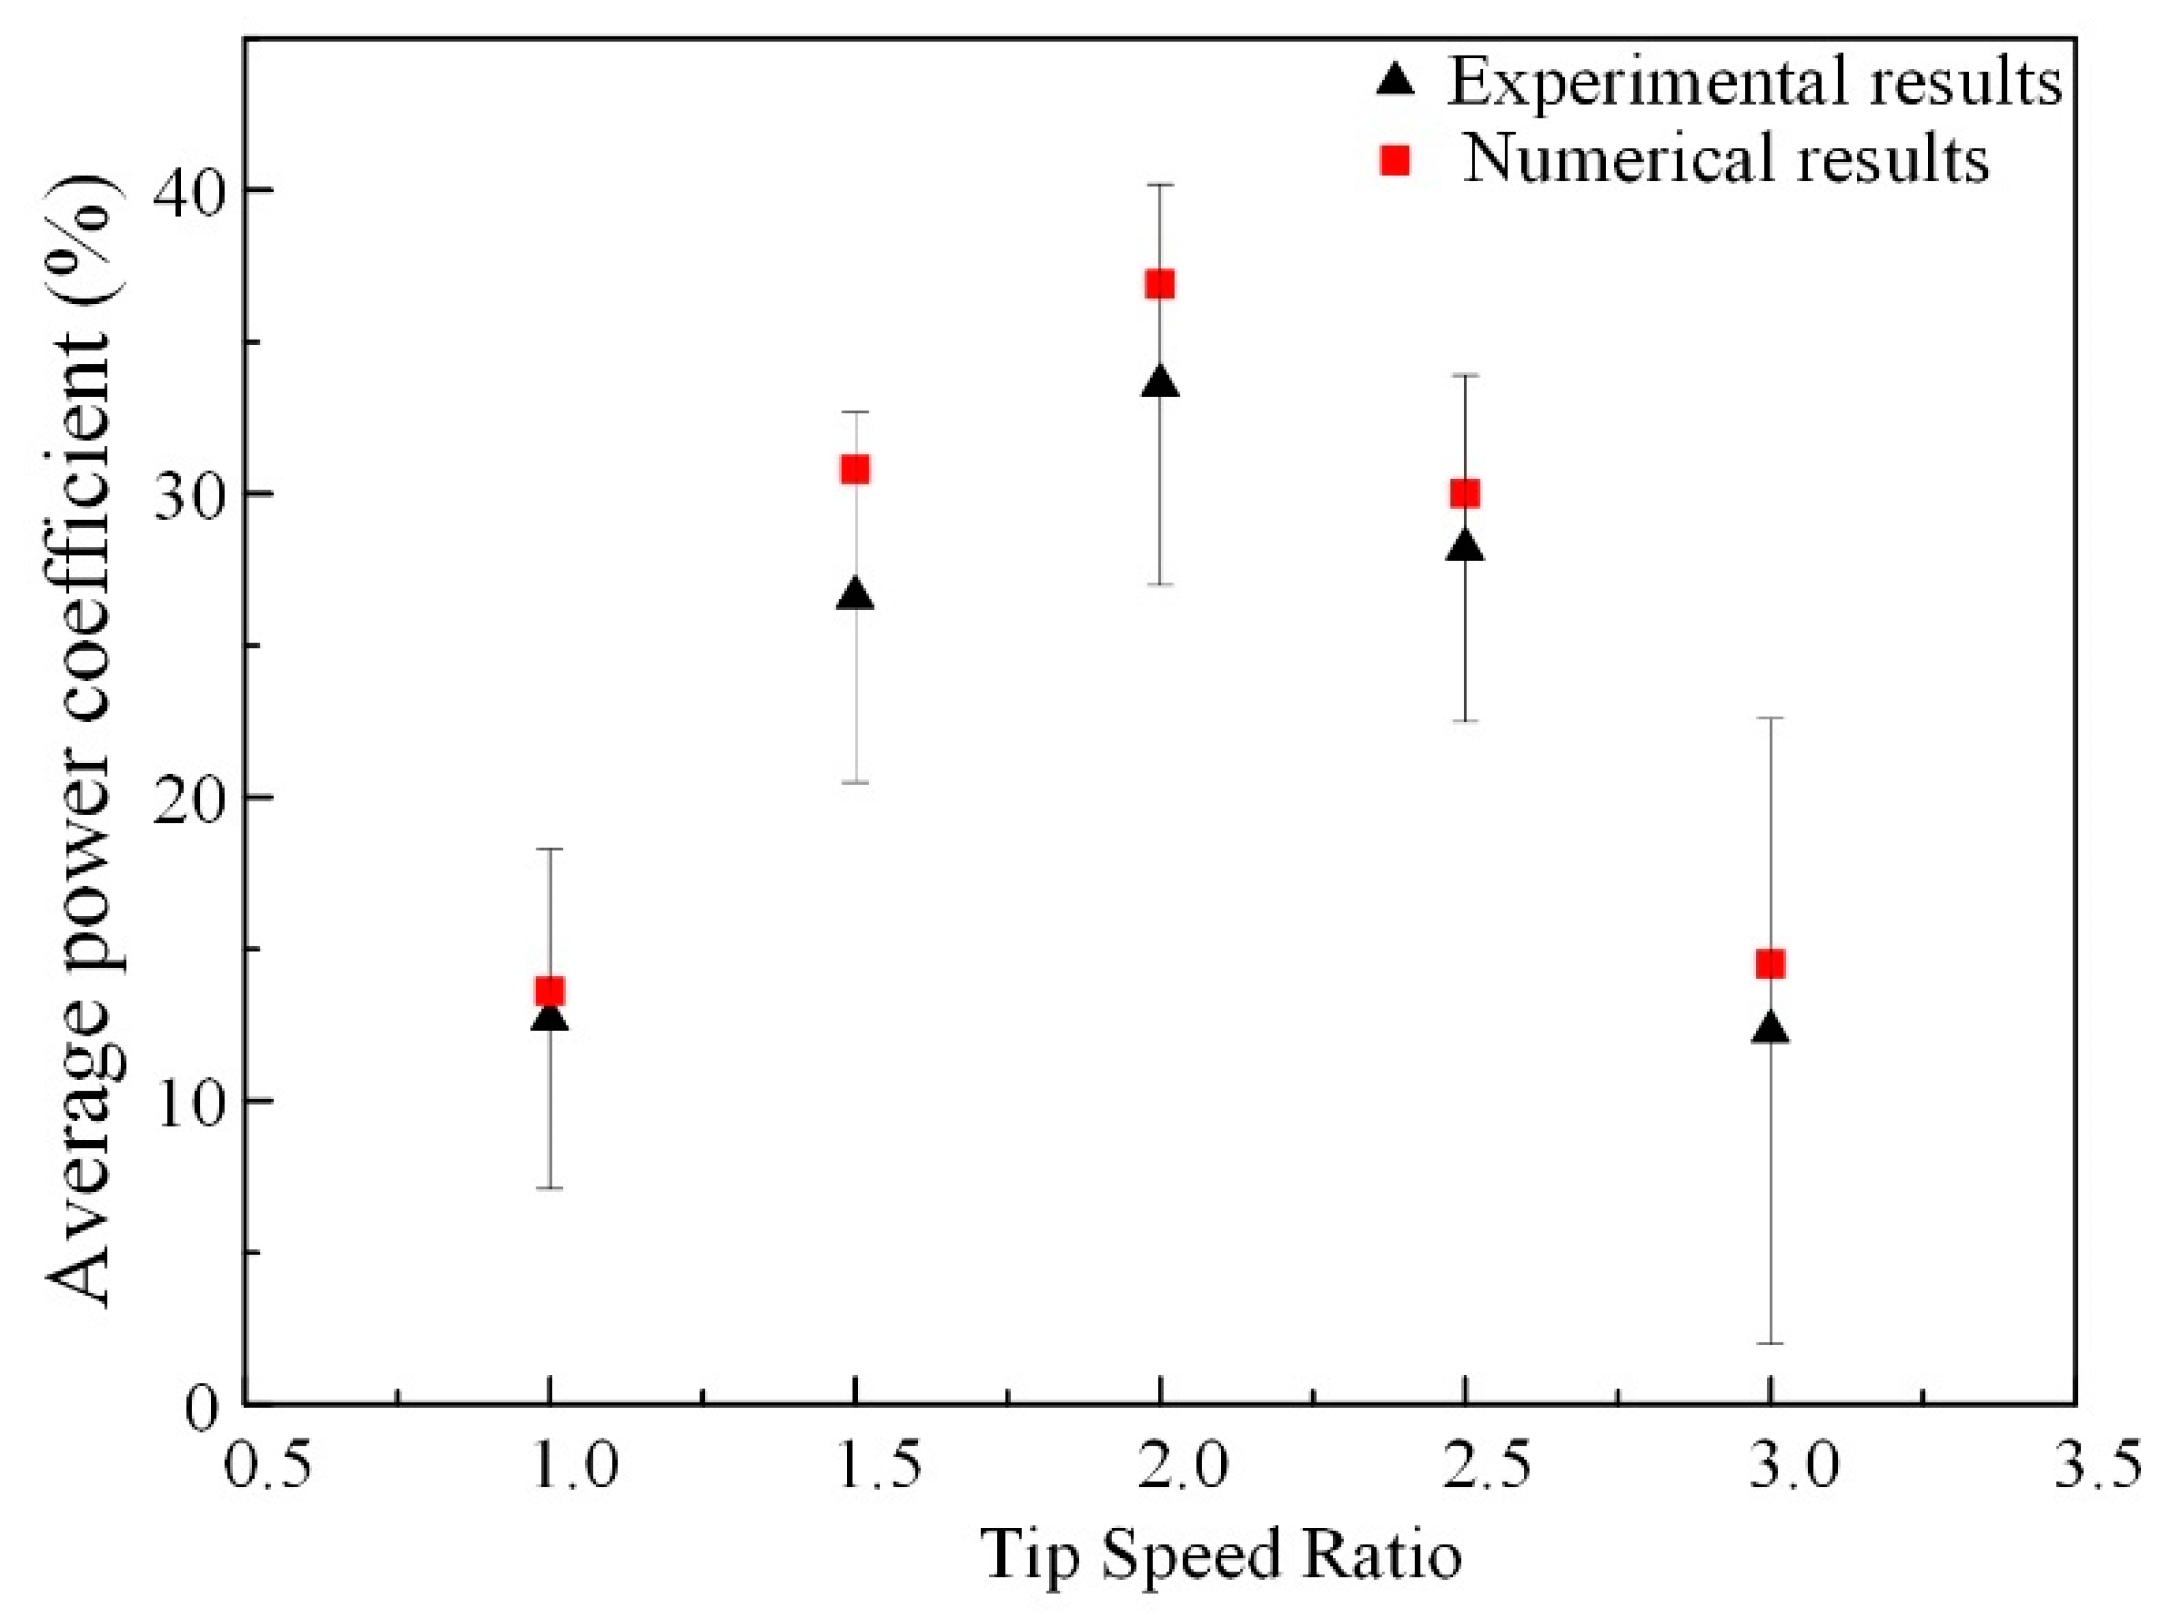
3.1. Validation of Numerical Simulations

In the present work, the experimental results under different tip speed ratios were obtained under the incoming flow velocity of 2.3 m/s [24]. The experimental measurements and numerical simulations are compared in Figure 4. At low λ, the simulation results were in a good agreement with the experimental results. At λ = 1.0, the difference between the numerical simulation and experiment was 2.36%. With the increase of λ, the gap between the numerical results and the experimental results gradually increased, and the reason is that the water leakage and mechanical friction between the rotating shaft and motor were neglected in the numerical simulation.

3.2. Energy Performance

To analyze the energy performance of the turbine under different λ, Figure 5 shows the phase angle of each blade. Figure 6 shows the instantaneous power coefficients of the turbines at various phase angles. Results showed that the power generation during one revolution was uneven, which was due to the hydrodynamics of the blade with a large lift at reasonable attack angle. The output power had three peaks and valleys in a revolution due to three blades.
Figure 6 shows the variation of thee power output of each blade and turbine under different tip speed ratios. In Figure 6a, the power output of the blade fluctuates greatly due to the strong stall induced by the blade attack angle [29]. With the increase in the tip speed ratio, the maximum instantaneous power of the turbine increases, and the power output curve is more stable. At λ = 2.5, the maximum instantaneous power of the turbine decreased slightly to about 0.6 due to the increase in the rotor speed and the wake interaction [30]. At λ = 3.0, the wake interaction was more obvious and the turbine power output coefficient decreased further. Figure 6f shows that the output power of each blade was concentrated in the upstream region of 0° ≤ θ ≤ 180°. The Cp value at some phase angle is close to 0 or even below 0 due to the variation of lift-drag force. Figure 6a also shows that the instantaneous power change of the turbine is extremely unstable at λ = 1.0, which was due to the induced stall under this operation condition. In addition, the power coefficient was relatively low at λ = 1.0, and the variation law is complex.
With the increase in λ, the instantaneous power of the turbine gradually increased, and the change law was sinusoidal. When λ was greater than 2.0, the curve of the instantaneous power of the turbine gradually decreased. This is due to the secondary effect of each blade in the downstream area affected by the upstream flow. The output power valley of the downstream area was lower. From a comparison of the instantaneous power of each blade at different tip speed ratios in Figure 6f, we found that when the tip speed ratio was below 2.0, the internal flow was dominated by a dynamic stall with the increase in the tip speed ratio. At the same time, the maximum instantaneous power of the blade increased gradually, and the average power factor also increased. However, with the tip speed ratio above 2.0, the maximum instantaneous power of the blade did not change significantly; when the blade was in the downstream region, the instantaneous power of the blade decreased accordingly.

3.3. Vortex Analysis

In the ocean, the complex flow conditions greatly influence the efficiency and stability of Darrieus turbines, especially for the induced vortex. Figure 7 shows the typical vortex induced by the turbine, mainly including the blade tip vortex and blade surface vortex at Q-criterion of 130,000 [s−2]. The blade tip vortex is due to the turbine rotation, and the blade surface vortex is induced by the flow separation on the blade surface, which is closely related to the blade phase angle and begins to form at 150° in the upstream region.

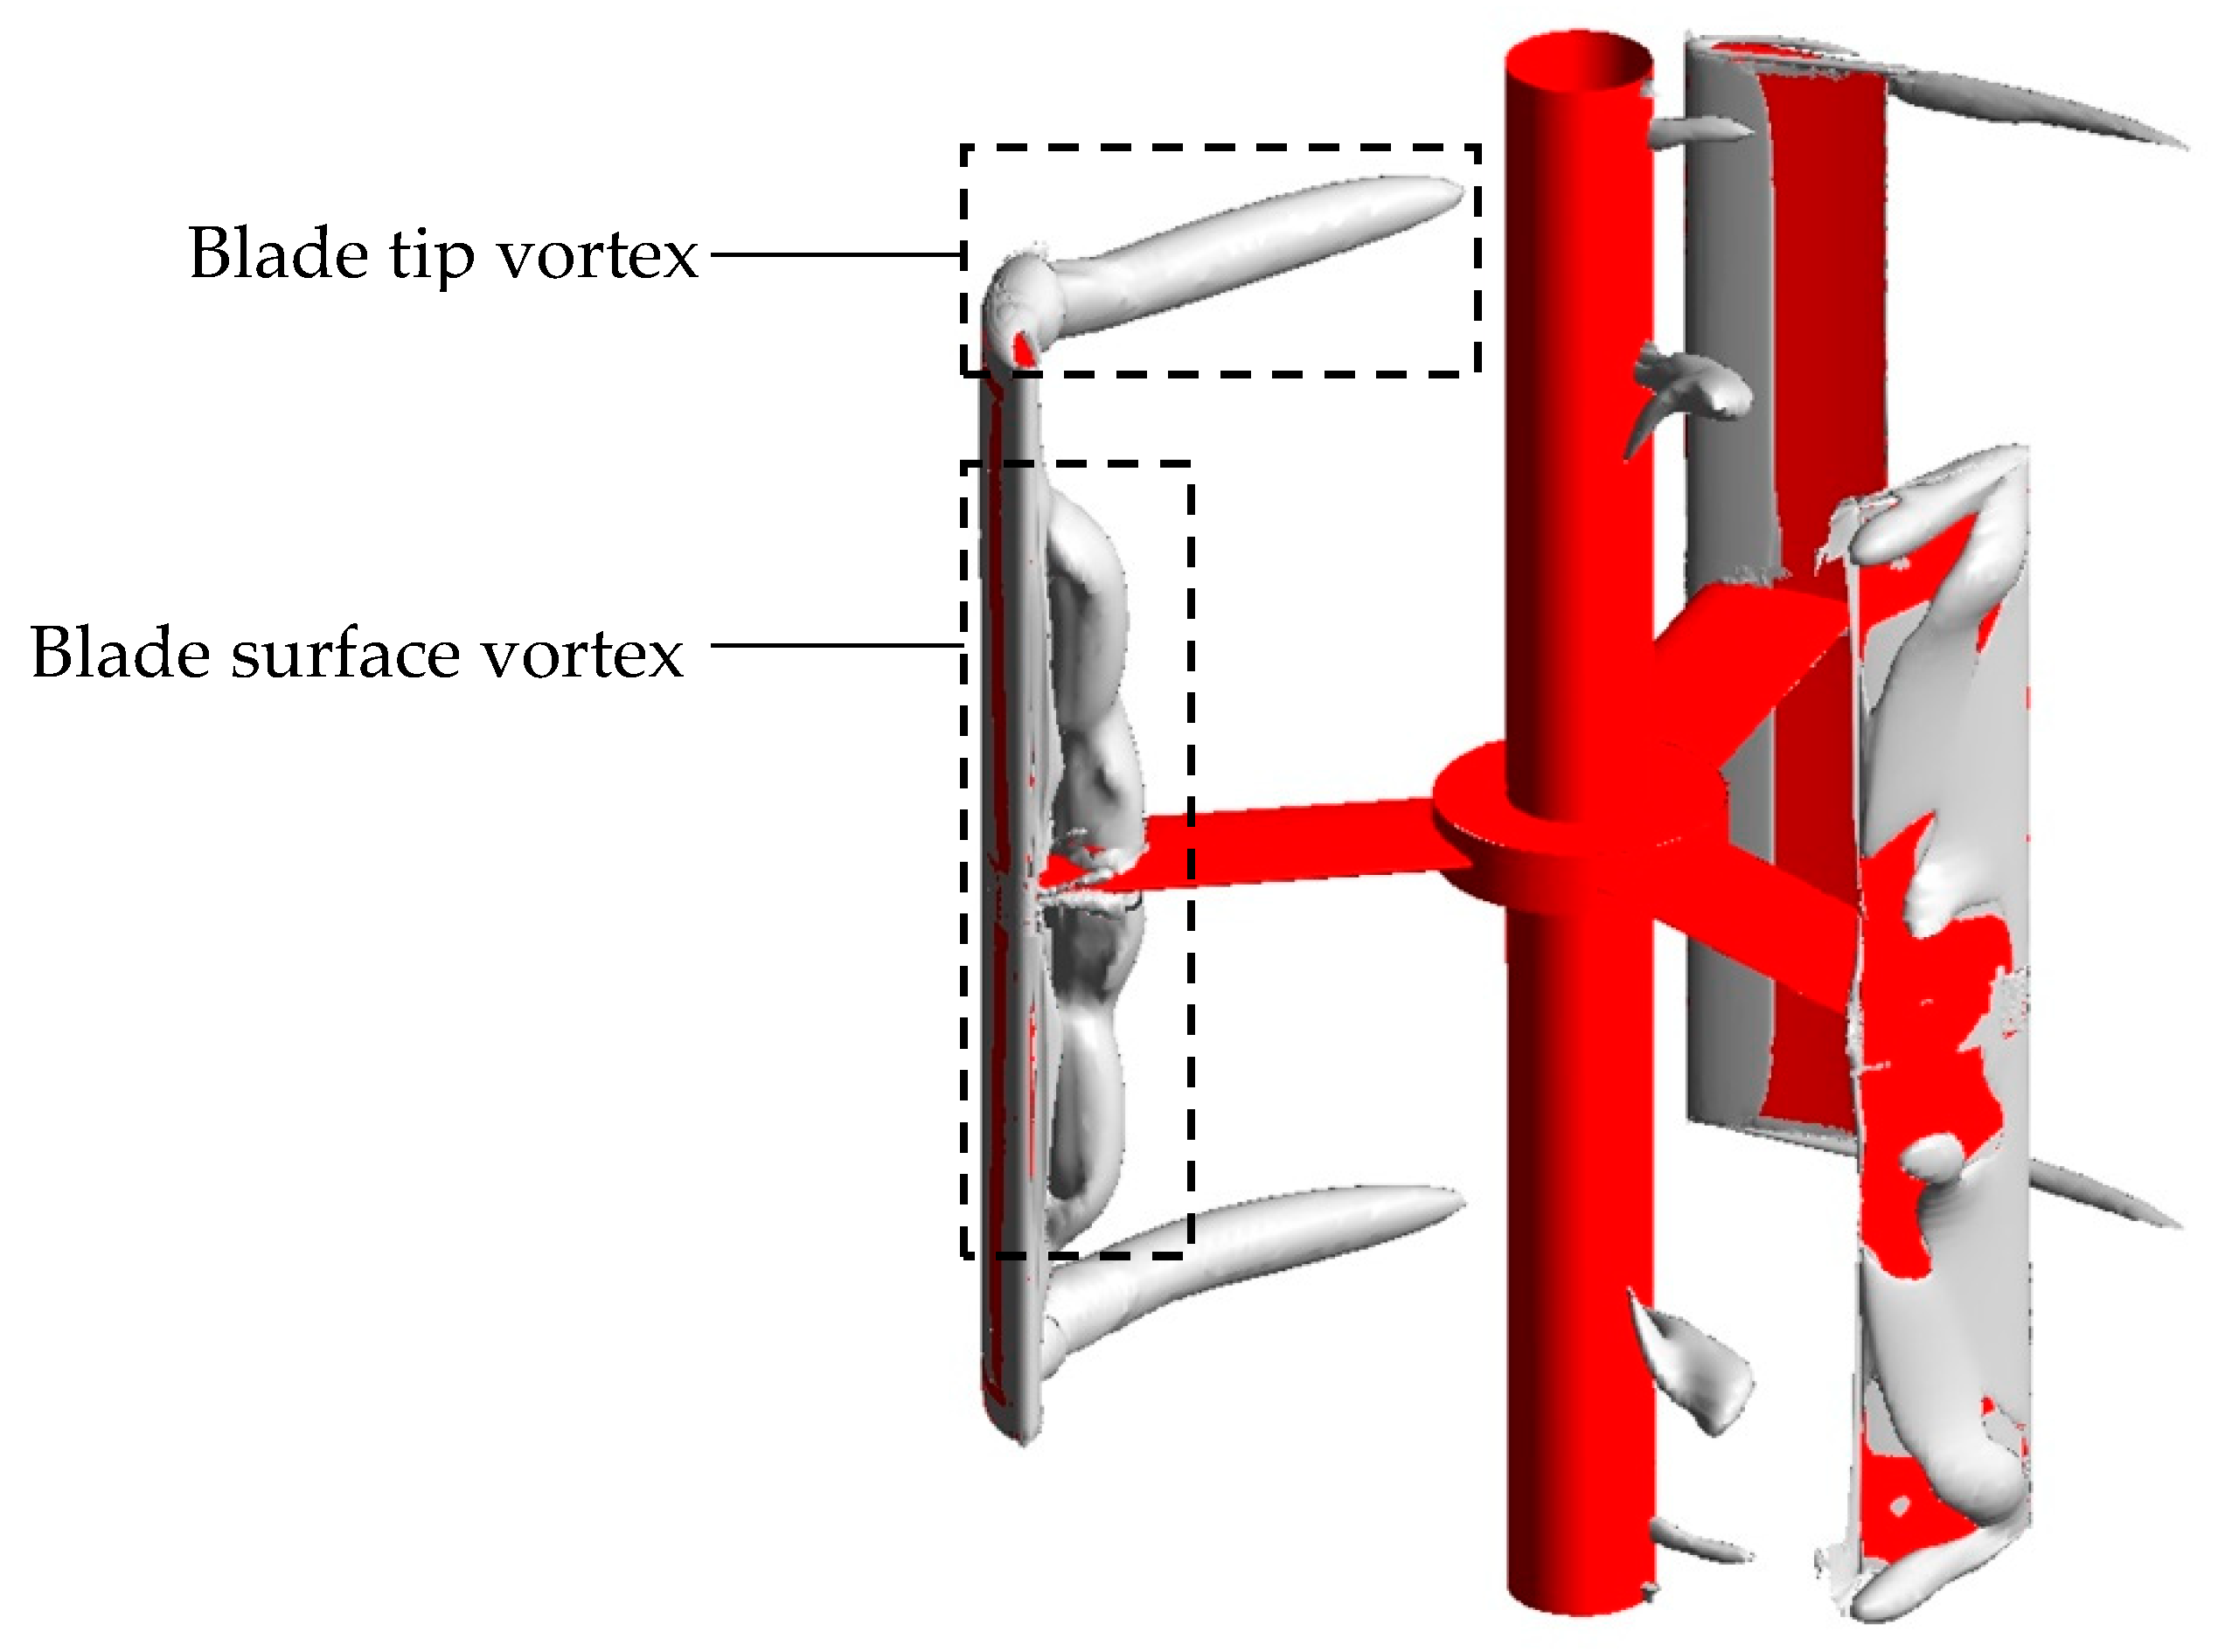
3.3.1. Blade Tip Vortex

Figure 8 shows the blade tip vortex under different λ at a phase angle of 0°. The vortex starts from the leading edge of the blade tip, and then develops along the blade hydrofoil to the trailing edge. As the tip speed ratio increases, the trailing edge length of the tip vortex gradually increases, which will influence the flow pattern of the downstream blade.
Figure 9 shows the development of the blade tip vortex in a runner revolution. The tip vortex develops, collapses, and shrinks in a runner revolution. It was found that the tip vorticity reached the maximum at 120°, and decreased with the further movement of the blade, and the tip vorticity began to break at 180°. Finally, when the blade moved to 210°, the tip vortex collapsed.
A plane at a 101% blade height was selected to analyze the distribution of the tip vorticity, as shown in Figure 10. As the turbine rotation speed increased, the vortex volume increased and its intensity also increased. When λ is greater than 1.5, the tip vortex at a phase angle of 90° will reach the downstream blade and influence the flow field in this region. When λ exceeds 2.0, the rolling vortex falls from the main vortex and moves to the axis, and further rotates as the axis when λ increases.

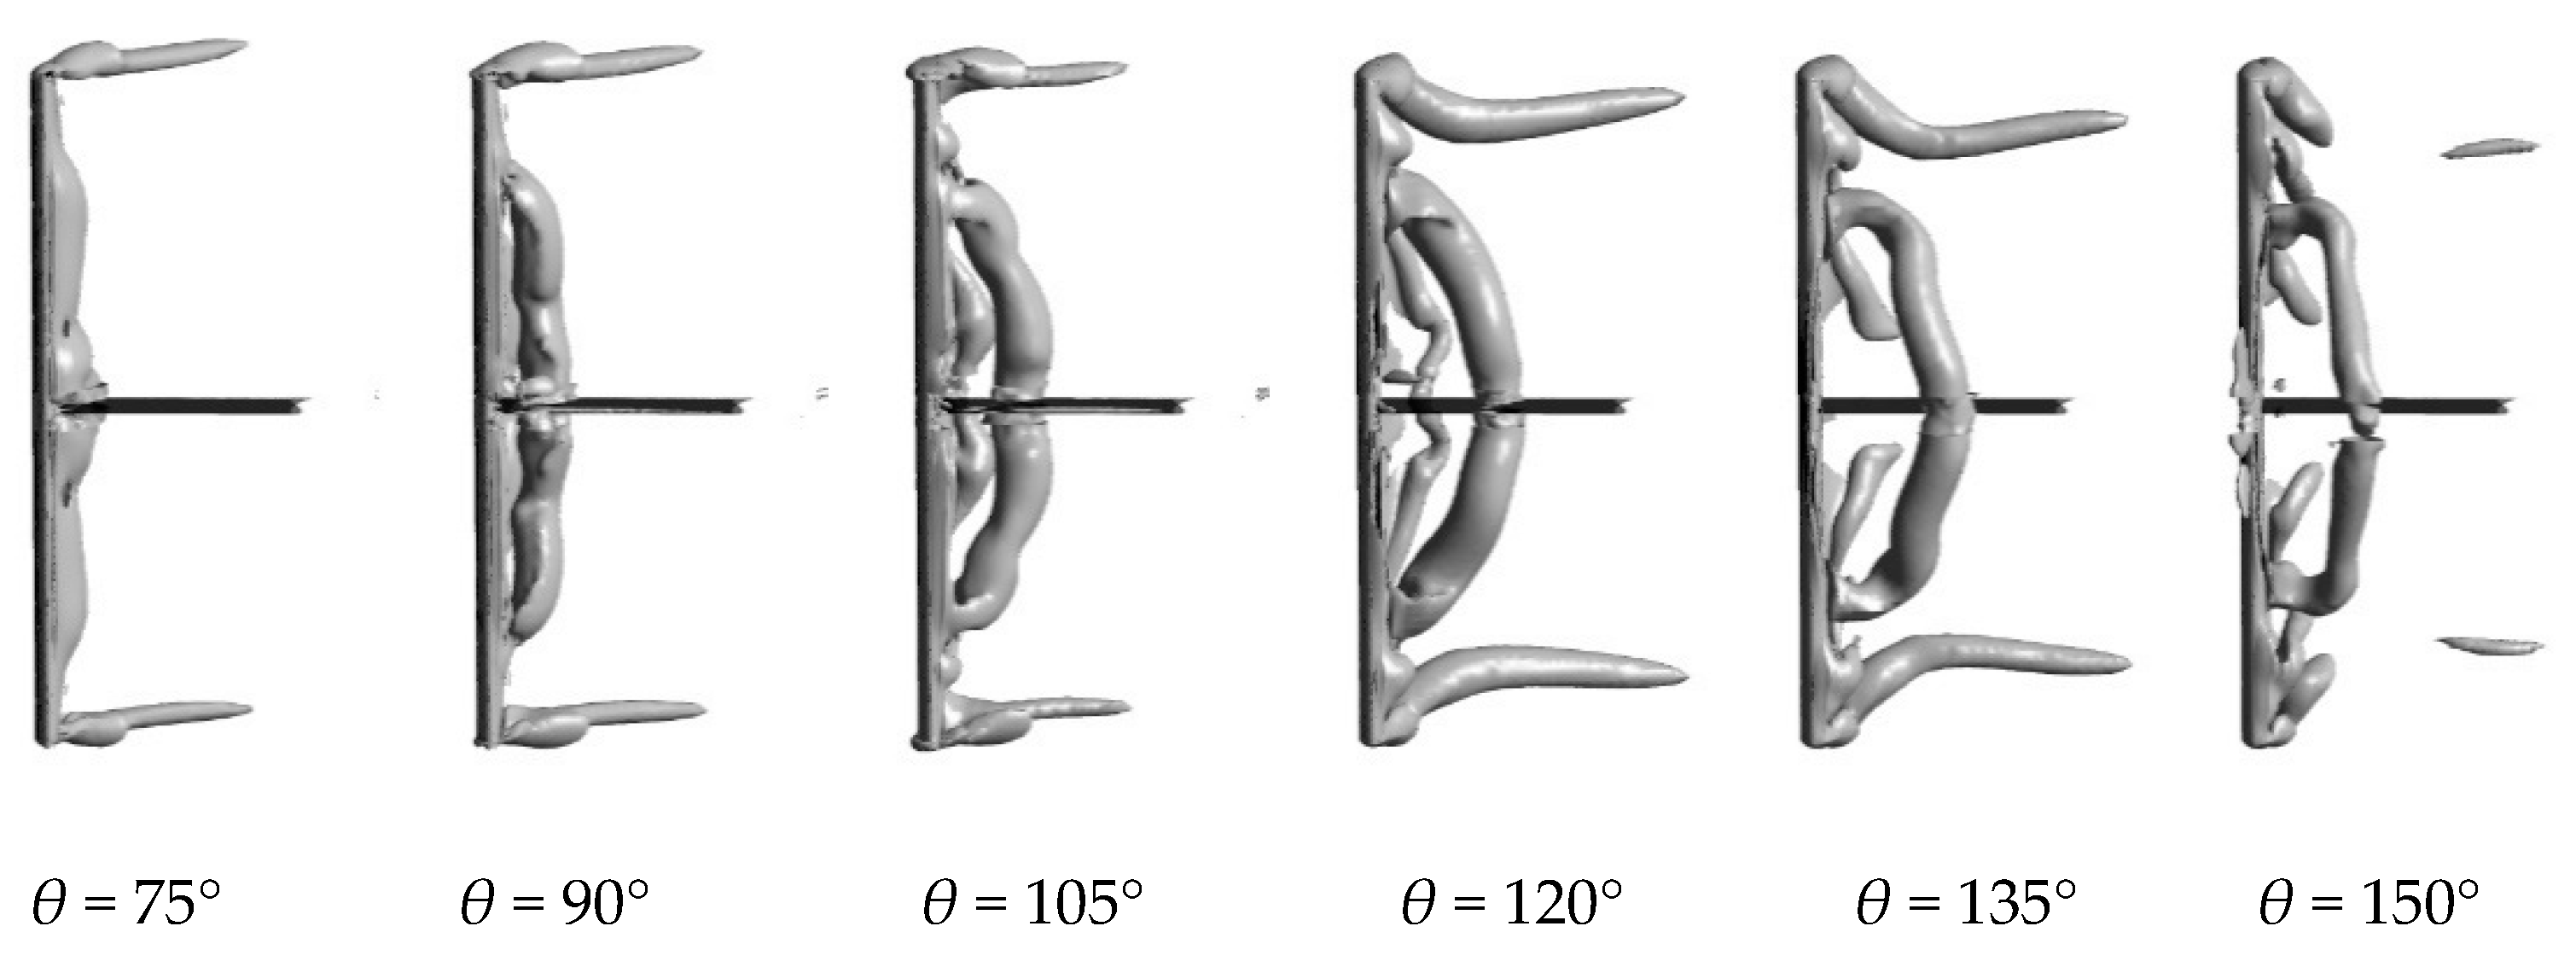
3.3.2. Blade Surface Vortex

Figure 11 shows the development of the blade surface vortex. The blade surface vortex starts to form when the blade moves to a specific phase angle, then the vortex will fall off and develop backward, forming a wake vortex that affects the stability of the entire flow field. Below the phase angle θ = 120°, the blade surface vortex is attached on the surface and the power generation is normal with the maximum efficiency at θ = 85°. As the phase angle increases, the blade surface vortex starts to fall off, the power decreases to a lower value and is even negative. Meanwhile, the deciduous vortex moves downstream and affects the whole flow field around the turbine.
Figure 12 shows the vorticity at the plane of 75% blade height. The vortex in the turbine is more complicated and affected by blade-to-blade interaction. As the blade tip speed ratio increases, the intensity of separated vortex around the blade weakens and the affecting area also shrinks because the blade impact angle decreases, and flow pattern can be improved.

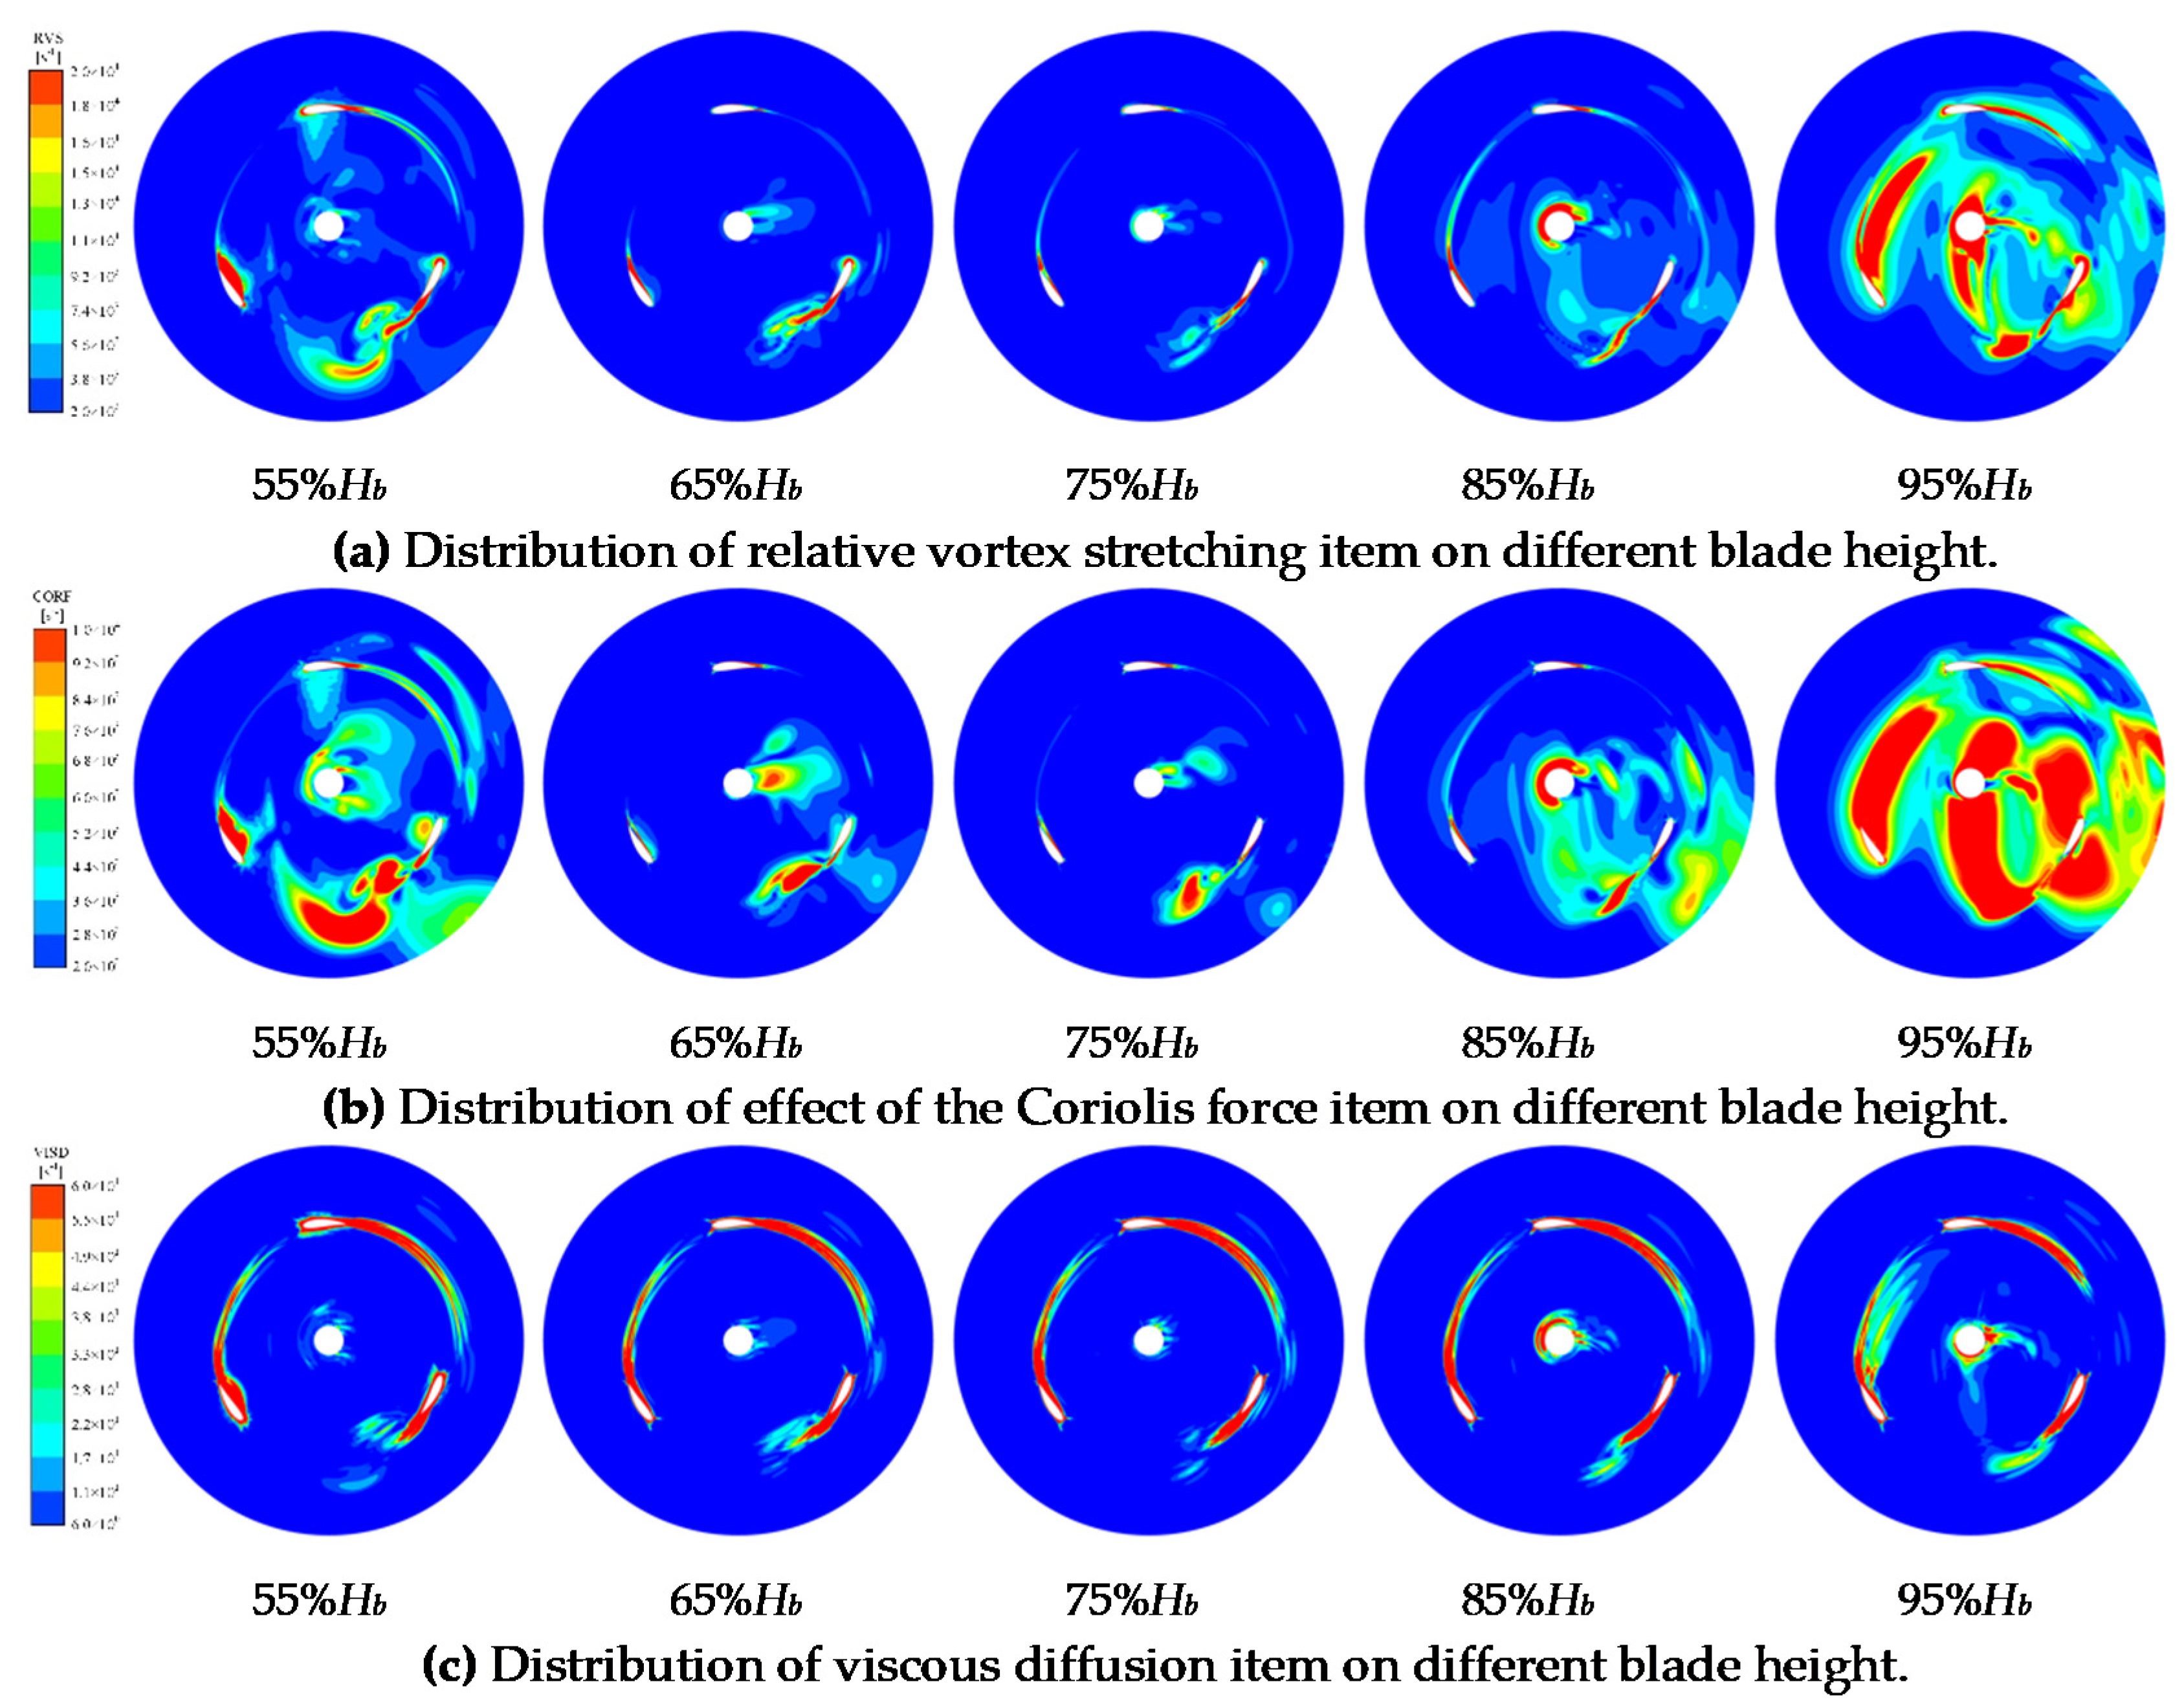
3.3.3. Vorticity Transport Equation

In order to further analyze the mechanism and evolution of vortex, the vorticity transport equation is introduced as follows [31,32,33]:
D Ω r D t = ( Ω r ) W Ω r ( W ) 2 × ( ω × W ) + ρ m × p ρ m 2 + ν 2 Ω r
where Ω r represents the relative vorticity; W is the relative velocity; and ν denotes the kinematic viscosity.
The first item ( Ω r ) W on the right is the relative vortex elongation term (RVS), which is related to the relative velocity gradient. It was shown that the velocity gradient of the flow field causes the expansion and contraction of the vortex line, which leads to the change in the magnitude and direction of the vorticity. Generally, stretching narrows the scroll and correspondingly increases the vorticity, while bending changes the direction of vorticity. The second term Ω r ( W ) represents the relative vortex expansion term (RVD), related to the relative velocity divergence. It shows that the change in the volume of fluid micelles causes the change of vorticity, which is due to the increase or decrease of rotational inertia. Considering that the angular momentum of micelles is conserved in inviscid fluid with a conservative force field, the increase or decrease of rotational inertia affects the change of vorticity. However, this term only changes the magnitude of vorticity, but does not change the direction. The third term 2 × ( ω × W ) represents the effect of Coriolis force (CORF), which is related to rotational motion. The fourth item ρ m × p ρ m 2 is the baroclinic torque. The fifth term ν 2 Ω r is the viscous diffusion term (VISD). As the current research is incompressible, the second and fourth items can be ignored.
In order to comprehensively obtain the flow pattern in the rear area of the blade, five planes: 55% Hb, 65% Hb, 75% Hb, 85% Hb, and 95% Hb were set at λ = 1.0. Figure 13a shows the dimensionless distribution of RVS, which had a strong correlation with the blade surface vortex, especially at 95% Hb. The value of RVS increased as the blade height increased because the stretching effect near the blade tip was obvious. The RVS is mainly concentrated at the blade suction side, which indicates that RVS is the main driving force for the formation and development of the blade surface vortex. Figure 13b shows the distribution of dimensionless CORF. In comparison to the vortex distribution in Figure 11, it is indicated that the CORF term mainly affects the direction of vortex motion. Coriolis force is inherent for the rotating machinery and can drive the blade surface vortex separate from the blade and develop downstream. Figure 13c shows the distribution of dimensionless VISD.
After the 120° phase angle shown in Figure 11, the distribution of the vorticity behind the blades was found to be gradually weakened as the height of the blades decreased.
Distributions of relative vortex stretching item, the effect of the Coriolis force item. and viscous diffusion item on different blade height at λ = 2.0 were also investigated. Figure 14a shows the dimensionless distribution of RVS, which is mainly consistent with the result of λ = 1.0, but the intensity of RVS was weaker than the result of λ = 1.0. Meanwhile, the blade tip vorticity at λ = 2.0 was stronger than that at λ = 1.0, as shown in Figure 8, which is related to the distribution of RVS at 95% blade height. Figure 14b shows the distribution of dimensionless CORF, and the CORF increases as λ increases. Figure 14c shows the distribution of dimensionless VISD, which decreases near the blade surface in comparison of that at λ = 1.0. This means that the vorticity distribution on the blade surface weakens and the vorticity distribution at the blade tip gradually increases.

3.4. Radial Force of Turbine

The radial force of the vertical axis turbine is important for its operation stability. Figure 15a shows the radial force of each blade under different phase angles at λ = 2.0. The maximum force for each blade is about 110 N. There is a 120° phase difference for the three blades due to their circumferential interval. The instantaneous power coefficient of the turbine also showed three ellipses, and the phase angles corresponded to that of the radial force. The instantaneous power coefficient force for the turbine was about 0.7.
Figure 16a shows the radial force of one blade at different tip speed ratios. The radial force on the blade is mainly divided into two regions: the upstream region of 0° ≤ θ ≤ 180° and the downstream region of 180° ≤ θ ≤ 360°. In the upstream area, the radial force on the blade changes more smoothly with the increase in the blade phase angle, while the force on the downstream area gradually becomes more complicated. For the radial force of a single blade at each tip speed ratio, it was found that it increased with the increase in the tip speed ratio. The maximum radial forces under different tip speed ratios were all around the phase angle of 80°, which were 74.909 N, 88.249 N, 97.989 N, 107.726 N, and 117.364 N, respectively.
Figure 16b shows the radial force of the turbine at different tip speed ratios. The total radial force was nearly circular with three humps due to three blades. Therefore, the circular radial force due to the symmetrical turbine structure can guarantee the operation stability of the turbine. Under different tip speed ratios, the maximum radial forces all appeared at the blade phase angle of 210°, which were 1145 N, 1209 N, 1280 N, 1311 N, and 1333 N, respectively. This shows that with the increase in the tip speed ratio, the radial force of the turbine gradually became unstable, and the maximum values of radial force gradually increased. The reason is that as the tip speed ratio increases, the vortex intensity and interaction increase.

4. Conclusions

In this paper, the energy performance, flow pattern, and radial force for a vertical axis Darrieus turbine were investigated. The main conclusions drawn are as follows:
(1)
The power generation of a Darrieus turbine in a revolution is uneven due to the variable blade attack angle, and the power coefficient increases with the increase in the tip speed ratio λ.
(2)
There are two main vortices around the turbine including the blade tip vortex and blade surface vortex. The blade tip vortex increases with the increase in the tip speed ratio, which is mainly driven by RVS and CORF. The blade surface vortex is mainly related to the blade phase angle, and the intensity and volume of the vortex weaken as the blade tip speed ratio increases.
(3)
The radial force of a Darrieus turbine is symmetrical, which gradually increases with the increase in tip speed ratio because the vortex intensity and interaction increase.

Author Contributions

Conceptualization, R.Z., Z.H., L.T., Y.W. and E.W.; Investigation, R.Z., Z.H., L.T., Y.W. and E.W.; Methodology, R.Z., Z.H., L.T., Y.W. and E.W.; Writing—original draft, R.Z., Z.H., L.T., Y.W. and E.W. All authors have read and agreed to the published version of the manuscript.

Funding

This work was supported by the National Natural Science Foundation of China [51809148], the Beijing Natural Science Foundation [3192015], the Tsinghua University Initiative Scientific Research Program [20193080086], and the Open Research Fund Program of State Key Laboratory of Hydroscience and Engineering [sklhse-2020-E-04].

Conflicts of Interest

The authors declare no conflict of interest.

References

  1. Han, Y.; Tan, L. Dynamic mode decomposition and reconstruction of tip leakage vortex in a mixed flow pump as turbine at pump mode. Renew. Energy 2020, 155, 725–732. [Google Scholar] [CrossRef]
  2. Liu, M.; Tan, L.; Cao, S. Method of dynamic mode decomposition and reconstruction with application to a three-stage multiphase pump. Energy 2020, 208, 118343. [Google Scholar] [CrossRef]
  3. Guillaud, N.; Balarac, G.; Goncalves, E.; Zanette, J. Large Eddy Simulations on Vertical Axis Hydrokinetic Turbines -Power coefficient analysis for various solidities. Renew. Energy 2020, 147, 473–486. [Google Scholar] [CrossRef] [Green Version]
  4. Kiho, S.; Shiono, M.; Suzuki, K. The power generation from tidal currents by darrieus turbine. Renew. Energy 1996, 9, 1242–1245. [Google Scholar] [CrossRef]
  5. Daisuke, M.; Kusuo, O.; Satoshi, W.; Furukawa, A. Simplified Structure of Ducted Darrieus-Type Hydro Turbine with Narrow Intake for Extra-Low Head Hydropower Utilization. J. Fluid Sci. Technol. 2008, 3, 387–397. [Google Scholar]
  6. Dai, Y.M.; Lan, W.H. Numerical study of straight-bladed Darrieus-type tidal turbine. Energy 2009, 162, 67–76. [Google Scholar] [CrossRef]
  7. Furukawa, A.; Watanabe, S.; Matsushita, D.; Okuma, K. Development of ducted Darrieus turbine for low head hydropower utilization. Curr. Appl. Phys. 2010, 10, S128–S132. [Google Scholar] [CrossRef]
  8. Furukawa, A.; Watanabe, S.; Okuma, K. Research on Darrieus-type hydraulic turbine for extra-low head hydropower utilization. IOP Conf. Ser. Earth Environ. Sci. 2012, 15, 2003. [Google Scholar] [CrossRef]
  9. Shimokawa, K.; Furukawa, A.; Okuma, K.; Matsushita, D.; Watanabe, S. Experimental study on simplification of Darrieus-type hydro turbine with inlet nozzle for extra-low head hydropower utilization. Renew. Energy 2012, 41, 376–382. [Google Scholar] [CrossRef]
  10. Benzerdjeb, A.; Abed, B.; Achache, H.; Hamidou, M.K.; Gorlov, A.M. Experimental study on blade pitch angle effect on the performance of a three-bladed vertical-axis Darrieus hydro turbine. Int. J. Energy Res. 2019, 43, 2123–2134. [Google Scholar] [CrossRef]
  11. Roa, A.M.; Aumelas, V.; MaîTre, T.; Pellone, C. Numerical and experimental analysis of a darrieus-type cross flow water turbine in bare and shrouded configurations. IOP Conf. Ser. Earth Environ. Sci. 2010, 12, 012113. [Google Scholar] [CrossRef]
  12. Zhen, L.; Hengliang, Q.; Hongda, S. Numerical Study on Self-Starting Performance of Darrieus Vertical Axis Turbine for Tidal Stream Energy Conversion. Energies 2016, 9, 789. [Google Scholar]
  13. Marsh, P.; Ranmuthugala, D.; Penesis, I.; Thomas, G. Numerical investigation of the influence of blade helicity on the performance characteristics of vertical axis tidal turbines. Renew. Energy 2015, 81, 926–935. [Google Scholar] [CrossRef] [Green Version]
  14. Marsh, P.; Ranmuthugala, D.; Penesis, I.; Thomas, G. Numerical simulation of the loading characteristics of straight and helical-bladed vertical axis tidal turbines. Renew. Energy 2016, 94, 418–428. [Google Scholar] [CrossRef] [Green Version]
  15. Marsh, P.; Ranmuthugala, D.; Penesis, I.; Thomas, G. Three-dimensional numerical simulations of straight-bladed vertical axis tidal turbines investigating power output, torque ripple and mounting forces. Renew. Energy 2015, 83, 67–77. [Google Scholar] [CrossRef] [Green Version]
  16. Khanjanpour, M.H.; Javadi, A.A. Experimental and CFD Analysis of Impact of Surface Roughness on Hydrodynamic Performance of a Darrieus Hydro (DH) Turbine. Energies 2020, 13, 928. [Google Scholar] [CrossRef] [Green Version]
  17. Maganga, F.; Germain, G.; King, J.; Pinon, G.; Rivoalen, E. Experimental characterisation of flow effects on marine current turbine behaviour and on its wake properties. IET Renew. Power Gener. 2010, 4, 498–509. [Google Scholar] [CrossRef] [Green Version]
  18. Mercier, G.; Maitre, T.; Pellone, C. Experimental caracterization of the wake of a cross flow water turbine with LDV measurement. In Proceedings of the 17th International Symposium on Apllications of Laser Techniques to Fluid Mechanics, Lisbon, Portugal, 7–10 July 2014. [Google Scholar]
  19. Li, Y.; Calisal, S.M. Three-dimensional effects and arm effects on modeling a vertical axis tidal current turbine. Renew. Energy 2010, 35, 2325–2334. [Google Scholar] [CrossRef]
  20. Gorle, J.M.; Chatellier, L.; Pons, F.; Ba, M. Flow and Performance analysis of H-Darrieus hydro turbine in a confined flow: A computational and experimental study. J. Fluids Struct. 2016, 66, 382–402. [Google Scholar] [CrossRef]
  21. Ouro, P.; Stoesser, T. An immersed boundary-based large-eddy simulation approach to predict the performance of vertical axis tidal turbines. Comput. Fluids 2017, 152, 74–87. [Google Scholar] [CrossRef] [Green Version]
  22. Ouro, P.; Runge, S.; Luo, Q.; Stoesser, T. Three-dimensionality of the wake recovery behind a vertical axis turbine. Renew. Energy 2019, 133, 1066–1077. [Google Scholar] [CrossRef] [Green Version]
  23. Pellone, C.; Maître, T.; Amet, E. 3D RANS modeling of a cross flow water turbine. In Proceedings of the Symhydro, New Trends in Simulation—Hydroinformatics and 3D Modeling, Singapore, 12–14 September 2012. [Google Scholar]
  24. Matre, T.; Amet, E.; Pellone, C. Modeling of the flow in a Darrieus water tutbine: Wall grid refinement and comparison with experiments. Renew. Energy 2013, 51, 497–512. [Google Scholar] [CrossRef]
  25. Marsh, P.; Ranmuthugala, D.; Penesis, I.; Thomas, G. The influence of turbulence model and two and three-dimensional domain selection on the simulated performance characteristics of vertical axis tidal turbines. Renew. Energy 2017, 105, 106–116. [Google Scholar] [CrossRef]
  26. Mejia, O.D.L.; Quiñones, J.J.; Laín, S. RANS and hybrid RANS-LES simulations of an H-type darrieus vertical axis water turbine. Energies 2018, 11, 2348. [Google Scholar] [CrossRef] [Green Version]
  27. Laín, S.; Cortes, P.; Lopez, O.D. Numerical Simulation of the Flow around a Straight Blade Darrieus Water Turbine. Energies 2020, 13, 27. [Google Scholar] [CrossRef] [Green Version]
  28. Hao, Y.; Tan, L. Symmetrical and unsymmetrical tip clearances on cavitation performance and radial force of a mixed flow pump as turbine at pump mode. Renew. Energy 2018, 127, 368–376. [Google Scholar] [CrossRef]
  29. Paraschivoiu, I. Wind Turbine Design with Emphasis on Darrieus Concept; Polytechnic International Press: Montreal, QC, Canada, 2002. [Google Scholar]
  30. Scheurich, F.; Fletcher, T.M.; Brown, R. Simulating the aerodynamic performance and wake dynamics of a vertical-axis wind turbine. Wind Energy 2010, 14, 159–177. [Google Scholar] [CrossRef] [Green Version]
  31. Huang, R.; Ji, B.; Luo, X.; Zhai, Z.; Zhou, J. Numerical investigation of cavitation-vortex interaction in a mixed-flow waterjet pump. J. Mech. Sci. Technol. 2015, 29, 3707–3716. [Google Scholar] [CrossRef]
  32. Sun, W.; Tan, L. Cavitation-Vortex-Pressure Fluctuation Interaction in a Centrifugal Pump Using Bubble Rotation Modified Cavitation Model Under Partial Load. J. Fluids Eng. 2020, 142, 051206. [Google Scholar] [CrossRef]
  33. Liu, Y.; Tan, L. Tip clearance on pressure fluctuation intensity and vortex characteristic of a mixed flow pump as turbine at pump mode. Renew. Energy 2018, 129, 606–615. [Google Scholar] [CrossRef]
Figure 1. Computation domain.
Energies 13 05412 g001
Figure 2. Mesh density independence test.
Energies 13 05412 g002
Figure 3. Time step independence test.
Energies 13 05412 g003
Figure 4. Comparison of the average power coefficient: experiments [24] and numerical simulation.
Energies 13 05412 g004
Figure 5. Phase angle and motion analysis of each blade.
Energies 13 05412 g005
Figure 6. Power coefficient in different λ. (a) Power coefficient in λ = 1.0. (b) Power coefficient in λ = 1.5. (c) Power coefficient in λ = 2.0. (d) Power coefficient in λ = 2.5. (e) Power coefficient in λ = 3.0. (f) Power coefficient of each blade.
Energies 13 05412 g006
Figure 7. Vortex structures of the turbine (λ = 1.5).
Energies 13 05412 g007
Figure 8. Blade tip vortex under different λ at phase angle of 0°. (a) λ = 1.0; (b) λ = 1.5; (c) λ = 2.0; (d) λ = 2.5; and (e) λ = 3.0.
Energies 13 05412 g008
Figure 9. Time evolution of blade tip vortex (λ = 1.5). (a) 120°; (b) 150°; (c) 180°; and (d) 210°.
Energies 13 05412 g009
Figure 10. Tip vortex distribution at 101% blade height plane in different λ. (a) λ = 1.0; (b) λ = 1.5; (c) λ = 2.0; (d) λ = 2.5; (e) λ = 3.0.
Energies 13 05412 g010
Figure 11. Distribution of vorticity in the Y-axis direction of turbine (λ = 1.0).
Energies 13 05412 g011
Figure 12. Plane distribution of 75% Hb vorticity of the turbine.
Energies 13 05412 g012
Figure 13. Distribution of the relative vortex stretching item, effect of the Coriolis force item, and viscous diffusion item on different blade height at λ = 1.0. (a) Relative vortex stretching item; (b) Coriolis force item; (c) Viscous diffusion item.
Energies 13 05412 g013
Figure 14. Distribution of the relative vortex stretching item, effect of the Coriolis force item, and viscous diffusion item on different blade height at λ = 2.0. (a) Relative vortex stretching item; (b) Coriolis force item; (c) Viscous diffusion item.
Energies 13 05412 g014
Figure 15. Radial forces and power coefficient. (a) Radial forces of each blade and (b) turbine instantaneous power coefficient at λ = 2.0.
Energies 13 05412 g015
Figure 16. Radial force of turbine and blade in different λ. (a) Radial force of turbine blade. (b) Radial force of turbine.
Energies 13 05412 g016
Publisher’s Note: MDPI stays neutral with regard to jurisdictional claims in published maps and institutional affiliations.

