Abstract
More than 65% of electricity consumed worldwide by the industrial sector is used in electric-motor-driven systems. For this reason, the efficiency of electric motors is an important factor in improving the energy efficiency of the industry. Additionally, this contributes to reducing energy consumption, production costs, as well as CO2eq emissions. The replacement of motors with efficiency class IE1 by motors of efficiency class IE3 is one possible alternative to increase the efficiency of electric motor systems. When a program to replace motors with others of greater efficiency is initiated, it is necessary to casuistically evaluate all identified opportunities. Economic viability can be evaluated using a variety of methods. Often, the methods recommended by manufacturers or consulting entities focus on simple payback time without accounting for all influencing factors. This paper contributes to the academic discussion by proposing a methodology based on the calculation of energy-saving potential, by performing a preliminary an a priori evaluation and determining the economic opportunities. It avoids evaluating all motors in the studied facility and shows its effectiveness by using the cost of energy saved to distinguish which motors to evaluate. Finally, it provides a complete economic evaluation of the final decision on the basis of discounted cash flow methods. A short-production-cycle sugarcane industry was used in the case study.
1. Introduction
Electric motor systems are the main end-users of electricity, accounting for 53% of the global demand for electricity [1], of which over 65% is used in industrial electric-motor-driven systems [2,3,4]. The technological universe of rotating electrical machines is composed of a wide range of motors, the preferred type being the three-phase induction motor with a squirrel-cage rotor due to its low cost, robustness, ease of maintenance, high reliability and relatively high efficiency. Because of the widespread use of these motors, their energy consumption represents a significant fraction of the electrical energy consumed by the industrial sector globally. Some researchers estimate that approximately 70% of the total electrical energy consumed by industries is used in electric-motor-driven systems, although this percentage varies between countries depending on the level of industrialization [4,5]. Three-phase induction motors of medium size (0.75–375 kW) and general purpose and the systems driven by these motors represent 68% of the energy used by all electric motors [6]. The Energy-Efficient End-use Equipment (4E) initiative developed assessments on the impact of transitioning to energy-efficient motor systems for 150 developing and emerging countries, demonstrating that energy savings from motors in these countries could reach 300 TWh per annum of electricity in 2030, with a reduction of 200 Mt in CO2eq emissions per year [3,6]. As can be understood, electric motors are responsible for a large part of the global energy consumption and, for this reason, it is imperative to consider and monitor their efficiency.
Electric motors are currently classified in terms of efficiency. This classification has been the result of various policies and regulations proposed in developed countries since the last decade of the 20th century. A summary of the evolution of the efficiency classification of electric motors can be seen in Figure 1 below, which illustrates that, finally, in 2008, a classification system of electric motor efficiency was published by the International Electrotechnical Commission (IEC) as the IEC 60034-30 standard. This standard unified the definitions of the European Committee of Manufacturers of Electrical Machines and Power Electronics (CEMEP) and the National Electrical Manufacturers Association (NEMA), establishing the following efficiency classes: IE1 (Standard Efficiency), IE2 (High Efficiency) and IE3 (Premium Efficiency); IE4 (Super Premium Efficiency) was added in 2009. It also proposed nominal limits for the latest efficiency class, IE5 (Ultra Premium Efficiency), which was added in 2014. The motor of efficiency class IE5 is reserved for a very high-efficiency design and is compatible with other commercial technologies such as synchronous reluctance motors (SynRM) and permanent magnet synchronous motors [3,7,8].
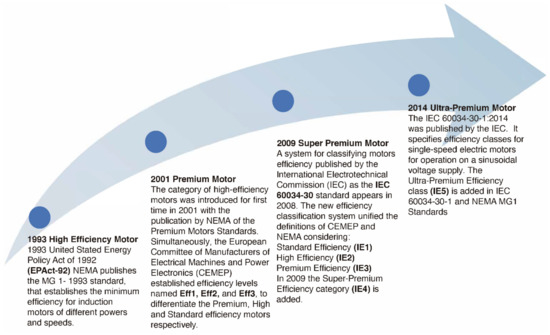
Figure 1.
Milestones in the evolution of electric motor efficiency classes since the 1990s.
On the other hand, the acknowledgment of the great potential for a reduction in electricity consumption and corresponding emissions results from the improving efficiency of electric motors systems, has led to the introduction of regulations imposing minimum energy efficiency levels for new electric motors in all major economies [4]. For these strategies, there is pressure in the market imposed by legislation that establishes deadlines for the commercialization of standard-efficiency motors that guarantee a gradual advancement in the efficient use of energy. Because of this, energy efficiency standards and labeling have been implemented in many countries and are being developed in other countries [3,7,9,10,11]. These minimum efficiency requirements and Minimum Energy Performance Standards (MEPS) are powerful tools to transform the market, causing a decline in sales of IE1 class motors while sales of IE2 and IE3 motors are steadily increasing, as shown in Figure 2 [12].
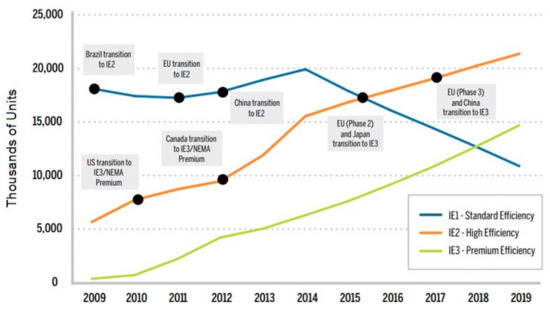
Figure 2.
Impact of energy efficiency policies on the sales of more efficient electric motors. Reproduced from [12], 4E Energy-Efficient End-use Equipment: November 2015.
However, in developing countries the situation is different. For example, in Latin America there is a delay in the establishment of MEPS for electric motors, only four countries have established MEPS for electric motors, these are Mexico, Brazil, Chile and Colombia. Most developing countries are characterized by a low level of industrialization and high technological obsolescence in many industries. As they do not have MEPS for electric motors, they keep a large number of old motors in operation. Some barriers to increasing efficiency in electric motor systems in these countries are: delays in the establishment of MEPS, lack of ability to effectively explain the economic advantages of using energy-efficient motors, purchase decisions usually based on the lowest capital cost and decisions based on short investment payback periods [11,13].
In any case, these legal instruments—which are used by governments to promote the replacement of inefficient motors on the market—take some time to have an impact and barriers limiting the penetration of high-efficiency motors in the industry still exist [11,13]. Therefore, although the current market scenario is rapidly changing towards the commercialization of class IE3 and IE4 motors, the actual situation is that there is still a large stock of low-efficiency motors in operation in the industry [14]. In contrast, the advantages of using efficient motors to save energy and money, as well as to reduce the environmental impact associated with high electricity consumption, are well documented in the specialized scientific literature [5,15,16,17,18,19,20,21,22].
In general, a program to improve the efficiency of electric motors involves identifying opportunities for installation, calculating the potential for energy savings and evaluating it economically to see if the replacement proposal is feasible or not [23,24,25,26,27,28]. Therefore, specialists in charge of these studies must not only know how to technically evaluate their proposals, but they must also have the tools to carry out the corresponding economic feasibility analysis.
The economic evaluation of such savings will be strongly influenced by the price of energy and its time variation, either by tariff structures or by inflation in the price of fuel used to generate the energy. On the other hand, the profitability of the measure depends on factors such as annual motor operating time, its residual value, the initial cost of acquiring an efficient motor and other economic indicators.
However, when analyzing the case studies reported in the literature, it can be seen that the economic feasibility in all cases is calculated using a variety of methods. Often, the methods recommended by the manufacturers or consulting entities themselves focus on simple payback time and do not consider all the influential factors; much of the research is based on simple payback time [26]. Other researchers focus on global assessments using integrated models in the industrial sector of a country to determine potential and propose policies [27]. These models are not suitable for local application in a small- or medium-sized company. On the other hand, it is important to note that when a motor replacement program is initiated, it is necessary to casuistically evaluate all the opportunities identified. Hence, the aim of this paper is to propose an adequate methodology to reduce the resources required and time consumption in the feasibility assessment of electric motors replacement programs.
The exact evaluation of all motors at the facility is complex because these approaches depend on different circumstances and data collection techniques and measurements might require a significant amount of effort and time. Similarly, the economic methods used that are not based on discounted cash flow are severely limited in terms of obtaining accurate results. Thus, techniques that employ discounted cash flow are more effective and improve accuracy. Considering discounted cash flow methods—a methodology that uses a combination of identifying technical opportunities with different relevant economic techniques—is more effective and simpler and results in improved accuracy, which will be verified in this paper.
In this paper, a robust strategy, based on the preliminary assessment a priori to determine the economic opportunities, is proposed. The proposed methodology avoids evaluating all motors in the studied facility and shows its effectiveness by using the cost of energy saved to distinguish which motors to evaluate.
The key contributions of this paper are summarized as follows. Firstly, to propose a robust methodology, using discounted cash flow methods, to identify the technical and economic potential associated with the motor’s replacement. Secondly, to reduce resource and time consumption, using the cost of saved energy (CSE) calculations as preliminary economic indicators to identify economic opportunities. Finally, to provide practical expressions for the facility based on multiple linear regression analysis that allows economic indicators to be quickly estimated.
2. Materials and Methods
Two conditions are considered for the evaluation of the potential savings derived from the replacement of standard motors: technical potential and economic potential [28]. Technical potential represents energy savings (ΔE) that can be achieved by replacing motors for all available opportunities, regardless of the economic effectiveness of the measure. This is calculated, in kWh, as:
where Pn1 and Pn2 are rated power of the original and the proposed motors in kW, LF1 and LF2 are the load factors of the original and the proposed motors in %, η1 and η2 are the efficiency of the original and the proposed motors at the specified load factors in %, and t is the operating hours per year in h.
Once the technical potential is calculated for each identified opportunity, the economic potential is then determined. The replacement proposal cost is considered to be an investment that will be recovered from the savings obtained during the lifetime of the motor. The economic potential is the potential for economic savings provided by the energy savings that can be achieved by employing efficient technologies. The economic potential is calculated only from proposals that are economically feasible. One of the most influential factors in the economic effectiveness of a proposal is the operating hours per year. The capital recovery factor expresses the annual value of profit that must exist in order to recover a present value, with interest rate r in n years.
where A is the annuity in $, P is the present value in $, r is the interest rate in p.u. and n is the lifetime in years.
For the case of motor replacement, the capital cost in year zero ($/kWh saved) is carried to an equivalent annuity A. This determines how the capital invested is recovered. This annuity is called the cost of saved energy (CSE) [28]. If the price of energy is higher than the CSE, then the capital invested is, in fact, recovered and the proposal constitutes a feasible economic opportunity.
Then, to determine the economic feasibility of each case, the CSE is calculated as:
where the CSE is in $/kWh, Io is the cost of investment in $ and ΔE is the saved energy per year in kWh.
Although the value of the CSE, determined by Equation (3), implies that profit will be generated for the energy saved, it is not conclusive regarding the feasibility of the investment. It is necessary to calculate other indicators such as net present value (NPV) and payback time. With saved energy, calculated according to Equation (1), the cash flow after taxes is determined for each year i, such as:
where I is income tax in %, Dep is depreciation (which is considered linear and calculated as ), Ce is the energy price in $/kWh and ΔEi is the energy saved in year ith calculated according to Equation (1).
To update cash flows for the year in which the investment is made, the discount factor is applied. Discounted cash flows for each year i are calculated as:
were DFi is the discount factor and calculated as .
In financial algebra, the discount rate D is the rate used to adjust a future amount to the present value and is equal to the interest rate r employed to determine how much the present amount of money is worth in the future if inflation is not taken into consideration. The inflation coefficient Inf (p.u.) is used to reflect the current economic situation. Inflation is another indicator of currency depreciation and is evidenced by rising market prices.
To calculate the discount rate adjusted for inflation, a compound interest rate given by , is calculated. This paper has not considered an inflation rate (Inf = 0); therefore, the discount rate is equal to the interest rate and D = r is used to calculate DFi, which is the factor applied to adjust future cash flows to the present value.
The NPV is equal to the sum of all discounted cash flows during the lifetime, which is algebraically expressed as:
When the discounted cash flow becomes positive, the investment has recovered and is generating profit. The amount of time to achieve investment recovery is considered to be the payback time of the investment (PTI). Figure 3 below shows a flow diagram of the proposed methodology for making the decision to invest in more efficient electric motor technology.
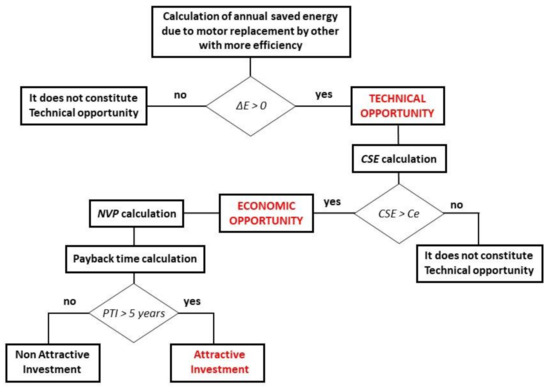
Figure 3.
Methodology to evaluate the feasibility of replacing IE1/0 motors with more efficient motors.
This methodology starts by calculating the annual saved energy by the motor replacement that constitutes a technical opportunity. Then, it is necessary to calculate the CSE, for each case, from Equation (3), in order to identify economic opportunities. The CSE is compared with the price of energy. If the CSE is smaller than the energy price, then the proposed replacement constitutes a valid economic opportunity.
The NPV is not calculated for all proposals. It is calculated only for cases that constitute valid economic opportunities. Additionally, the PTI is determined for these cases. To make a replacement decision, we will make a comparison of the PTI and consider feasible only those opportunities for which the PTI is less than 5 years. It is clear that the investment will be more attractive when the PTI is lower. The common payback periods reported in the literature range between 3 and 3.5 years (Figure 4); however, the end decision is made by the user and may also have a previously defined maximum payback time in the plant, which is usually between 2 and 5 years [29]. Although in most cases a 3-year term is considered to be an “attractive” threshold, this work proposes an upper limit of 5 years, since the payback period is calculated taking into consideration the discount rate, as opposed to the simple payback time method recommended in [29] and most commonly used in practice [17,18,19,20]. The simple payback time may be up to 40% shorter than the payback period when the discount rate is taken into consideration.
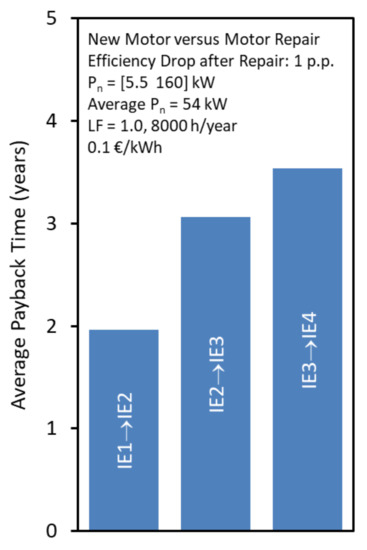
Figure 4.
Average payback time for buying a higher efficiency motor vs. motor repair. Reproduced from [14], Institute of Electrical and Electronics Engineers (IEEE): 2018.
The Relationship between CSE, PTI and NPV
When cash flows are a fixed amount (annuity), the NPV can be calculated as:
where R is the constant cash flow in $.
Considering monetary savings by energy as constant cash flow, then:
So,
If the investment is profitable when NPV > 0, then:
Clearing Ce, we have:
The left member of Inequality (11) is the CSE according to Equation (3).
To see the relationship between the PTI and the CSE, it is assumed that the PTI is the time in which the discounted cash flows are equal to the initial investment, that is:
As the sum of n, consecutive terms not beginning with zero are calculated as:
The second member is multiplied and divided by (1 + r), yielding:
The above expression yields:
By clearing from Equation (3) and substituting it into (13), we obtain:
From Equation (14), we have:
Applying the logarithm to both sides of Equation (15):
Since , Equation (16) is then written as:
At this point, the PTI can be written as a function of the CSE, yielding:
Considering then:
That is, the PTI is nearly proportional to the CSE.
To investigate the relationship between the NPV and the CSE, we start with the equation for calculating NPV, given by:
If both sides are multiplied by , we get:
Clearing from Equation (20) and substituting it in (21) yields:
From (22), we solve for NPV:
Considering the common variable ΔE, we rewrite (23) as:
where .
As can be seen, the NPV is negatively correlated with the CSE, but it also depends on the energy savings (ΔE) achieved by the replacement of the motor as well as the accumulated cash flow during its lifetime, which includes the cash flow after recovery of the initial investment.
3. Results
3.1. Data and Considerations
In order to show how to determine the economic opportunities when deciding to carry out a motor replacement program, the electric motors of the manufacturing and steam boilers areas of a Cuban sugar mill were considered [30]. All these motors operate with a load factor of less than 75%. In all cases, the proposal to replace the currently installed motors of efficiency class IE1 with motors power-adjusted to the load and efficiency of class IE3 is analyzed. The potential energy savings, which constitutes the technical opportunity, is calculated according to Equation (1) and the determination of economic opportunities is based on the calculation of the CSE given by Equation (3). The load estimate and operational efficiency are calculated using the methods reported in the literature. These methods consider even problems of energy quality present in the supply system [31,32,33,34,35].
For the analysis, it is considered that the implementation cost is given by the price difference between the proposed motor and the existing one plus the installation cost. The interest rate used is 8% (0.08 p.u.) and the income tax is 35%. The lifetime considered is 15 years.
This lifetime is assumed considering criteria about the lifespan of motors. For example, in [18], 15 years is used. Verucchi et al. state that the useful life of a motor is approximately between 20 and 25 years with full and uninterrupted operation [17]. The European Union (EU) project states that the consensus of the manufacturers is that motors in the range of 0–0.75 kW last an average of 12 years, motors in the 11–75 kW range last an average of 15 years and motors above the 75 kW range are estimated to run for 20 years [28]. Other authors also report an average lifespan of around 20 years for the range of power analyzed in this case study [19].
Considering the current tariff, the average price per kWh sold to the electric company is 0.153 $/kWh. When the CSE is lower than the average sales price of electricity generated in the sugar industry to the national electrical power system, it is considered that the proposal is economically feasible. Table 1 and Table 2 show the results of the calculations for each case.

Table 1.
Potential of technical and economic savings in the manufacturing area.
Table 2.
Potential of technical and economic savings in the steam boilers area.
3.2. Result Analysis
In these above tables, the first row contains the name of the area and the names of the equipment related to the motor’s function in the facility. In the first 10 rows, the information related to actual motors is shown. For example, the clear juice pump motor Motor #1 has a rated power of 45 kW. The efficiency at full load is 88%. The average demand of this motor is 18.66 kW, according to measurement realized in situ. It is represented that this motor runs with a load factor approximately equal to:
All the electric motors evaluated in this paper run to drive pumps and fans with continuous duty and constant load. For this reason, the average demand can be used to the estimated load factor and motor efficiency at this load factor. To cover other motors and applications with variable loads, it is necessary to consider the possible load variation over the motor operating cycle. In this case, an average motor efficiency has to be used, which has to be calculated as a time-weighted average of the estimated values for the different load ratios, and the new motor is selected by equivalent power using the graphic load.
At this load factor, the efficiency is reduced to 79.9%, as shown in row seven. The other important piece of information is operating hours per year, which is t = 1475 h/y.
Due to this motor running underloaded (LF1 = 36.5%), it is proposed that another motor with greater efficiency that is power-adjusted to the load should replace it. The information related to this proposal is aggregated in the 12th to 19th rows. In this case, the proposal is to replace this motor with another of 22 kW and with 93.6% efficiency at full load.
The new motor runs with other load conditions. Considering the power of the pump is similar, because the pump is not changed, the new load factor that runs the new motor is calculated as:
At this load factor, the new motor runs with 92.5% efficiency as shown in the 15th row of Table 1. Hence, the potential of energy saved is calculated by Equation (1):
The last row of Table 1 shows the CSE calculated by Equation (3) and considering the differential price of motors as an investment (Io). For the case of the clear juice pump Pump #1, this difference is $4597.60 minus $1821.72, which equals $2775.88.
Applying Equation (3), the CSE is 0.08 $/kWh; that is, it is necessary to invest $0.08 for each kWh saved. As the CSE is smaller than the price of energy, this case constitutes an economic opportunity.
In summary, the results of the manufacturing area (see Table 1) show that the clarified juice pump motors are candidates to be replaced by 22 kW class IE3 motors with significant savings, making them economically feasible. In this case, 6.95 MWh/y can be saved. These loads are centrifugal pumps of low inertia with a free start, and therefore, it is not necessary to perform additional checks on starting requirements or maximum loads.
Replacement of the vacuum pumps is also a promising opportunity to adjust the power and raise the efficiency class to IE3. This proposal would allow a saving of 63.5 MWh/y. In the case of injection pump Pump #2, it is proposed to replace the existing motor with a 63 kW class IE3 motor, with a potential saving of 5.6 MWh/y. The CSE for injection pump Pump #1 is very close to Ce. For this reason, replacing this motor immediately is not considered.
In the case of the steam boilers area (see Table 2), the impact of replacing the eight motors with motors power-adjusted to the real demand and premium efficiency (Class IE3) leads to a potential energy saving equal to 58.5 MWh/y. However, the only motors with potential for economic savings are the forced draft fans. These motors are 110 kW, 75 kW and 86 kW, respectively, and work at 25.5%, 48.9% and 32.1% loads, which are very underloaded. The other motors, although they represent an opportunity to increase technical potential, do not represent any economic savings. This is due to the less stimulating price established for the electricity purchase tariffs to the cogeneration companies. These cases can be evaluated using the strategies suggested in [14] addressing connection mode change and optimized rewinding (or motor downsizing) as alternative low-cost options to the replacement of the original standard motor with a new high-efficiency motor.
In all cases in which the proposal constitutes an opportunity for financial savings, the calculation of the CSE does not give an idea of the recovery time or the return on the investment; therefore, it is necessary to perform a complete economic analysis to verify the feasibility of the investment. Table 3 shows the results of the calculations performed for economic analysis. The CSE is included for comparative purposes.
Table 3.
Results of the proposal analysis.
As can be seen in Table 3, all options are valid, although in the case of the clear juice pumps, the PTIs are higher than recommended and reported in [14,29]. This is due to the CSE being very close or equal to the sale price of energy, so the net income is very low. For this reason, immediate substitution is not recommended. The other variants show PTIs well below the expected lifespan of an electric motor [17].
As already mentioned, the pump load remains constant to simplify the analysis; therefore, the effect of a possible change of the operating point due to the change in speed has been neglected. High-efficiency induction motors tend to operate at a slightly higher full-load speed than standard-efficiency motors. A higher speed may be advantageous in several cases. However, the load increase, which may be specifically caused when centrifugal blowers or pumps are driven, should be assessed on a case-by-case basis as it may decrease energy-saving capabilities and thus affect the return on the investment.
The results of the economic analysis using the discounted cash flow method correspond to the preliminary analysis using the CSE. The PTI is more dependent on this cost, as shown in Figure 5. This result is achieved according to Equation (19).
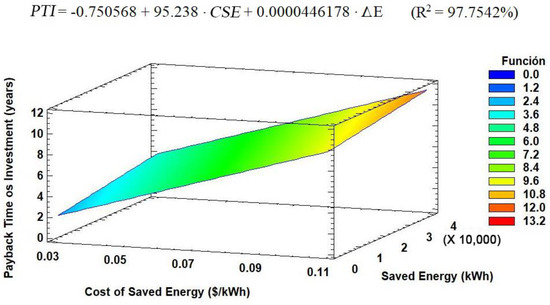
Figure 5.
Payback time of the investment (PTI) vs. the cost of saved energy (CSE) and saved energy (ΔE).
Figure 6 shows the surface that represents the behavior of the NPV. Once the NPV and the PTI have been correlated with saved energy (ΔE) and with the CSE, there are valid expressions for that facility that allow these indicators to be estimated quickly.

Figure 6.
Net present value (NPV) vs. the cost of saved energy (CSE) and saved energy (ΔE).
4. Conclusions
When analyzing the use of more efficient motors to replace others in operation, the opportunities for technical and economic potential are determined by assessing the calculation of potential energy savings and the CSE. Company proposals to replace motors must be analyzed individually. This article provides a complete methodology to identify existing technical and economic options at this facility. The strategy presented in this paper is based on an a priori preliminary assessment to determine the economic opportunities. The proposed methodology distinguishes which motors to evaluate and avoids evaluating all motors in the facility. In contrast to the literature reviewed, where the simple payback period is mostly used, in this paper, we propose to perform a complete economic analysis and calculate the payback period for the investment considering the discount rate from the results of the preliminary evaluation in which the CSE is calculated. In this sense, the principal problem shown in the literature reports regarding the identification of economic opportunities has been solved.
In the case analyzed, the substitution of oversized motors with IE3 motors power-adjusted to the load was evaluated. The technical potential estimated was 134.22 MWh/y.
The proposals that constitute economic opportunities by the calculation of the CSE are feasible, with positive NPV values and PTIs as reported in the literature for this type of proposal. It should be noted that the company studied a short-cycle operation industry with operating times of motors approaching between 1000 and 3000 h/y. However, energetic and economic benefits are obtained. There is a highly positive correlation between the values of the PTI and the CSE.
Although the CSE is a way to quickly evaluate if the replacement proposal is economically feasible, this should not be considered as the only calculation variant. This is because, by itself, this indicator does not provide information regarding amortization time or return on investment. It is necessary to perform a complete economic analysis of the proposal based on discounted cash flow methods to determine the NPV and the PTI of the investment.
Equations that correlate NPV and PTI with CSE and ΔE were obtained. These linear equations can be used to quickly estimate the feasibility of a proposal. Depending on the tariffs and on other economic indicators, each industry can construct linear equations that correlate these indicators for efficient and effective analysis.
For future work, the authors propose to extend this methodology to the case of motors driven by frequency inverters and to consider the greater opportunities offered by the extended system (control–motor–load).
Author Contributions
Conceptualization, J.R.G. and P.R.V.; methodology, J.R.G. and E.C.Q.; investigation, J.R.G. and E.C.Q.; writing—original draft preparation, J.R.G., E.C.Q., R.d.P.C., P.R.V.; writing—review and editing, J.R.G., E.C.Q., R.d.P.C. and P.R.V. All authors have read and agreed to the published version of the manuscript.
Funding
This research was funded by Universidad Autónoma de Occidente and Universidad de Cienfuegos. Grant Number: 3000063982.
Conflicts of Interest
The authors declare no conflict of interest.
References
- International Energy Agency, IEA. World Energy Outlook 2016. Typeset in France by IEA and Printed in France by DESK, November 2016. Available online: https://www.iea.org/topics/world-energy-outlook (accessed on 1 November 2019).
- Jibran, M.; Tijdink, A.; Patel, M.K. Techno-economic analysis of energy efficiency improvement in electric motor driven systems in Swiss industry. Appl. Energy 2017, 205, 85–104. [Google Scholar] [CrossRef]
- De Almeida, A.; Fong, J.; Brunner, C.U.; Werle, R.; Van Werkhoven, M. New technology trends and policy needs in energy efficient motor systems—A major opportunity for energy and carbon savings. Renew. Sustain. Energy Rev. 2019, 115, 109384. [Google Scholar] [CrossRef]
- Fong, J.; Ferreira, F.J.T.E.; Silva, A.M.; De Almeida, A.T. IEC61800-9 System Standards as a Tool to Boost the Efficiency of Electric Motor Driven Systems Worldwide. Inventions 2020, 5, 20. [Google Scholar] [CrossRef]
- Saidur, R. A review on electrical motors energy use and energy use and energy Saviews. Renew. Sustain. Energy Rev. 2020, 14, 877–898. [Google Scholar] [CrossRef]
- UN Environment—Global Environment Facility, United for Efficiency (U4E). Accelerating the Global Adoption of Energy-Efficient Electric Motors and Motor Systems, U4E Policy Guide Series; UN Enviroment: Paris, France, 2017; Available online: http://www.united4efficiency.org (accessed on 19 June 2020).
- Rosero-Garcia, J.A.; Quispe, E.C.; Castrillón-Mendoza, R. Tendencias en la normatividad, el desarrollo tecnológico y la aplicación de motores eléctricos de alta eficiencia. Prospectiva 2018, 16, 83–90. [Google Scholar] [CrossRef]
- Viego, P.R.; Gómez, J.R.; Quispe, E.C. Motores sincrónicos de reluctancia controlados con variadores de frecuencia: Una aplicación para ahorrar energía. Ing. Energ. 2015, 36, 72–82. [Google Scholar]
- Lu, S.-M. A review of high-efficiency motors: Specification, policy, and technology. Renew. Sustain. Energy Rev. 2016, 59, 1–12. [Google Scholar] [CrossRef]
- Sauer, I.L.; Tatizawa, H.; Salotti, F.A.; Mercedes, S.S.P. A comparative assessment of Brazilian electric motors performance with minimum efficiency standards. Renew. Sustain. Energy Rev. 2015, 41, 308–318. [Google Scholar] [CrossRef]
- Quispe, E.C.; Sousa, V.; Donolo, P.D.; Gómez, J.R.; Viego, P.R. Barriers to the application of energy efficient motors in Latin America. In Proceedings of the 10th International Conference on Energy Efficiency in Motor Driven Systems (EEMODS’ 2017), Roma, Italy, 6–8 September 2017; JRC: Brussels, Belgium, 2018; Volume 1, pp. 300–309. [Google Scholar]
- Van Werkhoven, M.; Werle, R.; Brunner, C.U.; Jeffcott, S.; Tait, J.; Doppelbauer, M. Energy efficiency roadmap for electric motor and motor systems, 4E Energy Efficient End-use Equipment, International Energy Agency. November 2015. Available online: www.motorsystems.org (accessed on 19 June 2020).
- Viego, P.R.; Borroto, A.; Gómez, J.R. Barreras para incrementar la eficiencia de sistemas accionados por motores eléctricos. Univ. Soc. 2015, 7, 63–73. [Google Scholar]
- Ferreira, F.J.T.E.; Silva, A.M.; Aguiar, V.P.; Pontes, R.S.T.; Quispe, E.C.; De Almeida, A.T. Overview of Retrofitting Options in Induction Motors to Improve Their Efficiency and Reliability. In Proceedings of the 2018 IEEE International Conference on Environment and Electrical Engineering and 2018 IEEE Industrial and Commercial Power Systems Europe (EEEIC/I&CPS Europe), Palermo, Italy, 12–15 June 2018; Institute of Electrical and Electronics Engineers (IEEE): Piscataway, NJ, USA, 2018; pp. 1–12. [Google Scholar]
- Li, Y.; Yu, H. Energy management for induction motors based on nonintrusive efficiency estimation. In Proceeding of the International Conference on Electrical Machines and Systems 2007, Seoul, Korea, 8–11 October 2007. [Google Scholar]
- Saidel, M.A.; Ramos, M.C.E.S.; Alves, S.S. Assessment and optimization of induction electric motors aiming energy efficiency in industrial applications. In Proceedings of the XIX International Conference on Electrical Machines—ICEM 2010, Rome, Italy, 6–8 September 2010; Institute of Electrical and Electronics Engineers (IEEE): Rome, Italy, 2010; Volume 19, pp. 1–6. [Google Scholar]
- Verucchi, C.J.; Ruschetti, R.; Kazlauskas, G. High Efficiency Electric Motors: Economic and Energy Advantages. IEEE Lat. Am. Trans. 2013, 11, 1325–1331. [Google Scholar] [CrossRef]
- Saidur, R.; Mahlia, T.M.I. Energy, economic and environmental benefits of using high-efficiency motors to replace standard motors for the Malaysian industries. Energy Policy 2010, 38, 4617–4625. [Google Scholar] [CrossRef]
- Hasanuzzaman, M.; Rahim, N.A.; Saidur, R.; Kazi, S. Energy savings and emissions reductions for rewinding and replacement of industrial motor. Energy 2011, 36, 233–240. [Google Scholar] [CrossRef]
- Habib, M.A.; Hasanuzzaman, M.; Hosenuzzaman, M.; Salman, A.; Mehadi, R. Energy consumption, energy saving and emission reduction of a garment industrial building in Bangladesh. Energy 2016, 112, 91–100. [Google Scholar] [CrossRef]
- De Almeida, A.T.; Fong, J.; Falkner, H.; Bertoldi, P. Policy options to promote energy efficient electric motors and drives in the EU. Renew. Sustain. Energy Rev. 2017, 74, 1275–1286. [Google Scholar] [CrossRef]
- Zamula, I.; Tanasiieva, M.; Travin, V.; Nitsenko, V.; Baležentis, T.; Štreimikienė, D. Assessment of the Profitability of Environmental Activities in Forestry. Sustainability 2020, 12, 2998. [Google Scholar] [CrossRef]
- U.S. Departament of Energy (DOE). Energy Savings Potential and Opportunities for High-Efficiency Electric Motors in Residential and Commercial Equipment; DOE/EE-09756746; U.S. Departament of Energy (DOE): Washington, DC, USA, 2013.
- U.S. Departament of Energy (DOE). Premium Efficiency Motor Selection and Application Guide; U.S. Departament of Energy (DOE): Washington, DC, USA, 2014.
- Waide, P.; Brunner, C.U. Energy-Efficiency Policy Opportunities for Electric Motor-Driven Systems; IEA Energy Papers: Paris, France, 2011. [Google Scholar]
- De Almeida, A.T.; Ferreira, F.J.T.E.; Duarte, A.Q. Technical and Economical Considerations on Super High-Efficiency Three-Phase Motors. IEEE Trans. Ind. Appl. 2013, 50, 1274–1285. [Google Scholar] [CrossRef]
- Dalvand, H.; Zare, M. Techno-Economic Evaluation of Energy Efficiency Measures in Iranian Industrial 3-Phase Electric Motors. In Proceedings of the IEEE International Power and Energy Conference, Putra Jaya, Malaysia, 28–29 November 2006; Institute of Electrical and Electronics Engineers (IEEE): Piscataway, NJ, USA, 2006; pp. 1–5. [Google Scholar]
- De Almeida, A.T.; Fonseca, P.; Ferreira, F.; Guisse, F.; Blaise, J.; Clair, E.; Diop, A.; Previ, A.; Dominioni, A.C.; Pillo, M.; et al. Improving the Penetration of Energy-Efficient Motors and Drives, Prepared for the European Commission; DGTE, SAVE II Programme; University of Coimbra: Coibra, Portugal, 2000. [Google Scholar]
- International Electrotechnical Commission. Rotating Electrical Machines—Part 31: Selection of Energy-Efficient Motors Including Variable Speed Applications—Application Guide; IEC 60034-31:2010; International Electrotechnical Commission: Geneva, Switzerland, 2014. [Google Scholar]
- De León, G.; Gómez, J.R.; Viego, P.R. Energy saving by replacement of oversized motors driving high inertia loads. Cen Azúcar 2019, 46, 40–50. [Google Scholar]
- Gomez, J.R.; Quispe, E.C.; De Armas, M.A.; Viego, P.R. Estimation of induction motor efficiency in-situ under unbalanced voltages using genetic algorithms. In Proceedings of the 18th International Conference on Electrical Machines, Vilamoura, Portugal, 6–9 September 2008; Institute of Electrical and Electronics Engineers (IEEE): Piscataway, NJ, USA, 2008; pp. 1–4. [Google Scholar]
- Santos, V.S.; Felipe, P.R.V.; Sarduy, J.R.G.; Lemozy, N.A.; Jurado, A.; Quispe, E.C. Procedure for Determining Induction Motor Efficiency Working Under Distorted Grid Voltages. IEEE Trans. Energy Convers. 2014, 30, 331–339. [Google Scholar] [CrossRef]
- Sousa, V.; Viego, P.R.; Gomez, J.R.; Quispe, E.C.; Balbis, M.; Santos, V.S.; Felipe, P.R.V.; Sarduy, J.R.G. Shaft Power Estimation in Induction Motor Operating Under Unbalanced and Harmonics Voltages. IEEE Lat. Am. Trans. 2016, 14, 2309–2315. [Google Scholar] [CrossRef]
- Viego, P.R.; Gómez, J.R.; de Armas, M.A.; Reyes, R. Determinación IN-SITU del factor de potencia y la eficiencia de motores asincrónicos a cargas parciales. Ing. Energ. 2014, 35, 15–26. [Google Scholar]
- Quispe, E.C.; Gómez, J.R. Desequilibrio de Tensiones en Motores de Inducción. Modelado, Impacto en el Desempeño Energético, Determinación de la Eficiencia, 1st ed.; Programa Editorial Universidad Autónoma de Occidente: Cali, Colombia, 2020; ISBN 978-958-619-057-2. [Google Scholar]
Publisher’s Note: MDPI stays neutral with regard to jurisdictional claims in published maps and institutional affiliations. |
© 2020 by the authors. Licensee MDPI, Basel, Switzerland. This article is an open access article distributed under the terms and conditions of the Creative Commons Attribution (CC BY) license (http://creativecommons.org/licenses/by/4.0/).