Article

Thermal and Economic Analysis of Multi-Effect Concentration System by Utilizing Waste Heat of Flue Gas for Magnesium Desulfurization Wastewater

School of Energy and Power Engineering, Shandong University, 17923 Jingshi Road, Jinan 250061, China
*
Author to whom correspondence should be addressed.
Energies 2020, 13(20), 5384; https://doi.org/10.3390/en13205384
Submission received: 12 September 2020 / Revised: 8 October 2020 / Accepted: 13 October 2020 / Published: 15 October 2020
(This article belongs to the Section B: Energy and Environment)

Abstract

:
Compared with limestone-based wet flue gas desulfurization (WFGD), magnesia-based WFGD has many advantages, but it is not popular in China, due to the lack of good wastewater treatment schemes. This paper proposes the wastewater treatment scheme of selling magnesium sulfate concentrate, and makes thermal and economic analysis for different concentration systems in the scheme. Comparisons of different concentration systems for 300 MW power plant were made to determine which system is the best. The results show that the parallel-feed benchmark system is better than the forward-feed benchmark system, and the parallel-feed optimization system with the 7-process is better than other parallel-feed optimization systems. Analyses of the parallel-feed optimization system with 7-process were made in 300, 600, and 1000 MW power plants. The results show that the annual profit of concentration system for a 300, 600, and 1000 MW power plant is about 2.58 million, 5.35 million, and 7.89 million Chinese Yuan (CNY), respectively. In different concentration systems of the scheme for selling magnesium sulfate concentrate, the parallel-feed optimization system with the 7-process has the best performance. The scheme can make a good profit in 300, 600, and 1000 MW power plants, and it is very helpful for promoting magnesia-based WFGD in China.

1. Introduction

Limestone-based wet flue gas desulfurization (WFGD), the most popular desulfurization technology used worldwide, leads the world market in installed post-combustion SO2 control technologies, and has about 85% of the market share in China [1,2,3]. Limestone-based WFGD has many advantages, such as low operating cost, abundant raw materials, and high stability. However, there are many disadvantages of limestone-based WFGD, such as serious blockage and wear, the byproduct occupying land problem, large water consumption, and air pollution [4]. Among them, the byproduct gypsum occupying land problem is more prominent, which gets more attention from scholars in the limestone-based WFGD field. Ma et al. [5] studied the combined utilization of gypsum and waste fly ash, and showed that the mixture of gypsum and waste fly ash with a certain proportion had acceptable mechanical properties for backfill applications under a NaOH activator, which provided a feasible choice for the large-scale utilization of gypsum. Koralegedara et al. [6] mainly discussed the application of flue gas desulfurization gypsum in soil improvement and water treatment, and pointed out that there are gaps, like the application of gypsum in landfill leachate treatment, that need to be researched in detail. Although quite a portion of WFGD gypsum has been used in different ways for recent years, the great amount and magnitude still causes huge accumulation, occupying more than 0.030% of China’s total land area [7,8].
After 2014, with the emergence of the concepts of ultra-low emission and zero discharge of wastewater [9], the pressure on power plants for flue gas desulfurization and wastewater treatment increased. For this reason, magnesia-based WFGD is becoming a promising technology, which has been studied by many Chinese scholars. Compared with limestone-based WFGD, magnesia-based WFGD has the advantages of high efficiency for SO2 removal, low energy consumption, low water consumption, and valuable byproducts [10]. In Japan, the United States, and some other countries, magnesia-based WFGD has many applications, of which the SO2 removal efficiency can reach more than 98%, and the byproducts can be magnesium oxide and sulfuric acid or magnesium sulfate [11,12]. These successful cases provide us with many available experiences, such as building new desulfurization projects and reforming the original desulfurization projects. In China, the reserves of magnesium ore are rich, and not available in other countries, so magnesia-based WFGD is easier to promote [4,12].
In the resource utilization of magnesium desulfurization wastewater, which attracts more attention from scholars in the magnesia-based WFGD field, the research focuses on the recovery of magnesia by high temperature pyrolysis, and the preparation of magnesium sulfate heptahydrate by oxidation crystallization. Yan et al. [13] studied the effects of particle size and charcoal on high temperature pyrolysis for the recovery of magnesia from magnesium desulfurization wastewater, but a high temperature heat source above 480 °C is needed to maintain the pyrolysis process. Preparation of magnesium sulfate heptahydrate by oxidation crystallization is a good way to treat desulfurization wastewater [11]. Magnesium sulfate heptahydrate, an inorganic compound with high market value, is widely used in printing and dyeing, brewing, tanning, electroplating, chemical fertilizer, and other industries [11]. Magnesium sulfate heptahydrate is obtained from desulfurization wastewater through four steps of oxidation, impurity removal, concentration, and crystallization [11]. Li et al. [14] studied how to stably and efficiently oxidize magnesium sulfite, and found that cobalt-based metal–organic frameworks with Co2+/organic ligand ratios of 4:1 have ultrahigh catalytic activity and stability. Yang et al. [15] studied the crystallization recovery of magnesium sulfate heptahydrate, based on the phase diagram, and the results showed that the crystallization temperature should be controlled at about 25 °C. Concentration, which can save water consumption of the desulfurization process, is a high energy consumption process among the four steps. Few scholars study the concentration of desulfurization wastewater. Ma et al. [16] studied the influence of flue gas and wastewater parameters on the evaporation capacity of flue gas by single factor experiment and orthogonal experiment, but they did not study the system energy consumption. Shao et al. [17] studied the performance of a nanofiltration-mechanical steam compression system, but their system needs electricity.
The waste heat resource of flue gas in a coal-fired power plant is rich; sometimes the temperature of exhaust flue gas can be as high as 150 ℃ [18,19]. Generally speaking, the boiler thermal efficiency of power plant increases by 1% for each 15–20 °C reduction of exhaust flue gas temperature [20]. However, the utilization of flue gas waste heat is limited for low-grade property [18]. Multi-effect technology is very popular in the field of desalination, which has high energy efficiency. In recent years, this technology began to shine in the field of low-grade heat source [21,22,23] and wastewater treatment [24]. Based on the above literature review, we found that in the field of magnesium desulfurization wastewater treatment, scholars pay more attention to the oxidation process, but not enough attention to the concentration process. The purpose of this paper is to study the concentration process of magnesium desulfurization wastewater from a thermal and economic perspective. In the concentration process, compared with traditional multi-effect technology with steam as the heat source, flue gas waste heat utilization technology is better in economy, but worse in energy utilization efficiency. So, in this paper, by using flue gas, instead of steam, as the heat source of multi-effect technology, the concentration process can perform well in both economy and energy utilization efficiency. The concentration process, with the combination of multi-effect technology and flue gas waste heat utilization technology, is analyzed from a thermal and economic perspective, based on a 300, 600, and 1000 MW power plant. These works can provide favorable conditions for the popularization of magnesia-based WFGD in China. Firstly, taking inlet flue gas temperature and system effects number as variables, the forward-feed benchmark system and the parallel-feed benchmark system were compared. Then different optimization processes were added to the parallel-feed benchmark system, and a comparison was made. The influence of annual utilization hours, steam price, 09CrCuSb alloy (ND steel) price, 304 stainless steel price, and magnesium sulfate concentrate price on the annual profit of the parallel-feed optimization system with the 7-process was analyzed. Finally, the parallel-feed optimization system with the 7-process of a 300, 600, and 1000 MW power plant were compared for thermal performance and economic performance.

2. Process Description and Methods

2.1. Process Description

As shown in Figure 1, the magnesium desulfurization wastewater from the desulfurization tower is converted into magnesium sulfate concentrate after thorough aeration, neutralization sedimentation, heavy metal sedimentation, coagulation sedimentation, clarification, and concentration [14,25]. In the aeration step, air and catalyst are added to oxidize magnesium sulfite to magnesium sulfate. In the three steps of neutralization sedimentation, heavy metal sedimentation, and coagulation sedimentation, alkaline substances, organic sulfur reagent, and flocculants are added to remove metal ions, particles, and colloidal matter. In the clarification step, sludge is separated from supernatant liquid containing magnesium sulfate. The final step of converting magnesium desulfurization wastewater into magnesium sulfate concentrate is concentration, which is a process of high heat consumption, and reducing its heat consumption is worth studying.
Common concentration system configurations include forward-feed and parallel-feed [26,27], which are widely used in desalination and other processes [24,28,29,30,31]. The two configurations have advantages and disadvantages, and the way of preheating feed by final effect steam is widely used, to improve system concentration efficiency. The flue gas with waste heat is used as the heat source of the concentration system, rather than the steam with high quality heat. An evaporation heat exchanger is set in the tail flue to generate saturated steam with a pressure slightly higher than the atmospheric pressure, which enters the multi-effect concentration system of the forward-feed or parallel-feed, as shown in Figure 2. The forward-feed or parallel-feed concentration system with final effect steam preheating feed is selected as the benchmark system for this optimization.
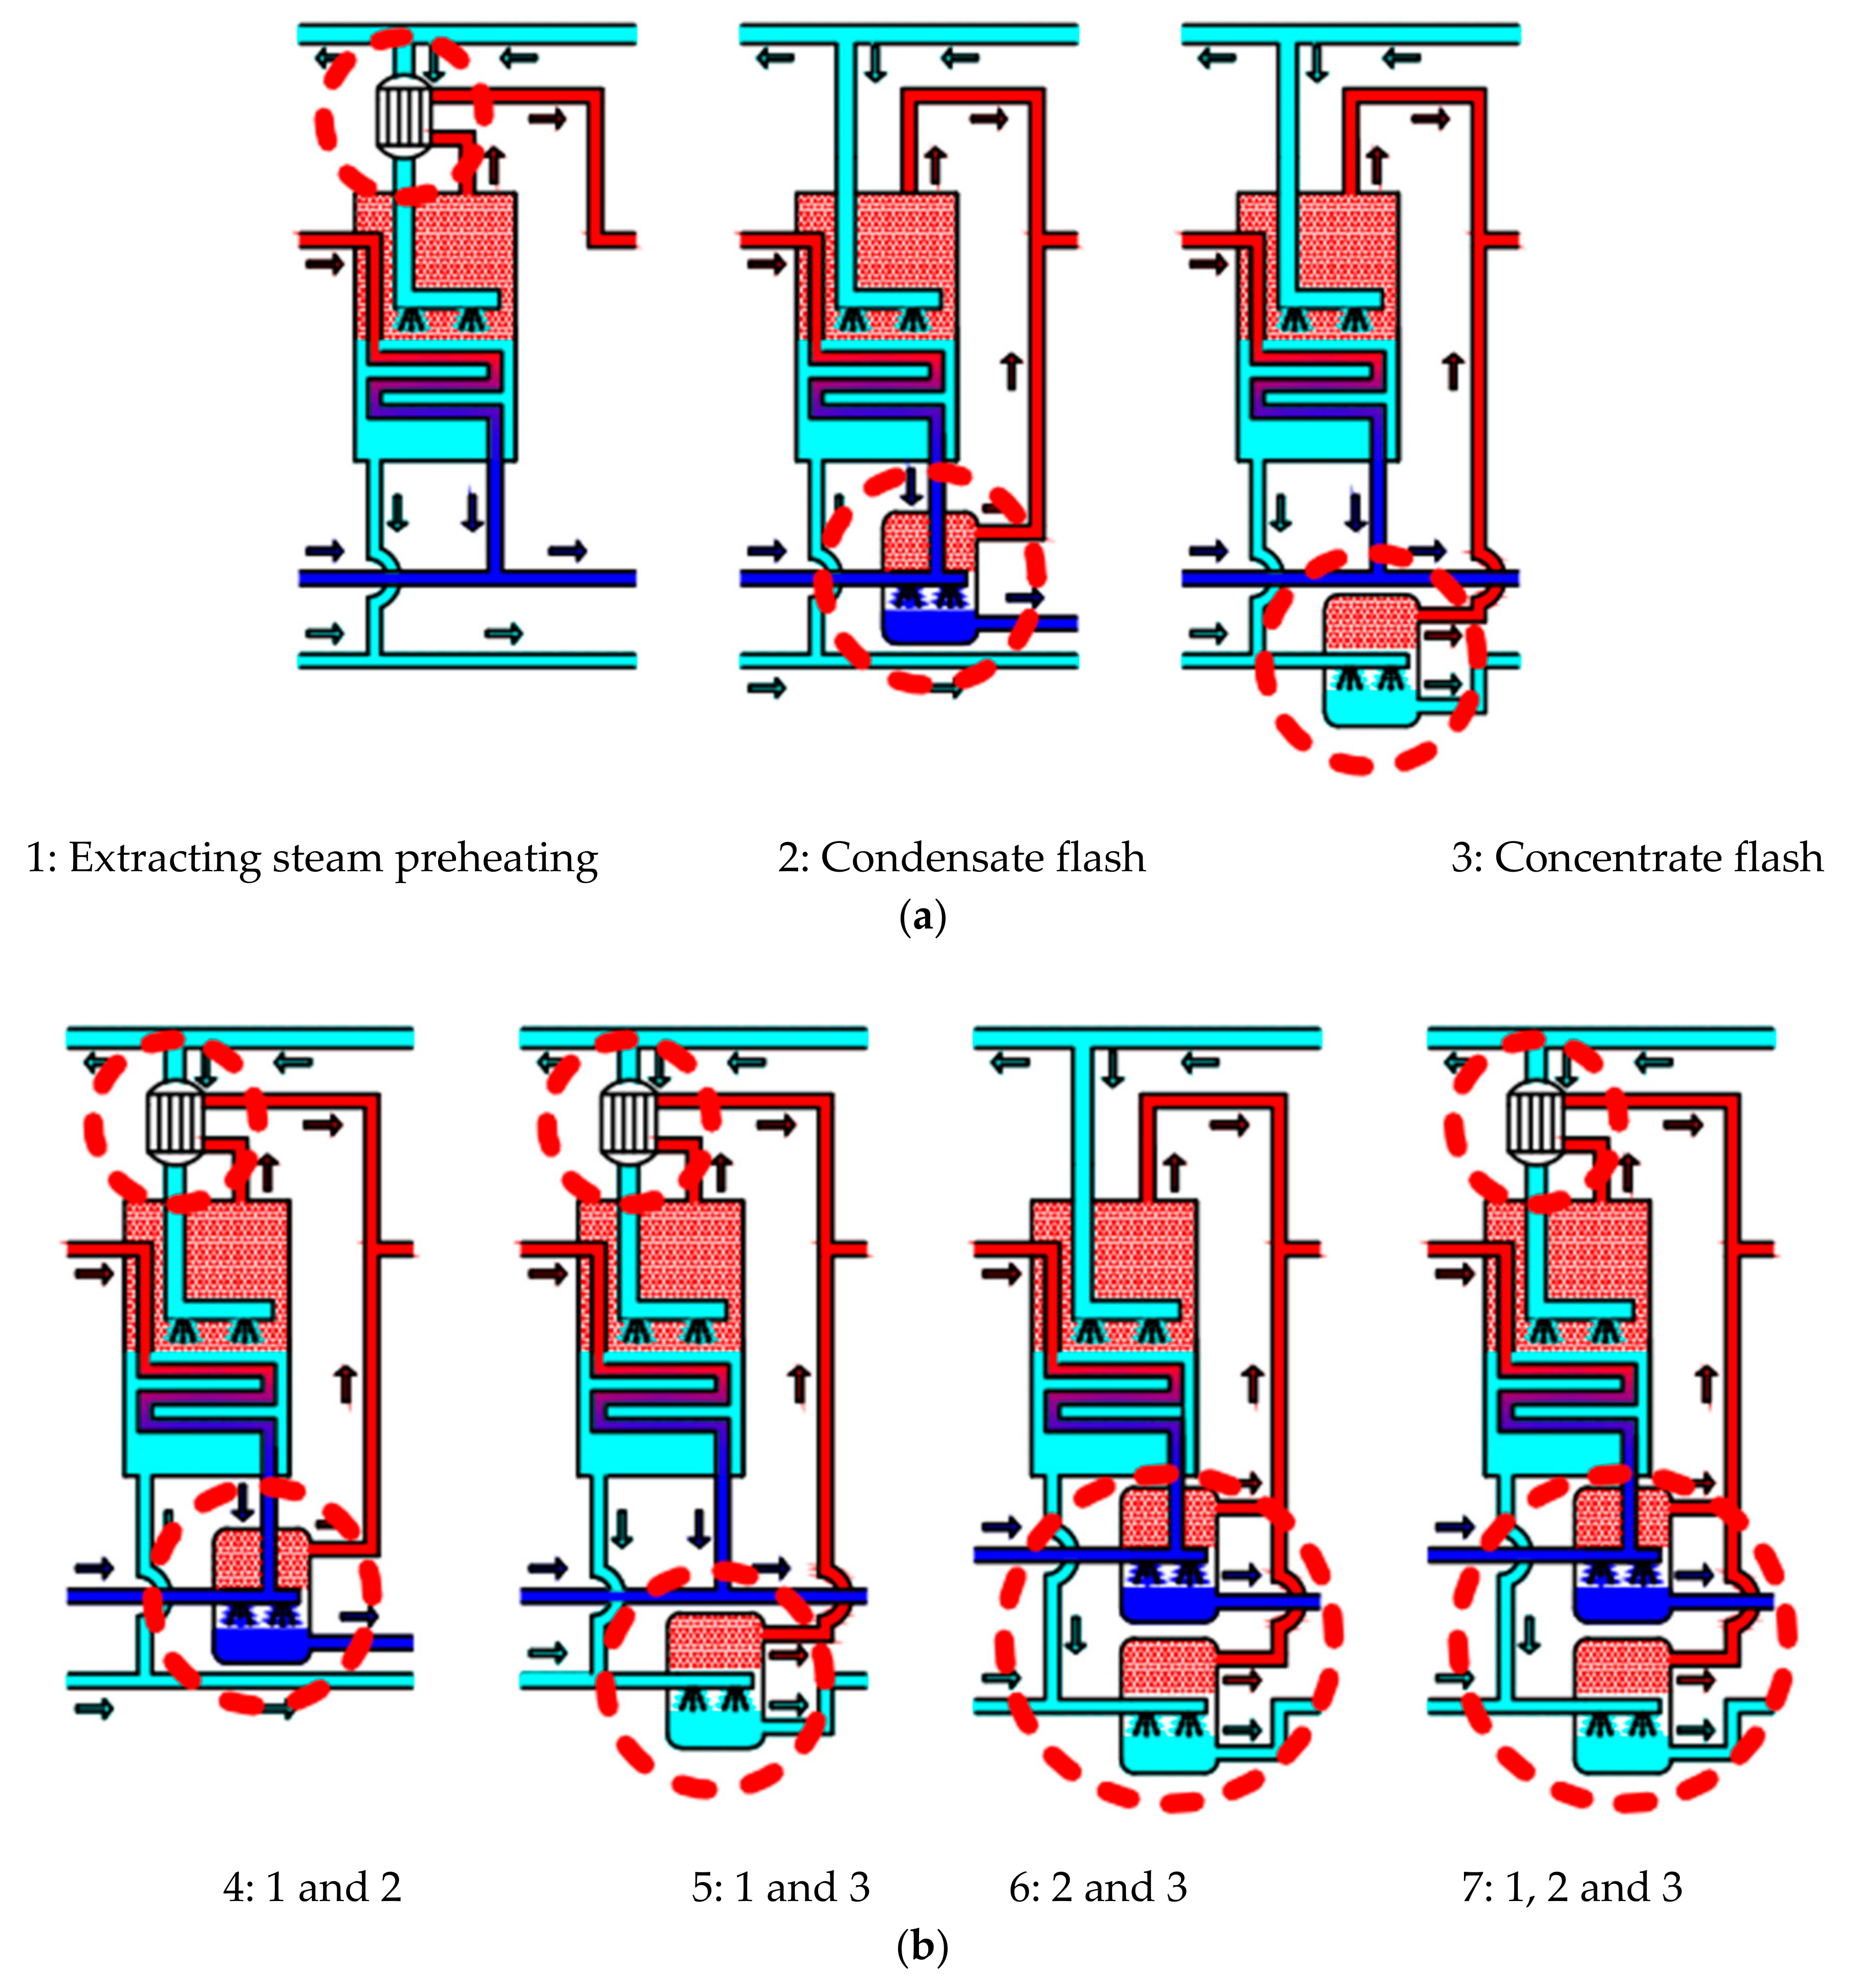
Different optimization processes of multi-effect parallel-feed concentration system are shown in Figure 3. In the calculation conditions in this paper, the thermal and economic performance of the parallel-feed benchmark system is better than that of the forward-feed benchmark system, as shown in Figure 4 and Figure 5, and a detailed explanation is given in Section 3.1. Therefore, the parallel-feed benchmark system was selected for process optimization. The optimization methods of the multi-effect concentration system to improve performance mainly include extraction steam preheating, condensate flash, concentrate flash, and various combinations [32,33,34], and the process principle is shown in Figure 3.

2.2. Assumption and Validation

The concentration systems were modelled in Ebsilon, which is suitable for modelling thermal processes. Ebsilon has the advantages of convenient design, flexible model building, and fast convergence calculation. To simplify the models in this paper, the assumptions are made below:
(1)
Steady-state operation.
(2)
The desulfurization wastewater entering the concentration system is regarded as a single component solution with only magnesium sulfate as the solute.
(3)
The water evaporated from the concentration system is treated as pure water.
(4)
No heat loss of any equipment of the concentration system.
(5)
No pressure drop loss of any equipment of the concentration system.
(6)
Ignore the influence of non-condensable gas.
The Ebsilon model is validated by comparing with a commercial multi-effect distillation plant. As shown in Table 1, the simulation result agree well with the actual plant data. The relative errors of specific heat consumption and specific heat transfer area are both less than 1%.

2.3. Boundary Conditions and Simulation Settings for a 300 MW Power Plant

Outlet parameters: Magnesium desulfurization wastewater consists of magnesium sulfite, acid ions, heavy metal elements, non-metal elements, and so on [36]. After oxidation, sedimentation, flocculation, and other pretreatment, magnesium sulfate solution for concentration and crystallization is obtained. Research shows that at 70 °C, the saturated mass fraction of magnesium sulfate is the highest, at 35% [37]. Therefore, the outlet temperature and mass fraction of the concentration system are set at 70 °C and 35%.
Inlet parameters: The working temperature of magnesium desulfurization is generally 50–60 °C [38]. After about 20 h of aeration oxidation in the aeration oxidation tank, the magnesium sulfate solution is nearly saturated (~26%), and its temperature drops to ambient temperature [39]. Therefore, the inlet temperature and mass fraction of the concentration system are set at 25 °C and 24%. The inlet feed flow is calculated according to Equation (1), and the data is shown in Table 2. In addition, we select 110 °C, 120 °C, and 130 °C as the inlet flue gas temperature of the multi-effect concentration systems, which are the common exhaust gas temperatures of a 300 MW coal-fired unit [18,40,41].
G i n   =   G c   ×   η b   ×   S a r   ×   η d   ÷   M S   ×   M M g S O 4   ÷   W M g S O 4
In Equation (1), Gin is the inlet magnesium sulfate solution mass flow of concentration system, t/h; Gc is the coal consumption of a 300 MW power generation unit, t/h; ηb is the combustion efficiency of boiler, %; Sar is the sulfur content of coal on received basis, %; ηd is the flue gas desulfurization efficiency of power plant, %; MS is the molar mass of sulfur, g/mol; MMgSO4 is the molar mass of magnesium sulfate, g/mol; and WMgSO4 is the mass fraction of magnesium sulfate in the solution, %.

2.4. Thermal Performance Analysis

Thermal performance is generally reflected by Sh and Sa, which are calculated by Equations (2) and (3) [34].
S h = Q in ÷ M w
In Equation (2), Sh represents the flue gas heat required for the concentration system to evaporate one tonne of water from the inlet feed, which reflects the use effect of the concentration system on the flue gas heat, MJ/t; Qin represents the input flue gas heat of the concentration system, kW; and Mw represents the evaporation water mass flow of the concentration system, t/h.
S a = ( A f + A e + A p + A c ) ÷ M w
In Equation (3), Sa represents the heat transfer area required for the concentration system to evaporate each 1 t/h of water from the inlet feed, which reflects the investment cost of the concentration system, m2·h/t; Af represents the heat transfer area of flue heat exchanger, m2; Ae represents the total heat transfer area of all evaporators, m2; Ap represents the total heat transfer area of all preheaters, m2; Ac represents the heat transfer area of condenser, m2; and Mw represents the evaporation water mass flow of the concentration system, t/h.

2.5. Economic Analysis

P = S C
In Equation (4), P is the annual profit of the concentration system, 104 ¥/a; S is the annual sale of the concentration system, 104 ¥/a; and C is the annual cost of the concentration system, 104 ¥/a. The annual sale of the concentration system is the value of all magnesium sulfate concentrate produced by the concentration system in one year. The annual sale of the concentration system is estimated by Equation (5). The annual cost of the concentration system is composed of the annual heat source cost and the annual depreciation cost [26,27]. The relevant calculation equations for the annual cost of the concentration system are Equations (6)–(12).
S = G o u t ,   M g S O 4 × M M g S O 4 · 7 H 2 O ÷ M M g S O 4 × Y × θ × P M g S O 4 · 7 H 2 O × s M g S O 4 · 7 H 2 O C c
In Equation (5), S is the annual sale of the concentration system, 104 ¥/a; Gout, MgSO4 is the pure MgSO4 mass flow of the concentration system outlet, t/h (Gout, MgSO4 = 2.089); MMgSO4·7H2O is the molar mass of magnesium sulfate heptahydrate, g/mol (MMgSO4·7H2O = 246); MMgSO4 is the molar mass of magnesium sulfate, g/mol (MMgSO4 = 120); Y is the yield of magnesium sulfate heptahydrate (Y = 0.75); θ is the annual converted full load utilization hours of power plant, h/a (θ is 4000); PMgSO4·7H2O is the unit price of magnesium sulfate heptahydrate, 104 ¥/t (PMgSO4·7H2O = 0.045); sMgSO4·7H2O is the cost factor magnesium sulfate heptahydrate (sMgSO4·7H2O = 0.5); and Cc is the annual cost of the cooling crystallization process, 104 ¥/a (Cc = 11.26).
C = C h + C d
In Equation (6), C is the annual cost of the concentration system, 104 ¥/a; Ch is the annual heat source cost of the concentration system, which is the flue gas heat consumption cost, 104 ¥/a; and Cd is the annual depreciation cost of the concentration system, which is the total depreciation cost of flue heat exchanger, evaporators, preheaters and condenser, 104 ¥/a.
C h = θ × G s × P s
In Equation (7), Ch is the annual heat source cost of the concentration system, 104 ¥/a; θ is the annual converted full load utilization hours of power plant, h/a (θ is 4000); Gs is the circulating steam generated by the flue heat exchanger, t/h (calculated by software); and Ps is the steam price, 104 ¥/t (Ps is 0.0055 at 0.15 MPa [42]).
C d = γ f × I f + γ e × I e + γ p × I p + γ c × I c
In Equation (8) [26], Cd is the annual depreciation cost of the concentration system, 104 ¥/a; γf, γe, γp, and γc represent the annual depreciation rate of flue heat exchanger, evaporators, preheaters, and condenser, respectively, a−1f, γe, γp, and γc are all 0.1 [26]); If, Ie, Ip, and Ic represent the investment cost of flue heat exchanger, evaporators, preheaters, and condenser, respectively, 104 ¥.
I f = m × P N × α
In Equation (9) [43], If is the flue heat exchanger investment cost, 104 ¥; m is the flue heat exchanger weight, t (calculated by software); PN is the unit price of ND steel, 104 ¥/t (ND steel has superior resistance to sulfuric acid dew point corrosion, PN = 0.47); and α is the equipment investment cost coefficient (α is 1.7 [43]).
I e = Σ i = 1 n { [ 4400 + ( P 3 620 ) ] × 1.2 × ( 0.667 + 0.0287 A i ) × Z i }
In Equation (10) [26], Ie is the total investment cost of evaporators, 104 ¥; i is the sequence number of evaporators; n is the effects number of evaporators; P3 is the unit price of 304 stainless steel, 104 ¥/t (304 stainless steel is corrosion-resistant and easy to process, P3 = 0.36); Ai is the heat transfer area of the ith effect, m2 (calculated by software); and Zi is the investment increase coefficient determined by the heat transfer area of the ith effect (Zi = 1 [26]).
I p = Σ j = 1 k 1350.5 × A j 0.65 × ( 2.29 + β j )
In Equation (11) [26], Ip is the total investment cost of preheaters, 104 ¥; j is the sequence number of preheaters; k is the number of preheaters; Aj is the heat transfer area of the jth preheater, m2 (calculated by software); and βj is the jth preheater correction coefficient (βj is 2.5 or 3.1 [26]).
I c = 1350.5 × A c 0.65 × ( 2.29 + β c )
In Equation (12) [26], Ic is the investment cost of condenser, 104 ¥; Ac is the condenser heat transfer area, m2 (calculated by software); and βc is the condenser correction coefficient (βc is 2.5 or 3.1 [26]).

3. Results and Discussion

3.1. Benchmark System of 300 MW Power Plant

3.1.1. Thermal Performance Analysis of Benchmark System

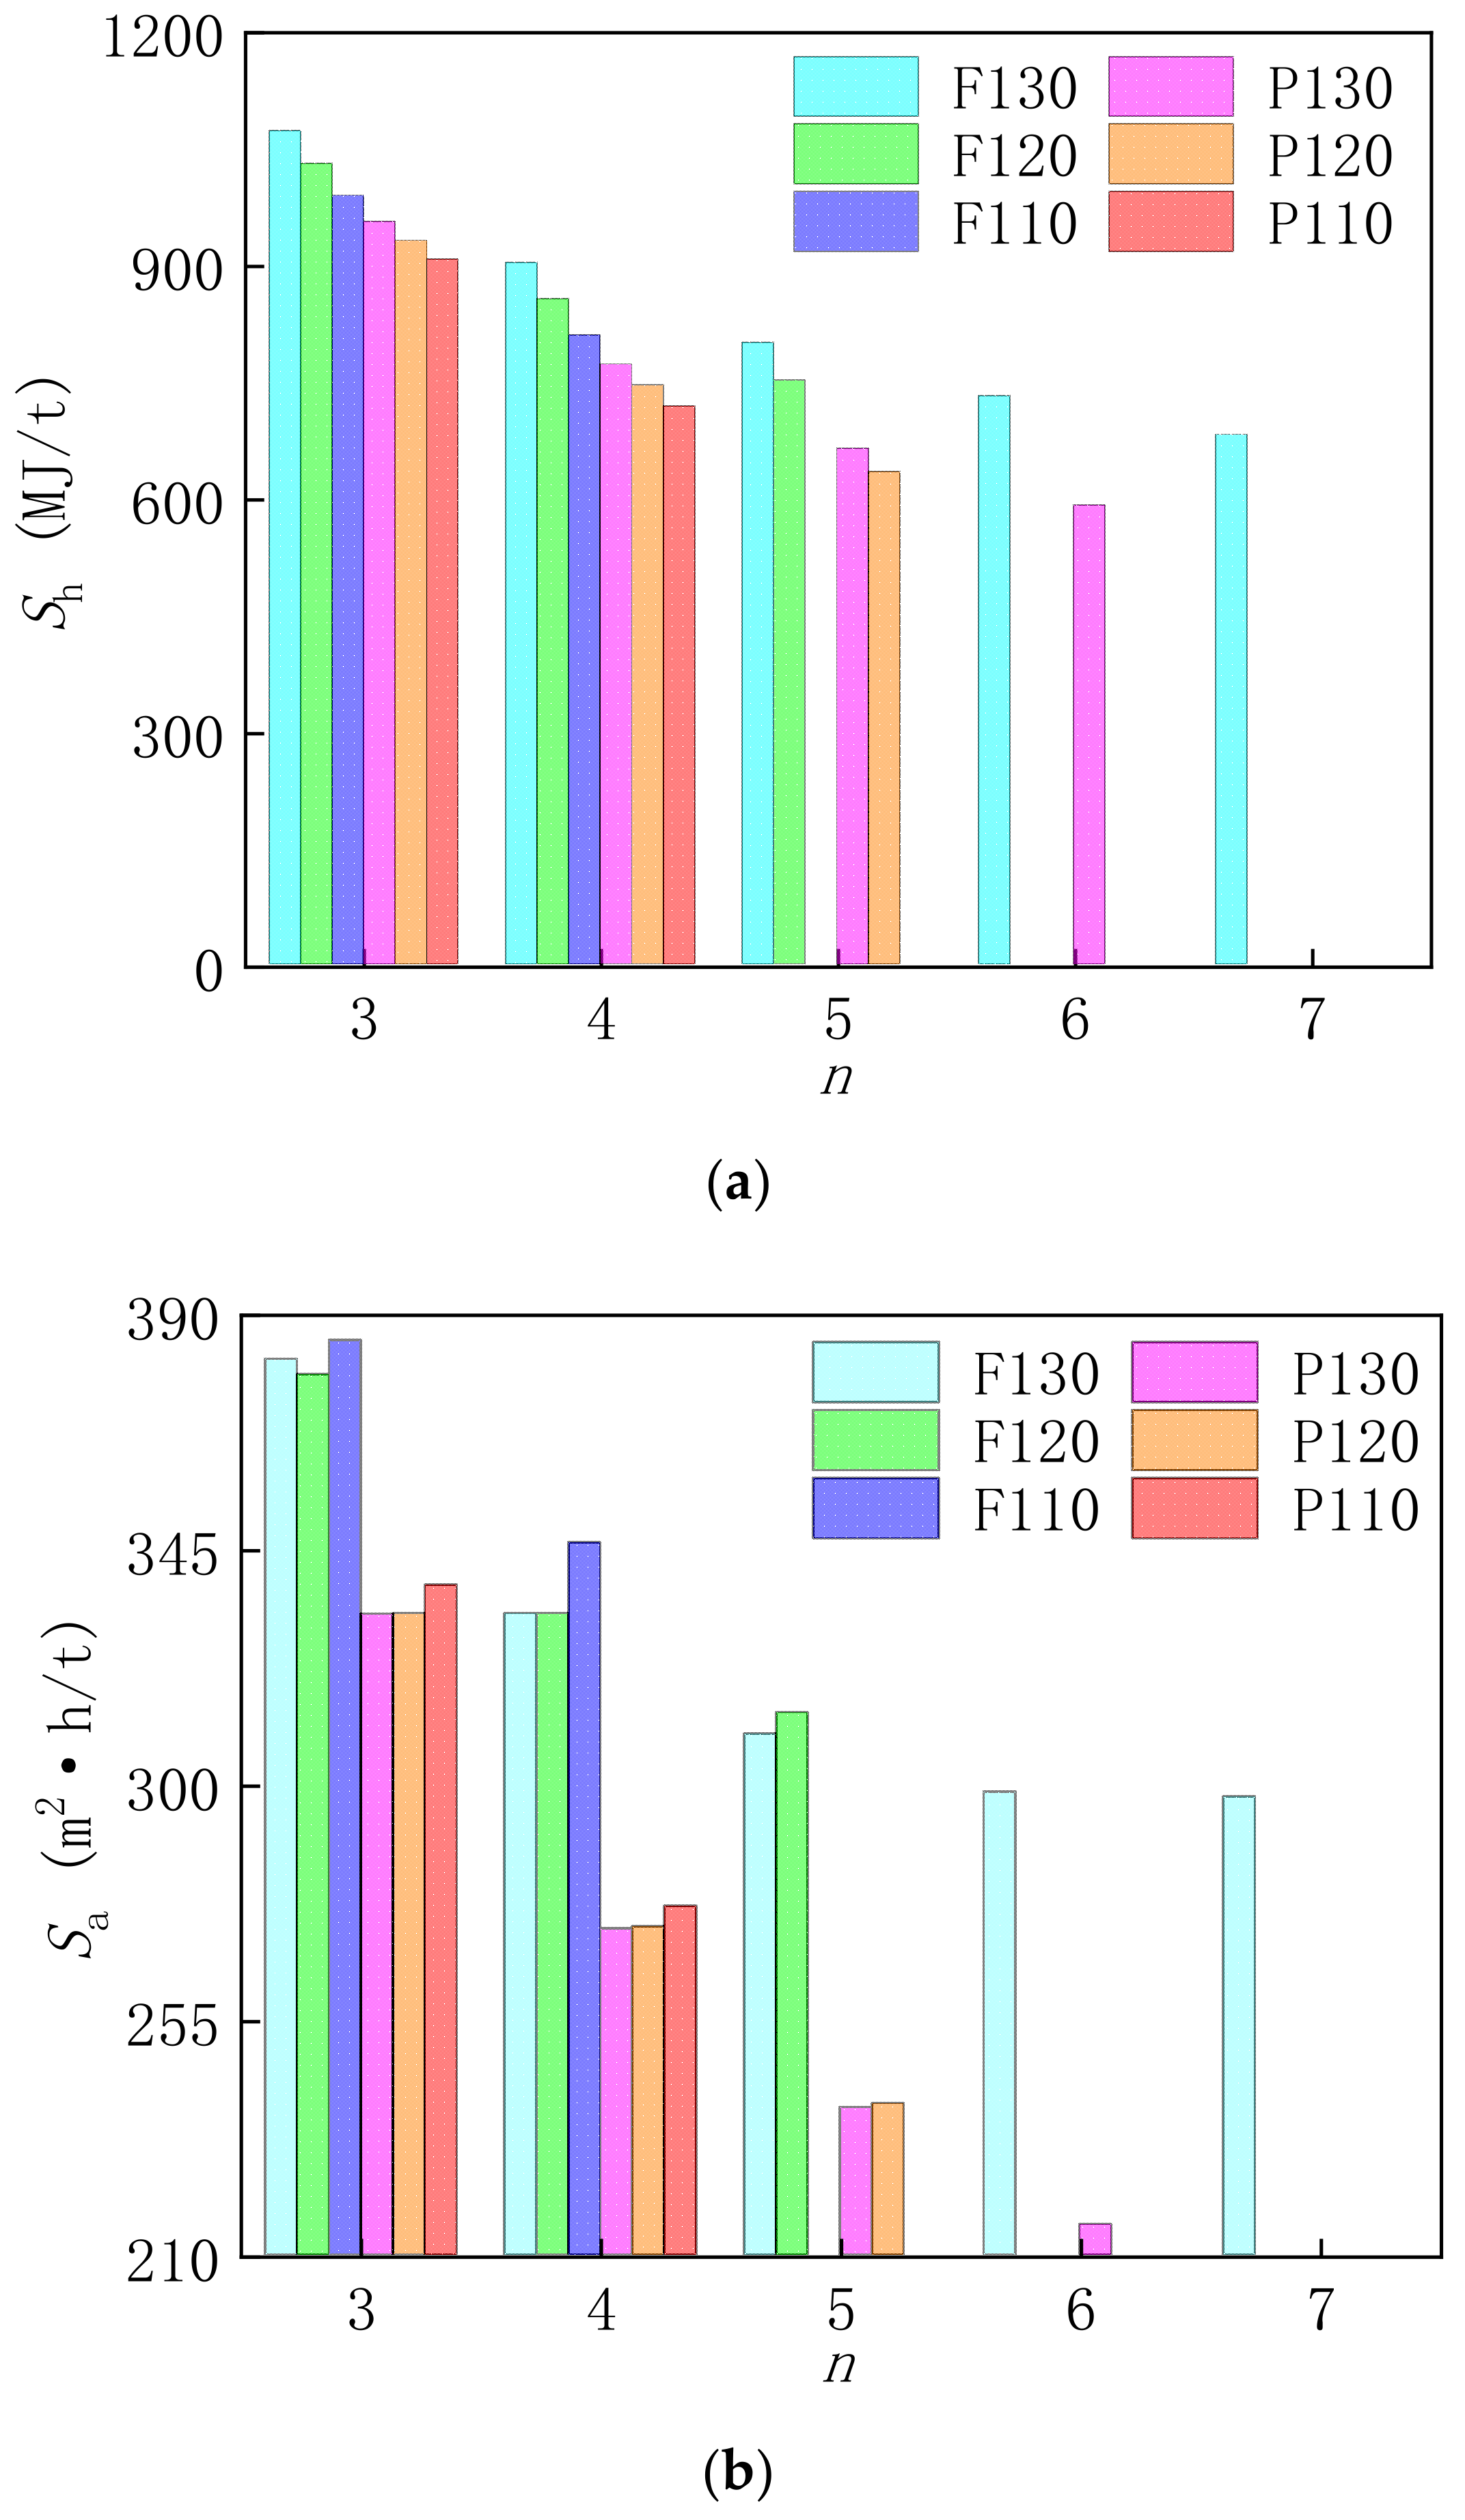
The influence of inlet flue gas temperature, process type, and effects number on the specific flue gas heat and the specific heat transfer area of the benchmark system is studied, as shown in Figure 4. In the legend of Figure 4, F represents forward-feed, P represents parallel-feed, and the number represents the inlet flue gas temperature. F130 stands for the forward-feed benchmark system, of which inlet flue gas temperature is 130 °C, P130 stands for the parallel-feed benchmark system, of which inlet flue gas temperature is 130 °C, and so on.
Four features can be seen from Figure 4. The first feature is that the specific flue gas heat and specific heat transfer area of the parallel-feed is lower than that of the forward-feed under the same effects number and inlet flue gas temperature. In the forward-feed configuration, all the feed enters the first effect evaporator, and two processes occur successively: the preheating process to the bubble point, and the evaporation process to generate steam. Only a part of the heat absorbed in the preheating process can be used by the subsequent evaporator, through natural pressure drop flash, while all of the heat absorbed in the evaporation process is used by the subsequent evaporator, in the form of secondary steam. In the parallel-feed configuration, the feed enters each evaporator after being evenly divided. In the first effect evaporator, the heat absorbed in the preheating process is reduced, and the heat absorbed in the evaporation process is increased. So, in the subsequent evaporator, the available heat is increased, which can reduce the input heat of the flue gas. Figure 4a indicates that the flue heat exchanger duty of parallel-feed is lower than that of forward-feed. Because the heat transfer coefficient of the flue heat exchanger is very low, the flue heat exchanger area of the parallel-feed is obviously less than that of the forward-feed. In addition, the area of other heat exchange equipment is almost equal in the parallel-feed and forward-feed. So, Sa, which involves all the heat exchanger area, of the parallel-feed is less than that of the forward-feed.
The second feature is that when the inlet flue gas temperature decreases from 130 °C to 110 °C, the specific flue gas heat of the forward-feed and the parallel-feed decreases, and the specific heat transfer area of the forward-feed and the parallel-feed, on the general trend, increases. When the inlet flue gas temperature decreases, the temperature of each evaporator decreases, the preheat of feed decreases, and the temperature of each effect condensate decreases, so the specific flue gas heat decreases. With the decrease of inlet flue gas temperature, flue heat exchanger area decreases, evaporator areas increase, and other heat exchanger area hardly changes. On the general trend, the increase of evaporator area is greater than the decrease of flue heat exchanger area, so the specific heat transfer area increases.
The third feature is that the specific flue gas heat and specific heat transfer area of the forward-feed and the parallel-feed both decrease when the effects number increases from 3 to 7. Every time the number of effects increases, the input heat of flue gas will be used by the system again, in the form of secondary steam. Because the heat demand of magnesium sulfate solution during concentration is certain, the input heat of flue gas will decrease. With the increase of effects number, the flue heat exchanger area decreases, evaporator areas increase, and other heat exchanger area hardly changes. On the general trend, the decrease of flue heat exchanger area is greater than the increase of evaporator areas.
The fourth feature is that there are upper limits of the maximum effects number in both forward-feed and parallel-feed, and the upper limit value increases when the inlet flue gas temperature increases from 110 °C to 130 °C. The concentration outlet temperature of the system is 70 °C. During operation, the heat transfer temperature difference of the evaporator shall be greater than 5 °C. When the inlet flue gas temperature is determined, the system total temperature difference is determined, and the upper limit value of the maximum effects number is determined accordingly. The larger the inlet flue gas temperature is, the greater the system total temperature difference is, and the higher the upper limit value will be.
An invisible phenomenon in Figure 4 is that all the temperature differences between the flue gas at the inlet and outlet of the six concentration systems in the Figure 4 are less than 3 °C. The minimum safe operating temperature of the heat exchanger, considering acid corrosion, is 80 °C [44], so even if the inlet flue gas temperature is 110 °C, the magnesium desulfurization wastewater concentration system can be operated safely.

3.1.2. Economic Analysis of Benchmark System

The influences of inlet flue gas temperature, process type, and effects number on the annual profit of benchmark systems are studied, as shown in Figure 5. In the legend of Figure 5, F represents forward-feed, P represents parallel-feed, and the number represents the inlet flue gas temperature. F130 stands for the forward-feed benchmark system, of which inlet flue gas temperature is 130 °C, P130 stands for the parallel-feed benchmark system, of which inlet flue gas temperature is 130 °C, and so on.
Three features can be seen from Figure 5. The first feature is that the annual profit of the parallel-feed is higher than that of the forward-feed under the same effects number and inlet flue gas temperature. We can see from Figure 4 that Sh and Sa of the parallel-feed is lower than that of the forward-feed. So, Ch and Cd of the parallel-feed is lower than that of the forward-feed. C of the parallel-feed is lower. S of the parallel-feed is equal to that of the forward-feed. So, P of the parallel-feed is higher than that of the forward-feed.
The second feature is that the annual profit of the forward-feed and the parallel-feed both increase when the inlet flue gas temperature decreases from 130 °C to 110 °C. The second feature from Figure 4 indicates that Ch of the forward-feed and the parallel-feed decreases, and Ca of the forward-feed and the parallel-feed, on the general trend, increases. But the decrease of Ch is greater than the increase of Ca. So, C of the forward-feed and the parallel-feed decreases. S of the parallel-feed and the forward-feed do not change with the decrease of inlet flue gas temperature. So, P of the forward-feed and the parallel-feed increase.
The third feature is that the annual profit of the forward-feed and the parallel-feed increase when the effects number increases from 3 to 7. With the increase of effect numbers, both Ch and Ca of the forward-feed and the parallel-feed decrease. So, C of the forward-feed and the parallel-feed decreases. S of the parallel-feed and the forward-feed do not change with the increase of effect numbers. So, P of the forward-feed and the parallel-feed increase.

3.2. Optimization System of 300 MW Power Plant

Figure 4 and Figure 5 show that the thermal and economic performance of the parallel-feed benchmark system is better than that of the forward-feed benchmark system, so the parallel-feed benchmark system is selected for process optimization. There are eight parallel-feed systems with benchmark or different optimized processes shown in Figure 3.

3.2.1. Thermal Performance Analysis of Optimization System

Taking inlet flue gas temperature and system effects number as variables, the changes of specific flue gas heat and specific heat transfer area of optimization system are studied, as shown in Figure 6. In the legend, 0 represents the parallel-feed benchmark system in Figure 2, and 1–7 represent the parallel-feed optimization system with the corresponding number optimization process in Figure 3.
Figure 6 shows that, no matter the benchmark or the optimized system, the specific flue gas heat and the specific heat transfer area both follow the three features of second, third, and fourth in Figure 4. In addition, Figure 6 shows that among the three optimization processes of 1–3, the optimization effect of 1-process is better than that of 2-process and 3-process, in both the specific flue gas heat and the specific heat transfer area. The 1-process uses the secondary steam generated at the previous moment to preheat the system feed at the next moment, so that the heat absorption of the system feed at the next moment in the evaporator is significantly reduced. Thus, the input heat and the heat exchanger heat load of the concentration system both are apparently reduced, and the specific flue gas heat and the specific heat transfer area obviously decrease. The 2-process and 3-process produce additional steam through flash of liquid pressure drop, which is generated by absorbing sensible heat of liquid, and has a low mass flow. Thus, the input heat and the heat exchanger heat load of concentration systems both are slightly reduced, the specific flue gas heat and the specific heat transfer area slightly decrease. Among the 4–7 combined optimization processes, 7-process has the best optimization effect, in both the specific flue gas heat and the specific heat transfer area, and is also the best of all the 1–7 optimization processes. The process combines the three methods of extracting steam preheating, condensate flash, and concentrate flash, which can be well compatible, and minimize the input heat and the heat exchanger heat load of the concentration system. So, the specific flue gas heat and the specific heat transfer area of the 7-process are the minimum in all the 1–7 optimization processes.

3.2.2. Economic Analysis of Optimization System

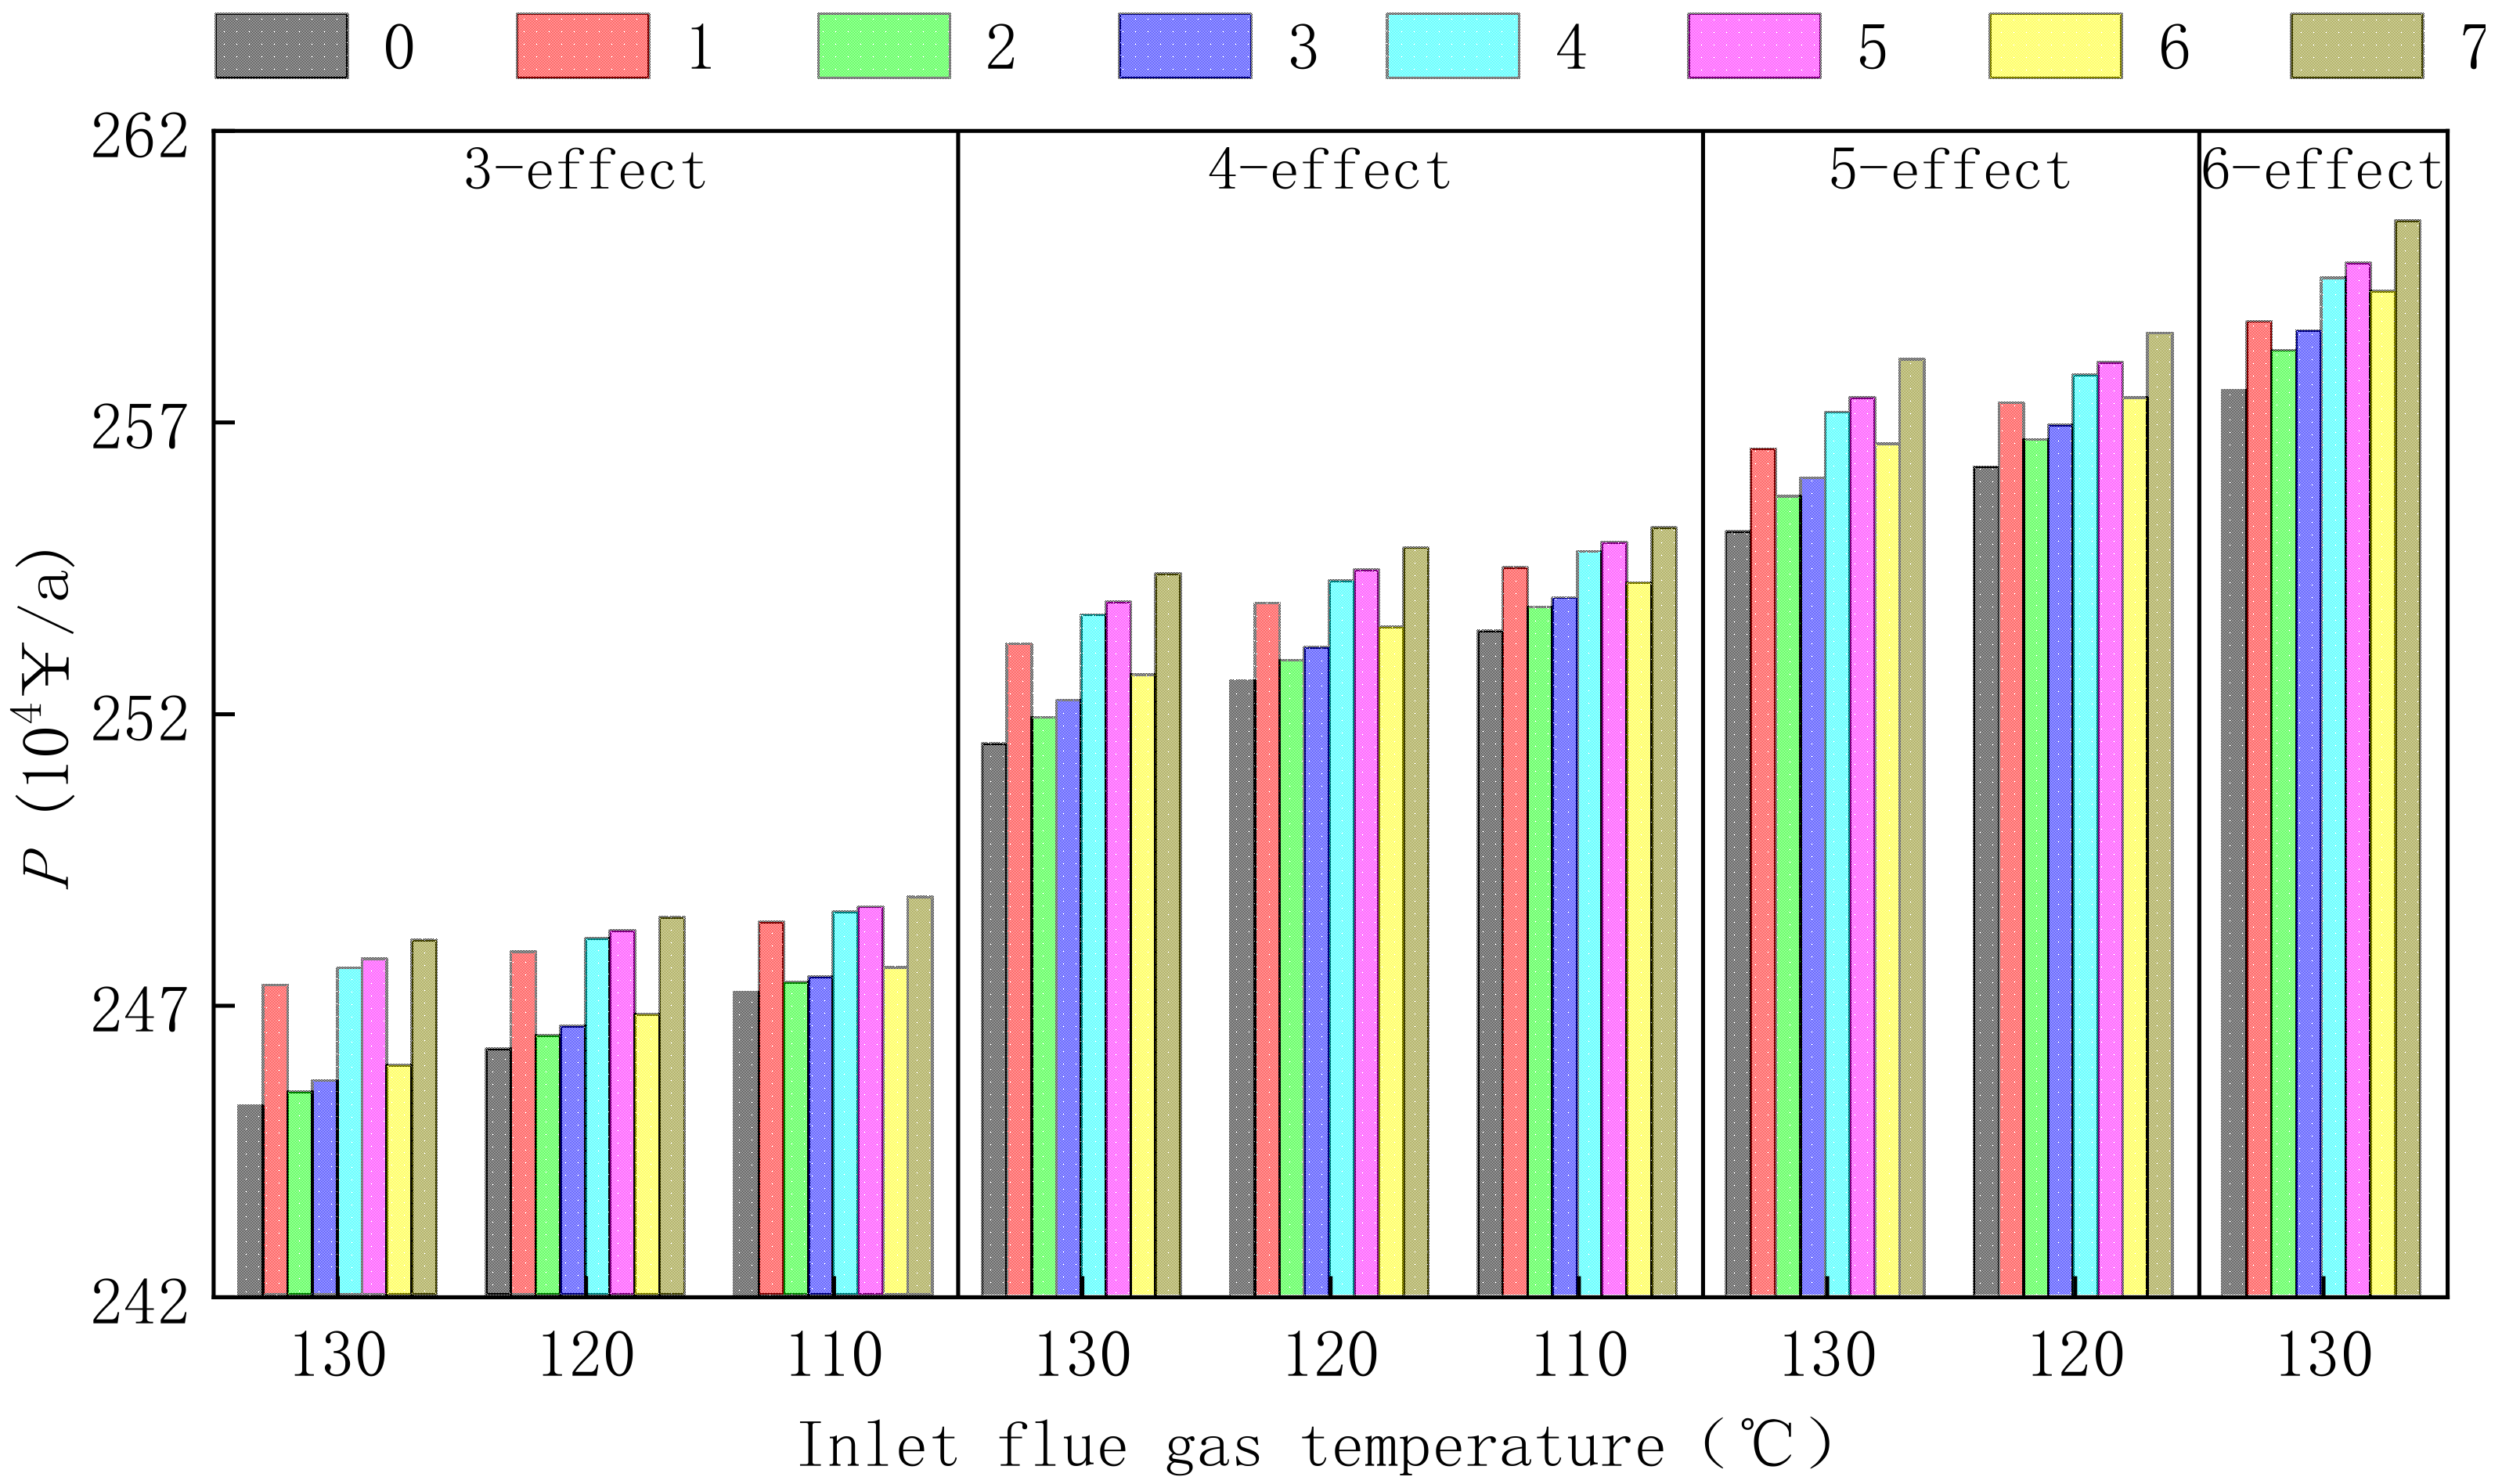
Taking inlet flue gas temperature and system effects number as variables, the change of annual profit of systems are studied, as shown in Figure 7. In the legend, 0 represents the parallel-feed benchmark system in Figure 2, and 1–7 represents the parallel-feed optimization system with the corresponding number optimization process in Figure 3.
Figure 7 shows that, no matter the benchmark or the optimized system, the annual profit follows the two features of second and third in Figure 5. In addition, Figure 7 shows that, among the three optimization processes of 1–3, the optimization effect of 1-process is better than that of 2-process and 3-process. Figure 6 indicates that C, which is decided by Sh and Sa, of 1-process is obviously reduced. S of 1-process does not change. So, P of 1-process obviously increases. Figure 6 also indicates that C of 2-process and 3-process are slightly reduced. S does not change. So, P of 2-process and 3-process slightly increase. Among the 4–7 combined optimization processes, 7-process has the minimums of Sh and Sa, and also the minimums of all the 1–7 optimization processes, as shown in Figure 6. So, C of 7-process is the minimum. Thus, P of 7-process is the maximum in Figure 7.

3.2.3. Cost Reductions and Influence Factors of the Optimization System

In order to know the cost reductions, compared with the forward-feed benchmark system or the parallel-feed benchmark system, of the parallel-feed optimization system with 7-process, the costs of the three systems are shown in Table 3. In Table 3, investment cost is the total equipment investment of flue heat exchanger, evaporators, preheaters, and condenser; annual heat source cost is the flue gas heat consumption cost; and annual depreciation cost is the total depreciation cost of flue heat exchanger, evaporators, preheaters, and condenser. Compared with the forward-feed benchmark system, investment cost, annual heat source cost, and annual depreciation cost of the parallel-feed optimization system with 7-process are about 22%, 21%, and 21% lower, respectively. Compared with the parallel-feed benchmark system, investment cost, annual heat source cost, and annual depreciation cost of the parallel-feed optimization system with 7-process are about 8%, 9%, and 8% lower, respectively.
It is known from Equation (4) that annual utilization hours, steam price, ND steel price, and 304 stainless steel price all affect the annual profit by changing the annual cost, and magnesium sulfate concentrate price affects the annual profit by changing the annual sale. Figure 7 is the result calculated according to the annual utilization hours of 4000, steam price of 55 ¥/t, ND steel price of 4700 ¥/t, 304 stainless steel price of 3600 ¥/t, and magnesium sulfate concentrate price of 116.35 ¥/t. Take the above factors as the benchmark value 1, and see Figure 8 for the influence of each factor change on the annual profit of the parallel-feed optimization system with 7-process at inlet flue gas temperature of 120 °C and system effects of 4. In Figure 8, AUH is annual utilization hours, SP is steam price, NDSP is ND steel price, 304SSP is 304 stainless steel price, and MSCP is magnesium sulfate concentrate price. The left axis is the ordinate of AUH, SP, NDSP, and 304SSP, and the right axis is the ordinate of MSCP.
Figure 8 shows that magnesium sulfate concentrate price, which affects the annual profit by changing the annual sale, has a far greater impact on the annual profit than annual utilization hours, steam price, ND steel price, and 304 stainless steel price, which affect the annual profit by changing the annual cost. Magnesium sulfate concentrate price directly determines the annual sale, which accounts for a large part of the annual profit, so its change has a far greater impact on the annual profit. Among annual utilization hours, steam price, ND steel price, and 304 stainless steel price, annual utilization hours and steam price have a bigger impact on the annual profit. Annual utilization hours and steam price directly change the annual heat source cost, which accounts for a large part of the annual cost, while ND steel price and 304 stainless steel price directly change the annual depreciation cost, which accounts for a small part of the annual cost. So, annual utilization hours and steam price have a bigger impact on the annual profit than ND steel price and 304 stainless steel price.

3.3. Comparison of Parallel-Feed Optimization System with 7-Process of 300, 600, and 1000 MW Power Plant

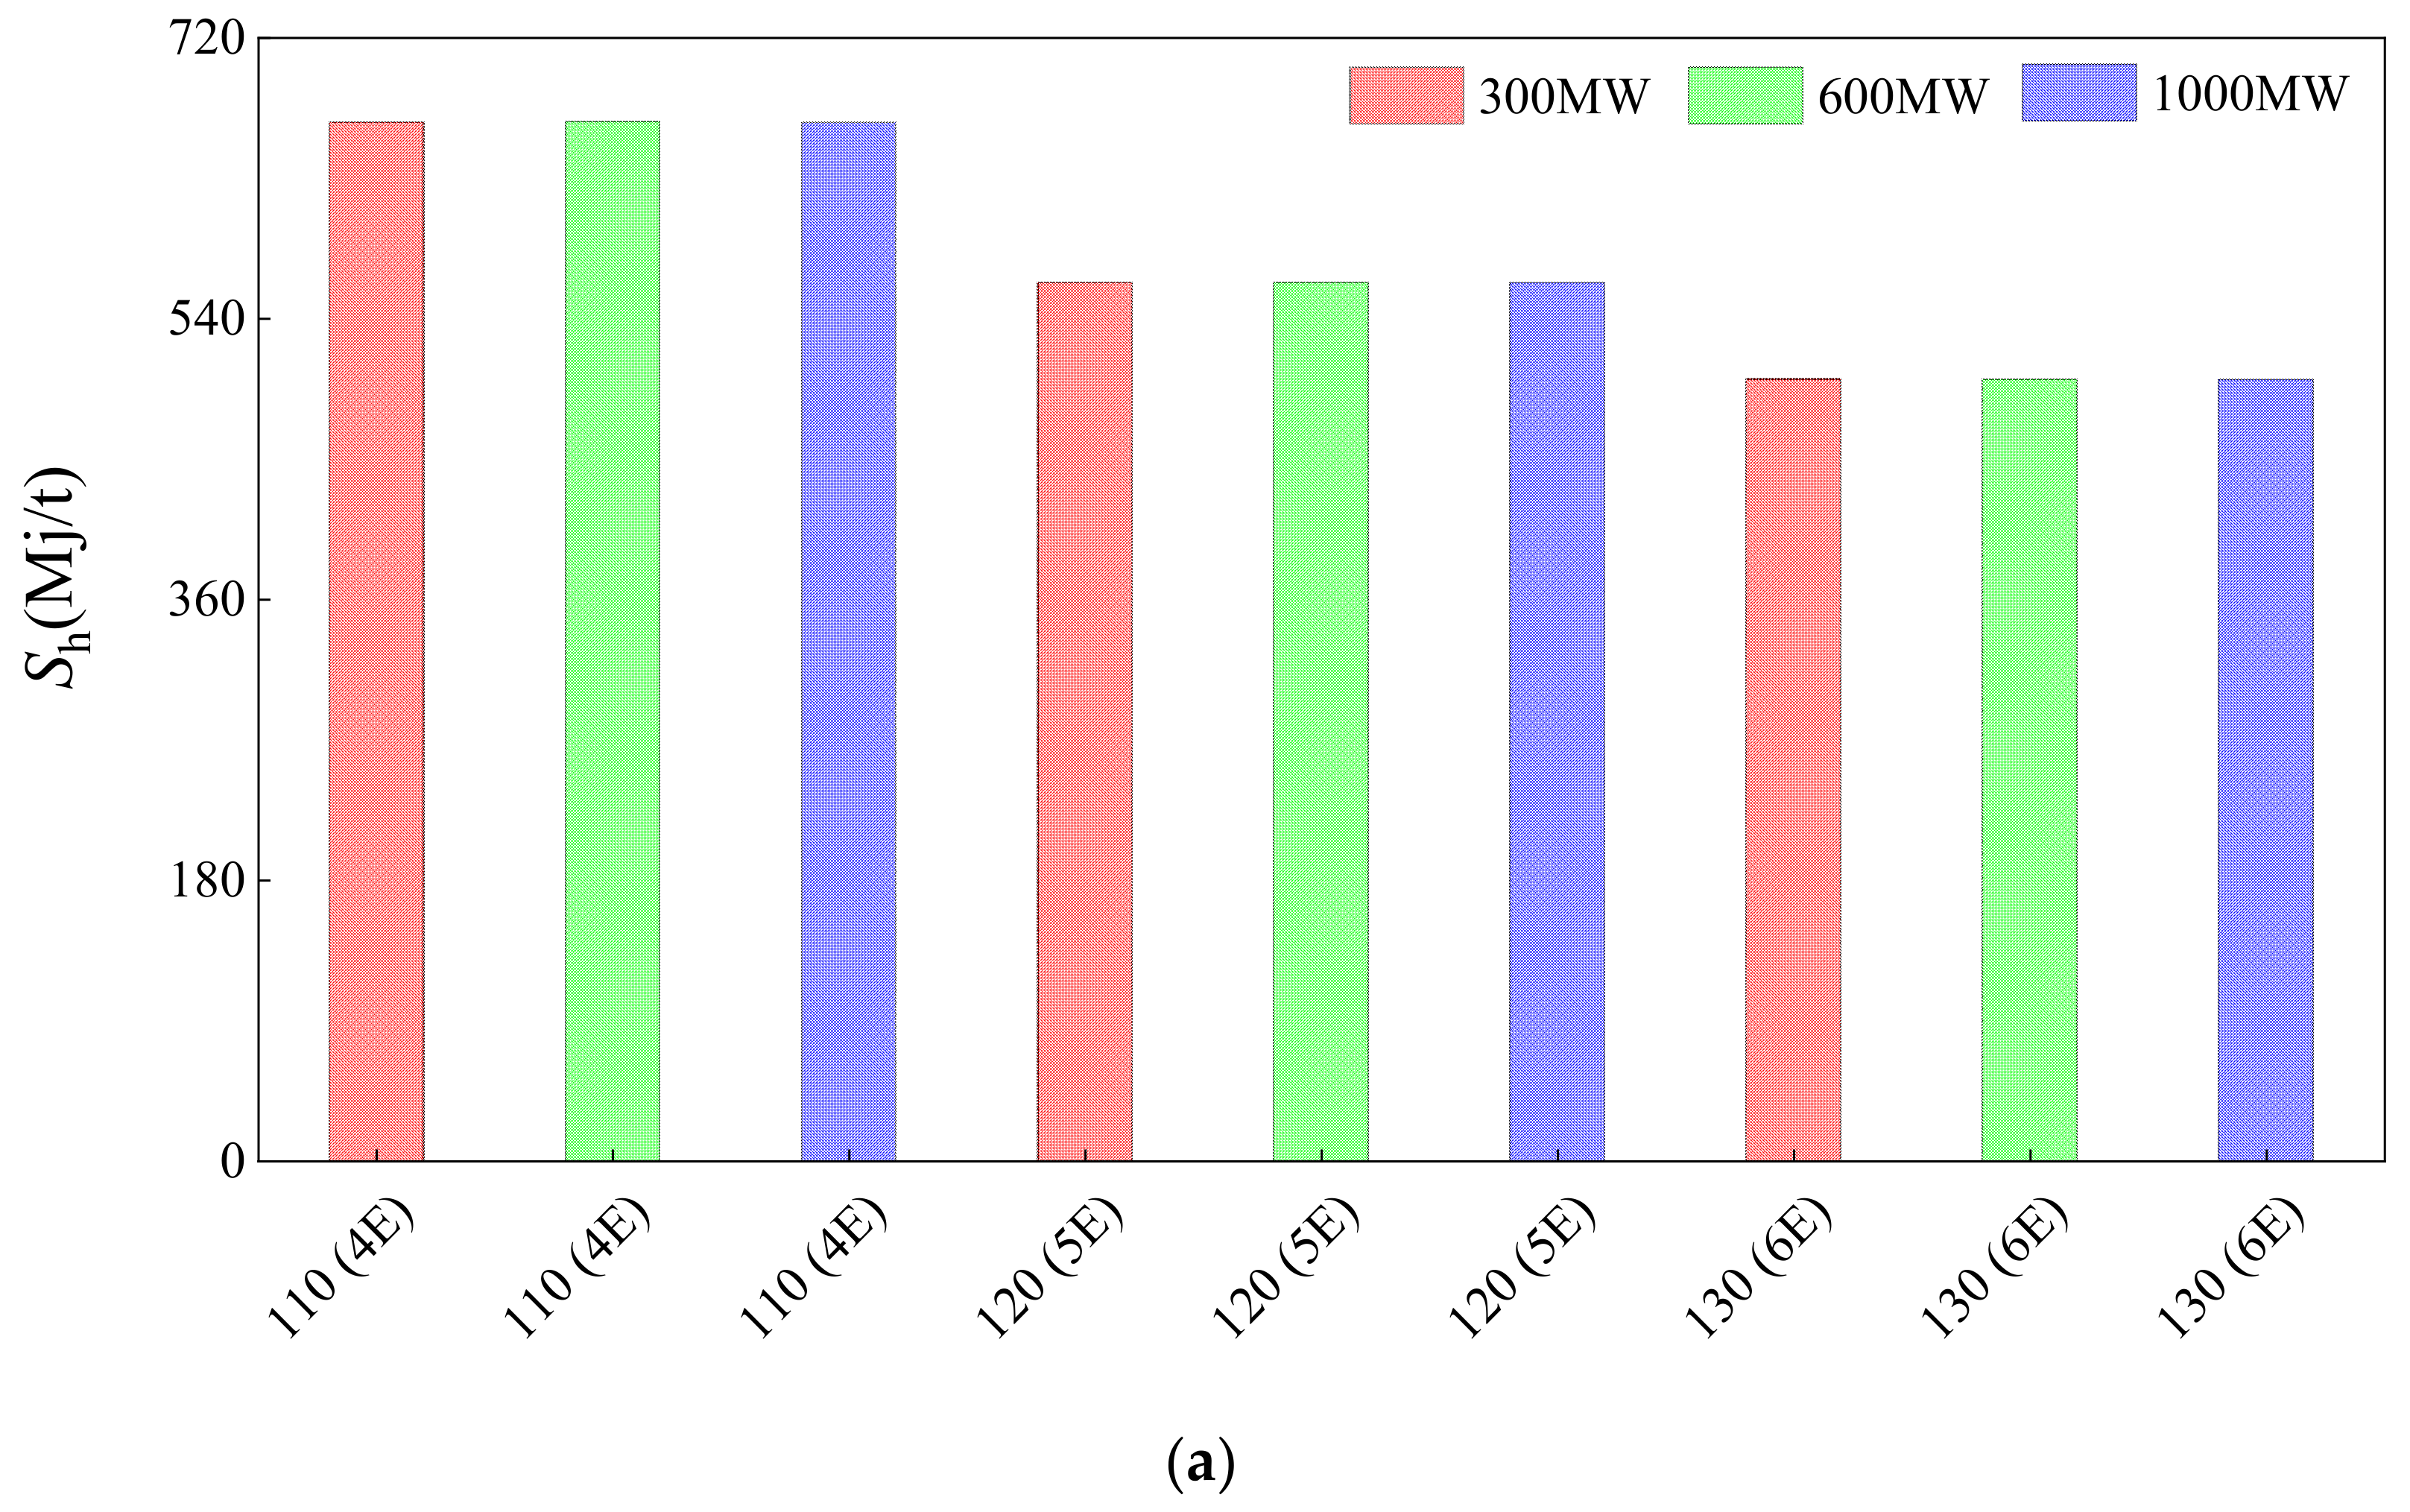
For 300, 600, and 1000 MW power plant, the parallel-feed optimization system with 7-process, which has the best thermal performance and economic performance, was selected to make a comparison. It can be seen from Figure 6 and Figure 7 that the optimal effects number of the parallel-feed optimization system with 7-process is 4 when the inlet flue gas temperature is 110 °C, 5 when the inlet flue gas temperature is 120°C, and 6 when the inlet flue gas temperature is 130 °C. So, 4, 5, and 6 were chosen as system effects numbers when inlet flue gas temperature is 110, 120, and 130 °C.
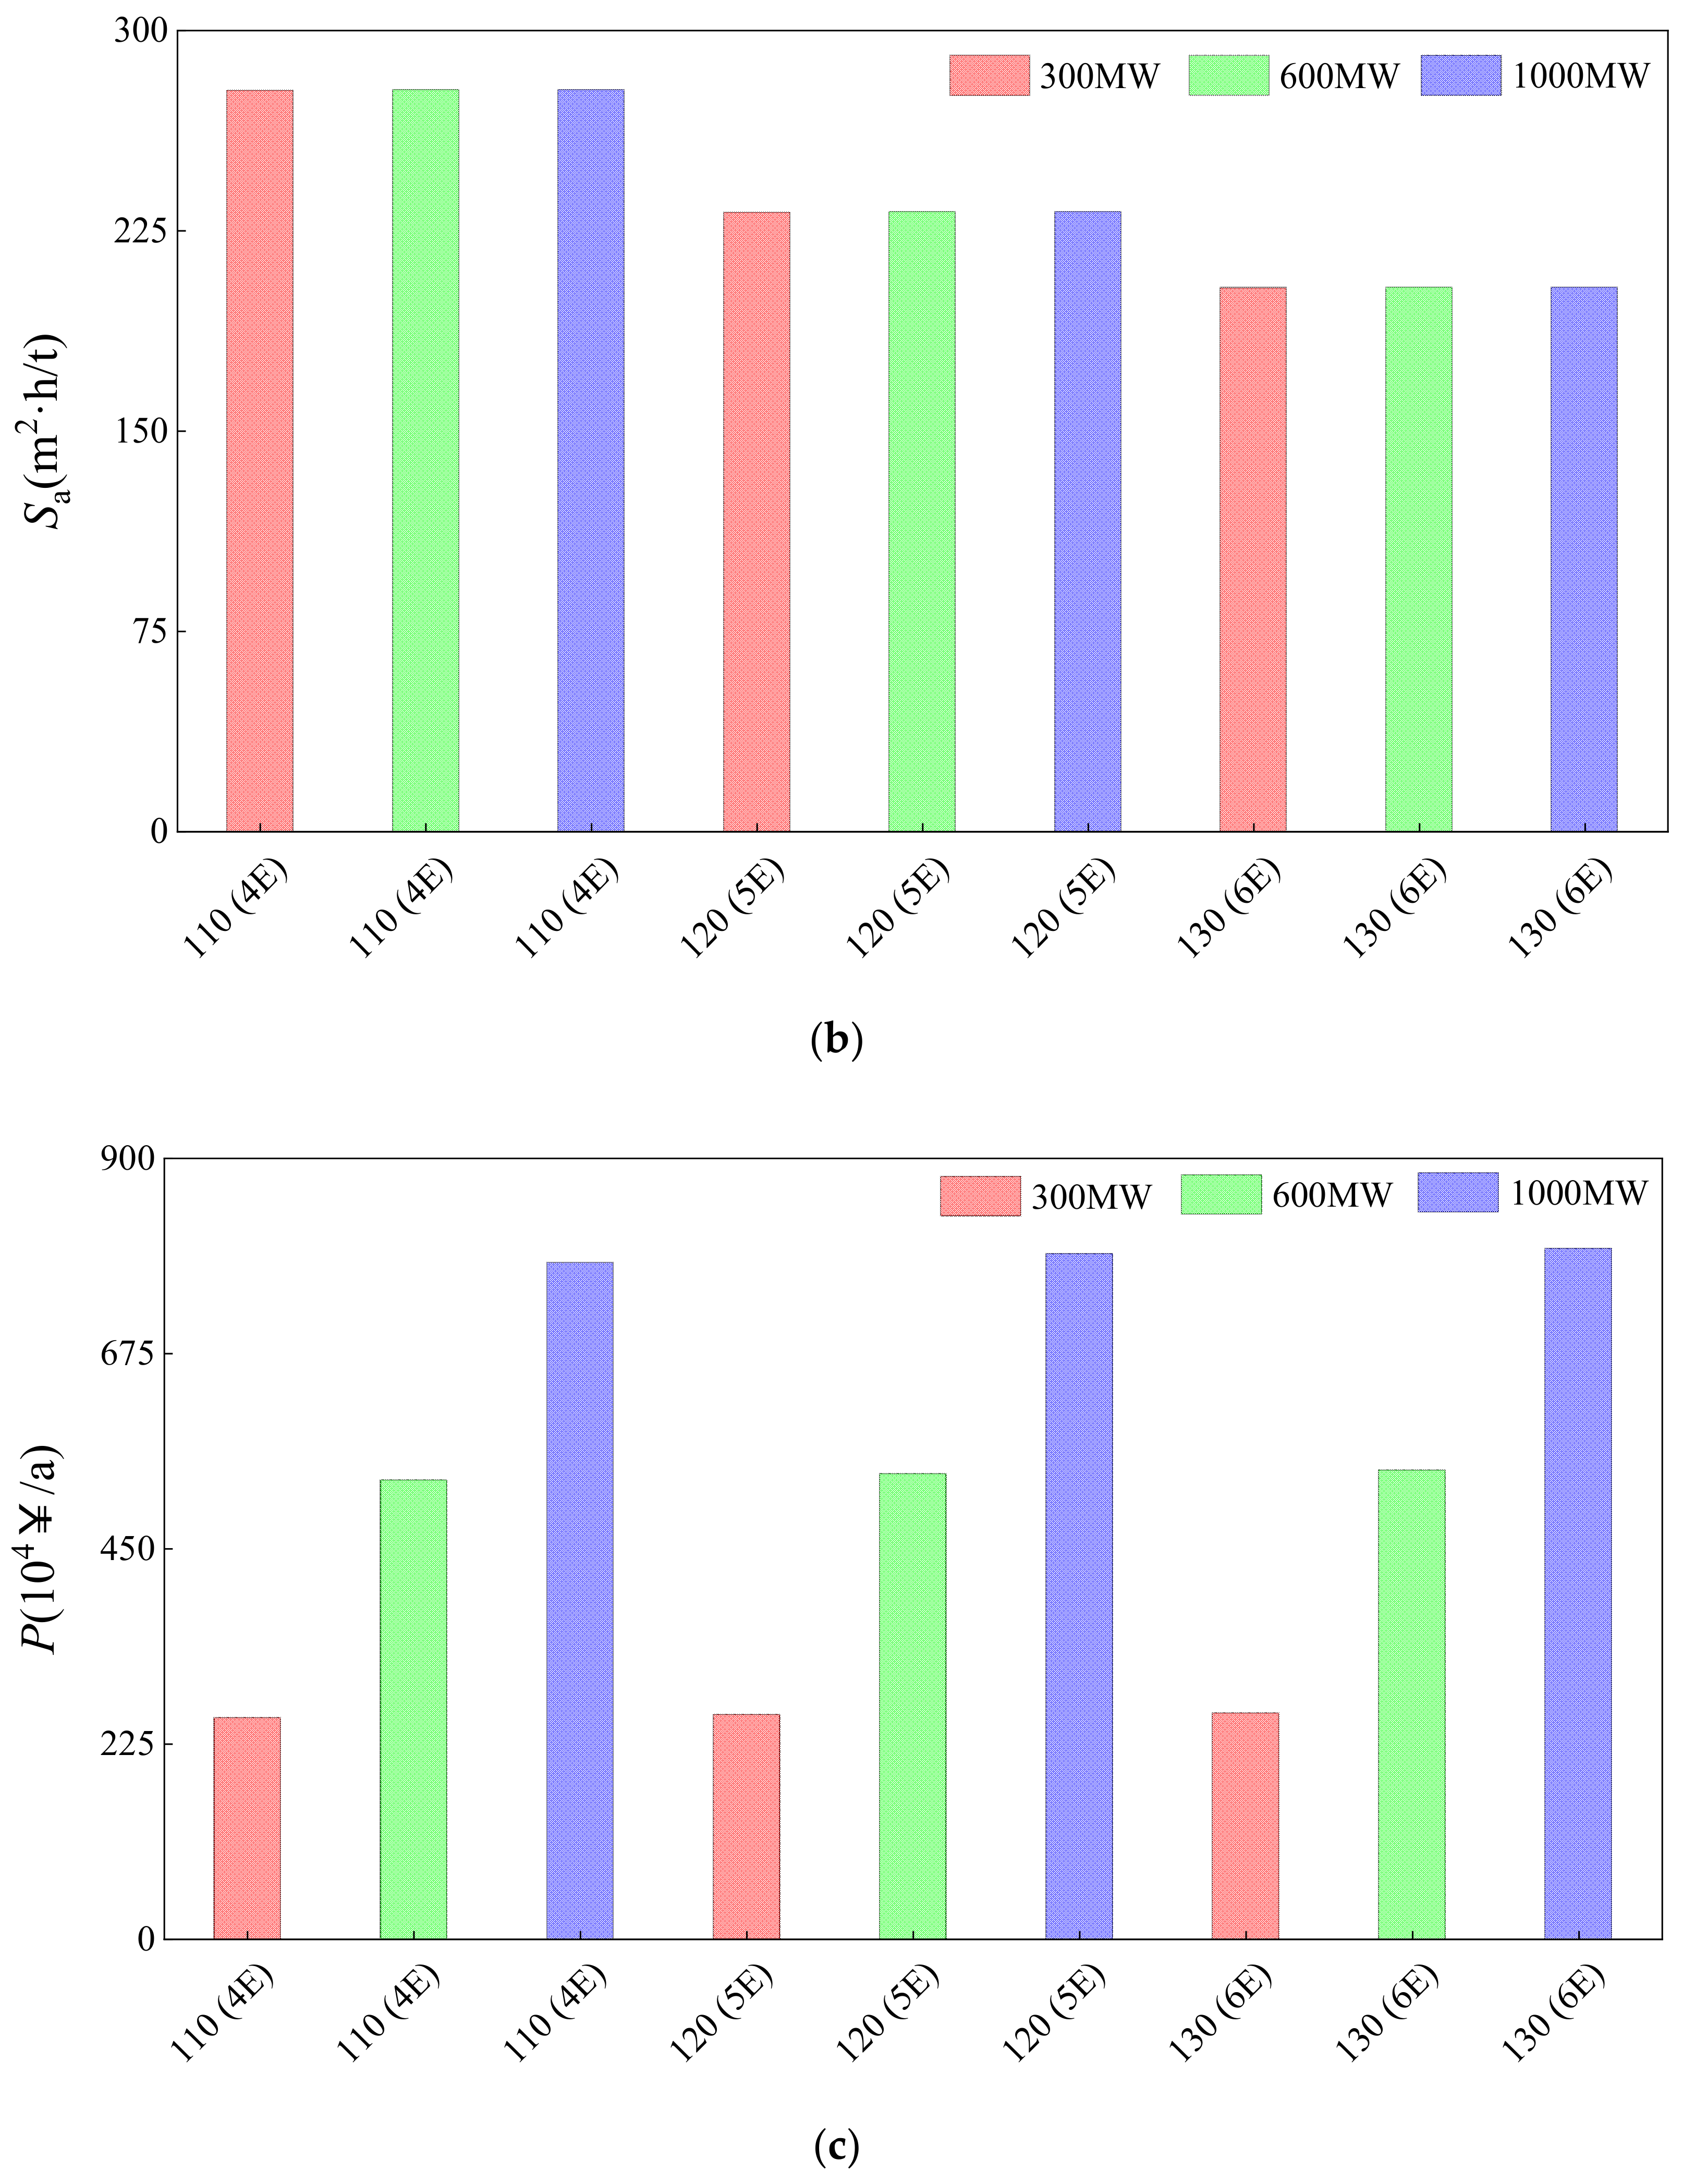
The comparison for 300, 600, and 1000 MW power plants includes both thermal performance and economic performance, as shown in Figure 9. In the horizontal scale mark label of Figure 9, the number before the bracket represents the inlet flue gas temperature of the concentration system, and the character in the bracket represents the effects number of the concentration system. For example, 110 (4E) represents that the inlet flue gas temperature is 110 °C and the effects number is 4.
From Figure 9a,b, under the same inlet flue gas temperature and system effects number, the change of MW from 300 to 1000 hardly changes the specific flue gas heat and specific heat transfer area. Specific flue gas heat and specific heat transfer area are both thermal performances; the change of MW actually affects the flow rate of inlet magnesium sulfate solution of the concentration system. So, total flue gas heat and total heat transfer area change; but specific flue gas heat and specific heat transfer area hardly change. From Figure 9c, under the same inlet flue gas temperature and system effects number, the increase of MW from 300 to 1000 makes annual profit increase greatly. Annual profit depends on annual sale and annual cost. When the MW increases, annual sale and annual cost both increase, and the relative increase of annual sale is slightly larger than that of annual cost. But the annual sale is much larger than the annual cost in the 300 MW power plant, so the absolute increase of annual sale is much larger than that of annual cost as the MW increases. Annual profit increases greatly as the MW increases.

4. Conclusions

This paper proposes the wastewater treatment scheme of selling magnesium sulfate concentrate, and makes thermal and economic analysis for different concentration systems in the scheme, which adopt the combination technology of multi-effect and flue gas waste heat utilization for better performance. Some conclusions can be made, as follows.
(1)
In a 300 MW power plant, the concentration benchmark process should adopt parallel feed. Compared with the forward-feed benchmark system, the parallel-feed benchmark system reduces about 15%, 20%, and 13% in specific flue gas heat, specific heat transfer area, and annual cost, respectively.
(2)
In a 300 MW power plant, 7-process should be adopted for the optimization of the concentration benchmark process. Compared with the parallel-feed benchmark system, the parallel-feed optimization system with 7-process reduces about 9%, 4%, and 9% in specific flue gas heat, specific heat transfer area, and annual cost, respectively.
(3)
Among the five factors influencing the annual profit of parallel-feed optimization system with 7-process of 300 MW power plant, the influence of magnesium sulfate concentrate price was the largest, annual utilization hours and steam price were the second, and ND steel price and 304 stainless steel price were the least.
(4)
The scheme of selling magnesium sulfate concentrate has good benefits in coal-fired power plants with different power generation capacities. The annual profit of a 300, 600, and 1000 MW power plant is about 2.58 million, 5.35 million, and 7.89 million CNY, respectively.

Author Contributions

Conceptualization: M.Y. and Y.S.; software: M.Y.; validation: M.Y.; formal analysis: M.Y. and Y.S.; investigation: M.Y.; resources: Y.S.; data curation: M.Y.; writing—original draft preparation: M.Y.; writing—review and editing: Y.S.; supervision: Y.S. All authors have read and agreed to the published version of the manuscript.

Funding

This research was funded by Natural Science Foundation of Shandong Province [ZR201709180049], Key Technology Research and Development Program of Shandong [2019GSF109023] and International Clean Energy Talent Program [201904100014].

Conflicts of Interest

The authors declare no conflict of interest.

Nomenclature

AcHeat transfer area of condenser, m2
AeTotal heat transfer area of all evaporators, m2
AfHeat transfer area of flue heat exchanger, m2
AiHeat transfer area of the ith effect, m2
AjHeat transfer area of the jth preheater, m2
ApTotal heat transfer area of all preheaters, m2
CAnnual cost of concentration system, 104 ¥/a
CcAnnual cost of cooling crystallization process, 104 ¥/a
CdAnnual depreciation cost of concentration system, 104 ¥/a.
ChAnnual heat source cost of concentration system, 104 ¥/a
GcCoal consumption of a 300 MW power generation unit, t/h
GinInlet magnesium sulfate solution of concentration system, t/h
Gout, MgSO4Pure MgSO4 of concentration system outlet, t/h
GsCirculating steam generated by flue heat exchanger, t/h
IcInvestment cost of condenser, 104 ¥
IeInvestment cost of evaporators, 104 ¥
IfInvestment cost of flue heat exchanger, 104 ¥
IpInvestment cost of preheats, 104 ¥
iThe sequence number of evaporators
jThe sequence number of preheaters
kThe number of preheaters
MMgSO4Molar mass of magnesium sulfate, g/mol
MMgSO4·7H2OMolar mass of magnesium sulfate heptahydrate, g/mol
MSMolar mass of sulfur, g/mol
MwEvaporation water of concentration system, t/h
mFlue heat exchanger weight, t
nThe effects number of evaporators
PAnnual profit of concentration system, 104 ¥/a
P3Unit price of 304 stainless steel, 104 ¥/t
PMgSO4·7H2OUnit price of magnesium sulfate heptahydrate, 104 ¥/t
PNUnit price of ND steel, 104¥/t
PsSteam price, 104¥/t
QinInput flue gas heat of concentration system, kW
SAnnual sale of concentration system, 104 ¥/a
SaSpecific heat transfer area, m2·h/t
SarSulfur content of coal on received basis, %
ShSpecific flue gas heat, MJ/t
sMgSO4·7H2OCost factor magnesium sulfate heptahydrate, %
WMgSO4Mass fraction of magnesium sulfate in the solution, %
YYield of magnesium sulfate heptahydrate, %
ZiInvestment increase coefficient of evaporator
αEquipment investment cost coefficient of flue heat exchanger
βcThe condenser correction coefficient
βjThe jth preheater correction coefficient
γcAnnual depreciation rate of condenser, a−1
γeAnnual depreciation rate of evaporators, a−1
γfAnnual depreciation rate of flue heat exchanger, a−1
γpAnnual depreciation rate of preheaters, a−1
ηbCombustion efficiency of boiler, %
ηdFlue gas desulfurization efficiency, %
θAnnual converted full load utilization hours of power plant, h/a

References

  1. Cristóbal, J.; Guillén-Gosálbez, G.; Jiménez, L.; Irabien, A. Optimization of global and local pollution control in electricity production from coal burning. Appl. Energy 2012, 92, 369–378. [Google Scholar] [CrossRef]
  2. Jiang, B.; Xie, Y.; Xia, D.; Liu, X. A potential source for PM2.5: Analysis of fine particle generation mechanism in Wet Flue Gas Desulfurization System by modeling drying and breakage of slurry droplet. Environ. Pollut. 2019, 246, 249–256. [Google Scholar] [CrossRef] [PubMed]
  3. Shi, W.; Lin, C.; Chen, W.; Hong, J.; Chang, J.; Dong, Y.; Zhang, Y. Environmental effect of current desulfurization technology on fly dust emission in China. Renew. Sust. Energ. Rev. 2017, 72, 1–9. [Google Scholar] [CrossRef]
  4. Ma, S.; Bie, X.; Sun, Y.; Chen, K.; Zhu, Z. Present research situation and prospect of magnesium desulfurization in coal-fired power plant. Chem. Ind. Eng. Prog. 2018, 37, 3609–3617. [Google Scholar]
  5. Ma, Y.; Nie, Q.; Xiao, R.; Hu, W.; Han, B.; Polaczyk, P.A.; Huang, B. Experimental investigation of utilizing waste flue gas desulfurized gypsum as backfill materials. Constr. Build. Mater. 2020, 245, 118393. [Google Scholar] [CrossRef]
  6. Koralegedara, N.H.; Pinto, P.X.; Dionysiou, D.D.; Al-Abed, S.R. Recent advances in flue gas desulfurization gypsum processes and applications—A review. J. Environ. Manag. 2019, 251, 109572. [Google Scholar] [CrossRef]
  7. Ren, C.; Wang, W.; Mao, Y.; Yuan, X.; Song, Z.; Sun, J.; Zhao, X. Comparative life cycle assessment of sulfoaluminate clinker production derived from industrial solid wastes and conventional raw materials. J. Clean Prod. 2017, 167, 1314–1324. [Google Scholar] [CrossRef]
  8. Wu, S.; Wang, W.; Ren, C.; Yao, X.; Yao, Y.; Zhang, Q.; Li, Z. Calcination of calcium sulphoaluminate cement using flue gas desulfurization gypsum as whole calcium oxide source. Constr. Build. Mater. 2019, 228, 116676. [Google Scholar] [CrossRef]
  9. Wang, C.; Li, Y.; Liu, Y. Investigation of water-energy-emission nexus of air pollution control of the coal-fired power industry: A case study of Beijing-Tianjin-Hebei region, China. Energy Policy 2018, 115, 291–301. [Google Scholar] [CrossRef]
  10. Zhu, L.; Men, Y.; Kuang, Z.; Tian, B.; Yu, C.; Ye, F. Practice of ultra-low emission of 350 MW unit by magnesium desulphurization process. Electr. Power Technol. Environ. Prot. 2019, 35, 30–32. [Google Scholar]
  11. Feng, Y.; Liao, S.; Li, H.; Wu, H.; Wang, Y.; Wang, J.; Zhang, G. Research status of magnesium desulphurization and diversified utilization of desulfurization products. Inorg. Chem. Ind. 2019, 51, 1–6. [Google Scholar]
  12. Shi, L.; Pang, L.; Zhao, L.; Wu, X.; Li, D. The current treatment situation of magnesium sulfite from the magnesium FGD. Environ. Eng. 2014, 32, 533–536. [Google Scholar]
  13. Yan, L.; Lu, X.; Guo, Q.; Wang, Q.; Ji, X. Research on the thermal decomposition and kinetics of byproducts from MgO wet flue gas desulfurization. Adv. Powder Technol. 2014, 25, 1709–1714. [Google Scholar] [CrossRef]
  14. Li, M.; Guo, Q.; Xing, L.; Yang, L.; Qi, T.; Xu, P.; Zhang, S.; Wang, L. Cobalt-based metal-organic frameworks promoting magnesium sulfite oxidation with ultrahigh catalytic activity and stability. J. Colloid Interf. Sci. 2020, 559, 88–95. [Google Scholar] [CrossRef]
  15. Yang, J.; Li, L.; He, W.; Song, B.; Wang, Z. The phase diagram study of FGD by magnesium oxide scrubbing byproduct system. Environ. Eng. 2013, 31, 368–370. [Google Scholar]
  16. Ma, S.; Chen, J.; Liu, N.; Wan, Z.; Liang, J.; Yue, P.; Zhang, J.; Liang, W. Experimental study on the concentration of FGD wastewater using low-temperature flue gas. J. Chin. Soc. Power Eng. 2020, 40, 51–57. [Google Scholar]
  17. Shao, G.; Liu, Y.; Yong, J. Experimental study on near zero discharge of desulphurization wastewater treated with nanofiltration membrane. Membr. Sci. Technol. 2019, 39, 124–128. [Google Scholar]
  18. Jin, Y.; Gao, N.; Zhu, T. Techno-economic analysis on a new conceptual design of waste heat recovery for boiler exhaust flue gas of coal-fired power plants. Energy Convers. Manag. 2019, 200, 112097. [Google Scholar] [CrossRef]
  19. Stevanovic, V.D.; Petrovic, M.M.; Wala, T.; Milivojevic, S.; Ilic, M.; Muszynski, S. Efficiency and power upgrade at the aged lignite-fired power plant by flue gas waste heat utilization: High pressure versus low pressure economizer installation. Energy 2019, 187, 115980. [Google Scholar] [CrossRef]
  20. Xu, X.; Wu, L.; Ju, G. Structural optimization and experimental study of plate low pressure economizer with intermediate passage. Appl. Therm. Eng. 2019, 151, 328–334. [Google Scholar] [CrossRef]
  21. Xue, Y.; Du, X.; Ge, Z.; Yang, L. Study on multi-effect distillation of seawater with low-grade heat utilization of thermal power generating unit. Appl. Therm. Eng. 2018, 141, 589–599. [Google Scholar] [CrossRef]
  22. Liponi, A.; Tempesti, C.; Baccioli, A.; Ferrari, L. Small-Scale Desalination Plant Driven by Solar Energy for Isolated Communities. Energies 2020, 13, 3864. [Google Scholar] [CrossRef]
  23. Papapetrou, M.; Kosmadakis, G.; Giacalone, F.; Ortega-Delgado, B.; Cipollina, A.; Tamburini, A.; Micale, G. Evaluation of the Economic and Environmental Performance of Low-Temperature Heat to Power Conversion using a Reverse Electrodialysis—Multi-Effect Distillation System. Energies 2019, 12, 3206. [Google Scholar] [CrossRef] [Green Version]
  24. Deymi-Dashtebayaz, M.; Tayyeban, E. Multi objective optimization of using the surplus low pressure steam from natural gas refinery in the thermal desalination process. J. Clean. Prod. 2019, 238, 117945. [Google Scholar] [CrossRef]
  25. Ma, S.; Chai, J.; Chen, G.; Yu, W.; Zhu, S. Research on desulfurization wastewater evaporation: Present and future perspectives. Renew. Sustain. Energy Rev. 2016, 58, 1143–1151. [Google Scholar]
  26. Hao, J. Study on Simulation and Optimization Design of 60,000 t/a NaOH Multi Effect Evaporation System. Master’s Thesis, Southwest Petroleum University, Chengdu, China, 2014. [Google Scholar]
  27. Mu, G. Design and Control of High Salt Water Low-Temperature Multi-Effect Distillation. Master’s Thesis, China University of Petroleum (East China), Qingdao, China, 2016. [Google Scholar]
  28. Ng, K.C.; Thu, K.; Oh, S.J.; Ang, L.; Shahzad, M.W.; Ismail, A.B. Recent developments in thermally-driven seawater desalination: Energy efficiency improvement by hybridization of the MED and AD cycles. Desalination 2015, 356, 255–270. [Google Scholar] [CrossRef]
  29. Castro, M.; Esparcia, E.A., Jr.; Ocon, J.D. A Comparative Techno-Economic Analysis of Different Desalination Technologies in Off-Grid Islands†. Energies 2020, 13, 2261. [Google Scholar] [CrossRef]
  30. Zhao, D.; Xue, J.; Li, S.; Sun, H.; Zhang, Q. Theoretical analyses of thermal and economical aspects of multi-effect distillation desalination dealing with high-salinity wastewater. Desalination 2011, 273, 292–298. [Google Scholar] [CrossRef]
  31. Ullah, I.; Rasul, M.G. Recent Developments in Solar Thermal Desalination Technologies: A Review. Energies 2019, 12, 119. [Google Scholar] [CrossRef] [Green Version]
  32. Druetta, P.; Aguirre, P.; Mussati, S. Minimizing the total cost of multi effect evaporation systems for seawater desalination. Desalination 2014, 344, 431–445. [Google Scholar] [CrossRef]
  33. Yılmaz, I.H.; Söylemez, M.S. Design and computer simulation on multi-effect evaporation seawater desalination system using hybrid renewable energy sources in Turkey. Desalination 2012, 291, 23–40. [Google Scholar] [CrossRef]
  34. Zhou, S.; Gong, L.; Liu, X.; Shen, S. Mathematical modeling and performance analysis for multi-effect evaporation/multi-effect evaporation with thermal vapor compression desalination system. Appl. Therm. Eng. 2019, 159, 113759. [Google Scholar] [CrossRef]
  35. Darwish, M.A.; Alsairafi, A. Technical comparison between TVC/MEB and MSF. Desalination 2004, 170, 223–239. [Google Scholar] [CrossRef]
  36. Xu, Y.; Zhang, L.; Wang, X.; Cong, Y. Magnesium FGD technology in engineering and operation of a number of questions. Guangdong Chem. Ind. 2009, 36, 121–123. [Google Scholar]
  37. Niu, H. Study on the Process of Preparation Magnesium Sulfate by Medium Transformation and Low Temperature Freezing Crystation. Master’s Thesis, Graduate School of Chinese Academy of Sciences (Qinghai Salt Lake Research Institute), Xining, China, 2016. [Google Scholar]
  38. Xiao, C. Comparative analysis of operation cost of limestone gypsum and magnesia desulfurization processes. Energy Conserv. 2019, 38, 161–163. [Google Scholar]
  39. Zhu, T. Research on Technologies of Desulphurization and DeNOx by Magenesium FGD and Resourcing of Byproduct for Sintering Flue Gas. Ph.D. Thesis, Tsinghua University, Beijing, China, 2017. [Google Scholar]
  40. Lukowicz, H.; Kochaniewicz, A. Analysis of the use of waste heat obtained from coal-fired units in Organic Rankine Cycles and for brown coal drying. Energy 2012, 45, 203–212. [Google Scholar] [CrossRef]
  41. Wang, C.; He, B.; Yan, L.; Pei, X.; Chen, S. Thermodynamic analysis of a low-pressure economizer based waste heat recovery system for a coal-fired power plant. Energy 2014, 65, 80–90. [Google Scholar] [CrossRef]
  42. Ding, W. Thermo Economic Analysis of Steam System & Energy Medium Cost Assessment for Iron and Steel Plant. Master’s Thesis, Huazhong University of Science and Technology, Wuhan, China, 2015. [Google Scholar]
  43. Yang, K. Simulation, Analysis and Upgrading of Sugar Multi-effects Evaporation. Master’s Thesis, South China University of Technology, Guangzhou, China, 2015. [Google Scholar]
  44. Wei, W.; Sun, F.; Shi, Y.; Ma, L. Theoretical prediction of acid dew point and safe operating temperature of heat exchangers for coal-fired power plants. Appl. Therm. Eng. 2017, 123, 782–790. [Google Scholar] [CrossRef]
Figure 1. The process from magnesium desulfurization wastewater to magnesium sulfate concentrate.
Energies 13 05384 g001
Figure 2. Multi-effect concentration benchmark system: (a) forward-feed configuration; and (b) parallel-feed configuration.
Energies 13 05384 g002
Figure 3. Different optimization processes of multi-effect parallel-feed concentration system: (a) optimizing process; and (b) combined optimization process. In Figure 3a, the added equipment, compared with the benchmark system, is coiled with a red circle. Extracting steam preheating is extracting a part of the secondary steam generated in the evaporator to preheat the feed entering the evaporator. Condensate flash is where the condensate from the previous effect is flashed to generate additional secondary steam for the next effect. Concentrate flash is where the concentrate from the previous effect is flashed to generate additional secondary steam for the next effect. In Figure 3b, the added equipment, compared with the benchmark system, is coiled with a red circle. In addition, 4, 5, 6, and 7 are composed of 1, 2, and 3 from Figure 2a in different ways.
Energies 13 05384 g003
Figure 4. Thermal performance indexes of benchmark system: (a) specific flue gas heat; and (b) specific heat transfer area.
Energies 13 05384 g004
Figure 5. Economic index of benchmark system.
Energies 13 05384 g005
Figure 6. Thermal performance indexes of parallel-feed systems with benchmark or different optimized processes: (a) specific flue gas heat; and (b) specific heat transfer area.
Energies 13 05384 g006
Figure 7. Economic index of parallel-feed system with benchmark or different optimized processes.
Energies 13 05384 g007
Figure 8. Influence of the change of each factor on the annual profit.
Energies 13 05384 g008
Figure 9. Comparison of the parallel-feed optimization system with 7-process for 300, 600, and 1000 MW power plant: (a) specific flue gas heat; (b) specific heat transfer area; and (c) annual profit.
Energies 13 05384 g009aEnergies 13 05384 g009b
Table 1. Ebsilon model comparison against ALBA Plant [35].
ParameterALBA Plant Operation DataEbsilon Model Simulation DataRelative Error
Number of effects44– –
Motive steam pressure, MPa2.12.1– –
Motive steam temperature, °C224224– –
Motive steam flow, t/h59.9859.98– –
Top brine temperature, °C6363– –
Minimum brine temperature, °C4848– –
Feed flow, t/h1400.41400.4– –
Evaporation water, t/h455.04454.93<1%
Specific heat consumption, MJ/t372.43372.52<1%
Specific heat transfer area, m2·h/t61.3961.54<1%
Table 2. Basic data at full load of 300 MW unit.
Gin/(t/h)Gc/(t/h)ηb/%Sar/%ηd/%MS/(g/mol)MMgSO4/(g/mol)WMgSO4/%
8.70118.39990.49973212024
Table 3. Costs of different system configurations with inlet flue gas temperature at 120 °C.
System ConfigurationEffects NumberInvestment Cost (104 ¥)Annual Heat Source Cost
(104 ¥)
Annual Depreciation Cost (104 ¥)
Forward-feed benchmark system3111.4924.0211.05
492.4019.959.24
582.5717.518.26
Parallel-feed benchmark system398.6121.719.86
478.9717.367.9
567.9414.786.79
Parallel-feed optimization system with 7-process391.7220.159.17
472.4215.737.24
561.7113.116.17
Publisher’s Note: MDPI stays neutral with regard to jurisdictional claims in published maps and institutional affiliations.