Article

A Comparative Analysis of Two Cable Yarder Technologies Performing Thinning Operations on a 33 Year Old Pine Plantation: A Potential Source of Wood for Energy

1
Department of Agricultural and Forest Sciences, University of Tuscia, 01100 Viterbo, Italy
2
Department of Forestry, Khalkhal Branch, Islamic Azad University, Khalkhal 56817-31367, Iran
*
Author to whom correspondence should be addressed.
Energies 2020, 13(20), 5376; https://doi.org/10.3390/en13205376
Submission received: 24 July 2020 / Revised: 23 September 2020 / Accepted: 14 October 2020 / Published: 15 October 2020

Abstract

:
In central Italy, there are extensive European black pine (Pinus nigra Arn.) plantations which range from 30 to 60 years of age and where no thinning operations have been made. The main purpose of this study was to provide a comparative analysis of two cable yarder technologies (Maxwald, mobile pulley carriage and Savall, semi-automatic carriage), in terms of fuelwood production and cost, from the first thinning of a 33 year old plantation in slope areas of these plantations. The results showed that fuelwood production was cost-effective in both systems (Savall by 15.1 and Maxwald by 14.8 € m−3), although the productivity of the Savall system was higher than the Maxwald system (6.1 vs. 5.7 m3 h−1). The respect amounts of productivity have the potential to increase by 27% for the Savall yarder and 25% for the Maxwald yarder upon condition that the delay times are reduced to minimum level by proper training of workers, by a better organization, and planning of operations. The total effective CO2 emission by the Savall yarder was lower than the Maxwald yarder (1735 vs. 1772 g m−3). A sustainable production of fuelwood that is economically advantageous and environmentally sound in these plantations can be realized through an appropriate mechanization level and constant interaction with the silvicultural planning. This must be completed with adequate and efficient worker training.

1. Introduction

Between the various silvicultural treatments, thinning is one of the most important, generally consisting of the removal of some trees in order to decrease the competition [1,2] and increase the tree dimensions. In fire-prone stands, thinning represents a valid system to prevent surface fires from turning into crown fires [3]. Generally, thinning should be done early to be efficacious [4,5], but early thinning provides low quantities and often low commercial value timber, making it difficult to generate revenue [6,7]. This leads to serious problems, especially in coniferous natural or artificial stands, with real risk of forest degradation and instability [7,8,9]. Recently, thinning has been reconsidered in forest management thanks to modern forest mechanization, making this treatment less expensive. Futhermore, logging residues for energy purposes bring net income gains. High levels of mechanization require important investments and accurate forest planning [10], so that it is often convenient to carry out late thinning and final harvesting [6,11]. The Full Tree System (FTS) system results in being even more valid to produce structural timber as the chipping operations of residuals can be performed directly at the landing site. Where the risk of fire is high, branch wood removal is an effective method of prevention. Forest logging companies need to make high mechanization investments to adopt FTS. For this reason, FTS is widely used in final cuts. In terms of safety within operational conditions, setting a proper cut-off threshold to the load mass may not be effective. The correct set up of the skyline and good maintenance play an important role in safety risk prevention, for example lubrication and control of corrosion [12].
With slope gradient greater than 30%, usual small-scale technologies offer winches, animal power, and gravity sliding [13]. In some cases, animals can still be competitive but only in particular conditions [14] and their use is hardly compatible with the lifestyle of industrialized countries [15]. The winch can produce good results for short distances [16], and gravity sliding requires a high labor input [17]. Terrestrial extraction systems could be 2–3 times cheaper than aerial systems [18]; nevertheless there might be at least two reasons to promote the cableways systems. Firstly, an additional timber production area can be made which is associated with inaccessible surfaces to terrestrial machinery. Secondly, due to the fact of the growing need to safeguard the environment [19,20]. For these reasons, it is important to optimize the efficiency of logging systems and minimize costs. To support wood and forestry entrepreneurship will be necessary to improve the productivity in the forestry-wood chain [21].
The most widespread extraction system in central Italy is the Short Wood System (SWS) which has been used in coppice, high forest conversion harvesting [22] and also in thinning although rarely. FTS extraction is rarely adopted, but it is rapidly spreading. Tractors equipped by forestry winches or tractors with forwarding bins and pack mules are used in the SWS. New methodologies for bunching and extraction can be competitive with traditional methods, but mainly if associated with different work systems, especially in the FTS. When the slope gradient exceeds 30%, cable yarding could offer much better solutions. Small cable yarding lines, for small-scale forestry, are now available on the market. Such yarders have been made only for small trees (or loads), and low costs allow them to be depreciated in thinning operations and firewood harvesting (small-scale forestry) [13]. To afford the use of a cable system, the harvesting volume should be more than 46 m3 day−1 [18]. Forest operations in thinning treatment can be carried out through various logging systems. In central Italy, the most frequent are short wood and whole tree systems [23]. In this specific study, the latter was applied, and two different cable yarder models were tested for extraction operations. After extraction, whole trees were chipped and the wood chips obtained were for energy production.
In recent decades the wood chips market for energy purposes reached an interesting level of profit [24]. Moreover, biomass is a substantial source for energy production and one of the most renewable and sustainable. The recent energy market, the fossil fuel prices, and the lower ecological and environmental footprint of the biomass in comparison to non-renewable fuels (RED II—EU Renewable Energy Directive 2018/2001/EU) are the factors that caused an important biomass consumption increase. [25]. Energy production from woody biomass is a multistage process, where only a careful phases assessment can lead to a complete sustainability following its three main pillars (economy, environment, and society). In this regard, one particular and sensitive issue in forest management is related to assessing the consequences of different forest operations, focusing on the economic, environmental, and social performance of each alternative before a treatment is eventually carried out. The different pillars of sustainability can be a valid guide for decision makers in their actions and to ensure a clear reduction of the impacts related to their decisions [26].
Residual trees/regeneration are less damaged by cable yarders in compression with ground-based logging systems; however, production costs by cable yarders are higher than ground-based logging systems. Also, level of soil disturbance following logging/thinning operation by cable yarders are less than ground-based systems. Soil disturbance can lead to soil erosion, and reduction of site productivity. However, this study has focused on the aspects most closely linked to the operation performance and the production management for energy purposes, leaving further surveys on the environmental impact for future papers. Due to high costs of cable yarder applying in logging/thinning operation, comparative analysis, in term of system productivity, are essential in choosing a suitable machine.
Focusing on the first thinning treatment in the slope area for chips fuelwood production, the main aims of the present study were: (i) to provide a comparative analysis of two cable yarder technologies; (ii) to determine the influence of a detailed assessment of logging methodologies to improve sustainable forest operations.

2. Materials and Methods

2.1. Study Area

This study was carried out in Central Italy, in an even-aged reforestation plot of European black pine (Pinus nigra A.), near the Orvieto municipality, Umbria region, 42°46′51.47″ N, 12°12′45.01″ E (Datum: WGS 84, Coordinate format D.M.S.). The study was carried out in a pine plantation that was thinned according to systematic and single tree selection cutting methods in 2010, from March to July. The working site was located within a regional nature park, where reduced impact logging (RIL) techniques are carefully applied. The climate is Mediterranean, characterized by hot, dry summers, mild, rainy autumns, and early springs, so this area could be classified as “humid” (on the basis of De Martonne index of 36). The mean annual precipitation is about 900 mm and the mean annual temperature is 14.8 °C. The highest monthly daily temperatures are in July or August (31 °C) and the lowest ones are in January (2 °C). The study area has a surface of about 40 ha, and it is composed of a 33 year old Pinus nigra plantation (Table 1). The planting pattern of European black pine trees was regular, with 3 × 2.5 square meters. The area is located at 500 m a.s.l., on a slope with an average gradient of 40–45% and over. The bumpy surface such as outcrops or emerging boulders covers about 20% of the total surface and represents an obstacle for ground-based extraction systems. The soil is composed of a mix of limestone and marls of Cretaceous-Paleocene-Eocene, and contains numerous nodules of chert, with an average texture, following the USDA classification, of clay-loam. The main hardwood species present as natural regeneration or old trees were Turkey oak (Quercus cerris L.), common maple (Acer campestre L.) and manna-ash (Fraxinus ornus L.).

2.2. Thinning Operations and Machines

Thinning was performed for the first time in the study area and consisted of every ten tree rows in the systematic felling of one row, and among the nine standing rows a selective thinning was carried out, with an intensity of 64.4% in number of trees, 64.7% in basal area and 65.3% in stand stocking (Table 1). It is noteworthy that the heavy selection cut follows the silvicultural policy; in fact, it is increasingly popular in Italy, and in many other countries, to steer artificial plantations toward natural prototypes [27]. The area has an uphill landing site, with a single forest road crossing it. The density of forest roads and skid trails was 37.4 and 30.2 m ha−1, respectively. The stand presented its original density, because none treatment has ever been done.
Felling operations were carried out by a chainsaw operator (Husqvarna 346 XP, Table 2) and two helpers very useful in the stump for cleaning and tree landing. Logging operations were done by three operators, according to the so-called “full tree system” (FTS). The felled area considered for the study of these operations was divided according to each yarder line typology, and only one team worked in the examined site. The working team had a specific training and experience for the working system applied. Extraction was performed uphill by two mini-yarders with different carriages and a modified forestry winch. Trees were just extracted out of the stand to the forest road, where they were chipped (including the main trunk), and the chips loaded on a truck. Mini-yarder system was mainly composed by one winch, one carriage and two steel wire ropes. The forest mechanic winch, with a maximum pull of 45 kN, was applied to a farm tractor with engine power of 55 kW. The winch was equipped with a main drum for the pulling rope containing 250 m of steel rope with a diameter of 9 mm, and with a secondary drum for the mainline rope containing 200 m of steel rope with a diameter of 14 mm. The two different carriages used were: a semi-automatic carriage with a nominal maximum payload of 1.5 kN (SAVALL 1500), and a mobile pulley carriage with a nominal maximum payload of 1.0 kN (MAXWALD) (Table 2).
The units were designed for installation in gravity skyline configuration only. The mainline wire rope was tightened by a hand-hoist between two end-spars (vigorous trees). The pulling rope connected the winch to the carriage, and it was used to move the carriage back and forth along the mainline wire rope, and also to skid the felled trees and lift up the loads in the planned loading points. The skyline was equipped with two mobile line blocks to stop the carriage, respectively at the loading and unloading points. In particular, in the system with semi-automatic carriage the line blocks were provided with hydraulic clamps, and the system with mobile pulley carriage was equipped with mechanic clamps. Main winch controls were mechanic with manual action, consisting of a clutch and a brake. These two systems represent two different technological devices applicable to small-scale forestry, while remaining in professional application contexts. Understanding their operational differences and limits is an excellent aid to technicians and forestry owners, but also represents the starting point for technological improvements to these machines and equipment.

2.3. Data Collection and Analysis

Pre and post-harvest stand data were obtained through systematic plot sampling. Grid dimension was 150 m × 150 m, the area of each circular plot was 314 m2 (10 m radius), and in total 18 plots in each sampling were established. Diameter at breast height (dbh) and height of tree species were measured by caliper and clinometer, respectively, in each plot. The growing stock and average biomass yield were estimated with a two-way table (dbh and height of tree) developed for P. nigra growing in Tuscany [28]. The branch mass was obtained sampling 50 trees.
A time-motion study was carried out to evaluate working productivity and to identify those most likely variables capable of affecting it. Each working cycle was stop watched individually, separating productive time from delay time [29,30]. Delay factor calculated, represents the quotient of delay time over net cycle time. Productivity was calculated both on delay-free time and on actual total time, inclusive of all delays. Inclusion of delays was not capped on the basis of a maximum event duration. Scheduled Machine Hours (SMH) include all time the machine is scheduled to work, Productive Machine Hours (PMH) represent the time during which the machine actually performs work and this exclude time lost to both mechanical and non-mechanical delays.
The felling operation is divided in three phases: “approach to the marked tree” (when the chainsaw operator moves from the last felled tree to the other to be felled), “preparation of felling site” (when the team cleans the tree stump before the felling), and “felling” (when the chainsaw operator turns on the chainsaw and performs the cut and ends with the fall of the tree).
Bunching-extraction distance was determined with a measuring tape. Load volume was calculated multiplying the number of trees per load for the average tree size. The average tree volume was obtained sampling 240 trees (15 trees in each thinning row) (Table 3).
The system boundaries for the study area were set to those of the forest operations, i.e., only by the felling to the chipping site, or by the felling to the chips loading site were taken into consideration. The Functional Unit (FU) used in the analyses was the dry ton (td.m.). During this study, 16 skylines, 8 for each carriage used, were analyzed (Table 4) and every line was 50 m wide.
Operational costs were estimated with the Miyata [31] method as described in Spinelli et al. [13]. Different machines have been estimated considering different periods of use. For the skyline with carriage, winch, and accessories, an annual use of 800 scheduled machine hours (SMH) was estimated and a depreciation period of 10 years [32]. The farm tractor for the skyline winch was depreciated on 1000 SMH per year, assuming that it could be used in other works besides yarding [11,13]. The chainsaw for the felling was depreciated on 800 SMH per year and a depreciation period of 2 years [11]. Labor cost was set to 15 € SMH−1 inclusive of indirect salary costs [11,33]. The costs of insurance, repair and service were obtained by other studies [11,13], while the fuel and lubricant average prices by a market survey (second semester 2019) conducted upon three company products. The calculated operational cost, as suggested also in Spinelli et al. [13], increased by 10% to account for overhead costs [34].
As reported in Picchio et al. [2] for the machines and accessories, a complete energy consumption analysis was assessed, following the Gross Energy Requirements (GER) method. The indirect input (MJ td.m.) of machines and tools was determined on the basis of the average energetic values (MJ kg−1) of raw materials related to: their quantitative presence (%) estimated and calculated, the total mass of the machine (kg), the total service life of the machine (h td.m−1), and the use of the machine during forest operations. The energetic consumption related to human work was assessed following as reported in Christie et al. [35,36] and in Balimusi et al. [37], by applying a value of 0.030 MJ min−1worker−1.
To complete the energy balance, the energetic value of wood as the energy released during its combustion was determined as Higher Heating Value (HHV) (CEN/TS 14918) on 20 random samples, one sample per loading, by means of an adiabatic calorimeter (Parr, model 6200) [38].
To assess pollutant emissions during forest operations, emissions due to fuel were calculated as the sum of emissions produced during combustion (Efc) and emissions produced during production process and logistic (Efp). In the Efc assessment were considered the fuel energy content, the specific engine emission factors, and the thermal efficiency of the fuel combustion process. The results were obtained using the formula suggested by Klvac et al. [39], with wheeled tractors emission factors (Table 5), only CO2 emissions were assessed by applying the emission factor adopted by Athanassiadis [40]. In the Efp assessment were considered the fuel energy content and emission factors suggested in Klvac et al. [39], only HC emission factor of 0.0862 was adopted from Athanassiadis [40]. Besides the fuel consumption also the lubricant consumption was assessed, considering as proposed by Athanassiadis [40] and Klvac et al. [39], two main aspects: emissions produced by production processes (Eop) and by reprocessing of used oils for final combustion (Eor). The lubricants were selected on the basis of specific oil types and mix. As reported in Picchio et al. [22], the fuel and oil consumptions were calculated considering engine power, load factor and specific fuel consumption related to the time of use per output unit.
Statistical analysis was done using Statistica Statsoft. Kolmogorov-Smirnov test was used in order to verify data distribution and normality. Dendrometric characteristics of stand studies before and after thinning were compared by independent samples t test. Differences between plots were checked with the ANOVA and MANOVA tests, or with its nonparametric equivalent (Kruskal-Wallis) if the data did not reach the normality. Regression analysis of time study data was used to check a model capable of predicting productivity as a function of statistically significant independent variables such as distance and load size. If the data were not normally distributed, a non-parametric Spearman’s rank coefficient was applied to analyze the correlation between the variables.

3. Results

The data shown in Table 1, referring to a productive stand, harvested for about two thirds of its total stock (nearly 64% of the basal area). The independent samples t test showed that dendrometric characteristics (dbh, height, volume, branch mass of residual trees) are uniform before and after thinning operations. Harvesting did not consider only smaller dominated trees but included many dominant trees with stability and structure issues (Table 3). For this reason, the post-harvest dendrometric data returned almost the same average tree size (DBH, height and volume).
The statistical analysis (ANOVA) of the average working times did not show significant differences among the 16 yarder lines. By the ANOVA results between DBH (diameter classes in centimeters: 10, 15, 20) of the felled trees, it can be said there are no significant statistical differences in average felling time. About the analysis of felling phases, “felling” takes about 42% of the total felling operation time. Globally felling operations have a productive time (PMH) of 159.10 h and delays are 39.86 h (20% of the scheduled time—SMH), with a Delay Factor (DF) of 25.1%. On the basis of our calculation, felling productivities (Table 6) resulted 19.78 m3SMH−1 and 24.74 m3PMH−1.
Among the yarder lines, the statistical analysis (MANOVA) of the average working time (Table 7) did not show significant differences in cycle, trees per cycle, bunching and extraction distance. Between the two yarder lines with different carriage, the statistical analysis (MANOVA) of the average working time (Table 7) showed significant differences about cycle, average time for unloaded carriage travel and for choking time. The working time analysis shows a SMH time of 421.10 and 425.60 h for yarder line with the Savall and the Maxwald carriage respectively. The percentages of logistic and preparation time, 12.1% for Savall and 11.8% for Maxwald, are similar and considerably smart for simple yarder lines, as those used. Phase analysis shows that the time necessary for the loaded carriage to travel takes about 26% for the Savall and 25% for the Maxwald of total operation time. Globally, extraction operation for the Savall lines have a productive time (PMH) of 328.90 h and delays are 92.10 h (22% of the scheduled time—SMH), with a Delay Factor (DF) of 28.0% and for the Maxwald lines have a productive time (PMH) of 338.20 h and delays are 87.40 h (21% of the scheduled time—SMH), with a Delay Factor (DF) of 25.8%.
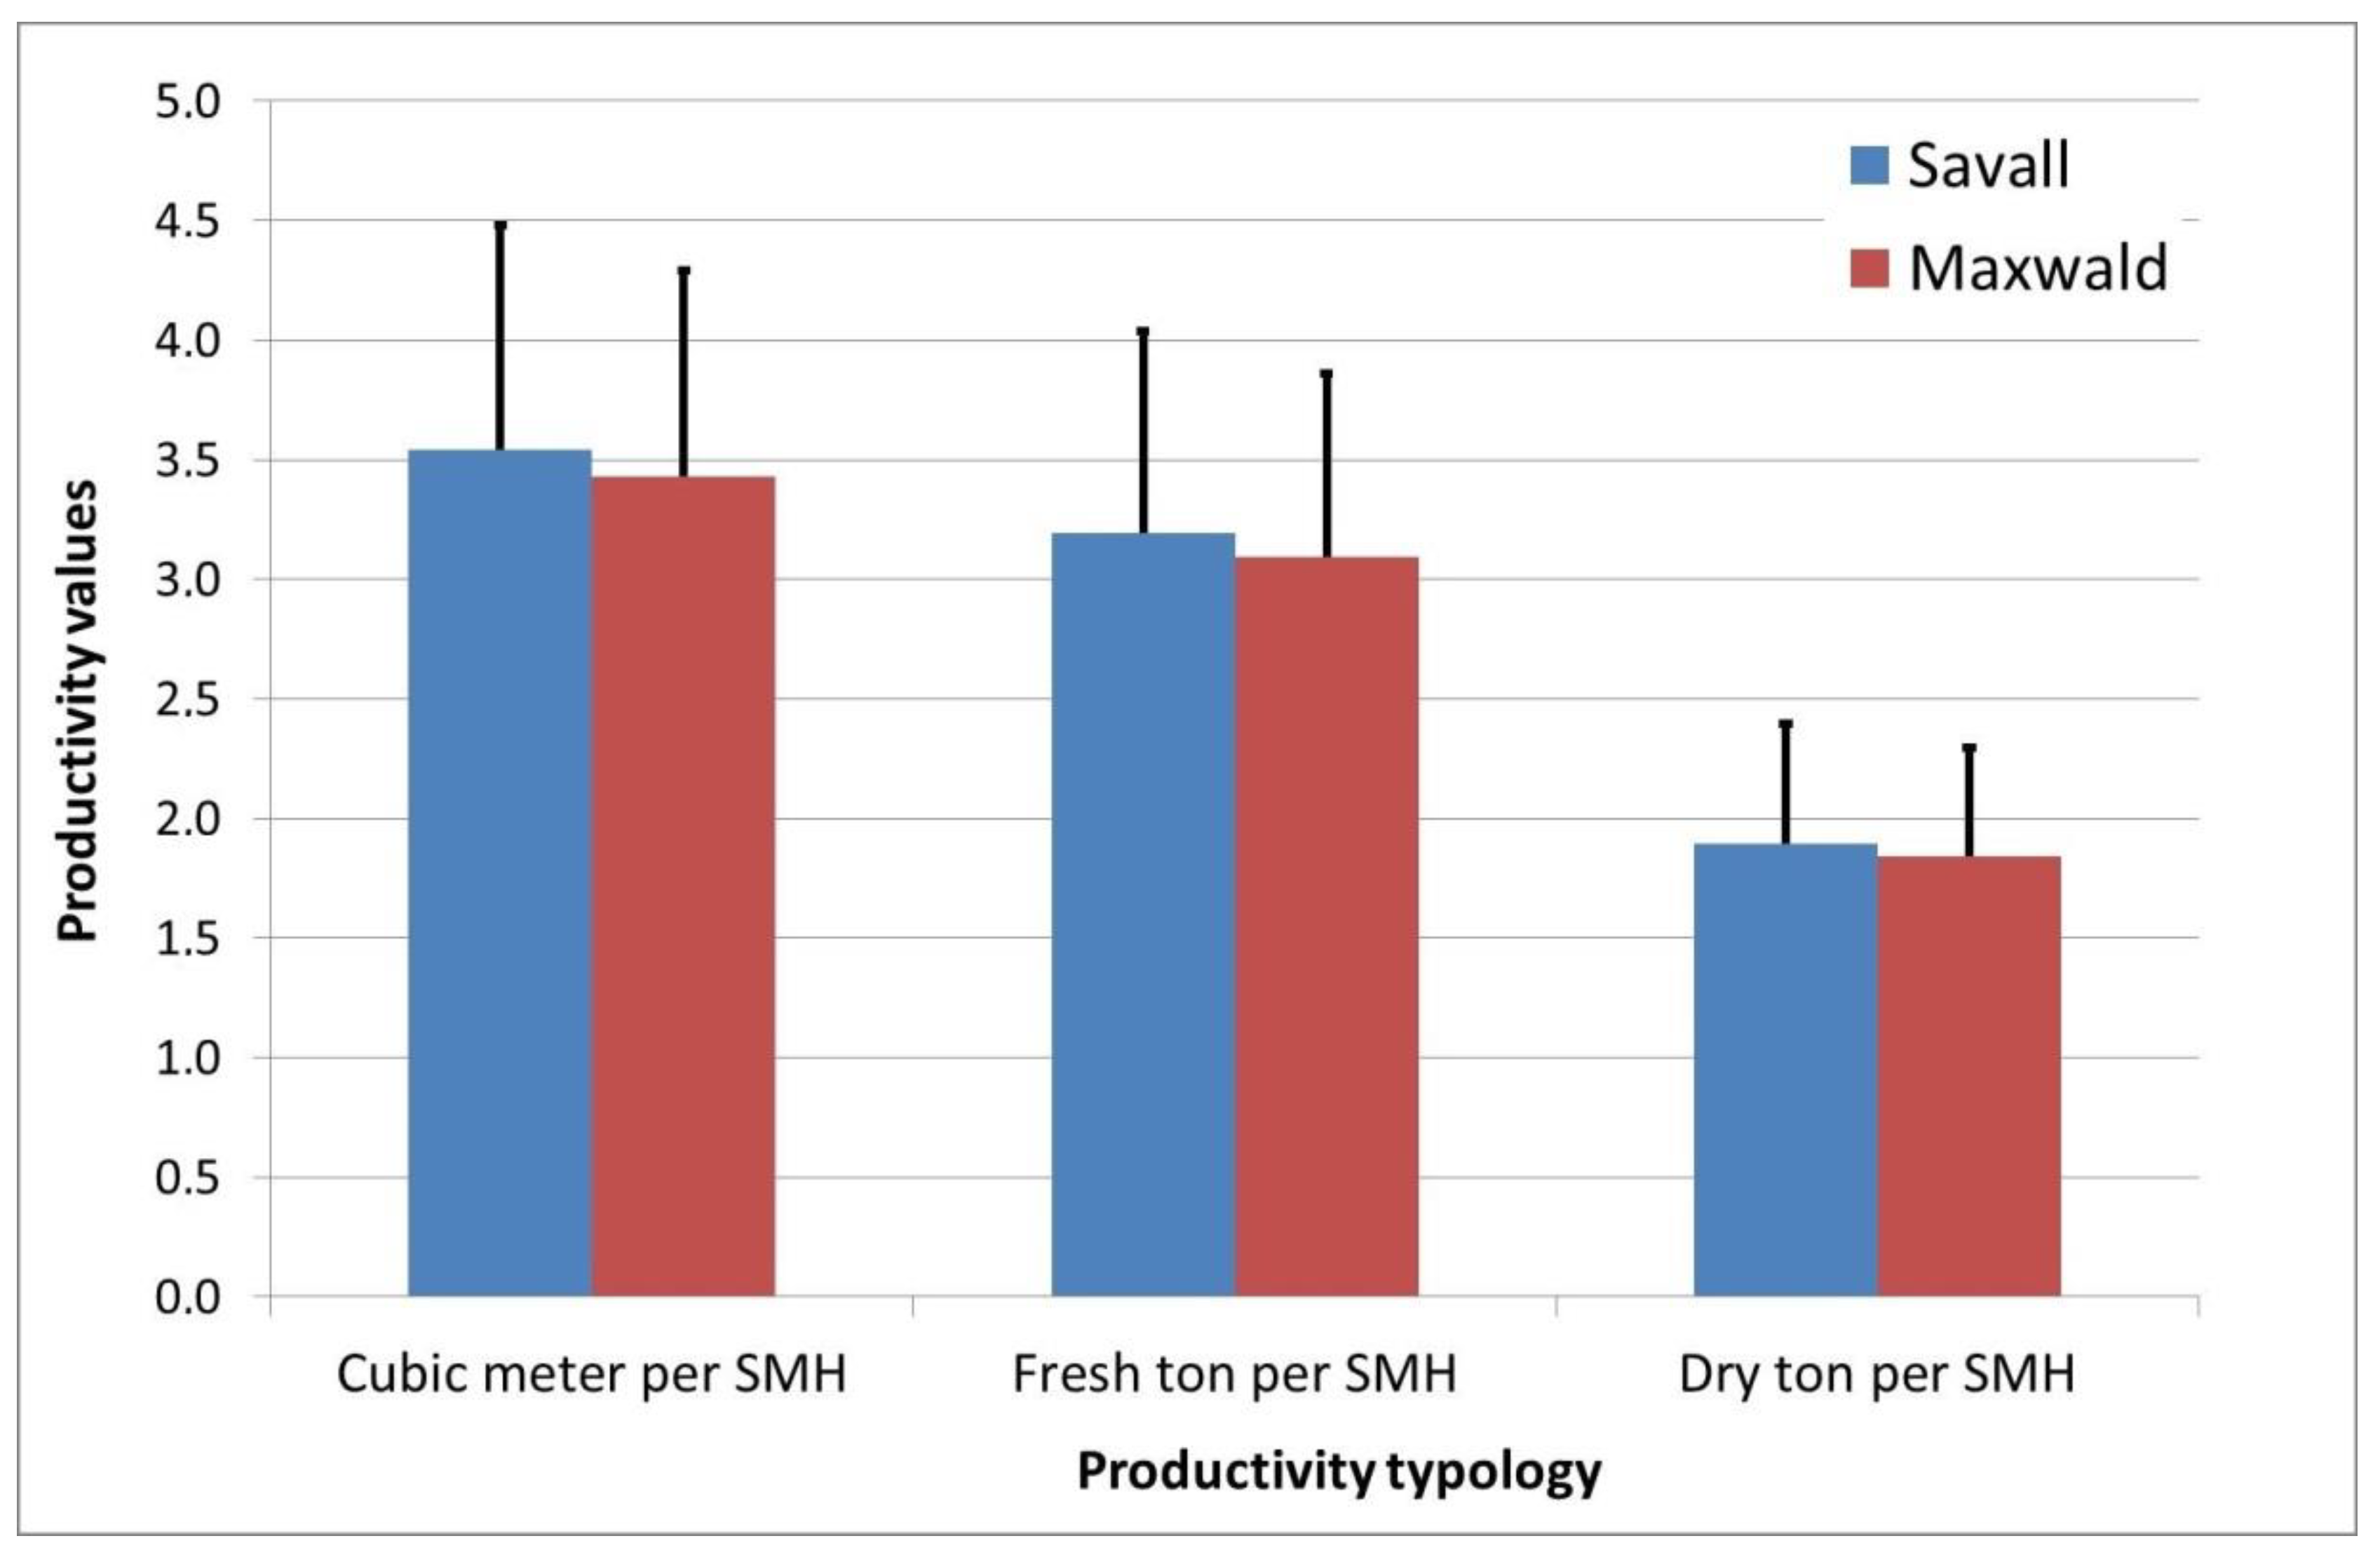
For both skyline systems, the delays were mainly due to errors committed by the chocking workers, for example through erroneous chocking of chains on the log. The bunching-extraction productivities, on the basis of collected time data and total worked volume, were 4.75 m3SMH−1 and 6.08 m3PMH−1 for the yarder line with the Savall carriage and 4.55 m3SMH−1 and 5.73 cubic meter PMH−1 for the yarder line with the Maxwald carriage (Table 7).
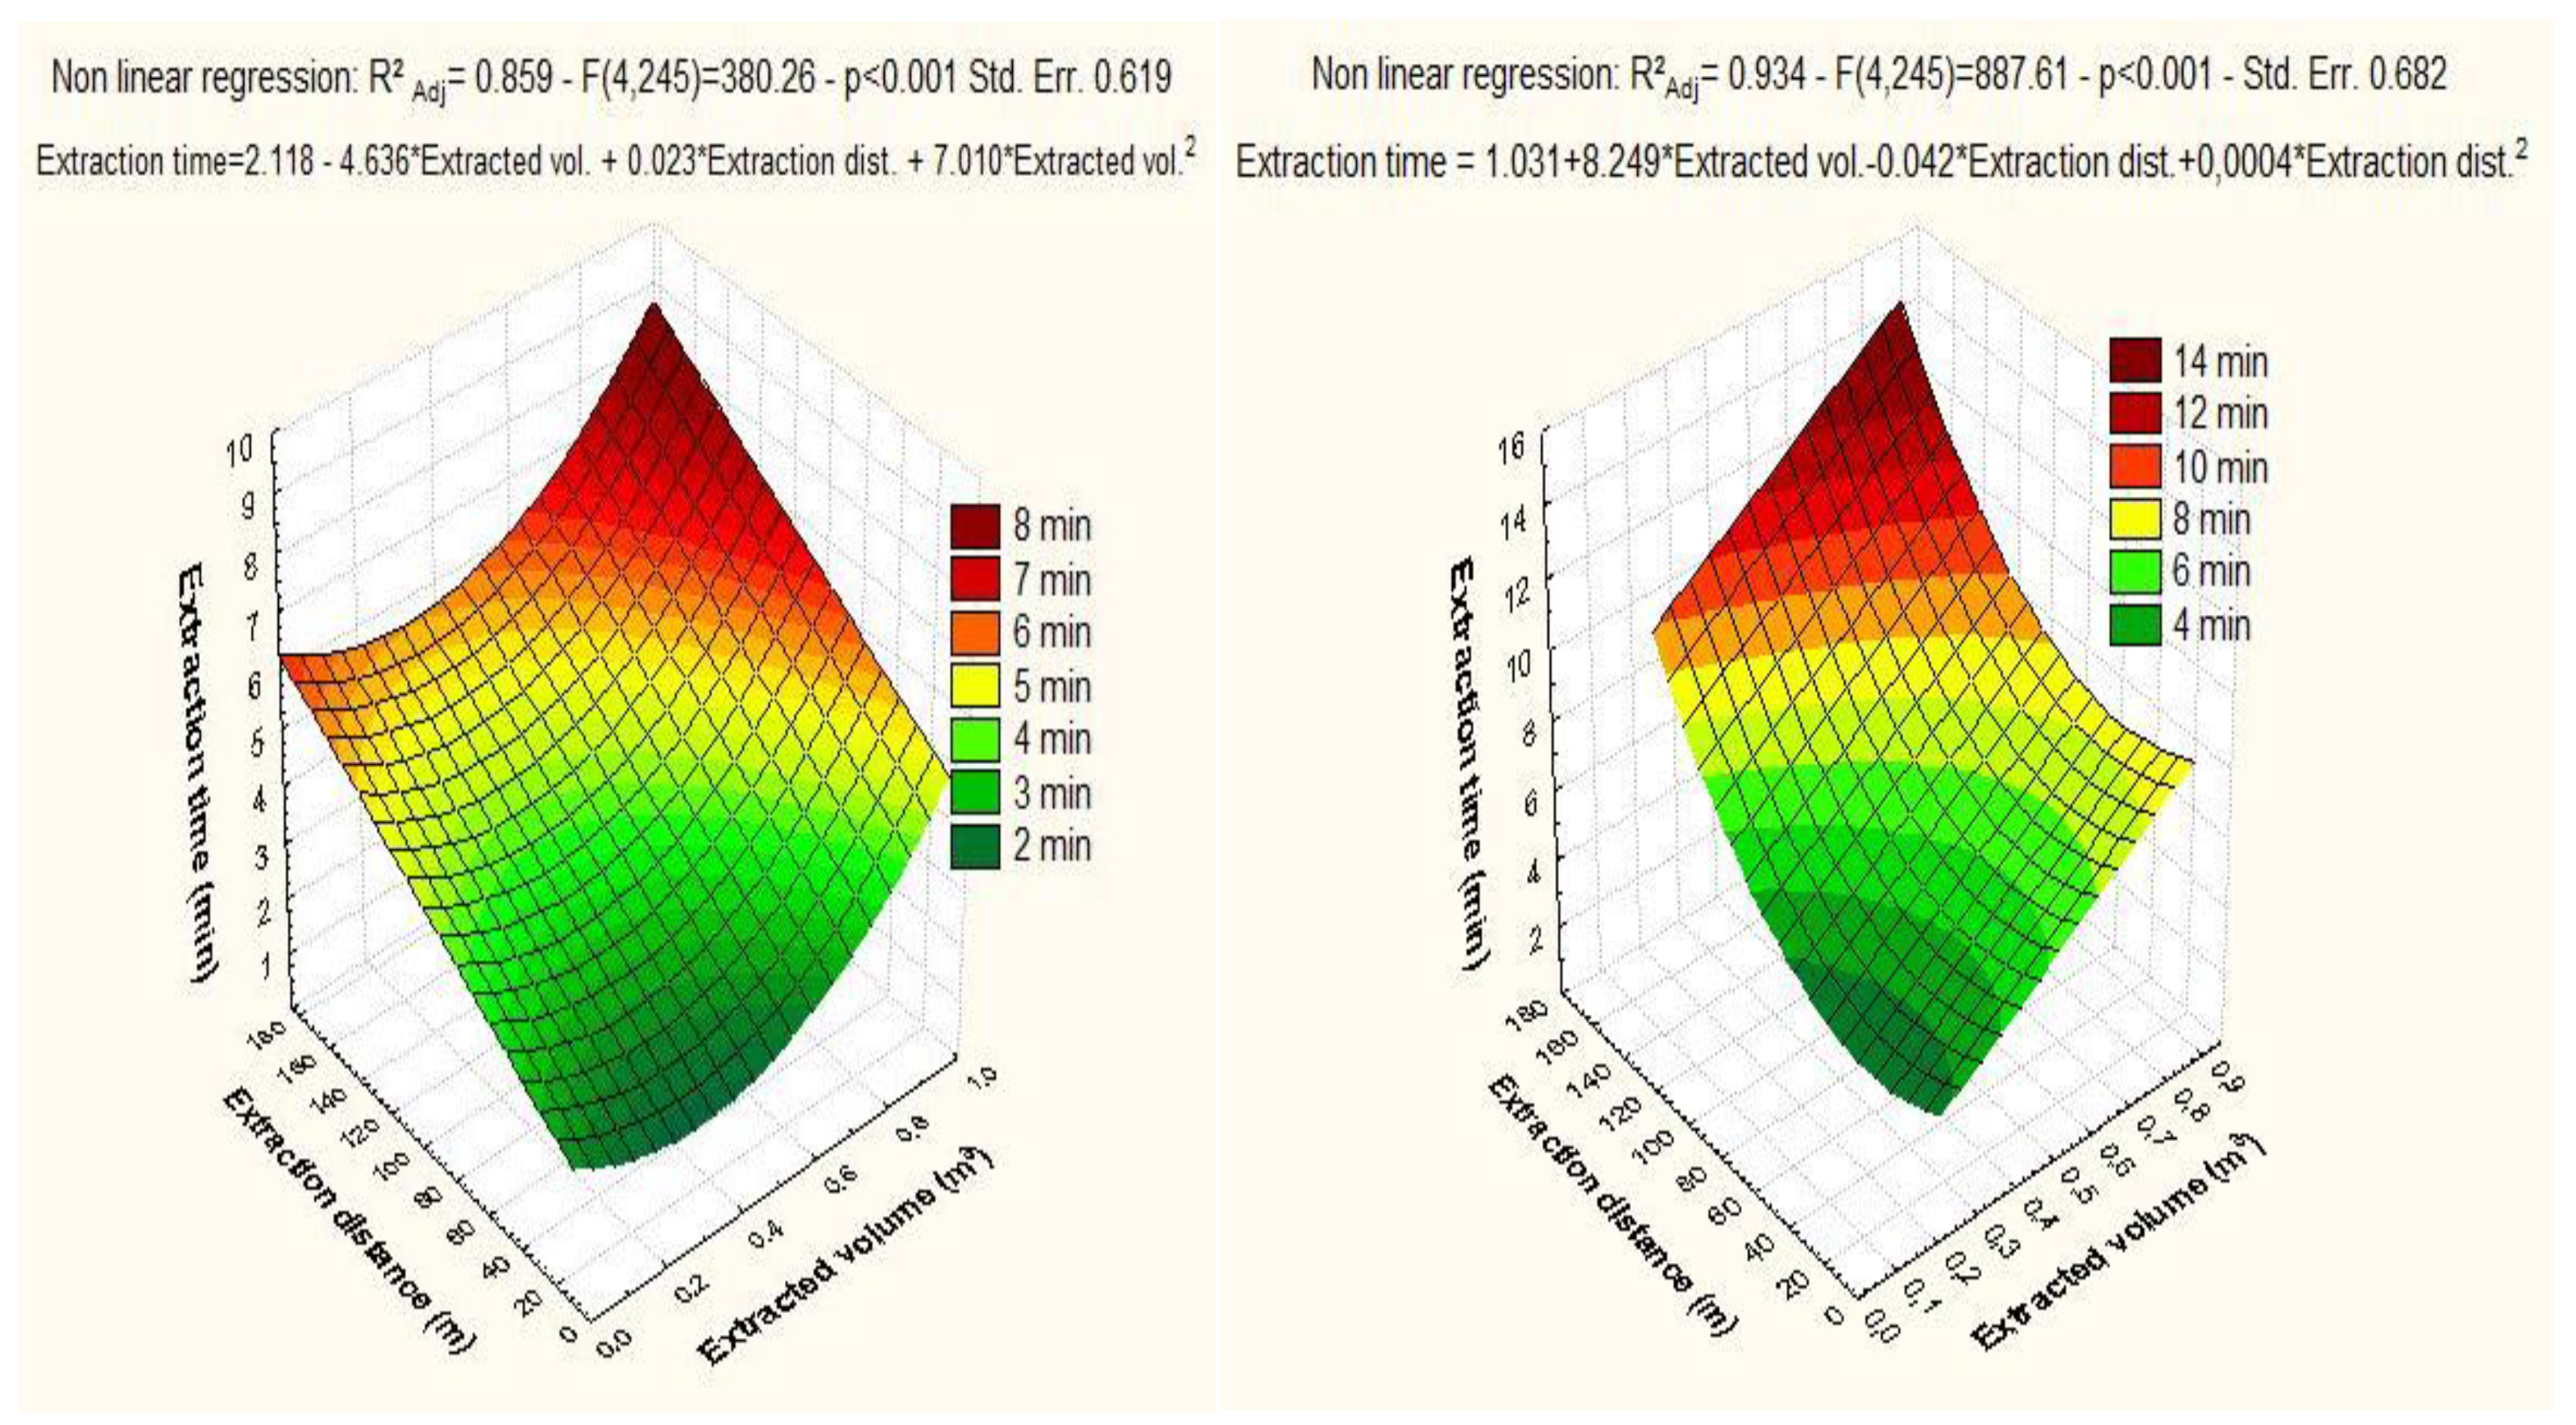
The regression analysis (Figure 1) highlighted a good statistical correlation between extraction time, extracted volume and extraction distance, with R2 near to 0.9 for both carriages. In the Maxwald carriage the correlation was considerably higher than in the Savall carriage (93.4% vs. 85.9%).
Among the 16 yarder lines, the statistical analysis (ANOVA) of the average chipping time does not show significant differences (Table 8). Globally chipping operation has a productive time (PMH) of 71.85 h and delays consists of 11.17 h (14% of Scheduled time—SMH). Chipping productivity (Table 8) results, on the basis of our calculation, on 47.48 m3SMH−1 and 54.86 m3PMH−1.
If delay times tend to zero, the total productivity of the yard showed in Figure 2 and referred to SMH, could potentially increase to a maximum of 27% for the yarder line with Savall carriage, and 25% for the yarder line with Maxwald carriage.
The hourly machine costs, including fixed cost, variable cost, and labor cost, are shown in Table 9. The yard costs for each case study operation is presented in Table 10. The financial analysis shows the machine operating costs per unit time. These were mainly composed by the variable costs for the chainsaw, tractor and by fixed costs for the skyline (Table 9). As concerns the single operations (Table 10), extraction represented the most relevant expenditure with about 70 € h−1, while felling showed the lowest operative costs per hour, with 53.28 € h−1. The hourly cost of each operation was divided by its corresponding productivity in order to derive unit cost. The total cost is the sum of the single operation costs. The total yard cost, regarding trees extracted just out of the stand to the forest road, was 18.42 ± 0.12 € m−3. The average selling price of the whole tree extracted just out of the stand to the forest road, of about 21.00 ± 1.20 € m−3, was found on the basis of wood energy market for contractors with chipper machines and considering the main technological wood chip characteristics (Table 11).
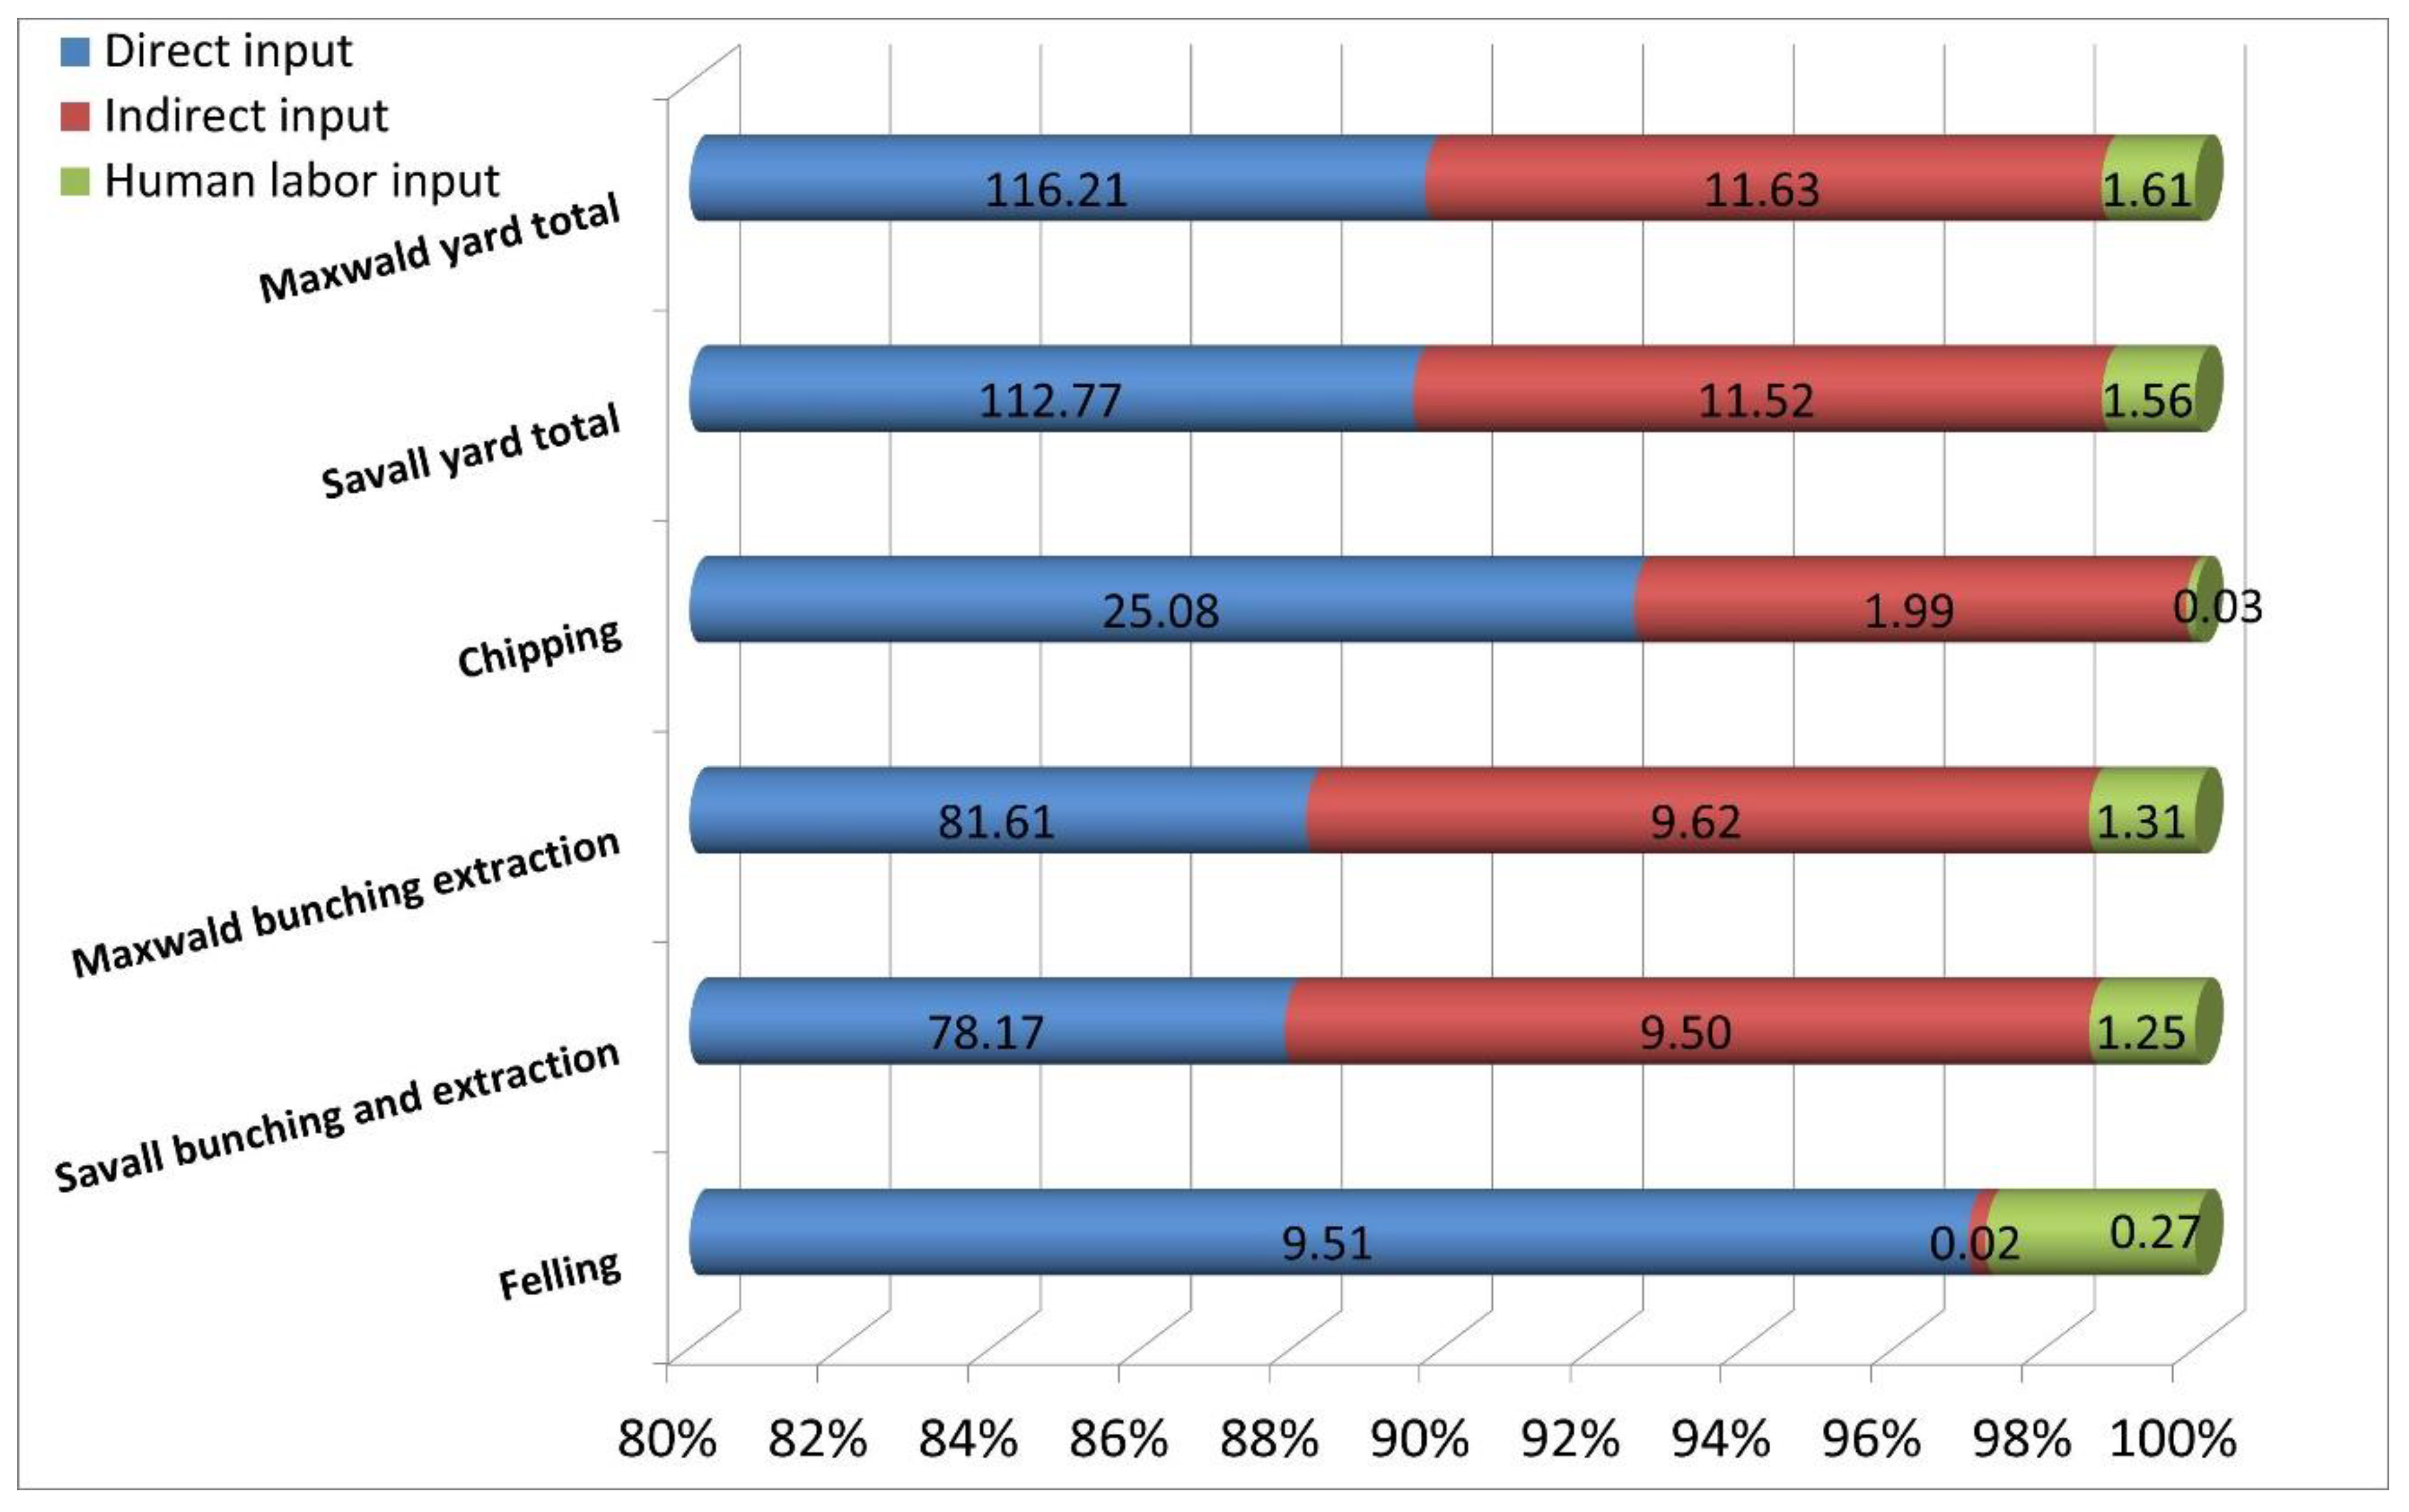
The lowest energy efficiency was recorded for the yard extracted by the Maxwald yarder line, with a total input of 129.5 MJ m−3 (Table 12). In the yard extracted by the Savall yarder, the energy expenditure reported a total input of 125.8 MJ m−3, just slightly lower than the other yard (−2.9%) (Table 12). In particular, the difference was in the direct inputs, which was calculated 3.0% higher in the yard extracted by the Maxwald than in the other one (+3.4 MJ m−3). The input concerning human activity and indirect inputs resulted similar between the two yards (Table 12 and Figure 3).
A considerable amount of the energetic input concerned the bunching and extraction activities (Figure 3). The results reported that 71.1 ± 0.4% (90.73 MJ m−3) of the energetic input for both yards can be associated with the bunching-extraction operation.
The total outputs for both yard typologies were assessed on the basis of felled volume (Table 3) and HHV of the specific biomass (Table 11). The overall results indicated a ratio of the outputs to the inputs of 2.9% higher in the yard extracted by Savall yarder (98.9) compared to the other one (96.1) (Table 12). High values of the percentage energetic efficiency (Energetic efficiency = ((output − input)/output) × 100)) were calculated in both the two sites (on average, 99% ± 0.02) (Table 12).
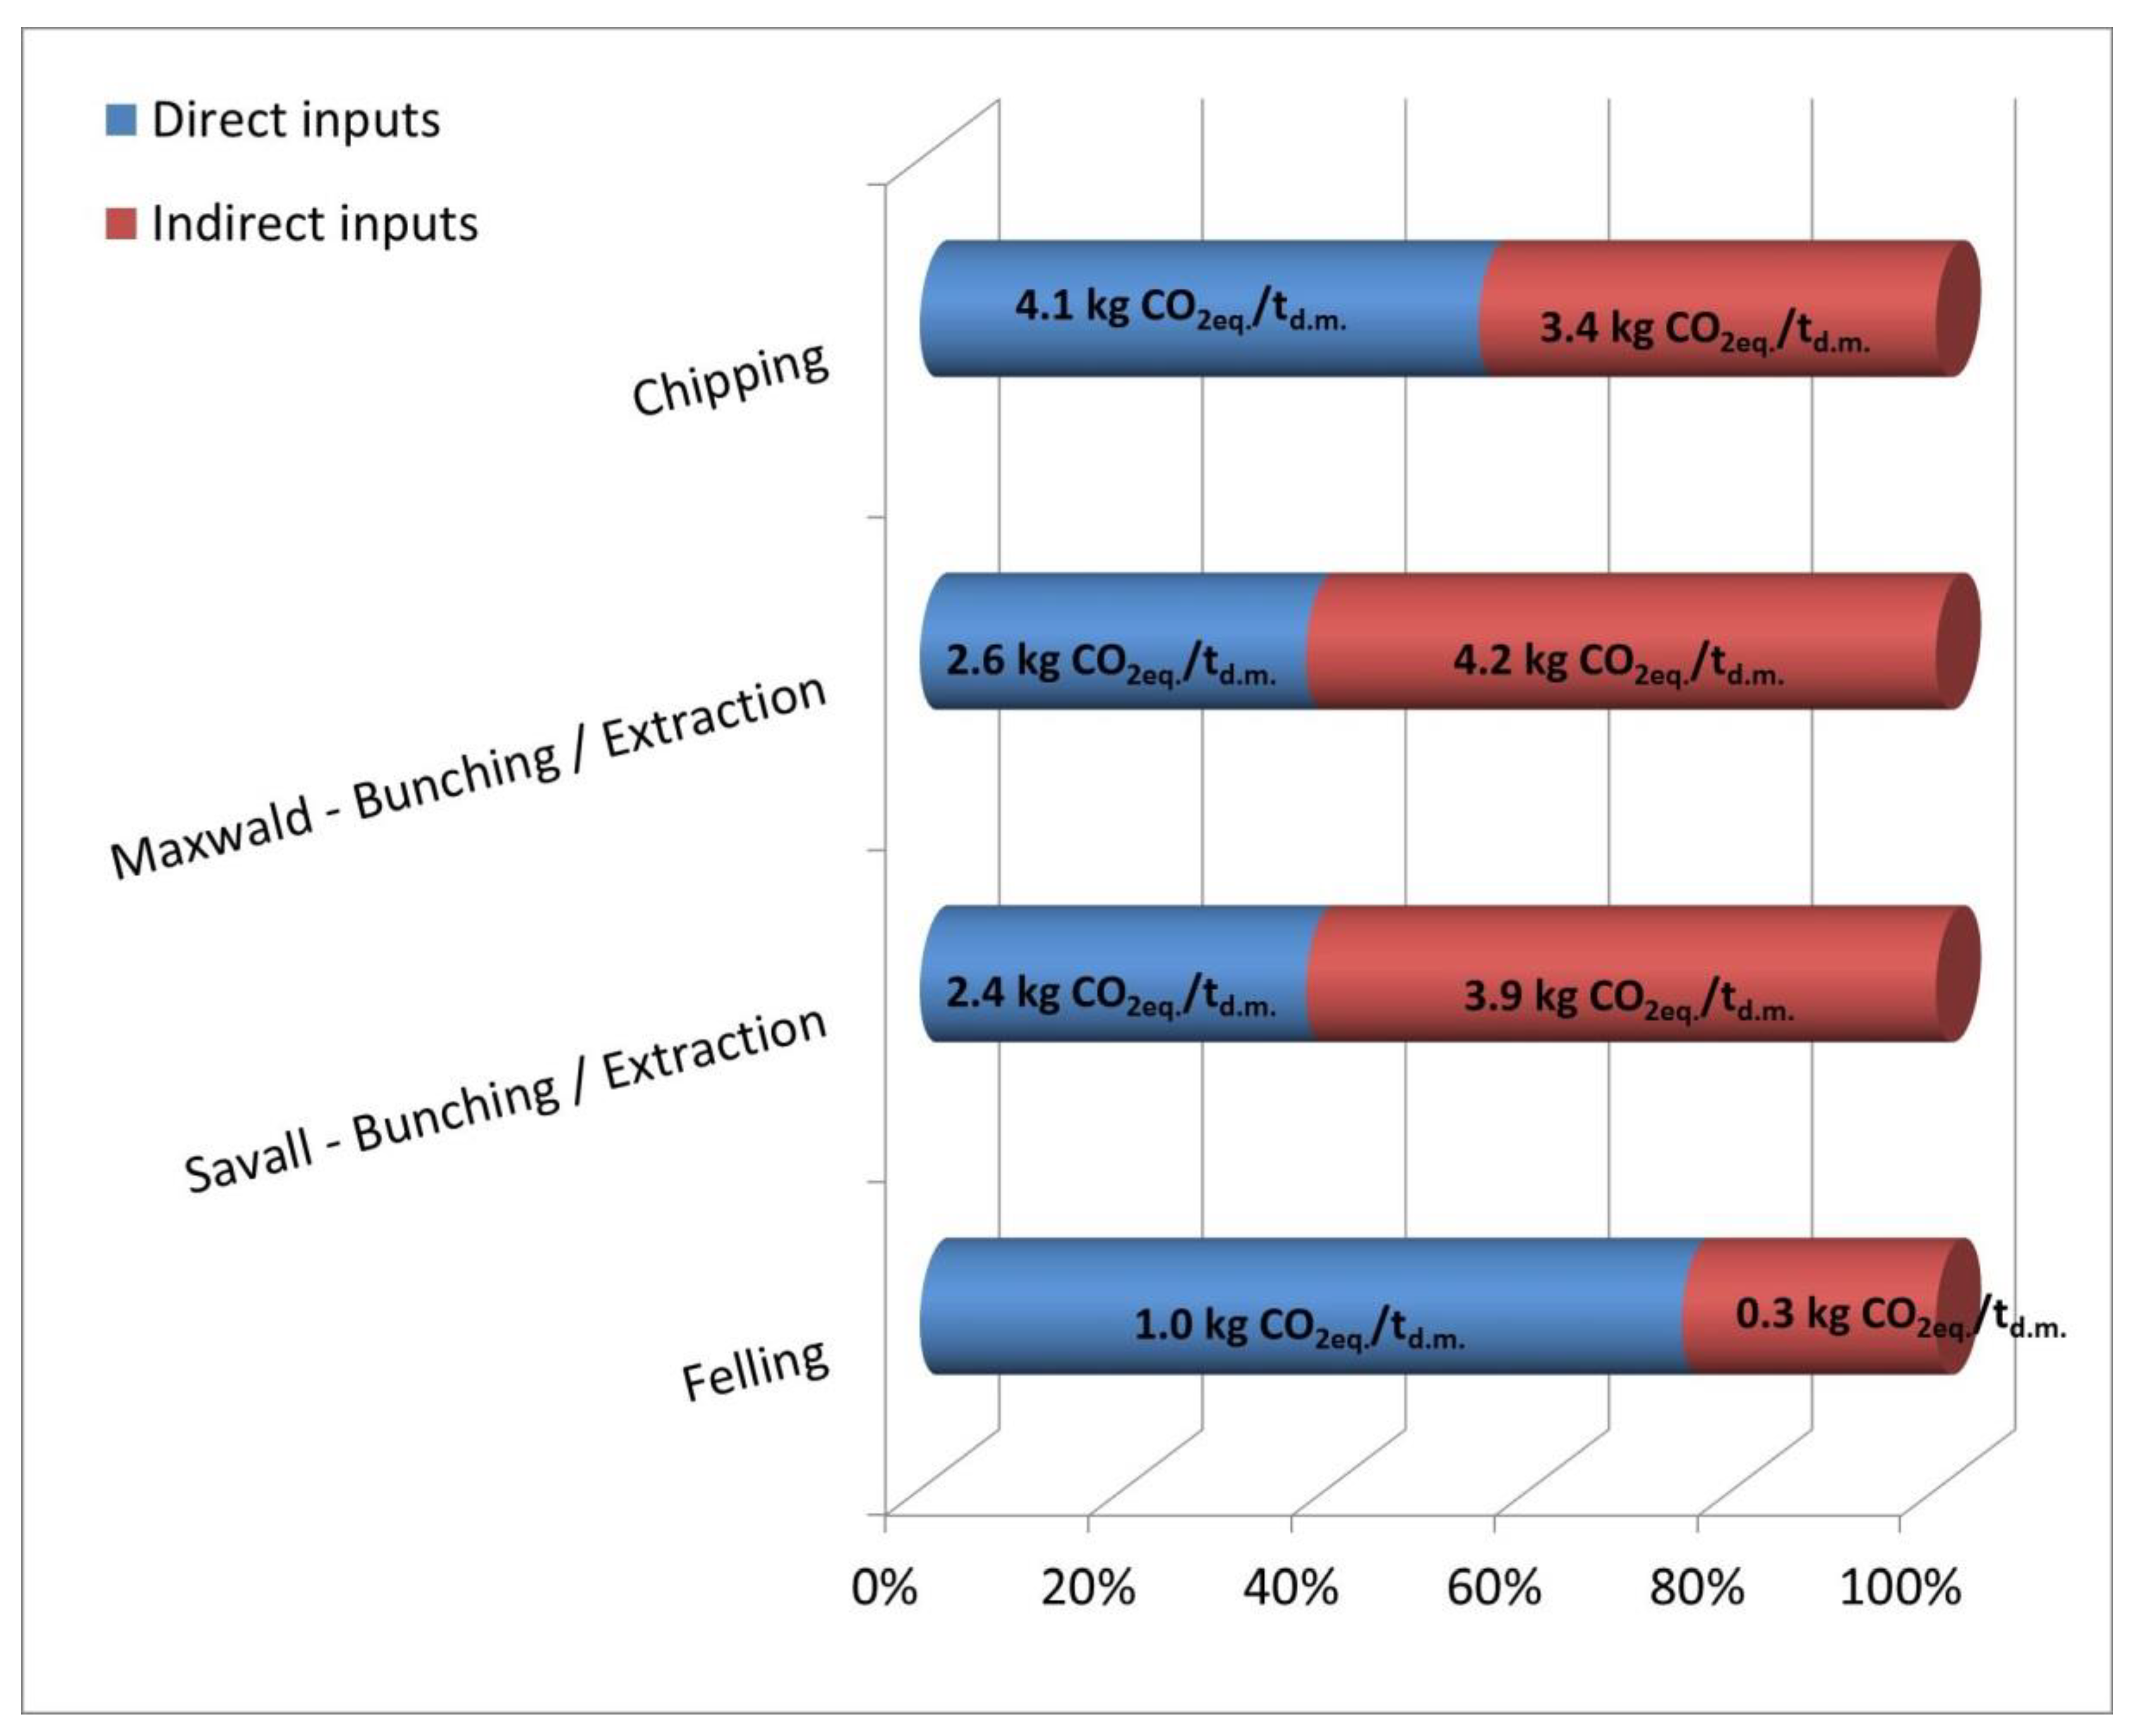
The lowest pollutant emission values were assessed for the yard extracted by Savall yarder line, with a total effective CO2 emission of 1735 g m−3 (Table 13) and a total of 15.1 kg CO2eq. td.m.−1 (Table 14). In the yard extracted by the Maxwald yarder line, the pollutant emission values reported a total effective CO2 emission of 1772 g m−3 (Table 13) and a total of 15.6 kgCO2eq. td.m.−1 (Table 14), only slightly higher than the other yard (+3.3%) (Table 14). These results, globally at yard level, were equally composed by direct and indirect inputs (Table 14 and Figure 4). Data referred to pollutant emissions and fuel and lubricant consumptions are showed in Table 13. The emissions due to Efp, Eop, and Eor were not significant in comparison with those due to Efc, except for HC. The combustion process was responsible on average for 93.8% of CO2, 99.4% of CO, 36.1% of HC, 97.7% of NOx, and 98.6% of PM10 emissions. A considerable amount of pollutant emission values concerned the chipping activities (Table 14 and Figure 4). The result showed that the 48.9 ± 0.8% (7.5 kgCO2eq. td.m.−1, Table 14 and Figure 4) of the pollutant emission for both yards can be associated with the chipping operations.

4. Discussion

Findings referred to a case study made in a 33 year old black pine stand in central Italy. Even if the ideal silvicultural model for these stands, we expected two to four thinnings, with a final clear-cutting and replanting or re-naturalization. Considering the stand evolution and the late thinning, in this case the forest management goal was to ensure a minimal but substantial, canopy cover associated with the progressive replacement of pine trees with late successional tree species, typical of more mature natural evolution stages [23].
Felling productivity was high due to the efficient work planning and the optimal composition of the working team (one chainsaw and two helpers). The delays (about 20%) were mainly due to errors, as to the block of the chainsaw guide bar below the marked tree by dense understory plants, which is very common especially in first thinning. Our results showed higher productivity values (6.08 m3 PMH−1 for the yarder line with the Savall carriage and 5.73 m3 PMH−1 for the yarder line with the Maxwald carriage) compared with other authors [44,45,46,47]. These data could be explained with the high intensity of the harvesting (854 trees ha−1) in the study area. The felling intensity of the forest according to workers’ experience, is the most influencing factor for the productivity of the site Schweier et al. [23].
Bunching-extraction productivity by cable yarder was comparable with that reported in other similar studies [13] in particular for the Savall 1500 the same of our study. The average duration of the cable yarder cycle recorded on similar distances by Spinelli et al. [13] was slightly longer than 5 min, and very close to the ca. 5.7–5.9 min resulting from our study.
For a very similar cable yarder system, Spinelli et al. [13] reported a net productivity of 2.4 m3 PMH−1, considerably less than the average of this study (5.9 m3 PMH−1); such difference could be explained by considering the harvest density per linear meter, which sensibly varies between the two studies (near to 0.2 m3 m−1 in Spinelli et al. [13], and 1.2 m3 m−1 in this study). This significant difference between the two studies in terms of harvest density (1 to 6) did not affect proportionally the productivity (about 1 to 2.5). This can be explained by the significant difference in delay factors found, Spinelli et al. [13] found a delay factor of 0.1, resulting over 0.2 (0.28 for Savall and 0.26 for Maxwald) in this study.
The performance comparison of mini-yarders tested in this study against light tower yarders reported in the bibliography [48] could be very interesting but may lead to erroneous conclusions. Mini-yarders could compete with light tower yarders over short extraction distances: when the distance increases, the heavier load capacity of the light tower yarder allows a better performance [23]. Light tower yarders are generally used for longer yarder lines (over 200 m) than those observed in our tests, and often beyond the capacity of the mini-yarder.
Mini-yarders tested in this study, have also been compared against a forestry-fitted farm tractor with winch reported in Picchio et al. [2], with a lower resulting productivity, which can be motivated by the extreme specialization of tractor winches against the yarder on these kinds of work.
If the comparison is carried out between the yarder and a farm tractor for direct extraction (skidding), [32,49] the difference in terms of productivity is not consistent. In fact, in some cases the cable yarder is more productive.
The regression analysis highlighted a good statistical correlation between the bunching-extraction distance and working time, as reported also by Spinelli et al. [13], while a lower correlation exists between the volume extracted and the working time. This highlights the need for these systems to work in proximity to their maximum load capability. The assessed statistical models, based on a non-linear regression analysis with three variables (Figure 1), showed good prediction capacity for both cable yarder models (R2 of about 0.9).
Chipping productivity was high due to the average three dimensions and the good work planning. The delays (about 13%) were mainly due to incorrect trees positioning at the cable yarder unloading site. The productivity showed higher (double) values compared with findings reported by Schweier et al. [23].
Overall, the two yards show an average productivity that could be considered excellent for a first thinning, this mainly thanks to the integrated planning of the silvicultural intervention and forestry operations. However, as shown in Figure 2, further improvements could be obtained. Productivities could potentially increase 27% and 25% for the Savall and Maxwald carriages, respectively, if the delay times reduced to minimum level. The delays for machines maintenance and fueling allow the equipment to work within optimum parameters and, as a result these delays are difficult or impossible to reduce. Delays included in the non-work time (personal delay, operational delay, and technical delay) could be reduced focusing on a better operation organization and planning. In conclusion, a reduction in delay times may be achieved by proper training of workers and by a better organization and planning of operations.
In Italy for a similar ground slope, distance and silvicultural situation, short wood system was normally applied, associated with the extraction by animals (mules), resulting in negative factors for the work conditions and workers’ safety. Wang [14] noted that most of the accidents are caused by improper operations on steep terrain, where animals are used for logging. Cut to length system (CTL) or FTS are often associated with the extraction by tractor with winch, which is a better but limited technology for similar situations with extraction distances less than 80–90 m [2,7]. FTS or also CTL systems associated with the extraction by skyline is a good opportunity for an improvement of the work conditions and workers’ safety, but in this case a proper and accurate training is primary. Indeed, the main intervention to improve health and safety is represented by workers training as well as lower pressure of work [50]. An appropriate training course should focus firstly on accident reduction and then on ergonomics for prevention of chronic illnesses [51].
The findings of this study showed that the most expensive operation is the extraction, representing for both technologies over 81% of the total logging costs. The possibilities for improvement are not high. According to data collected, the percentage of 81% can at most drop to 80%. However, the costs related to cable yarder extraction, when compared with similar extraction yards [13], are in some cases lower by even half. Results can be attributed only in part to the technologies, and mainly to the interaction between logging and silvicultural planning.
The felling operation in terms of costs and productivity was very similar to that found in other comparable studies [23]. The chipping instead showed lower costs than similar yards [23]. The reasons are related to the possibility to work on little heaps of whole trees and with trees of ideal size for the machine used.
Our results indicated that use costs can be decreased up to 21.5% by reducing delay times through training of workers and by a better organization and planning of operations. This could lead to a total yard cost of about 14 € m−3. Compared to other work methods, if supported by adequate logistics and density of harvesting biomass, the mini-yarders can be very competitive unless the skyline yard includes the preparation and implementation costs of the line as well. For a silvicultural treatment, which is often considered with negative income, and subject to environmental constraints, it could be considered a good result.
In this kind of harvesting sites, the plots have been selected to use the skyline, and they were not extracted with tractor and winch if not after the opening of new forest trails (technical and operational parameters were not allowed in this context, due to several legislative restrictions). As shown also in another study [13] mini-yarders could represent a good solution to wood extraction on steep terrain, competitive with animal and winch. However, this is only possible with an adequate work planning and workers training, as already stated that in small-scale forestry it is often difficult to implement, even if extremely necessary.
The human energy consumption was estimated on the basis of a human heart-rate response during field work. The calculated energy expenditure during working ranged from 0.024 to 0.033 MJ min−1 per worker. The lower value was for chipping operations and it is significantly lower than what is reported in other studies [22,35,52], but it is clearly explained by the high mechanization used in this operation, as found by Picchio et al. [53]. The higher value was for the extraction by the Maxwald cable yarder, and it is similar to what was reported in other studies [22,35,37,52].
Concerning energy inputs, a comparison was conducted between the results of this study and those of similar studies, where a high mechanization level was applied, and the values found were four times higher [52,53]. The comparison conducted between studies where an intermediate mechanization level was applied [32] showed different results, in this case about eight times higher. That obviously affects also the energy balance (output/input ratio), which is from 3 to 7 times higher, compared to high [52,53] and intermediate [32] mechanization levels.
The percentage of energy efficiency (i.e., 100 × (output − input)/output) was high and on average 99% ± 0.02. This value was near to those reported by Picchio et al. [22] (97%) and slightly higher than those reported by Baldini et al. [32] (91%).
The comparison with previous studies, regarding GHG (Green House Gases) emissions, in particular assessed via CO2 equivalent, highlighted the efficiency of the cable yarder (in this study about 9 kg CO2eq. m−3), as it was also demonstrated by previous studies (values ranging from 4 to 11 kg CO2eq. m−3) [23,39,54,55]. The findings of this study are clearly lower than those assessed in forest operations carried out with other technologies in thinning treatments, with values ranging from 12 to 33 kg CO2eq. m−3 [23,56,57,58,59].

5. Conclusions

Finally, from the findings, by a comparison between the two scenarios (Maxwald vs. Savall), it is possible to affirm:
(i)
The yard with the Savall cable yarder showed the best performance, even if the differences found were minimal and almost zero in terms of costs;
(ii)
The findings showed how a detailed assessment of logging methodologies allows improving sustainable forest operations also in first thinning of pine plantations in slope areas, this independently from the two typologies of the light cable yarder.
All that has been affirmed, even if looking at results from the analyses on a yard in a single forest, is an exportable case study along with the good number of replicas conducted and the refutation with similar realities reported in other studies. An adequate choice of the mechanization level and a constant interaction with the silvicultural planning, together with an adequate worker training allow sustainably producing chips for fuelwood, also from forest realities not very appreciated by the market.

Author Contributions

Conceptualization, R.P., R.V. and F.T.; methodology, R.P., R.V., D.T. and F.T.; validation, R.P., R.V. and F.T.; formal analysis, R.P., R.V., N.D.M., D.T. and F.T.; data curation, R.P., R.V., N.D.M., D.T. and F.T.; writing—original draft preparation, R.P., R.V. and N.D.M.; writing—review and editing, R.P., R.V., N.D.M., D.T. and F.T.; supervision, R.P. and F.T. All authors have read and agreed to the published version of the manuscript.

Funding

This research did not receive any specific grant from funding agencies in the public, commercial, or not-for-profit sectors.

Acknowledgments

This research was in part carried out within the framework of the MIUR (Italian Ministry for Education, University and Research) initiative “Departments of Excellence” (Law 232/2016), WP3, which financed the Department of Agriculture and Forest Science at the University of Tuscia.

Conflicts of Interest

The authors declare no conflict of interest.

References

  1. Nishizono, T.; Tanaka, K.; Hosoda, K.; Awaya, Y.; Oishi, Y. Effects of thinning and site productivity on culmination of stand growth: Results from long-term monitoring experiments in Japanese cedar (Cryptomeria japonica D. Don) forests in northeastern Japan. J. For. Res. 2008, 13, 264–274. [Google Scholar] [CrossRef]
  2. Picchio, R.; Magagnotti, N.; Sirna, A.; Spinelli, R. Improved winching technique to reduce logging damage. Ecol. Eng. 2012, 47, 83–86. [Google Scholar] [CrossRef]
  3. Pollet, J.; Omi, P.N. Effect of thinning and prescribed burning on crown fire severity in ponderosa pine forests. Int. J. Wildland Fire 2002, 11, 1–10. [Google Scholar] [CrossRef]
  4. Peltola, H.; Miina, J.; Rouvinen, I.; Kellomäki, S. Effect of early thinning on the diameter growth distribution along the stem of Scots pine. Silva Fenn. 2002, 36, 813–825. [Google Scholar] [CrossRef] [Green Version]
  5. Rytter, L.; Werner, M. Influence of early thinning in broadleaved stands on development of remaining stems. Scand. J. For. Res. 2007, 22, 198–210. [Google Scholar] [CrossRef]
  6. Heikkilä, J.; Sirén, M.; Äijälä, J.O. Management alternatives of energy wood thinning stands. Biomass Bioenerg. 2007, 31, 255–266. [Google Scholar] [CrossRef]
  7. Savelli, S.; Cavalli, R.; Baldini, S.; Picchio, R. Small scale mechanization of thinning in artificial coniferous plantation. Croat. J. For. Eng. 2010, 31, 11–21. [Google Scholar]
  8. Bergström, D.; Bergsten, U.; Nordfjell, T.; Lundmark, T. Simulation of geometric thinning systems and their time requirements for young forests. Silva Fenn. 2007, 41, 137–147. [Google Scholar] [CrossRef] [Green Version]
  9. Picchio, R.; Neri, F.; Maesano, M.; Savelli, S.; Sirna, A.; Blasi, S.; Baldini, S.; Marchi, E. Growth effects of thinning damage in a Corsican pine (Pinus laricio Poiret) stand in central Italy. For. Ecol. Manag. 2011, 262, 237–243. [Google Scholar] [CrossRef]
  10. Mederski, P.S. A comparison of harvesting productivity and costs in thinning operations with and without midfield. For. Ecol. Manag. 2006, 224, 286–296. [Google Scholar] [CrossRef]
  11. Picchio, R.; Spina, R.; Maesano, M.; Carbone, F.; Lo Monaco, A.; Marchi, E. Stumpage value in the short wood system for the conversion into high forest of a oak coppice. Forest. Stud. China 2011, 13, 252–262. [Google Scholar] [CrossRef]
  12. Štollmann, V.; Ilčík, Š. Assessment of the current theory for projecting cableway routes in terms of the risk level in overloading. Res. Agric. Eng. 2009, 55, 35–38. [Google Scholar] [CrossRef] [Green Version]
  13. Spinelli, R.; Magagnotti, N.; Lombardini, C. Performance, Capability and Costs of Small-Scale Cable Yarding Technology. Small Scale For. 2010, 9, 123–135. [Google Scholar] [CrossRef]
  14. Wang, L. Assessment of animal skidding and ground machine skidding under mountain conditions. J. For. Eng. 1997, 8, 57–64. [Google Scholar]
  15. Toms, C.; Dubois, M.; Bliss, J.; Wilhoit, J.; Rummer, B. A survey of animal-powered logging in Alabama. South J. Appl. For. 2001, 25, 17–24. [Google Scholar] [CrossRef]
  16. Zeĉić, Z.; Krpan, A.; Vukuŝić, S. Productivity of Holder 870 tractor with double drum winch Igland 4002 in thinning beech stands. Croat. J. For. Eng. 2005, 26, 49–56. [Google Scholar]
  17. Eroglu, H.; Acar, H.; Sinan, H.; Ozkaya, M.; Tilki, F. Using plastic chutes for extracting small logs and short pieces of wood from forests in Artvin, Turkey. Build. Environ. 2007, 42, 3461–3465. [Google Scholar] [CrossRef]
  18. Sosnowski, J. Technical, economical and terrain conditions of cableways utilization for timber extraction on the example of Larix 3T cableway. Sylwan 2009, 153, 393–405. (In Polish) [Google Scholar]
  19. Horek, P.; Mauer, P. Forest cableways in Shelterwood system. In Proceedings of the Workshop Proceedings “New Trends in Wood Harvesting with Cable Systems for Sustainable Forest Management in the Mountains”, Ossiach, Austria, 18–24 June 2001; pp. 63–68. [Google Scholar]
  20. Košir, B. Optimal line lengths when skidding wood with the syncrofalke cable crane in slovenian conditions. In Proceedings of the Workshop Proceedings “New Trends in Wood Harvesting with Cable Systems for Sustainable Forest Management in the Mountains”, Ossiach, Austria, 18–24 June 2001; pp. 63–68. [Google Scholar]
  21. Niskanen, A.; Lunnan, A.; Ota, I.; Blatner, K.; Herbohn, J.; Bull, L.; Ferguson, I.; Hickey, G. Policies affecting forestry entrepreneurship. Small Scale For. 2007, 6, 233–255. [Google Scholar] [CrossRef]
  22. Picchio, R.; Maesano, M.; Savelli, S.; Marchi, E. Productivity and energy balance in the conversion into high forest system of a Quercus cerris L. coppice in Central Italy. Croat. J. Forest. Eng. 2009, 30, 15–26. [Google Scholar]
  23. Schweier, J.; Blagojević, B.; Venanzi, R.; Latterini, F.; Picchio, R. Sustainability assessment of alternative strip clear cutting operations for wood chip production in renaturalization management of pine stands. Energies 2019, 12, 3306. [Google Scholar] [CrossRef] [Green Version]
  24. Spinelli, R.; Eliasson, L.; Han, H. A Critical Review of Comminution Technology and Operational Logistics of Wood Chips. Curr. For. Rep. 2020, 1–10. [Google Scholar] [CrossRef]
  25. Picchio, R.; Latterini, F.; Venanzi, R.; Stefanoni, W.; Suardi, A.; Tocci, D.; Pari, L. Pellet production from woody and non-woody feedstocks: A review on biomass quality evaluation. Energies 2020, 13, 2937. [Google Scholar] [CrossRef]
  26. Schweier, J.; Magagnotti, N.; Labelle, E.R.; Athanassiadis, D. Sustainability Impact Assessment of Forest Operations: A Review. Curr. For. Rep. 2019, 5, 101–113. [Google Scholar] [CrossRef] [Green Version]
  27. Gamborg, C.; Larsen, J.B. ‘Back to nature’—A sustainable future for forestry? For. Ecol. Manag. 2003, 179, 559–571. [Google Scholar] [CrossRef]
  28. Castellani, C. Tavole Stereometriche ed Alsometriche Costruite per i Boschi Italiani; Istituto Sperimentale per l’Assestamento Forestale e per l’Alpicoltura Publishing: Trento, Italy, 1984. [Google Scholar]
  29. Bjorheden, R.; Apel, K.; Shiba, M.; Thompson, M.A. IUFRO Forest Work Study Nomenclature; Swedish University of Agricultural Sciences: Uppsala, Sweden, 1995. [Google Scholar]
  30. Bergstrand, K.G. Planning and analysis of forestry operation studies. Skogsarb. Bull. 1991, 17, 63. [Google Scholar]
  31. Miyata, E.S. Determining Fixed and Operating Costs of Logging Equipment. In General Technical Report NC; North Central Forest Experiment Station: Saint Paul, MN, USA, 1980; p. 55. [Google Scholar]
  32. Baldini, S.; Picchio, R.; Savelli, S. Analisi energetica nelle utilizzazioni di un ceduo di eucalipto con una meccanizzazione leggera. J. Agric. Eng. 2007, 3, 49–56. [Google Scholar]
  33. Bodaghi, A.I.; Nikooy, M.; Naghdi, R.; Venanzi, R.; Latterini, F.; Tavankar, F.; Picchio, R. Ground-based extraction on salvage logging in two high forests: A productivity and cost analysis. Forests 2018, 9, 729. [Google Scholar] [CrossRef] [Green Version]
  34. Hartsough, B. Economics of harvesting to maintain high structural diversity and resulting damage to residual trees. West J. Appl. For. 2003, 18, 133–142. [Google Scholar] [CrossRef] [Green Version]
  35. Christie, C.J. Relationship between energy intake and expenditure during harvesting tasks. Occup. Ergon. 2008, 8, 1–10. [Google Scholar]
  36. Christie, C.J.-A. Improving the energy and fluid balance of workers involved in harvesting tasks. Occup. Ergon. 2010, 9, 119–126. [Google Scholar] [CrossRef]
  37. Balimunsi, H.; Grigolato, S.; Picchio, R.; Nyombi, K.; Cavalli, R. Productivity and energy balance of forest plantation harvesting in Uganda. For. Stud. China 2012, 14, 276–282. [Google Scholar] [CrossRef]
  38. Canagaratna, S.G.; Witt, J. Calculation of temperature rise in calorimetry. J. Chem. Educ. 1988, 65, 126–129. [Google Scholar] [CrossRef]
  39. Klvac, R.; Fischer, R.; Skoupy, A. Energy use and emissions from the medium distance cableway system operation phase. Croat. J. Forest. Eng. 2012, 33, 79–88. [Google Scholar]
  40. Athanassiadis, D. Energy consumption and exhaust emissions in mechanized timber harvesting operations in Sweden. Sci. Total Environ. 2000, 255, 135–143. [Google Scholar] [CrossRef]
  41. Vusić, D.; Šušnjar, M.; Marchi, E.; Spina, R.; Zečić, T.; Picchio, R. Skidding operations in thinning and shelterwood cut of mixed stands—Work productivity, energy inputs and emissions. Ecol. Eng. 2013, 61, 216–223. [Google Scholar] [CrossRef]
  42. Spinelli, R.; Visser, R. Analyzing and estimating delays in wood chipping operations. Biomass Bioenerg. 2009, 33, 429–433. [Google Scholar] [CrossRef]
  43. Picchio, R.; Spina, R.; Sirna, A.; Monaco, A.L.; Civitarese, V.; Del Giudice, A.; Suardi, A.; Pari, L. Characterization of woodchips for energy from forestry and agroforestry production. Energies 2012, 5, 3803–3816. [Google Scholar] [CrossRef]
  44. Avolio, S.; Baldini, S.; Spinelli, R. Prove di meccanizzazione in diradamenti di pinete artificiali di pino laricio nella pre-Sila di Cosenza (Mechanization tests in thinning of plantations of Corsican pine (Pinus nigra Arn. var. laricio) in pre-Sila Cosenza province). Ann. Dell Ist. Sper. 1989, 20, 503–548. [Google Scholar]
  45. Baldini, S.; Picchio, R. Primo diradamento con messa a punto di nuove metodologie di lavoro in una pineta dei Cimini (Setting up of new working methods for first thinning in a pine stand in Cimini mountains). Linea Ecol. 2001, 6, 47–54. [Google Scholar]
  46. Neri, F. Produttività in diradamenti di pino nero nel complesso forestale “Alpe di Catenaia” (AR). Sherwood. For. Alberi Oggi 2004, 100, 23–29. [Google Scholar]
  47. Fabiano, F.; Piegai, F. Diradamenti in impianti artificiali di conifere. Produttività e costi con produzione di cippato. Sherwood. For. Alberi Oggi 2007, 136, 23–29. [Google Scholar]
  48. Zimbalatti, G.; Proto, A.R. Cable logging opportunities for firewood in Calabrian forests. Biosyst. Eng. 2009, 102, 63–68. [Google Scholar] [CrossRef]
  49. Baldini, S.; Calvani, P.; Picchio, R. Winch uses in work with extra light cable system in Centre South of Italy, atti del Convegno internazionale. In New Trends in Wood Harvesting with Cable Systems for Sustainable Forest Management in the Mountains; Organizzato dal comitato FAO/ECE/ILO: Ossiach, Austria, 2003; pp. 149–160. [Google Scholar]
  50. Nieuwenhuis, M.; Lyons, M. Health and Safety Issues and Perceptions of Forest Harvesting Contractors in Ireland. Int. J. For. Eng. 2002, 13, 69–76. [Google Scholar] [CrossRef]
  51. Montorselli, N.B.; Lombardin, C.; Magagnotti, N.; Marchi, E.; Neri, F.; Picchi, G.; Spinelli, R. Relating safety, productivity and company type for motor-manual logging operations in the Italian Alps. Accid. Anal. Prev. 2010, 42, 2013–2017. [Google Scholar] [CrossRef] [PubMed]
  52. Scott, P.A.; Christie, C.J. An indirect method to assess the energy expenditure of manual labourers in situ. S. Afr. J. Sci. 2004, 100, 694–698. [Google Scholar]
  53. Picchio, R.; Sirna, A.; Sperandio, G.; Spina, R.; Verani, S. Mechanized harvesting of eucalypt coppice for biomass production using high mechanization level. Croat. J. Forest. Eng. 2012, 33, 15–24. [Google Scholar]
  54. Yoshioka, T.; Aruga, K.; Nitami, T.; Kobayashi, H.; Sakai, H. Energy and carbon dioxide (CO2) balance of logging residues as alternative energy resources: System analysis based on the method of a life cycle inventory (LCI) analysis. J. Fort. Res. 2005, 10, 125–134. [Google Scholar] [CrossRef]
  55. Valente, C.; Spinelli, R.; Hillring, B.G. LCA of environmental and socio-economic impacts related to wood energy production in the alpine conditions: Valle di Fiemme (Italy). J. Clean. Prod. 2011, 19, 1931–1938. [Google Scholar] [CrossRef]
  56. Ecoinvent 2012, Ecoinvent—Swiss Centre for LCI. Available online: https://www.ecoinvent.org (accessed on 3 June 2020).
  57. ProBas 2012. Available online: http://www.probas.umweltbundesamt.de (accessed on 3 June 2020).
  58. Gonzàles-Garcìa, S.; Berg, S.; Feijoo, G.; Moreira, M.T. Environmental impacts of forest production and supply of pulpwood: Spanish and Swedish case studies. Int. J. Life Cycle Assess 2009, 14, 340–353. [Google Scholar] [CrossRef]
  59. Corona, P.; Ascoli, D.; Barbati, A.; Bovio, G.; Colangelo, G.; Elia, M.; Garfì, V.; Iovino, F.; Lafortezza, R.; Leone, V.; et al. Integrated forest management to prevent wildfires under mediterranean environments. Ann. Silvic. Res. 2015, 39, 1–22. [Google Scholar]
Figure 1. Nonlinear regression analysis for the two yarder lines, referred to the extraction time in relation to the extracted volume and extraction distance, with Savall carriage on the left and with Maxwald carriage on the right.
Energies 13 05376 g001
Figure 2. Average bunching—extraction productivity (bars) and possible increase of performance (lines) from SMH to PMH.
Energies 13 05376 g002
Figure 3. Energy inputs categories in forestry logging operations, data reported in percentage referred to the total inputs and detailed data are reported in MJ/m3 for every category and showed in the figure.
Energies 13 05376 g003
Figure 4. Percentage distribution of total emission in forestry logging yards for single operation, reported in CO2 equivalent, shared in direct and indirect process.
Energies 13 05376 g004
Table 1. Dendrometric characterization of the stand studied, average results obtained from 16 sampling plots (average ± standard deviation). Different letters indicate significant differences between averages by t test with p-value < 0.05.
Dendrometric
Characteristic
UnitBefore
Thinning
After
Thinning
Densitytrees ha−11326 ± 48a 472 ± 13b
Basal Aream2 ha−145.3 ± 2.6a16.0 ± 1.5b
DBHcm20.3 ± 1.8a20.5 ± 1.1a
Tree heightm16.2 ± 1.9a16.4 ± 1.1a
Tree volumem30.353 ± 0.058a0.350 ± 0.035a
Branch mass% total18.2 ± 2.6a18.3 ± 2.0a
Stand stockingm3 ha−1468 ± 28a165.2 ± 10b
Annual yieldm3 ha−1 year−114.2-
Table 2. Models and technical characteristics of the applied machines in the felling and extraction of marked trees from thinning operation.
MachineChainsawTractorChipperMachineWinchMachineCable Yarder System
ModelHusqvarna 346 XPNew Holland TK4.80NPezzolato PTH 700/660ModelSAVALL 80 kNModelSAVALL 1500MAXWALD
Displacement (cm3)5034006500Winch max pull (kN)80Nominal maximum payload (kN)1.51.0
Engine power (kW)2.755126Winch pull for cable yarder (kN)45Mainline rope diameter of 14 mm (m)200200
Mass (kg)637008200Mass (kg)720Carriage mass (kg)8040
Engine typeGasoline mixDieselDieselPulling rope diameter of 9 mm (m)250Mainline rope mass (kg)250250
Table 3. Dendrometric parameter of the tree harvested, average results obtained from 15 trees per line. ANOVA analysis applied only on DBH and tree volume (d.f. 15, 224), p > 0.05 (average ± standard deviation).
ParameterUnitValue
Tree intensitytrees ha−1854 ± 18
DBHcm20.9 ± 1.7
Heightm16.3 ± 2.2
Volumem3 tree−10.355 ± 0.058
Fresh mass per treet tree−10.320 ± 0.062
Dry mass per treet tree−10.190 ± 0.089
Total felled volumem3 ha−1302.8 ± 24.1
Total felled fresh masst ha−1272.9 ± 15.2
Total felled dry masst ha−1162.1 ± 12.1
Table 4. Technical description (average ± standard deviation) of the wood extraction lines in two logging systems.
ParameterSemi-Automatic Carriage (Savall)Mobile Pulley Carriage (Maxwald)
Line length (m)165 ± 25160 ± 27
Effective operative line length (m)146 ± 16145 ± 11
Line slope (%)47 ± 1145 ± 10
Span for line 22
Table 5. Emission factors of compression–ignition engines (C) and spark–ignition engines (S) in wheeled tractors as related to engine output power (kg kWh−1) [39,40,41]. Conversion from kWh to MJ: 1 kWh = 3.6 MJ; PM10—particular matters up to 10 microns and less; VOCs—volatile organic compounds.
Pollutant
(g MJ−1)
Wheeled Tractor
CS
CO2263263
CO9.84 × 10−31.90 × 10⁻¹
Formaldehyde3.78 × 10−43.41 × 10−4
NOX1.60 × 10−28.54 × 10⁻³
PM101.70 × 10−34.84 × 10⁻⁴
SO21.14 × 10−33.04 × 10⁻⁴
VOCs2.36 × 10−37.16 × 10⁻³
Table 6. Time and productivity of felling operation (average ± standard deviation).
UnitValue
Worker3
Machinery1
Trees11,102
Approach to the tree timemin 0.25 ± 0.19
Preparation of the felling site time0.16 ± 0.10
Felling time0.45 ± 0.26
Delays hours39.86
PMH159.10
SMH199.96
Delay Factor%25.1
Productivity with PMH m3PMH−124.74
t PMH−1 (fresh matter)22.29
t PMH−1 (dry matter)13.24
Productivity with SMH m3SMH−119.78
t SMH−1 (fresh matter)17.83
t SMH−1(dry matter)10.59
Notes: PMH = Productive Machine Hours, excluding delays (net cycle time); SMH = Scheduled Machine Hours, including delays (total cycle time); DF = Delay Factor, i.e., delay time/net time [42].
Table 7. Time and productivity of bunching—extraction operation (average ± standard deviation) in two logging systems, and results of MANOVA test.
UnitSAVALLMAXWALDp-Value
Worker33-
Trees56365466>0.05
Working cycles34583416<0.05
Time for line of survey and logisticmin 98.38 ± 16.1298.38 ± 16.12-
Time for line of assembly and disassembly285.15 ± 21.28277.50 ± 18.12-
Time carriage travel unloaded0.69 ± 0.220.75 ± 0.24<0.05
Choking time1.28 ± 0.481.42 ± 0.34<0.05
Time carriage travel loaded1.86 ± 0.581.84 ± 0.32>0.05
Unchoking time0.99 ± 0.291.05 ± 0.17>0.05
Bunching distancem9.40 ± 5.1610.10 ± 3.11>0.05
Extraction distance44.42 ± 30.0143.55 ± 20.15>0.05
Trees per cycle1.63 ± 0.671.60 ± 0.38>0.05
Delayshours92.1087.40-
Productive Machine Hours (PMH)328.90338.20-
Scheduled Machine Hours (SMH)421.10425.60-
Delay Factor%28.025.8-
Productivity with PMH systemm3PMH−16.085.73-
t PMH−1 (fresh matter)5.485.16-
t PMH−1 (dry matter)3.253.07-
Productivity with SMH systemm3SMH−14.754.55-
t SMH−1 (fresh matter)4.284.10-
t SMH−1 (dry matter)2.542.44-
Notes: PMH = Productive Machine Hours, excluding delays (net cycle time); SMH = Scheduled Machine Hours, including delays (total cycle time); DF = Delay Factor, i.e., delay time/net time [42].
Table 8. Time and productivity of chipping (average ± standard deviation).
UnitValue
Worker1
Machinery1
Trees11,102
Average chipping time for treemin ± SD0.18 ± 0.09
Average hydraulic crane time movements for tree0.20 ± 0.11
Delays hours11.17
Productive Machine Hours (PMH)71.85
Scheduled Machine Hours (SMH)83.02
Delay Factor%15.5
Productivity with PMH systemm3PMH−154.86
t PMH−1 (fresh matter)49.45
t PMH−1 (dry matter)29.36
Productivity with SMH systemm3SMH−147.48
t SMH−1 (fresh matter)42.80
t SMH−1(dry matter)25.41
Notes: PMH = Productive Machine Hours, excluding delays (net cycle time); SMH = Scheduled Machine Hours, including delays (total cycle time); DF = Delay Factor, i.e., delay time/net time [42].
Table 9. Machine costs (analytical), fixed, variable, and total operating costs (the Italian cost is referred to in the year 2019).
DescriptionMUChainsawTractorSavall Yarder LineMaxwald Yarder LineChipper
Investment cost100042,00035,00021,00058,000
Service lifeYears210101010
Annual useH8001000800800800
Recovery value20084007000420011,600
Interest on capital%33333
Fuel consumptionl h−10.982.00002.50
Fuel price€ l−12.00.8000.8
Lubricant cost% of fuel cost20250030
Labor cost€ h−11515151515
Crew31221
Fixed costs
Depreciation€ year−14003360280016804640
Interest€ year−1248066724031114
Insurance and tax€ year−140134411206721856
Yearly fixed costs€ year−14645510459227557610
Hourly fixed costs€ h−10.585.515.743.449.51
Variable costs
Fuel€ h−11.961.60002.00
Lubricant€ h−10.390.40000.60
Repair and maintenance€ h−10.503.363.502.105.80
Workers€ h−145.0015.0030.0030.0015.00
Hourly variable cost€ h−147.8520.3633.5032.1023.40
Operating cost€ h−148.4325.8739.2435.5432.91
Profit and overhead%1010101010
Profit and overhead€ h−14.842.593.923.553.29
Total operating cost€ h−153.2828.4643.1639.1036.20
Table 10. Operation productivity and costs for single operation and total costs referred to one cubic meter or to one dry ton of wood from whole tree roadside.
DescriptionMUFellingExtraction SavallExtraction MaxwaldChippingTotal SavallTotal Maxwald
Real unit cost (SMH)€ m−32.6915.0814.850.7618.5318.30
Hypothetical unit cost (PMH)€ m−32.1511.7811.790.6614.5914.60
Real unit cost (SMH)€ td.m.5.0328.2027.691.4234.6534.14
Hypothetical unit cost (PMH)€ td.m.4.0222.0422.011.2327.2927.26
Table 11. Wood chips characterizations from Picchio et al. [43], average values ± standard deviation.
TypesCodeSamplesFiber %Bark %Twigs %Other %
FTSP. nigra2077.4 ± 7.015.1 ± 5.12.9 ± 1.04.6 ± 0.9
Oversize %Acceptable %Fines %
0.5 ± 0.191.7 ± 2.07.8 ± 1.3
HHV MJ/kgd.m.Ash %d.m.C %dafN %dafH %daf
20.4 ± 0.60.6 ± 0.250.0 ± 1.20.2 ± 0.16.3 ± 0.4
Table 12. Total energy inputs and balance in forestry logging yards.
DescriptionM.U.Energetic OutputDirect InputIndirect InputHuman Labor InputTotal InputsOutput/Inputs RatioSystem Efficiency
Savall yardMJ/m312,444112.7711.521.56125.8498.999.0%
MJ/td.m.20,400184.8718.882.55206.30
Maxwald yardMJ/m312,444116.2111.631.61129.4596.199.0%
MJ/td.m.20,400190.5019.072.64212.21
Table 13. Total emission in forestry logging yards, shared in fuel and oil origins.
SavallMaxwald
CO2COHCNoxPM10CO2COHCNoxPM10
g td.m.−1g td.m.−1
Efc fuel3040.361.30.363.411.53106.262.70.465.611.6
Efp fuel198.80.30.61.40.1201.40.40.61.50.2
Total fuel3239.161.60.964.811.63307.663.10.967.111.9
Eop lubricant3.2940.0030.0060.0390.0073.2620.0030.0060.0380.007
Eor lubricant0.7630.0020.0000.0040.0010.7460.0020.0000.0040.001
Total lubricant4.0570.0050.0070.0430.0084.0080.0050.0060.0420.007
Total3243.261.60.964.911.63311.663.11.067.211.9
(g m−3)(g m−3)
Total1735.133.00.534.76.21771.733.80.535.96.4
Table 14. Total emission in forestry logging yards, for single operation and yard, reported in CO2 equivalent, shared in direct and indirect process.
FellingSavall—Bunching/ExtractionMaxwald—Bunching/ExtractionChippingSavall YardMaxwald Yard
kgCO2eq. td.m.−1
Direct inputs1.02.42.64.17.57.7
Indirect inputs0.33.94.23.47.67.9
Total1.36.36.87.515.115.6
Publisher’s Note: MDPI stays neutral with regard to jurisdictional claims in published maps and institutional affiliations.

