1. Introduction
This paper presents a mathematical model for the maximization of small-scale distributed generation (DG) into existing distribution networks (DNs). In multiple cases, the power generated by DG can result in significant operation condition changes of DN causing expensive capital investments in power system equipment and grid. To avoid such scenarios in a manner to facilitate DG penetration into the grid the model maximizes the integration of multiple DGs into the existing DN by using available active power management tools.
The DG connection into DN has become a vital option considering fighting climate changes, a lack of energy worldwide, and power production diversification. Investments in small-scale DG should increase in systems that allow its penetration. The use of traditional methods and tools for DN planning can significantly decrease DN hosting capacity and jeopardize power quality constraints. Hence, high penetration of DG into the DN has to be carefully planned and implemented by using technical and economic planning strategies.
Determination of maximal possible DG penetration into the distribution grids refers to the so-called maximum hosting capacity problem, which can be solved by using optimization tools and different methods. The maximum hosting capacity and DG allocation can be used for solving various problems that are recognized in the distribution system including power loss and energy loss minimization, hosting capacity maximization, voltage profile improvements, reliability enhancement, etc. Authors in [
1,
2,
3,
4] investigate the possibility of optimal allocation and sizing of DGs to reduce power losses. Photovoltaic (PV) allocation considering optimal grid reconfiguration for power loss reduction is also presented in [
5]. In [
6], the benefit of DGs allocation is assessed to evaluate the cost of energy losses in DN by using the variable cost of energy. Authors in [
7] define the DG allocation optimization problem while considering a multiobjective approach based on cost and benefits related to energy loss costs, system reliability, and cost of purchased energy from transmission grids. Papers with a focus on voltage stability enhancement and loss minimization by taking into account different types of DGs are presented in [
8] that are based on the modal analysis and continuation power flow in [
9]. In [
10] authors presented a practical methodology to determine the dynamic hosting capacity for voltage variations due to power injections and harmonics introduced by distributed energy resources. The authors analyze the change of the levels of harmonic distortions and voltage profile change over a specific time period and its effect on network hosting capacity. Authors in [
11] introduced an approach to determine suboptimal energy storage allocation based on voltage profile improvement, which prevents power quality deterioration and allows higher DGs penetration.
Many authors are solving maximum hosting capacity by putting DGs size and allocation as a primary objective function and using the DN flexibility for improving its hosting capacity. In [
12] the second-order cone programming method is used for the maximization of PV capacity. In the method that uses genetic algorithms (GAs) optimal hosting capacity is maximized by introducing optimal network reconfiguration. Variation of the DG output is not considered in this method [
13]. The heuristic approach is presented in [
14] to optimize reconfiguration along with the size and DGs location. A mathematical method based on second-order cone programming is presented in [
15]. In this paper, the authors considered topological reconfiguration as the only possible DN flexibility and compare the obtained results with previously fixed topology. The mixed-integer linear programming has been used in [
16] for DN reconfiguration with possible connectors for DGs in all DN points. Authors in [
17] propose a method for optimal placement DGs by using the loss sensitivity factor method. A multiobjective evolutionary algorithm is proposed by authors in [
18] for the sizing and determination of the good locations for DGs by minimizing different functions such as the cost of energy losses, cost of service interruptions, the cost of network upgrading, and the cost of energy purchased. In [
19] authors propose a multiperiod AC optimal power flow based technique for maximization of grid hosting capacity, which considers flexibilities such as voltage control and energy curtailment. In [
20] the authors introduce streamlined capacity analysis, which provides a fast technique to calculate an impact from small-scale photovoltaics. Static and dynamic reconfiguration is applied in [
21] for a multiperiod optimal power flow approach, which is used to assess DGs hosting capacity increment. Authors in [
22] propose a maximum hosting capacity evaluation method while considering robust optimal operation and control of on-load tap changer transformers (OLTC) and static VAR compensators.
According to the previous insight in the existing literature, optimization methods for optimal allocation and sizing of DGs are various and include analytical methods, numerical methods, and heuristic methods [
23]. Characteristics of analytic methods are their easy implementation and execution, but their results are often only indicative. On the other side numerical methods like nonlinear programming and linear programming usually have better convergence characteristics and can guarantee the determination of global optimum in the case of convex optimization problems. However mathematical programming methods are sometimes not suitable for complex DN and multiperiod programming due to a large number of binary variables in certain approaches. Third, heuristic methods are robust and can provide near optimum results for complex optimization problems [
23].
Most of the approaches proposed so far, that address the grid hosting capacity problem, usually consider only a partial set of possible control options. Additionally, these approaches are usually defined as mixed-integer nonlinear optimization problems or they use metaheuristics methods to solve the optimization problem. Given the nature of the optimization problem formulation or the method used for the solution of the problem, such approaches cannot guarantee the detection of a global solution. For example, the approach proposed in [
21] cast the grid hosting capacity problem as a mixed-integer nonlinear optimization problem while not considering OLTC or optimal DG allocation in the formulation. Their approach regarding radiality constraints may be insufficient to ensure radiality in grids where there are some zero-injection nodes. Similar goes for the approach used in [
16] with the difference that the model is cast as MILP. In addition to that previously mentioned, both of the approaches do not consider multiple operating scenarios derived from real measured data but rather use only the single worst-case scenario for the assessment. Other approaches that were mentioned in the literature overview in addition to the previous do not consider network reconfiguration.
Other approaches that use metaheuristic methods for example [
3,
4,
6], etc. are not suitable to effectively handle the complexity of the model when all control/simulations options (multiscenario, optimal DG allocation and install capacity determination, topology optimization, DG power factor control, and OLTC operation) are taken into account.
From the literature review, it is obvious that there are many methods used for solving the DN hosting capacity problem. When using an approach based on mathematical programming it is very important, like in every other optimization method, to achieve a good convergence rate with low computational requirements. That is why the most mathematical programming models, which are used cannot be implemented in a complex DN and for multiperiod programming. The mathematical programming method based on the SOCP approximations proposed in this paper help to solve some of these issues. Hence, this paper involves effective discretization of time series data (consumption and DG production) by introducing multiperiod fragments thus giving insight into possible operating demand/production scenarios. Significant improvements, in terms of multiperiod optimization and network flexibilities, are achieved by time discretization and by including different network flexibilities (power factor control, OLTC control, and topology reconfiguration) within the hosting capacity optimization problem.
This paper has two significant contributions. First, it gives a possibility for taking into account multiple operating scenarios. This mathematical method is generalized and can be applied for multiperiod optimization (hourly and daily), but this would lead to inconvenient computational time, which is surpassed with scenarios discretization. The other contribution is related to the integration of proposed flexibilities, which allow increment in hosting capacity in existing DN by implementing flexibilities one at a time and combining them into one model. At the end of the paper, mathematical programming models are applied to the modified IEEE 33 bus test case to detect optimal network topology and DG capacity allocation by controlling the DG power factor, OLTC transformer operation, and grid topology configuration. The results are compared with the base model, which does not include any of the DN flexibilities.
2. Mathematical Formulation
The objective function is presented with the following formulation:
The first term appearing in the formulation of the objective function represents the possibility of the export of the energy between the interconnected grids. The second term represents the total install capacity of distributed generation and the third is related to active power losses. The objective function is followed by the set of constraints defined as:
Bus active and reactive power balance:
Branch voltage drop (higher-order terms in the expression for branch voltage drop are left out to linearize the expression):
Radial network constraints [
24]:
In the distribution networks, a large number of switching operations are even today done manually, given that most of the distribution network switchgear is not fully automatized and centrally controlled due to a lack of underlying communication infrastructure. In these networks, dynamic network reconfiguration is not an option given that every topology change would require a significant amount of time leaving certain consumers out of the operation. Given this, in the proposed model we did not consider dynamic network reconfiguration but a rather static reconfiguration. This means that we determined optimal network topology, which maximizes network hosting capacity, and this topology was kept constant in all considered operating scenarios. Optimal network topology was determined while also optimizing DG connection point and capacity. Modification of the proposed model to include dynamic network reconfiguration is a rather straightforward process that would additionally increase grid hosting capacity but probably not in the amount to apply such a complex operating procedure.
Given this, the proposed approach does not result in frequent network switchgear operation. Other control parameters considered in this paper, OLTC ratio and DG power factor control vary with load and DG production variations.
- 4.
DG connection and capacity constraints:
In real distribution networks, DSOs usually cannot force grid connection location upon DG investors to improve voltage stability if the DG unit is not the reason for the voltage stability problem. The DG investor, in the grid connection study, usually considers a couple of grid connection options and usually chooses the cheapest solution to maximize the profit. In the proposed mathematical model we define upfront the possible grid connection points for each DG unit separately. The number of possible grid connection points is arbitrary and the model allows one to consider each system bus as a potential connection point. Given that we simultaneously tried to maximize DG penetration, the model determines the optimal grid connection point and installed capacity. The model also reconfigures the network topology. Using these approaches, weak (critical) buses are correctly addressed with the model automatically because the algorithm will automatically “reshape” the network to tackle low voltage problems in parts of the grid due to high load or to tackle high voltage problems due to DG production. This is done through network reconfiguration (in the network segments, which are meshed) and optimal DG allocation in combination with OLTC control and DG power factor control.
- 5.
DG power factor constraints:
- 6.
On-load tap changer transformer constraints located in the interconnection substation [
25]:
The OLTC is an important and very expensive part of a power transformer and the main cause of power transformer failures. The OLTC probability failure can be directly linked to the number of switching operations so the frequent tap change operation significantly reduces the component lifetime. Given that the proposed model approximates real time-series data with a set of representative operating scenarios that are not inter temporally linked, it is not possible to restrict or assess the frequency of tap changer operation and its effect on component lifetime. Once the proposed model determines optimal DG connection points and capacity and optimal network topology, an additional optimization model that optimizes network operation (losses reduction and voltage profile improvement) could be used to assess and limit the frequency of the tap changer operation. In such a model the limitations regarding the frequency of tap changers could be explicitly stated. A previous study regarding this matter indicates that the slow voltage changes could be handled without the too frequent operation of OLTC given that most DG units are also capable of providing voltage support usually in the power factor range 0.95 leading/lagging. Additionally, voltage support requirement is initially reduced by network topology reconfiguration, which will reorganize load and production across feeders to improve element loading and bus voltages while considering the defined operational scenario set.
where:
—set of network buses,
—set of supply network buses,
—set of network lines,
—set of network lines available for reconfiguration,
—set of available scenarios,
—set of distributed generators,
—set of potential connection buses of distributed generator ,
—active/reactive load within scenario at bus ,
—active power generation of distributed generator at bus within scenario ,
—reactive power generation of distributed generator at bus within scenario ,
—maximum capacity of -th distributed generator,
—active/reactive power of supply point within scenario ,
—discrete variable indicating the connection status of the -th distributed generator to bus ,
—active power flow for line within scenario ,
—supply point voltage of substation within scenario ,
—the voltage at bus within scenario ,
—the resistance of line ,
—the reactance of line ,
—reactive power flow for line within scenario ,
—a large number,
—discrete switch variable for line ,
—continuous orientation variable for line ,
—distributed generator power factor at bus within scenario ,
/—minimal/maximal transformer ratio,
—OLTC transformer tap change,
—tap change position of OLTC transformer,
—maximal position of tap change,
—transformer ratio within scenario
—power capacity of the line .
2.1. Second-Order Cone Programming (SOCP) Approximations
The SOCP approximations aim to transform the nonlinear expressions, which are present in Equations (1) and (2) by the following substitutions:
Variables defined within equation set (9) are replaced into equation sets (2) and (3):
Furthermore, SOCP constraints are given with a set of formulation below:
Additional constraints are introduced to reflect restrictions related to power line capacity and bus voltage limits:
where:
—maximal power capacity of the line in p.u.,
—minimal/maximal voltage at bus .
This paper did not consider voltage improvements as the primary objective function but includes the bus voltage constraints to ensure the required voltage profile and power quality (Equations (11) and (14)) under a different set of operating scenarios. The voltage constraints are modeled as hard constraints that maintain normal voltage conditions for all considered operating scenarios regarding the different network load and DG production levels. The proposed model does not consider power quality issues related to harmonics injected by DG units and power electronics at grid interfaces. This factor can also be a limiting factor especially in weak distribution networks in which THD can be significantly affected by DG connection. To tackle THD and limit the levels at each system bus according to power quality standards, the model should include harmonic power flow calculation, which would complicate the model and significantly prolong the computational time.
2.2. Model Linearization of OLTC Transformer
Nonlinear OLTC transformer constraints formulated in (8) can be linearized by introducing additional binary variables [
25]. To linearize the OLTC model, we introduced the binary encoding of a tap position in the following manner:
where we had a new binary variable
. Given this, the OLTC transformer model in (8) can be reformulated into equation (14):
Considering the previous formulation and by introducing a new variable
and big number
, voltage formulation within OLTC transformer substation is defined as:
By these means, we obtained a linear mathematical model of the OLTC transformer.
Where:
—a big number,
—binary variable describing the position of tap change of OLTC transformer,
bin—length of the binary representation of tap change position of OLTC transformer,
—additional variable introduced to linearize nonlinear expression incurred by multiplying two variables.
2.3. Mixed-Integer Second-Order Cone Programming (MISOCP) Model
After the introduction of SOCP approximations and linearization of the OLTC transformer model, the complete set of equations used in this model is represented as follows:
By introducing (9) into (1), the objective function is given as:
subject to:
Node active and reactive power balance constraints given by the equation set (10).
Power flow, line current equations given by (12) and (13)
Voltage constraints defined by equation sets (11) and (14),
Radial constraints defined by equation set (4),
DG location constraints, capacity constraints, and power factor constraints defined by equations sets (5), (6), and (7),
OLTC transformer model constraints given with equation sets (16) and (17).
3. Case Study
3.1. Multiperiod Simulation and Scenario Selection
In most of the approaches, the maximum grid hosting capacity is determined while analyzing the worst-case scenario or by selecting a few representative scenarios of DG production/load consumption. This approach usually does not cover all possible operation scenarios, nor does it account for the probability or duration of scenarios.
In the proposed approach, the objective is to maintain a normal system operating state for the entire set of operating states considered in the model. Therefore, the input data used model is generalized considering the possibility of obtaining multiple operating conditions based on demand/production variations. Furthermore, this analysis does not take into account dynamic reconfiguration but rather gives a unique static topology solution, which is applied for all considered operation scenario set.
The input data for this case study is the time-series data of network load and DG production, which accounts for the correlation between these relevant parameters. Using this raw data in the optimization problem would introduce a large number of variables, which would result in high computational time. On the other hand, limiting the number of scenarios to only a few extreme cases does not account for the probability of a system operating state. The approach proposed here constructs blocks of scenarios using available time-series data based on a load/DG generation duration curves, which are constructed from available time-series data. Simulation is conducted based on real measured data related to wind power plant production, sun intensity, and network demand.
In the case study, we considered a few optimization models based on the level of the operational flexibilities, which are considered in the models. These submodels that do not consider all previously mentioned flexibilities could be easily derived from the proposed full optimization model by fixing the values of certain variables. Models implemented for comparison are defined as follows:
Base model—this submodel does not include any of the DN flexibilities stated in the proposed mathematical model. The model uses initial network radial topology, DG units operate with the unit power factor, and OLTC is fixed in a central position. Within this analysis, all the DN system flexibilities are excluded.
Model (a)—this submodel considers DGs power factor flexibility.
Model (b)—this submodel combines two flexibilities: DG power factor control and OLTC contribution for the solution of voltage rise/drop problem.
Model (c)—this case includes all three possible flexibilities: DN reconfiguration, power factor regulation, and OLTC transformer control.
The initial parameters of the simulation are given in
Table 1.
One of the most used network models for distribution grid analysis and simulation is the IEEE 33 bus test network. The network consists of 37 branches and 32 demand buses with one supply point. It contains 5 elementary loops and is presented in
Table 2 [
26]. The offline branches indicated in
Table 2 are related to the initial network radial topology. In this case study, we assumed that all branches are available for network reconfiguration if they are part of the network elementary cycles.
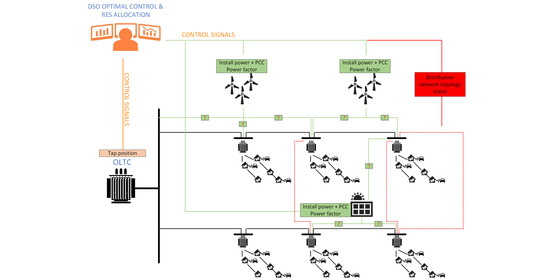
The full meshed modified IEEE 33 bus test network, with all possible DG connection points, is shown in
Figure 1. The maximum install capacity of all DG units (wind and solar) is 10 MW and for every DG unit, only one connection point can be realized.
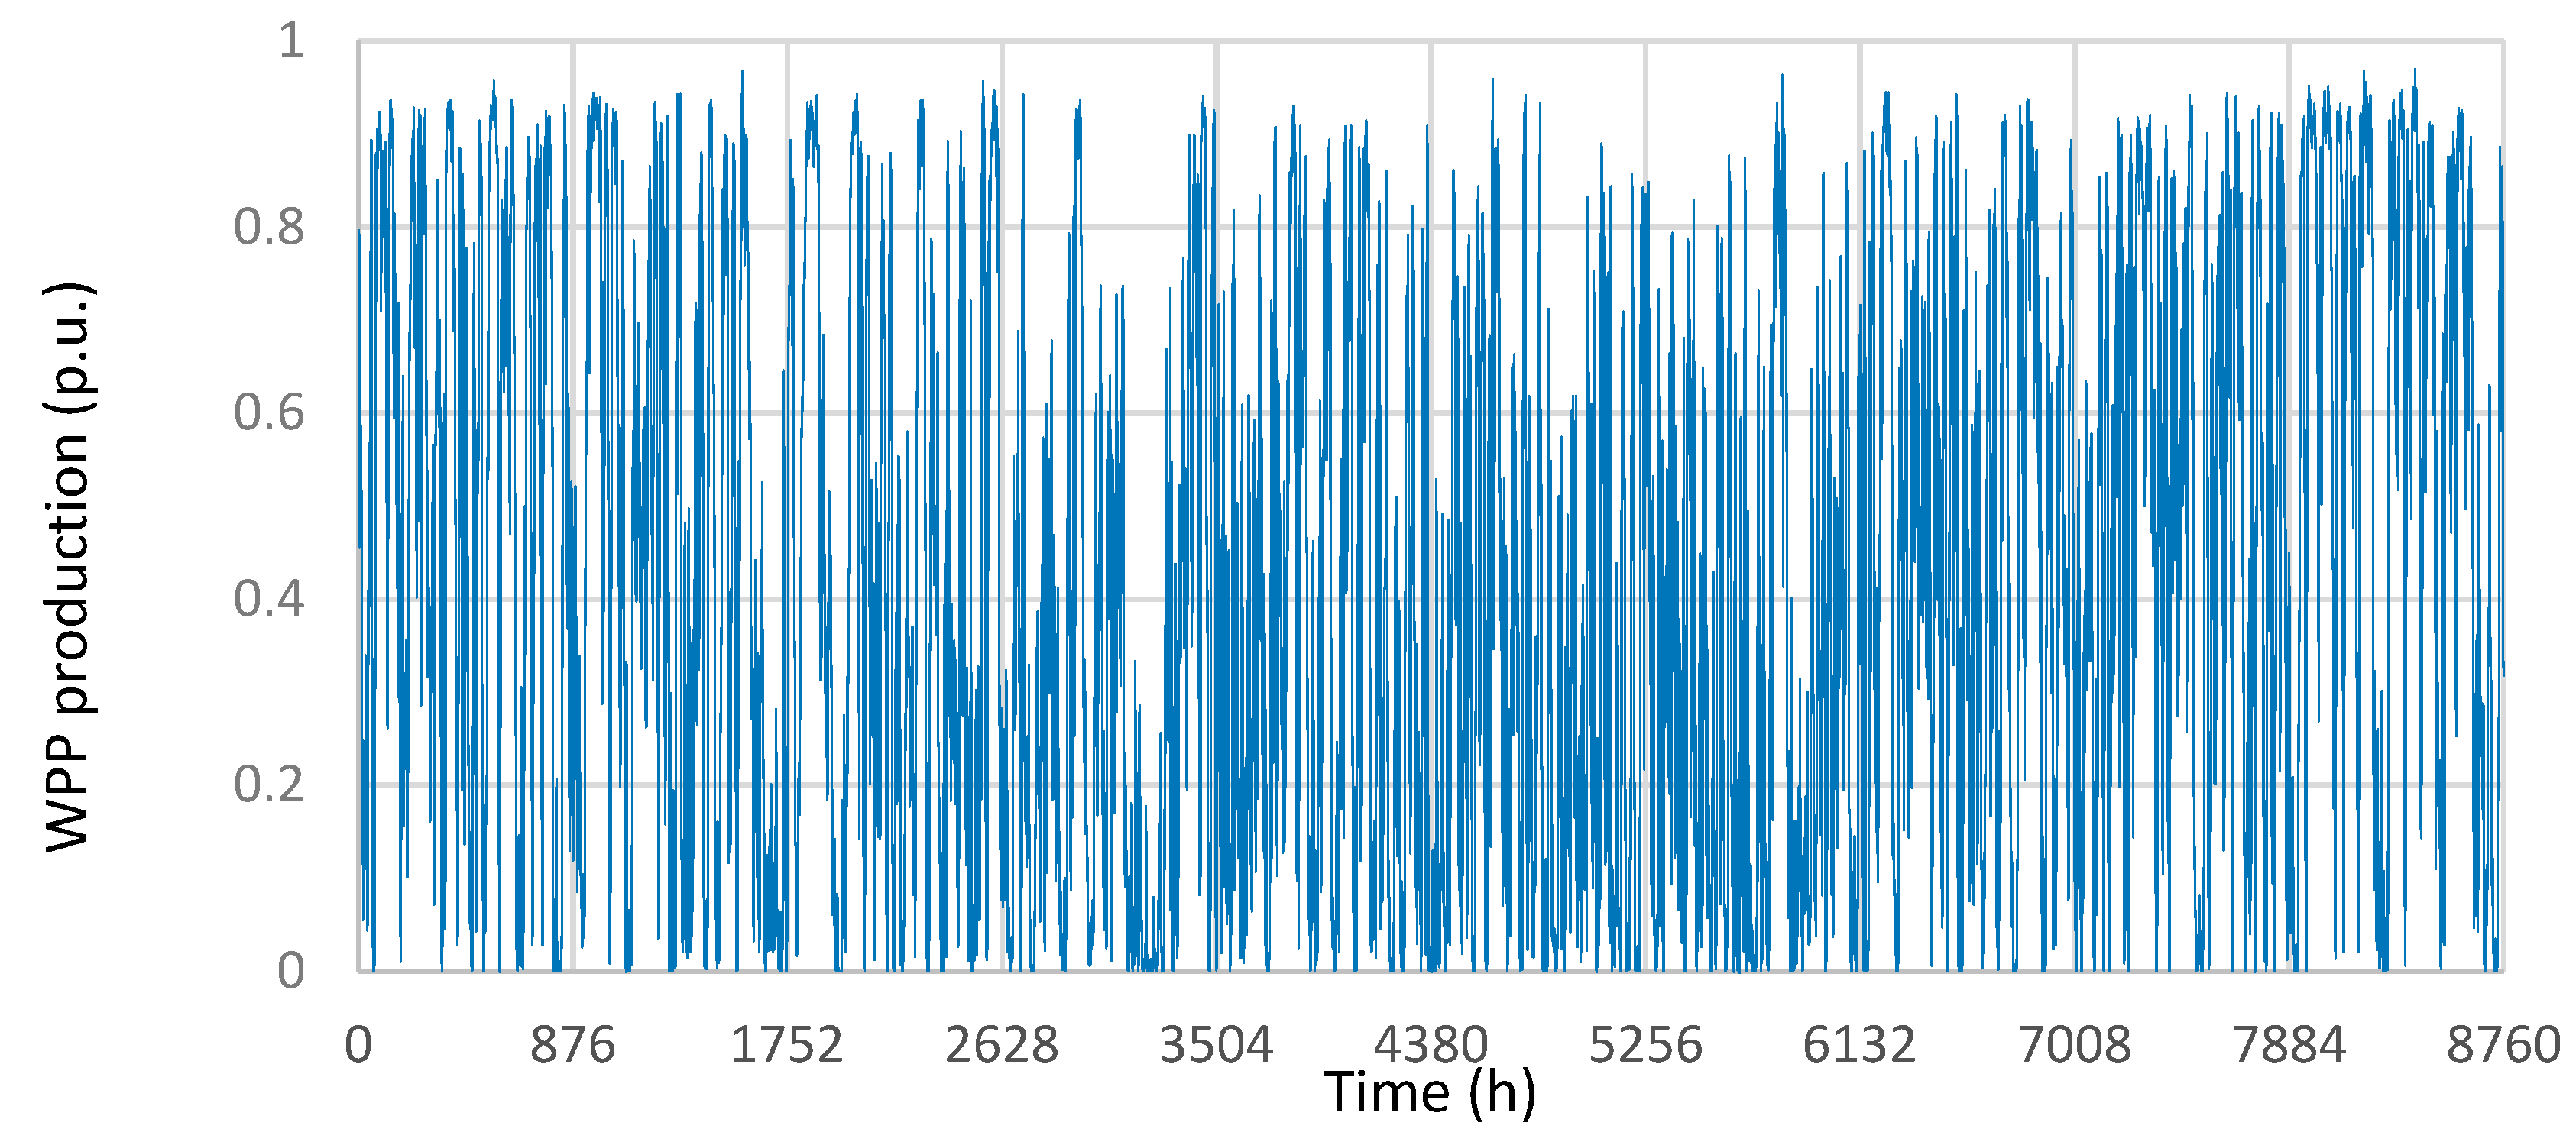
Figure 2 shows the wind power plant (WPP) and PV plant relative production for one year with an hourly resolution. This real time-series data together with network consumption data was used to construct a representative scenario set of operating scenarios that were used in the proposed model for maximization of network hosting capacity.
The available time-series data related to network consumption and normalized DG production is represented by its load/production duration curves [
27]. The load duration curve was used as a key for sorting DG production duration curves. In order to reduce the model computational burden, the load duration curve, solar power curve and wind power curve were divided into 4 demand/production blocks as shown in
Figure 3. The demand variations within each demand block were approximated by a set of scenarios, namely, high, average, and low. The DG production duration curve associated with each demand block was also approximated with a set of 3 scenarios, namely, high, average, and low. This way, originally measured time-series data was approximated by jointly considering the demand and DG levels, which in turn results with a representative set of 36 operating scenarios: three demand levels by three DG levels by four demand blocks (
Table 3). Using this clustering technique it is possible to maintain a correlation between network consumption and DG production data while significantly reducing the model computational burden. The number of levels, and blocks, can be differently defined to achieve a better approximation of original time-series data at the expense of computational time.
3.2. Implementation of the Mathematical Model and Results Discussion
To assess grid hosting capacity based on upper data settings, and provide adequate numerical results, we implemented a mixed-integer second-order cone programming (MISOCP) mathematical model described in the previous chapter in the general algebraic modeling system (GAMS) [
28] and solved underlying problems using CPLEX software (IBM, Armonk, NY, USA) [
29]. Tests were performed on a Windows machine equipped with an Intel Core i3 (2.27 GHz) processor and 4 GB of RAM. By implementing a mathematical model we obtained results that are presented in
Table 4.
We can see from the results shown in
Table 4 that considered submodels produce different results related to optimal DG allocation and capacity.
The base model, which did not include any of the considered flexibilities and was simulated for 36 different operating scenarios, reached a total hosting level of 10.444 MW. According to the results of the base model, the total hosting capacity was distributed as follows: WPP1 optimal install capacity was 1.54 MW with connection to bus 15, WPP2 optimal install capacity was 4.019 MW with connection to bus 28, and PVP optimal install capacity was 4.884 MW with connection to bus 21. Further increment of DG power, in this case, would lead to violation of DN operational constraints (bus voltage constraints would be violated in certain operating scenarios). This total hosting capacity represents the referent value for comparison with other submodels.
Model “a” considers the possibility of a DG power factor control in the range cosφ = 0.95 (leading/lagging), which leads to an increment of network hosting capacity to 12.935 MW with the highest increment of install power for WPP2 (optimal installed power increased by 1.274 MW). Model “b”, in addition to DG power factor control, considers the possibility of OLTC voltage control. Based on this submodel the limits for DG penetration were additionally increased to 13.75 MW, with the highest increase of install capacity for WPP2. Furthermore, in the submodel “c” we included the possibility of network reconfiguration in addition to DG power factor and OLTC control. By redistributing power from DGs through optimal power network topology modification while maintaining radial network operation, further increase of network hosting capacity can be achieved. To increase network hosting capacity the model suggests topology modification by switching offline branches 9, 16, 21, 25, and 33. In this case, we reached the maximal level of DG integration equal to 14.272 MW, making this approach the most convenient for the maximization of network hosting capacity. This level of DG penetration represents an increment of 37% compared to the base model.
Total network active power losses for different operating scenarios are shown in
Figure 4. The analysis shows an increase in power losses due to DG power penetration. It is interesting to note that network power losses were lower for submodel “c” in comparison with submodels “a” and “b” although total install DG capacity was higher. The reason for this is network topology optimization included in submodel “c”, which not only did it increase network hosting capacity but it also reduced network active power losses.
Figure 5 shows minimum/maximum bus voltage ranges for four different submodels and all considered operating scenarios. It is evident that the voltage level stayed within the limits in all operating scenarios. Moreover, the limiting factor for a further increment of network hosting capacity was visible from the figures and was directly related to the increase of the voltage in DG connection buses and adjacent grid at least in one scenario included in the simulation.
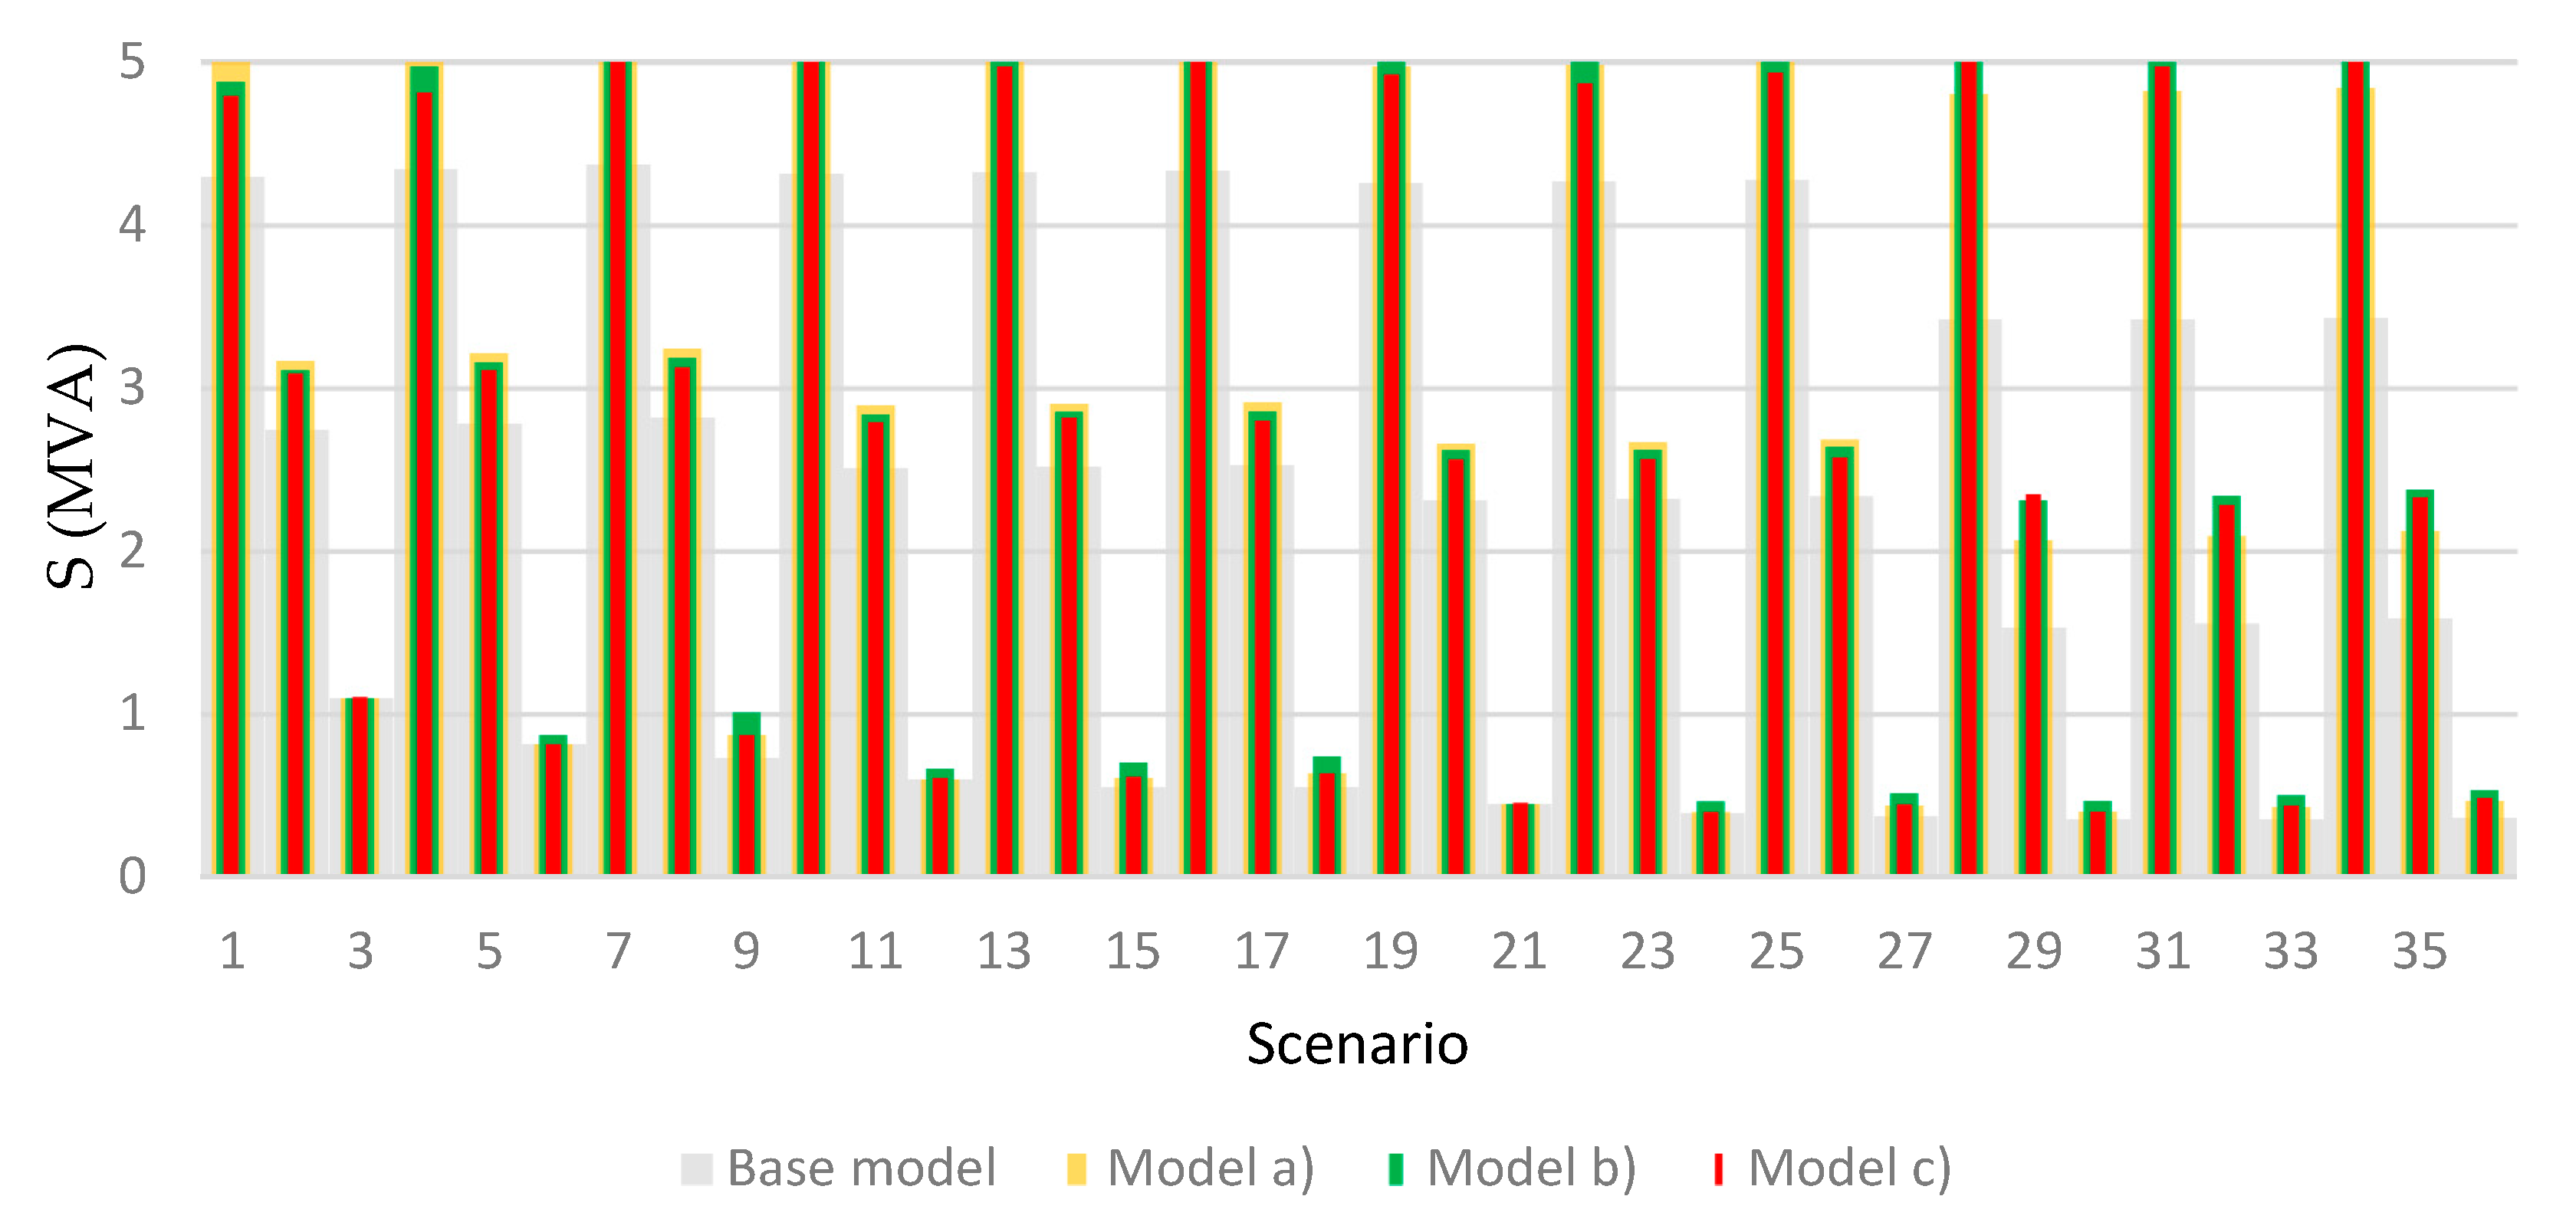
Figure 6 shows a comparison of maximal line loadings for power lines ‘1–17′ (maximal power rating 10 MVA) and in
Figure 7 for lines ‘18–37′ (maximal power rating 5 MVA) for all considered operating scenarios and four submodels. It is evident that upper power ratings of the lines were not surpassed but rather within the element power rating limits. Looking at the bus voltage results in parallel with the results of line loading it is obvious that in the base model main limitation factor for DG penetration was not connected with line overloading but rather to the voltage rise problem. Models “a”, “b”, and “c” on the other hand show limitations related both to voltage rise problems and line loading problems. In these models, upper loading limits of the power lines were reached making additional barriers along with the voltage level for further DG power penetration.


