Article

Modeling the Future California Electricity Grid and Renewable Energy Integration with Electric Vehicles

by
Florian van Triel
1,2,3,* and
Timothy E. Lipman
2
1
Department of Vehicle Mechatronics, Technical University of Dresden, 01069 Dresden, Germany
2
Transportation Sustainability Research Center, University of California-Berkeley, Berkeley, CA 94704, USA
3
BMW AG, Petuelring 130, 80788 Munich, Germany
*
Author to whom correspondence should be addressed.
Energies 2020, 13(20), 5277; https://doi.org/10.3390/en13205277
Submission received: 22 July 2020 / Revised: 19 September 2020 / Accepted: 30 September 2020 / Published: 12 October 2020
(This article belongs to the Special Issue Power Processing Systems for Electric Vehicles)

Abstract

:
This study focuses on determining the impacts and potential value of unmanaged and managed uni-directional and bi-directional charging of plug-in electric vehicles (PEVs) to integrate intermittent renewable resources in California in the year 2030. The research methodology incorporates the utilization of multiple simulation tools including V2G-SIM, SWITCH, and GridSim. SWITCH is used to predict a cost-effective generation portfolio to meet the renewable electricity goals of 60% in California by 2030. PEV charging demand is predicted by incorporating mobility behavior studies and assumptions charging infrastructure and vehicle technology improvements. Finally, the production cost model GridSim is used to quantify the impacts of managed and unmanaged vehicle-charging demand to electricity grid operations. The temporal optimization of charging sessions shows that PEVs can mitigate renewable oversupply and ramping needs substantially. The results show that 3.3 million PEVs can mitigate over-generation by ~4 terawatt hours in California—potentially saving the state up to about USD 20 billion of capital investment costs in stationary storage technologies.

1. Introduction

Electricity grids and electric vehicles (EVs) are co-evolving with technology advances and market developments in major industrialized areas. These advances include increasing use of renewable energy technologies that typically are low emission but also intermittent in their operation, growing markets for what is expected to be widespread adoption of EVs, and development of a host of smart-grid and “internet of things” technologies. Many nations, states, and regions around the world are experiencing and encouraging this transition. For example, California has over 600,000 plug-in EVs (PEVs), about half the amount in the United States (U.S.), and a goal of 5 million zero-emission vehicles (ZEVs) by 2030. ZEVs include vehicles with no direct tailpipe emissions, currently limited to battery-electric vehicles (BEVs) and hydrogen fuel-cell vehicles. PEVs also include plug-in hybrid vehicles that have duel electricity and gasoline (or other fuel) and combustion engine systems. The dual-fuel PEVs can be designed with different battery pack sizes and electrification levels to provide a lower or higher ratio of electric miles to those from fuel combustion, potentially achieving 80%–90+% of electrified miles with a robust electric-drive architecture component.

1.1. Policy Background

California has a goal of achieving emission reductions of greenhouse gases of 40% below 1990 levels by 2030 [1]. This goal aligns with the set goals of most countries in the European Union. For example, Germany aims to achieve an even higher goal of 40% by 2020 and 55% by 2030 [2]. To be able to successfully meet these commitments, the key industries of emitting these gases need to substantially transform the ways they operate. The transportation and electricity sectors, including their supporting industries such as gasoline production, are the dominant sources of greenhouse gases GHGs [3]. The state has also enacted a law for a complete transition to carbon-neutral electricity generation by 2045. Disruptive change in the transportation and electricity industries is inevitable and creates challenges that need to be solved in the near future.
California state agencies are working with other stakeholders to advance the ZEV market in California through a coordinated set of policy and regulatory actions [4]. This is being done in support of achieving a goal of 5 million ZEVs on California’s roads by the end of 2030 per Executive Order B-48-18. Table 1 below summarizes important policies and regulations to support ZEV adoption and clean energy in California [5,6].
Most important for this study is the California Senate Bill 100 legal requirement for the state to meet a 60% renewable portfolio standard (RPS) goal by 2030. The state intends to provide 100% carbon-free electricity by 2045 and is also charting a course for a 100% carbon-neutral transportation system by that same date. Additionally, the retirement of the Diablo Canyon nuclear power plant by 2025 is also an important change for this study, as the retired nuclear power will be replaced by carbon-free generators as mandated by state law in SB 1090 [7].

1.2. Previous Research

The research and modeling project documented here spans the areas of electricity grid modernization, renewable energy generation, EV market development, and consumer charging behavior. The previous work of most relevance for this study can be divided into three topics:
  • Predicting the electricity grid mix of generators in California for 2030 that will meet the 60% goal of RPS eligible electricity consumed in the state;
  • Simulating the electricity demand of PEVs in 2030 based on behavioral mobility studies of California residents, technology improvements of PEVs, and an increase in available private and public charging infrastructure and available power outputs;
  • Analyzing annual grid operations and optimizing the influence of PEV charging and vehicle-to-grid (V2G) on daily grid operations with focus on integrating renewable electricity to mitigate curtailment and ramping needs.
First, with regard to predicting future grid generation mixes, a study in 2014 [8] used the REFLEX model by Fraunhofer ISI [9], which was primarily developed for the European electricity grid, to investigate the impacts of different adoption scenarios of intermittent renewable generators through 2030. The study focused on a goal of 50% RPS-eligible electricity in the state. The main challenge identified in the report at even a level of 33% RPS eligible electricity, worsened at the 50% level, is the incorporation of excess renewable energy. Therefore, the need to extend infrastructure for storage and dispatching of flexible loads is important to enable the further increase of renewable generation resources connected to the grid.
With a newly established RPS goal of 60% renewable electricity in California for 2030 with SB-100 [10], there have yet to be published papers regarding the derivations for the electricity grid and the respective impacts on renewable energy curtailment in California. Previous work by Kammen et al. [11] investigated a model of the larger Western Electricity Coordinating Council (WECC) region that includes the neighboring states of California as well. However, the model was created in 2013 and examined an RPS goal of 33% by 2020. The studies from Fripp et al. for California [12] and Hawaii [13] models were also informative but also did not extend to these higher levels of projected renewable generation by 2030.
In 2018, Coignard et al. from Lawrence Berkeley National Laboratory (LBNL) investigated the impacts and potential of PEV charging to grid operations with focus on integrating renewables and mitigating grid operation risks in 2025 [14]. They used the V2G-Sim grid model to analyze the impact of both smart charging (V1G) and V2G on the California grid, with an eye toward mitigating ramp rates and filling in the daytime trough in net utility grid loads, after the renewable energy contribution is included as a “must take” resource. The paper considered a 2025 scenario with 500,000 BEVs and 1 million PHEVs in the state, and the ability of the vehicles to shave grid peaks, fill valleys in net load during the middle of the day and ease the steepness of grid ramp rates. The study concluded that the goals of the California storage mandate could be achieved with smart charging, with 4–5 times more capability for peak shaving, valley filling, and ramping mitigation with V2G-capable vehicles. The study calculates the power capability of grid services from V1G and V2G relative to the storage mandate requirements but does not quantify them economically.
Finally, a recent study by Szinai et al. [15] performed an analysis for 2025 in California that is similar to the study presented here but with a shorter timeframe. The study considers smart charging of PEVs but not V2G and uses PLEXOS-based modeling framework in conjunction with the LBNL BEAM model to analyze PEV charging load shifting with scenarios ranging from 950,000 to 2.5 million PEVs in California by 2025, with also a “reach” case of 5 million. These were assumed to be 60% BEVs and 40% PEVs. The study found estimated potential savings of USD 120 million (0.95 million PEVs) to USD 690 million (5 million PEVs) in California grid operating costs annually, and reduction potential for renewable energy curtailment of up to 40% relative to unmanaged charging of PEVs.
These studies all provide useful comparative insights in this area of investigation. The contribution of this study is to extend these other recent findings to a 2030 California grid case with 60% renewable energy for electricity generation in California and with both V1G and V2G considered. We note that there is also extensive V1G/V2G analysis relevant to this study produced by research organizations and consulting firms, but that has not been developed and made available in the peer reviewed literature. To our knowledge, there has not been a comparable research paper that incorporates the grid and EV smart charging and V2G elements in a single study to make detailed predictions on the impacts of PEVs through 2030 in the state of California. We further analyze the impacts of V1G/V2G on grid dispatch behavior of the entire year in an hourly resolution and calculate the avoided costs of stationary storage through improved implementation of these capabilities.

2. Materials and Methods

This investigation involved multiple steps related to data gathering, data cleaning, modeling work, results analysis, and documentation of findings. The general approach to modeling the impacts of PEV charging on the grid was the following:
  • Develop clean base-year electricity demand profiles from PEV charging demands;
  • Scale loads to 2030 demand forecast predictions;
  • Simulate 2030 PEV charging demand;
  • Run optimization software for 2030 grid investments;
  • Optimize managed charging profiles to mitigate curtailment of renewable generators and ramping-constraints resulting from the 2030 grid.
The research methodology is described in more detail in the following sections.

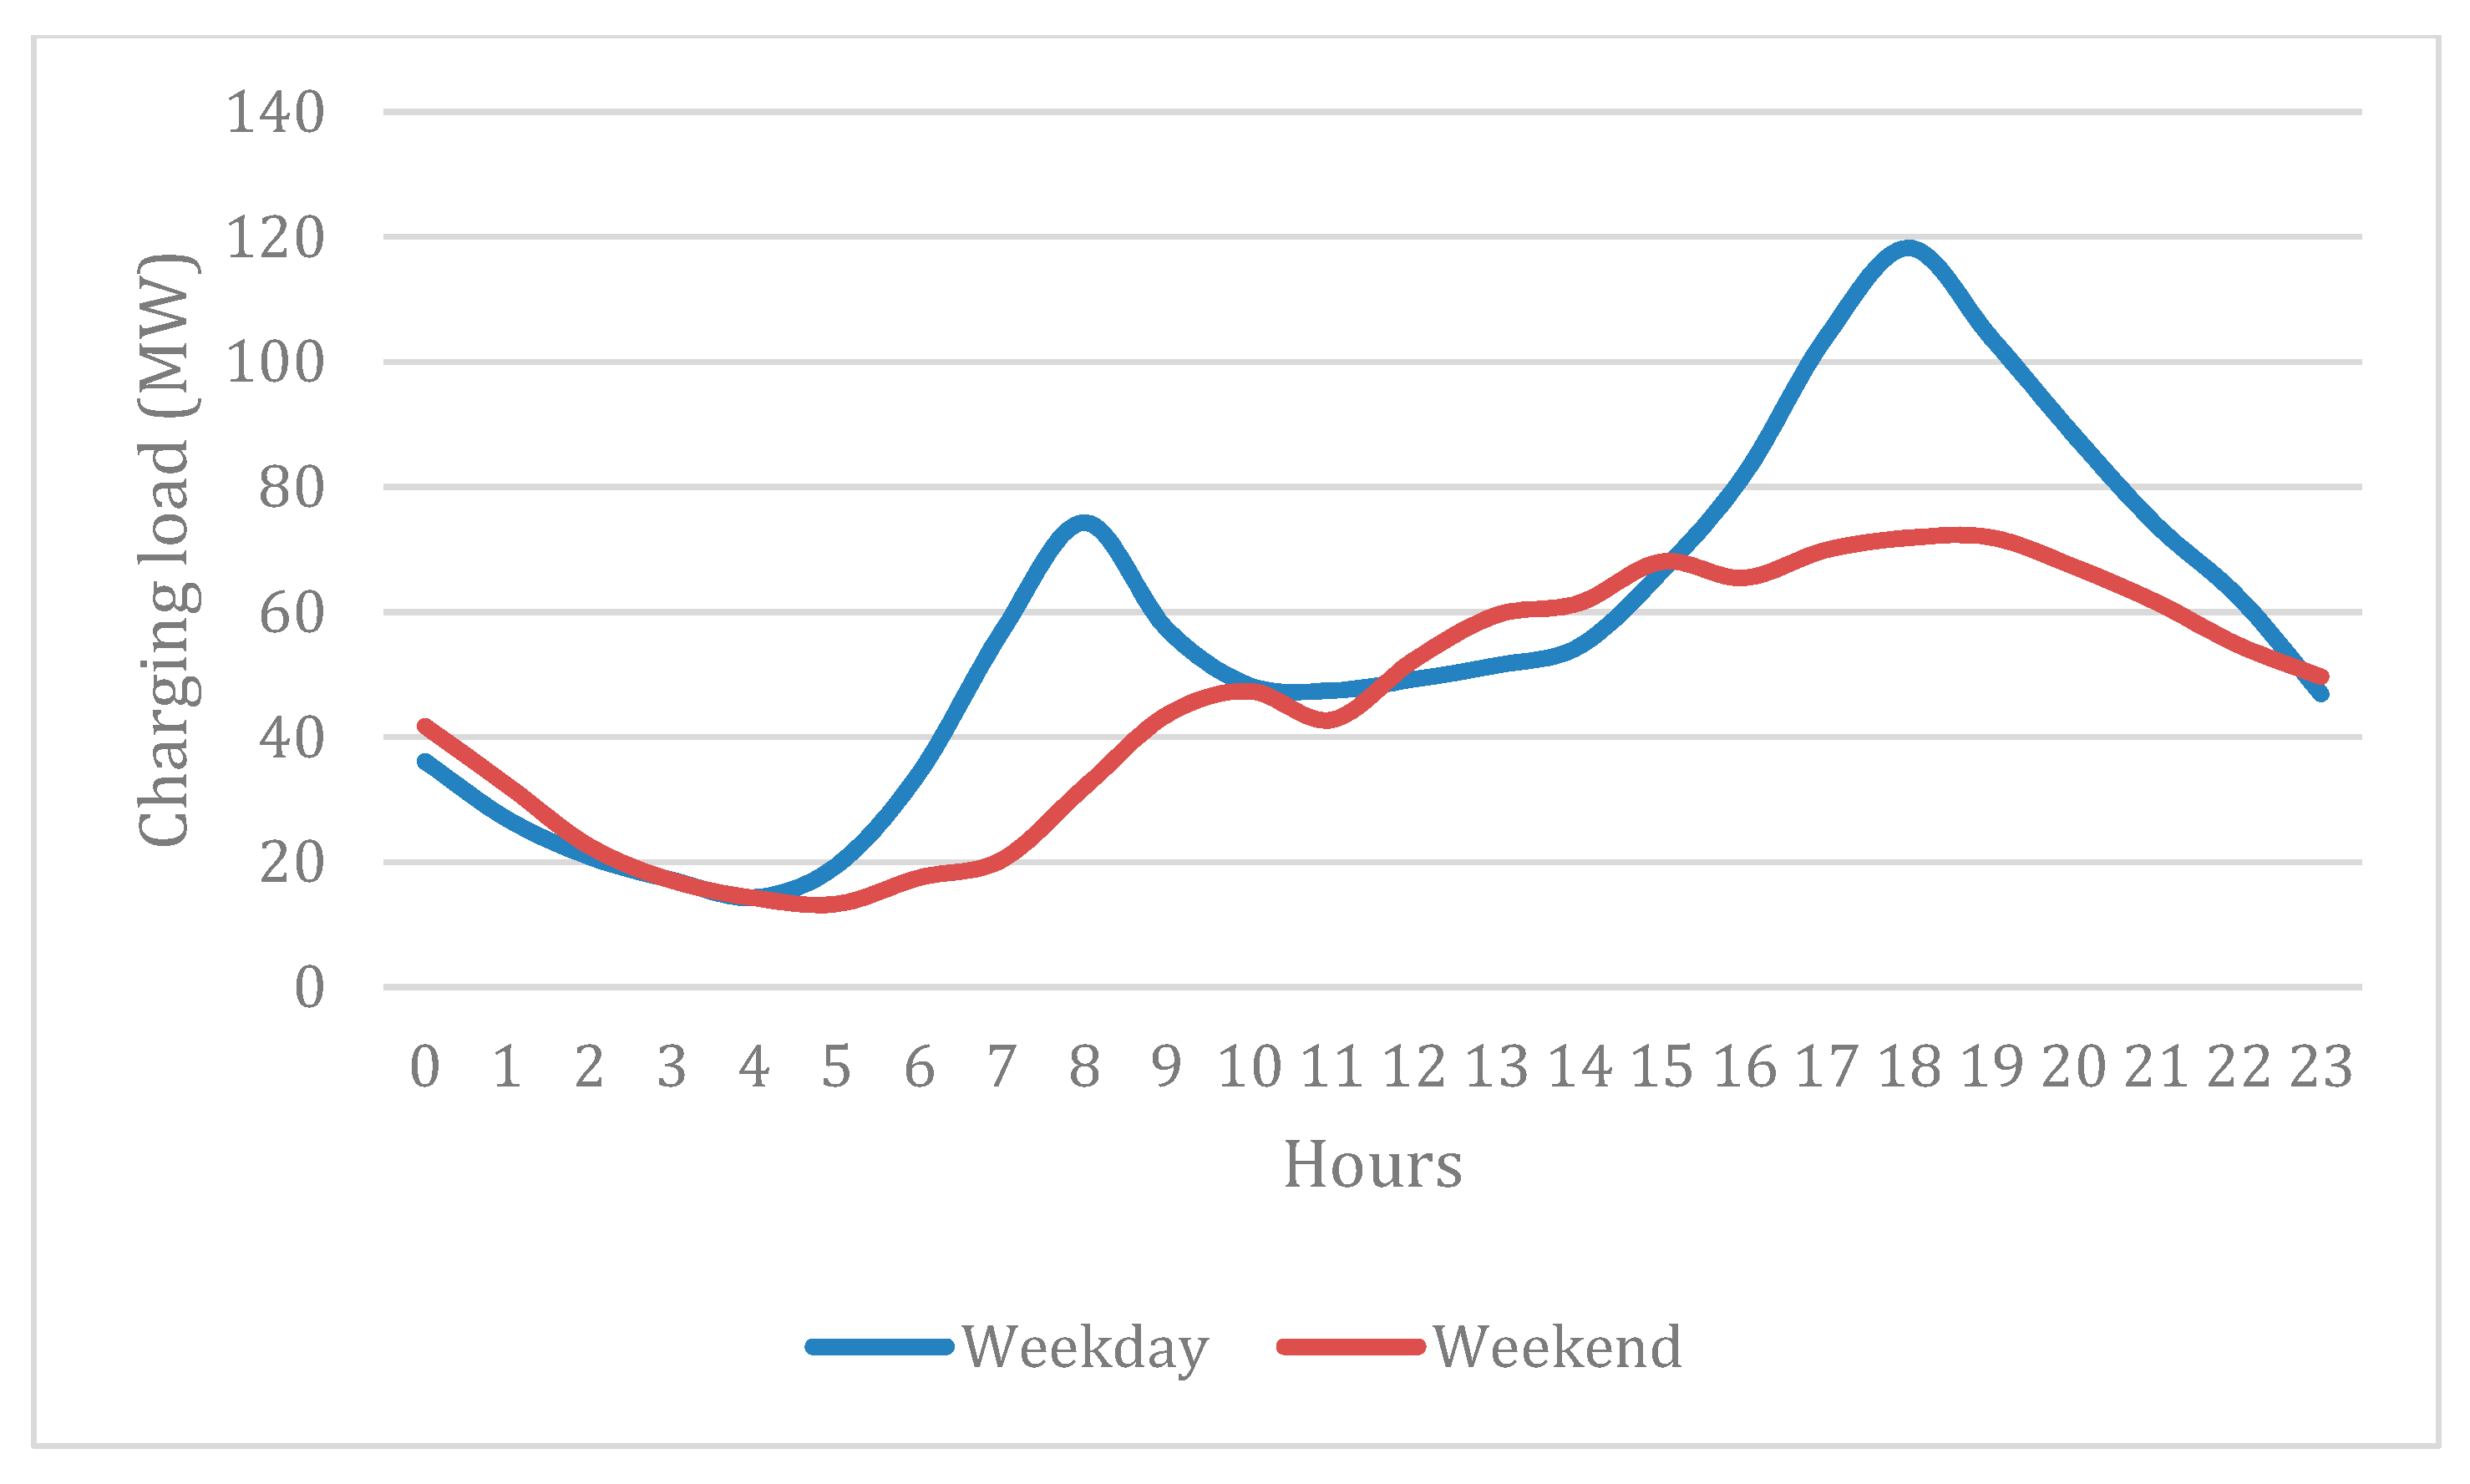
2.1. Predict Unmanaged Charging Demands of the Base Year 2017

Following the methodology of Loisel et al. [16], the electricity demand profiles of the base year need to be separated from PEV charging demands to get a reference case of measuring the impacts of unmanaged charging to normal grid operations without any PEVs. To do so, the average hourly charging demand in this year has to be simulated and deducted from the respective electricity demand of the grid. To populate the utilized open source software “V2G-SIM” and simulate charging demands, the following input data are needed:
  • Official PEV registration numbers in California in 2017;
  • PEV data on battery capacity, power consumption and maximum charging power;
  • Charging infrastructure availability in the state;
  • Mobility behavior data.

2.2. PEV Data

According to registration data from the California Department of Motor Vehicles, there were roughly 430,000 Zero-Emission Vehicles (ZEVs) on California’s roads in late 2018 [17]. Table 2 summarizes the state’s ZEV registration numbers as of 1 January 2018.
Only BEVs and PHEVs are considered here due to their ability to be charged externally. Average vehicle types for BEV and PHEV vehicles are used for the simulation. The data uses averaged values from currently available PEV models [18,19,20], with the energy consumption, battery size, maximum charging power and approximate vehicle ranges for the two EV types shown in Table 3.

2.3. Charging Infrastructure in California

As of December 2018, there were about 18,000 public chargers installed in the State of California, of which 15 percent were direct current (DC) fast chargers [21]. This charging infrastructure is still being developed, especially at workplaces and public locations such as shopping centers. Nevertheless, the assumption is made that owners of a PEV are able to have good access to charging infrastructure, especially home charging, in this timeframe. The simulation distinguishes between three different location types: Home, Work, and Other. “Other” refers to public locations such as schools, grocery stores, shopping malls, and others, representing public charging infrastructure. Table 4 summarizes the input assumptions around the probability to have a charging station available at certain location types.

2.4. Mobility Behavior

The data used here on mobility behavior and vehicle trips are derived from the National Household Travel Survey (NHTS) 2017 dataset. The study is conducted by the Federal Highway Administration and is the authoritative source of travel behavior of the American public. It is the only source of national data that allows analyzing trends in personal and household travel. Daily non-commercial travel by all modes, including characteristics of the people traveling, their household, and their vehicles are included in the study. The NHTS data are collected directly from a randomized sample of US households. The study provides data on individual and household travel trends linked to economic, demographic and geographic factors that influence travel decisions and are used to forecast travel demand [22,23].
The NHTS dataset on vehicle trips gives information on temporal travel patterns of vehicles and the purpose of the trip and parking locations. Collectively, the dataset gives travel information for one week of the US public. For this study, the dataset is divided between weekdays and weekends to create representative average travel days for these categories. The survey is using an additional weighting factor, which is critical to giving an estimate of the annual likelihood of particular trip types. Multiplying vehicle trips by their weighting factor results in a full dataset of all vehicles trips taken in the U.S. over the course of a full year. Only the data on California travel behavior from the NHTS are relevant and used for the simulation [23].
Drivers can only charge their vehicles when their car is parked at locations that have charging infrastructure available. All parking scenarios have fixed probabilities on charging infrastructure assigned, as shown in Table 4. The analysis includes the constraint that vehicles will never charge more than they actually consumed while driving.
As expected, the resulting charging demand is relatively low because of the low adoption of PEVs in 2017. Table 5 lists the quantitative results of the simulation with V2G-SIM including gigawatt hours (GWh) of charging demand relative to total state energy consumption in terawatt hours (TWh)
The following chart shown in Figure 1 visualizes the hourly charging demand of PEVs in California in 2017. During the week, charging demand is relatively low at night while vehicles are mostly charged at that point. Once drivers get to work around 8 AM, the first charging demand peak rises. During the day, it decreases a bit, followed by a higher peak, which can be accounted mostly to home charging around 6 PM. Because charging sessions are not controlled, the vehicles will simply start charging as soon as they are plugged in. The total charging demand on weekends is lower than on weekdays.
Using these charging patterns, the overall electricity demands can be calculated as follows.
t = 0       T P ( L V ) 2017 ( t ) = t = 0 T ( P L 2017 ( t ) i = 1 V P i ( t ) )

2.5. Scale Load Profiles to 2030 Using Demand Forecast

The California Energy Commission (CEC) conducted a system analysis study that forecast low, mid and high demand scenarios that are being used for infrastructure planning decisions. Table 6 shows the annual growth rates for the electricity demand and PEV penetration assumptions according to the CEC transportation demand forecast, showing an increase in net electricity consumption in the state [24,25].
The electricity demand data set for California is from the U.S. Department of Energy and covers electricity consumption for the whole state [26]. To create the no-PEV load profiles for the year 2030, Equation (2) is used, where a represents the annual growth rate of electricity consumption.
t = 0 T P ( L V ) 2030 ( t ) = t = 0 T ( P ( L V ) 2017 ( t ) a ( 2030 2017 ) )                     with   a > 0
The adjusted load profiles P ( L V ) 2030 are then calculated for each demand scenario individually.

2.6. Predict Unmanaged Charging Demands for 2030 Using V2G-SIM

Technology advancements, charging infrastructure improvements, and an increasing PEV penetration will influence charging demands significantly by 2030. These are estimated below for the base case of unmanaged charging.

2.6.1. PEV Data for Year 2030

Most auto manufacturers are increasing their ZEV portfolio rapidly and advancements in battery technologies are being made continuously. The vehicle input data in V2G-SIM uses improved assumptions on battery pack size and maximum charging power to account for the expected technology advancements until 2030. To predict increasing average battery pack sizes in 2030, the scaling from the CEC and NREL that can be found in the “California Plug-In Electric Vehicle Infrastructure Projections: 2017–2025” has been used to extrapolate battery technology advancements to 2030. Following their expected linear technology trendline, the battery pack size of BEVs and PHEVs will increase by a factor of 2.2, from 40 to 88 kWh average battery energy capacity. The assumptions include vehicle efficiency improvements as well, where battery capacity can increase while efficiency remains constant [27]. This leads to the following assumptions for the simulation, shown in Table 7.
To investigate different PEV adoption scenarios, the California study utilizes the assumptions from the CEC Transportation Demand Forecast [24,25]. Additionally, the share of BEVs and PHEVs are expected to change further in the future. As forecast in [25], the sales figures for BEVs increase faster than the ones for PHEVs, leading to the assumptions that the share of BEVs will be larger in 2030 than today. Table 8 summarizes the different PEV adoption numbers from the forecasts and the assumed shares of BEVs and PHEVs. Alternative technologies like hydrogen fuel-cell vehicles that are not grid-integrated are not included in this analysis.
The funding programs that California has in place lead to the assumption that the accessibility of charging stations will increase significantly by 2030. The additional assumption that PEV users are more likely to stop at locations that have charging stations available (e.g., free charging at grocery stores) has been made. With the increased popularity of PEVs and the maturing of technologies in this field, customers may be more likely to install higher-powered charging stations at home. Therefore, an increase in alternating current (AC) Level 2 charging at home is expected, leading to the probability figures in Table 9.
After populating the input assumptions into V2G-SIM, the values for unmanaged charging demand for the different ZEV adoption forecasts can be obtained. These are shown in Table 10 below.
Taking a closer look at the results for the “mid demand scenario”, the simulation results show that the charging demand of PEVs in 2030 will have a much higher impact on total energy consumption than in 2017, resulting in 1.64% of total electricity consumption in the state. This is about an order of magnitude increase in relative electricity consumption from 2017 to 2030 as shown in Table 11.
The temporal distribution of unmanaged charging is changing through the different charging infrastructure assumptions as well. The increase in public and workplace charging infrastructure promotes charging during the day, creating the first peak of charging demand around 7 am as show in Figure 2 below.
To investigate the influence of unmanaged charging, the hourly charging demands are added to each demand scenario load profile individually, following Equation (3).
t = 0 T P L 2030 ( t ) = t = 0 T ( P ( L V ) 2030 ( t ) + i = 1 V P i 2030 ( t ) )
The open-source software SWITCH is utilized to predict the California grid for 2030 that meets the RPS goal of 60% in 2030, while meeting system electricity demand at any given time. To enable the comparison of curtailment figures for each vehicle scenario (no EVs, Unmanaged, Managed), the load profiles from the unmanaged vehicle scenarios (Equation (3)) of all demand cases are used as the load inputs for the SWITCH model. This ensures that the model builds enough generating capacity to meet the system demand, including vehicle charging. The SWITCH model is populated with a set of input files as listed below and visualized in Figure 3.
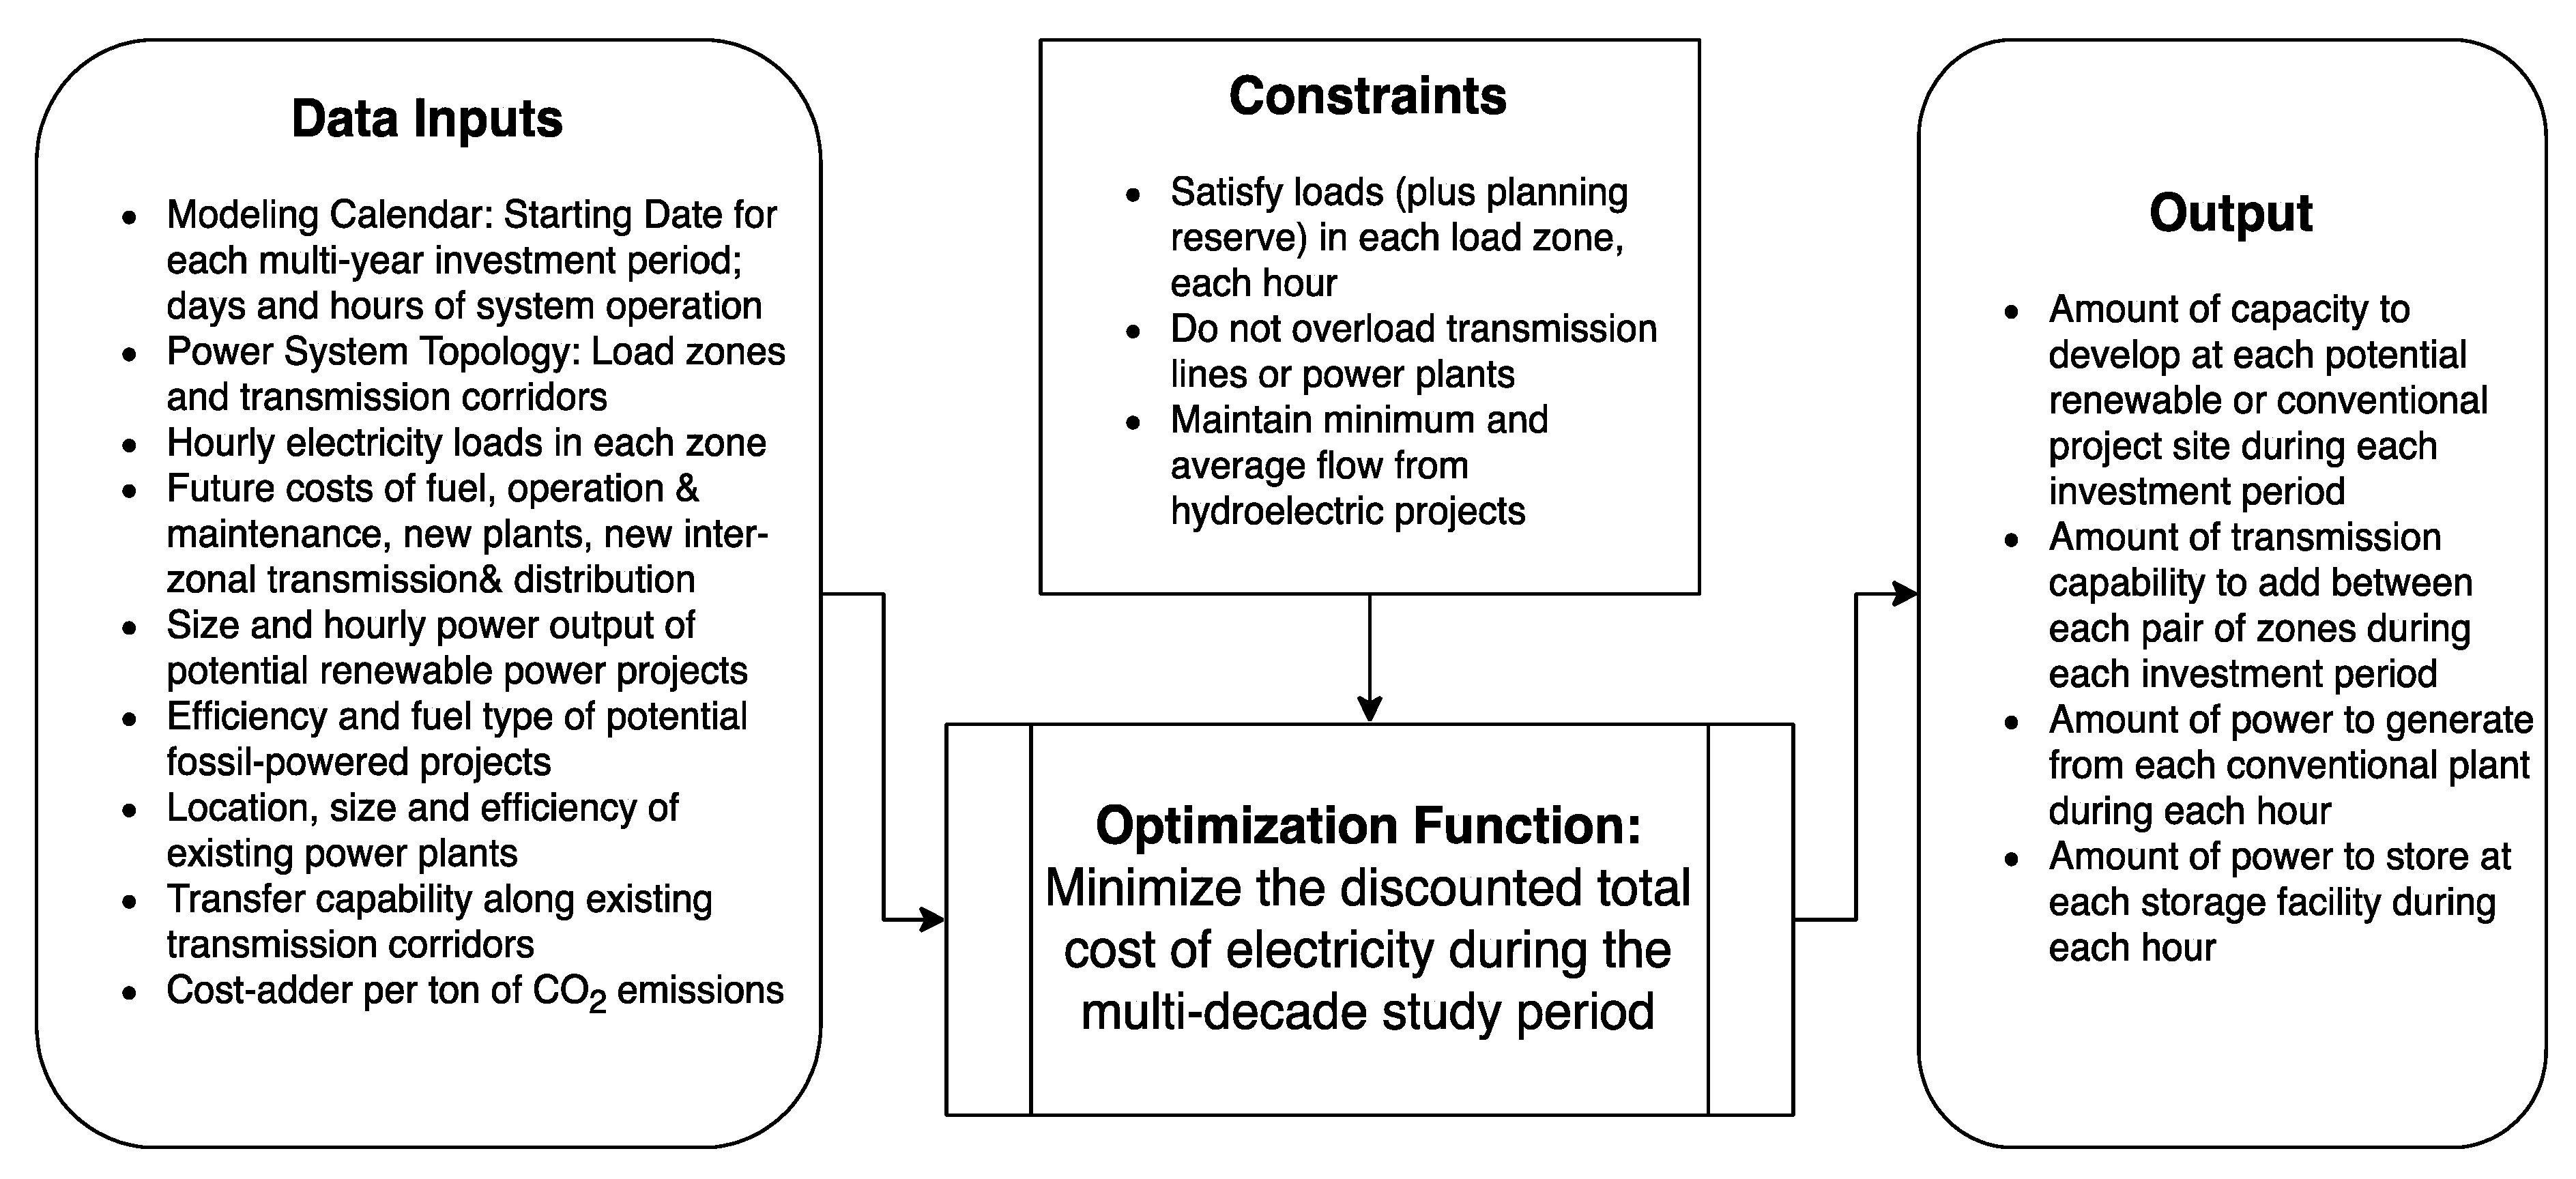
  • Electricity load inputs (demand scenarios including vehicle loads)
  • Existing generators and plants
  • Potential new renewable generators
  • Renewable share goals
  • Planned retirements of generation technologies
  • Plant costs/fuel costs/financial details
  • Variable capacity factors of intermittent renewable generators (generation potential)
  • Must-run hydroelectric generation profiles
  • Transmission capacities
  • Existing stationary storage
  • New stationary storage investments
The electricity load inputs are based on the actual datasets from 2017 from the Energy Information Administration [26] and scaled by the CEC demand forecast [25] and simulated loads of unmanaged PEVs. Data on existing generators are taken from the CEC “Annual Generation Plant Unit” database [28]. The decommissioning of the Diablo Canyon nuclear power plant is taken into account as well, replacing the loss in generation capacity with RPS eligible generators, as required by SB-1090 [7].
With SB-100 [10], California established a requirement for 60% of eligible generated electricity to customers in the state in 2030 and 100% carbon-free electricity by 2045. The extension of renewable capacity in the state for this study is based on the “Western Wind and Solar Integration Study” from the National Renewable Energy Laboratory in [29]. Offshore wind generators have not been considered, since California did not have any projects in progress that were investing in such resources. Costs for new generation technologies that have been considered are shown in Table 12.
To accommodate the intermittent nature of renewable generators, the extension of stationary storage is inevitable. In compliance with Assembly Bill 2514, the California Public Utility Commission sets targets for California utilities, requiring them to procure more than 1.3 GW of energy storage by 2020, with specific targets for transmission-connected, distribution-connected, and customer-side energy storage systems [33,34]. For the modeling inputs in SWITCH, stationary battery storage is projected to increase to 2500 megawatts (MW) power capacity by 2030. This assumption is relatively conservative relative to California’s deployment goals of 1300 MW of storage by 2020, but it creates an interesting scenario to study the influence of managed PEV charging.

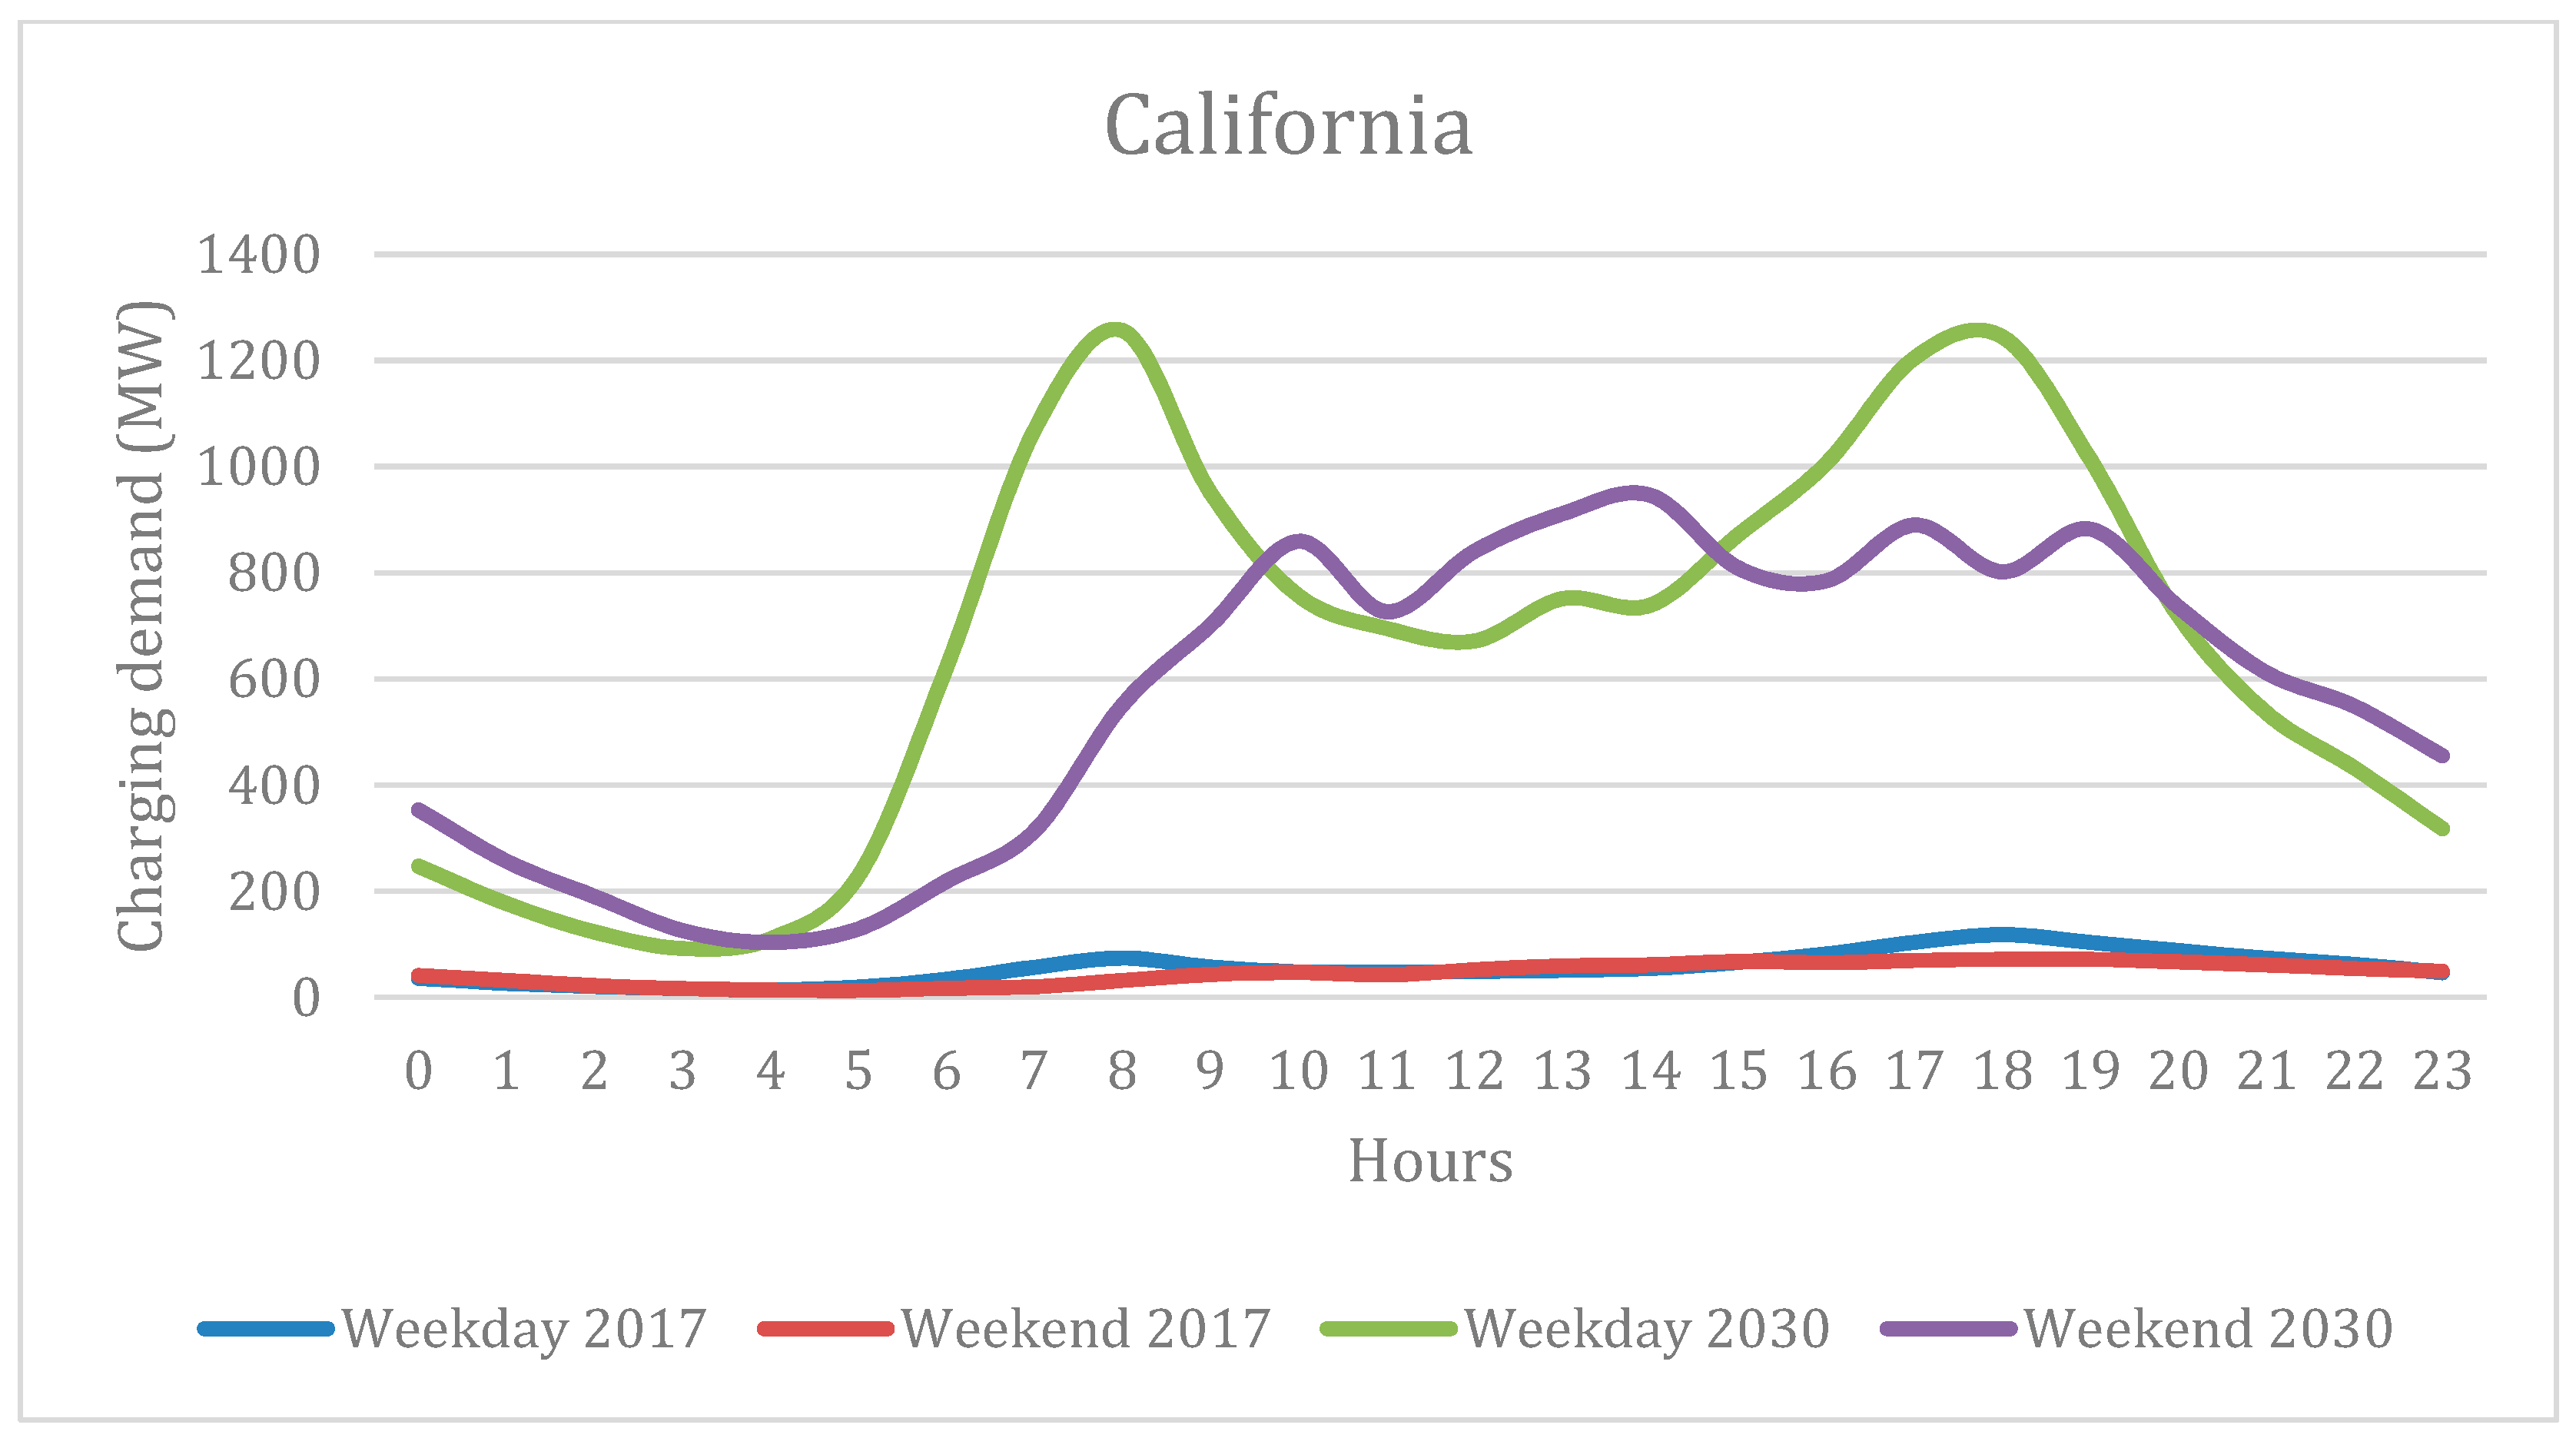
2.6.2. California Grid Modeling Results

Table 13 summarizes the generation capacity in California, optimized by the SWITCH model, that is able to meet the goal of 60% RPS eligible electricity in 2030.
These results clearly show that the model is investing heavily in wind and solar power plants to be able to meet renewable goals in the future. The total installed capacity in the state increases by ~55% (~46 GW) from 2017 to 2030. This is caused by the intermittency of renewable resources solar and wind and the increase in electricity demand until 2030. The power outputs of solar and wind are fluctuating with current weather conditions, creating the need to install more nameplate capacity than with conventional baseload generators to ensure reliable electricity supply. Figure 4 visualizes the share of the generation power capacity mix of California in 2030 for the mid demand scenario. To meet the 2045 goal of carbon-free electricity, the state needs to investigate further plans to phase-out coal and natural gas plants.

2.7. Populate V2G-SIM Inputs for Managed Charging Scenarios

In the managed charging scenario, some PEV charging stations have the capability to shift charging to different time periods. Below the process for using V2G-SIM to estimate load shifting potential is described.
The approach used here is to add the managed vehicle loads to the “no PEVs” case to create optimized electricity demand profiles. As defined in Equation (4), the PEV-free net load P ( N L V ) 2030 ( t ) is the optimization objective. The net load can be determined by subtracting the power generation of intermittent renewables (solar and wind) from the system electricity demand.
t = 0 T P ( N L V ) 2030 ( t ) = t = 0 T ( P ( L V ) 2030 ( t ) P S 2030 ( t ) P W 2030 ( t ) )
Two different optimization objectives of the “duck curve” problem (shown in Figure 5), are considered in this study. The first optimization objective serves the purpose of mitigating the risk of over-generation through flattening the “belly of the duck”. The second optimization objective minimizes ramping needs of the net load curve. The optimization functions align with the methodology from Coignard et al. [14].
To investigate the influence of managed charging on mitigating curtailment of renewable generators, the optimization function minimizes the peaks and valleys of the net load curve. The minimization is done by shifting charging sessions of PEV drivers. If the time of the vehicle being connected to the charger is longer than the time that the car actually needs to recharge, then there is potential to optimize the charging time within these temporal boundaries. The peak shaving and valley filling optimization function is defined in Equation (5).
t = 0 T P N L 2030 ( t ) = m i n . t = 0 T ( P ( N L V ) 2030 ( t ) + i V P i 2030 ( t ) ) 2
The second optimization objective faces the steep ramping phases mainly caused by solar generation during the day and peaks in electricity demand in the evening. Capacity ramp-up is hard to handle from a grid operator perspective and therefore the analysis investigates whether PEVs will be able to slow down the capacity increase through managed charging, utilizing the optimization approach in from Equation (6).
t = 0 T P N L 2030 ( t ) = m i n . t = 0 T ( Δ P ( N L V ) 2030 ( t ) + i V Δ P i 2030 ( t ) ) 2
The State of California is mandating to increase public charging infrastructure by 200,000 AC chargers and 10,000 DC fast chargers by 2025 [36]. As mentioned above, the expansion of workplace charging infrastructure is in focus of the state’s goals as well and will enable the chance to successfully manage electric vehicles in the future from a technical perspective. To investigate the influence of uni-directional charging (V1G), the assumptions on charging station availability at home, work, and other locations (public charging) are shown in Table 14.
The total probability for each charging station type on availability of charging stations is the same as for the unmanaged charging case. The only difference can be found within the AC level 2 and DC charging stations. It is assumed that a certain percentage of AC level 2 charging stations is controllable for uni-directional (V1G) charging. That implicates that charging schedules can be set for the respective vehicles to charge them at a different time within the window that they are plugged in at the charging station.

2.8. California Grid Modeling Results

The probabilities for charging infrastructure accessibility differ slightly in the V2G charging scenario. When V2G charging is accepted by consumers there is an expectation of somewhat higher availability of charging stations in California. In addition to the V1G charging stations that were added to the portfolio, there are two more charging station types available for the V2G scenario:
  • AC Level 2 7-kW V2G
  • DC 24-kW V2G
Table 15 gives an overview of the probabilities to find charging stations at the defined locations in the V2G scenario.

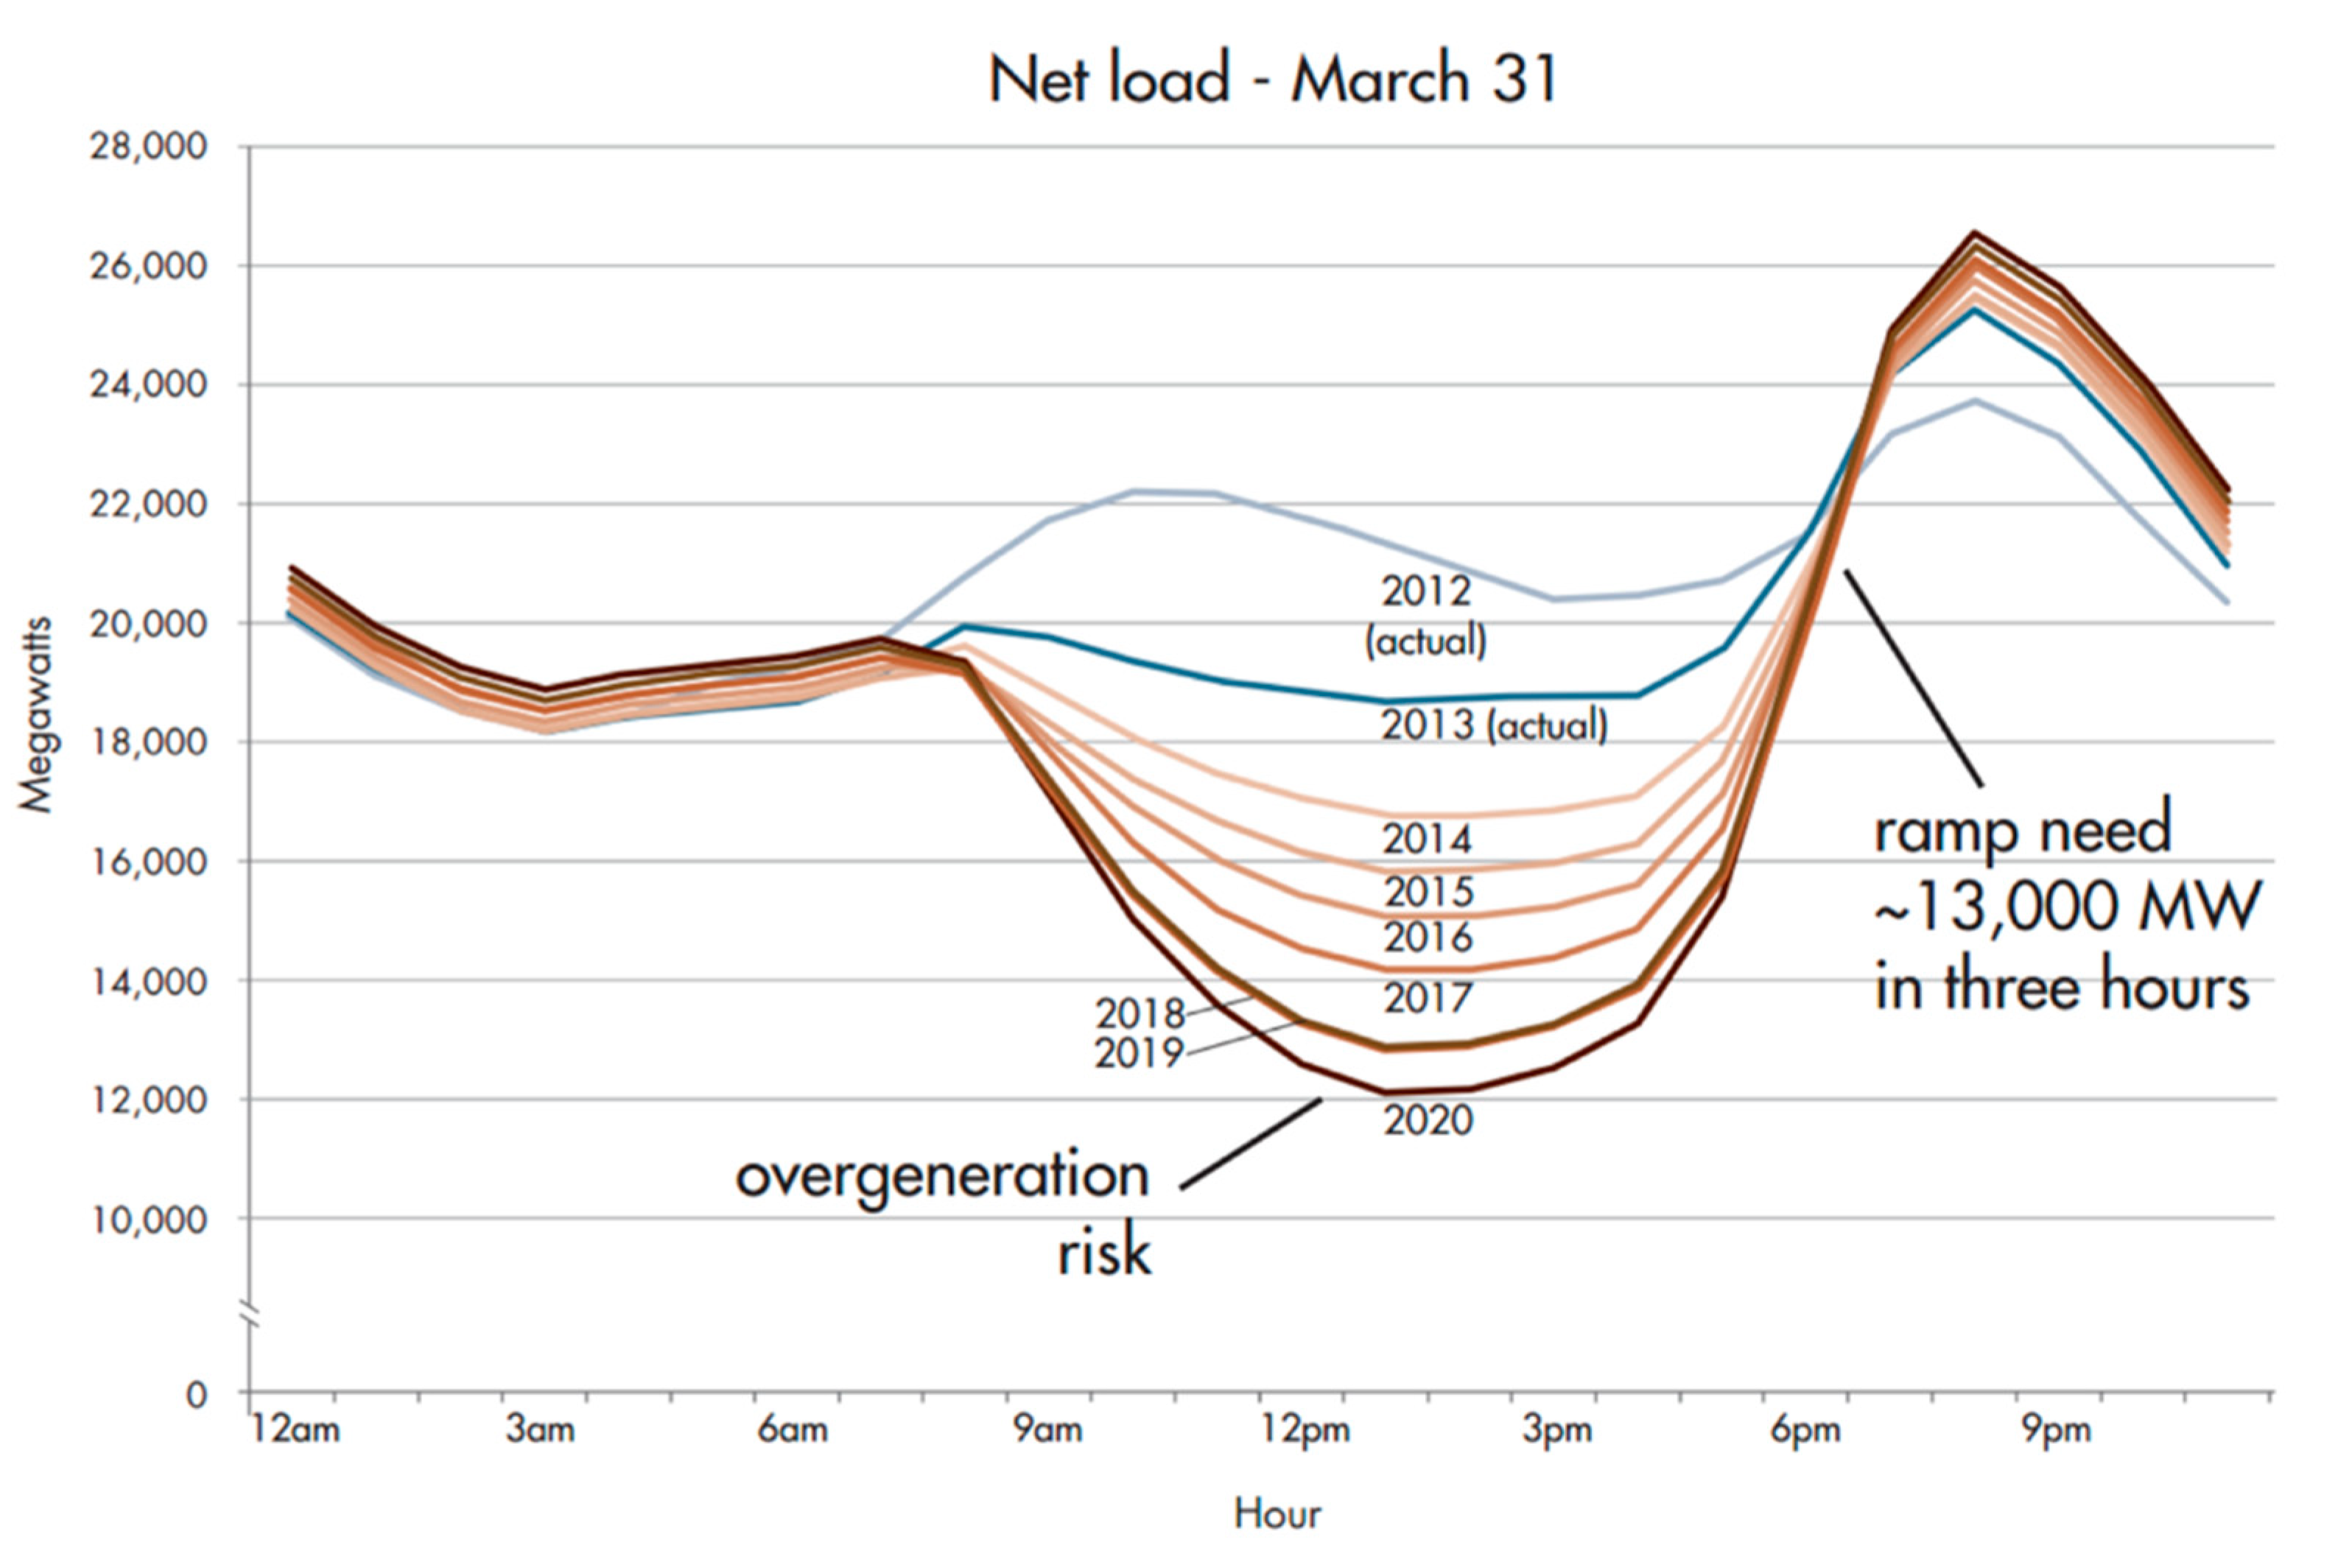
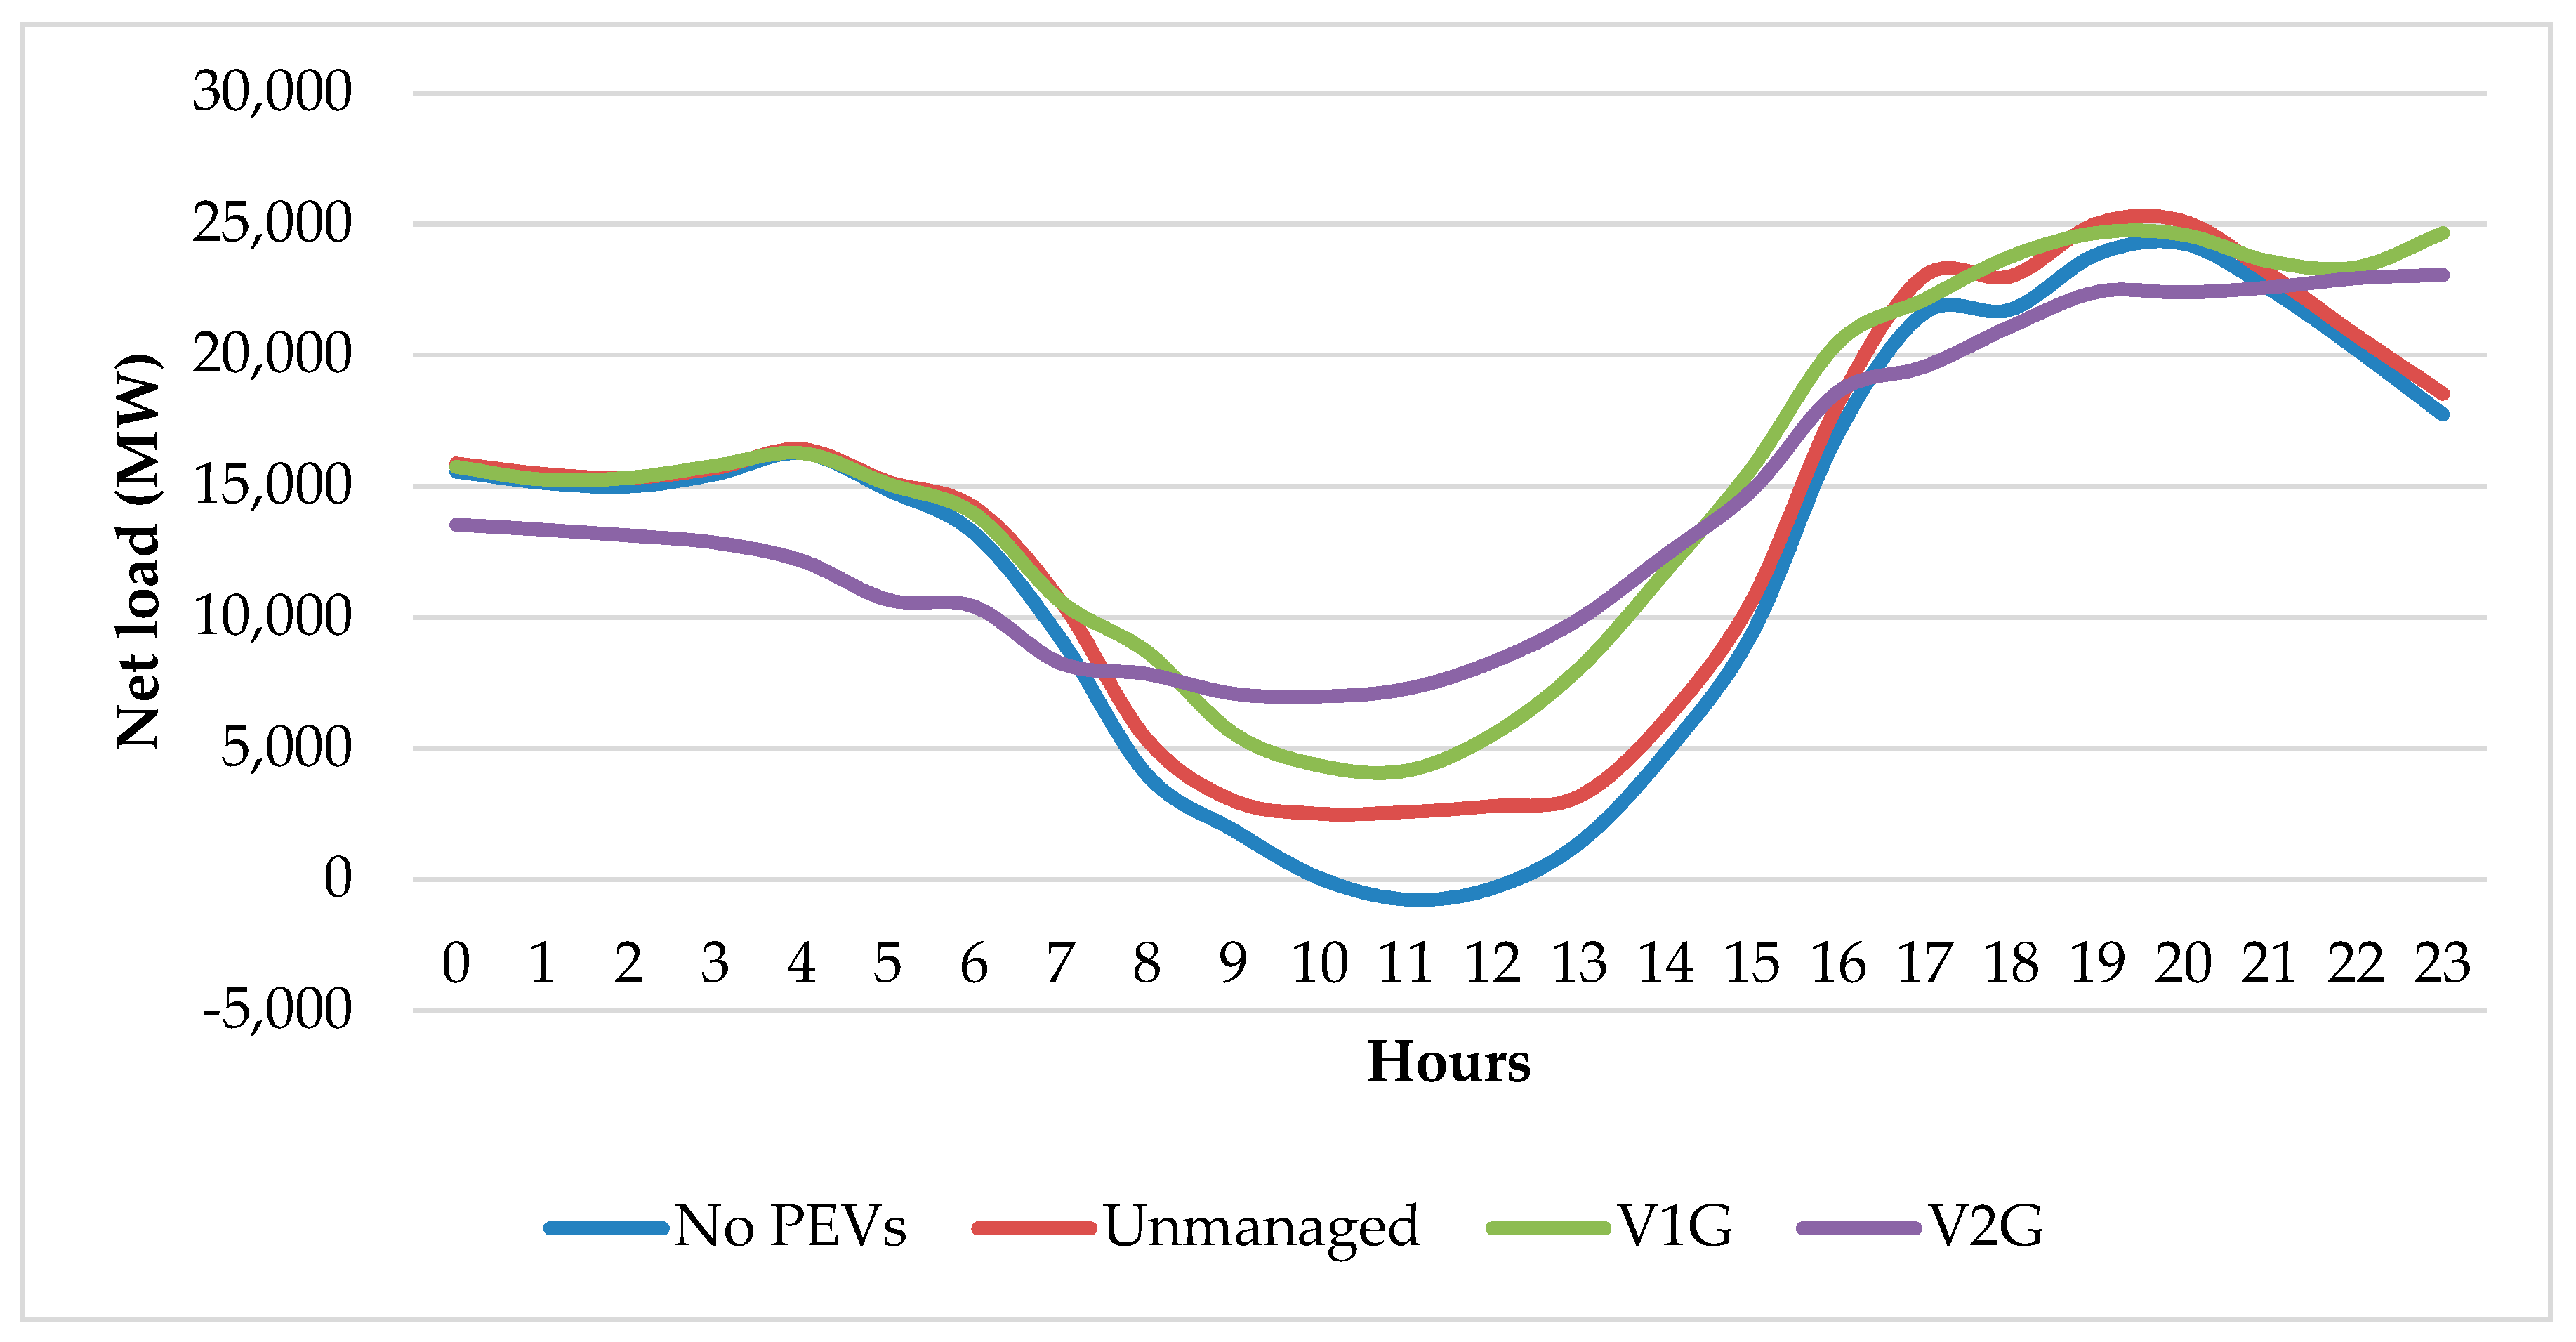
2.9. Operate GridSim to Analyze Curtailment Scenarios

GridSim model runs were performed using the inputs from the previous steps. The software uses linear optimization to minimize grid operation costs while ensuring that the renewable share goals are being met over the course of the whole year. The software outputs the results of generated electricity from the different sources and charging and discharging patterns from stationary storage. The outputs and inputs enable one to derive conclusions regarding over-generation, which is determined as follows:
E O G 2030 , a v g = t T ( s S ( E G 2030 , a v g ( t ) ) + b B ( E S 2030 , a v g ( t ) ) E L 2030 , a v g ( t ) )
The results are afterwards extrapolated to reflect the curtailment and generation figures for the whole year.

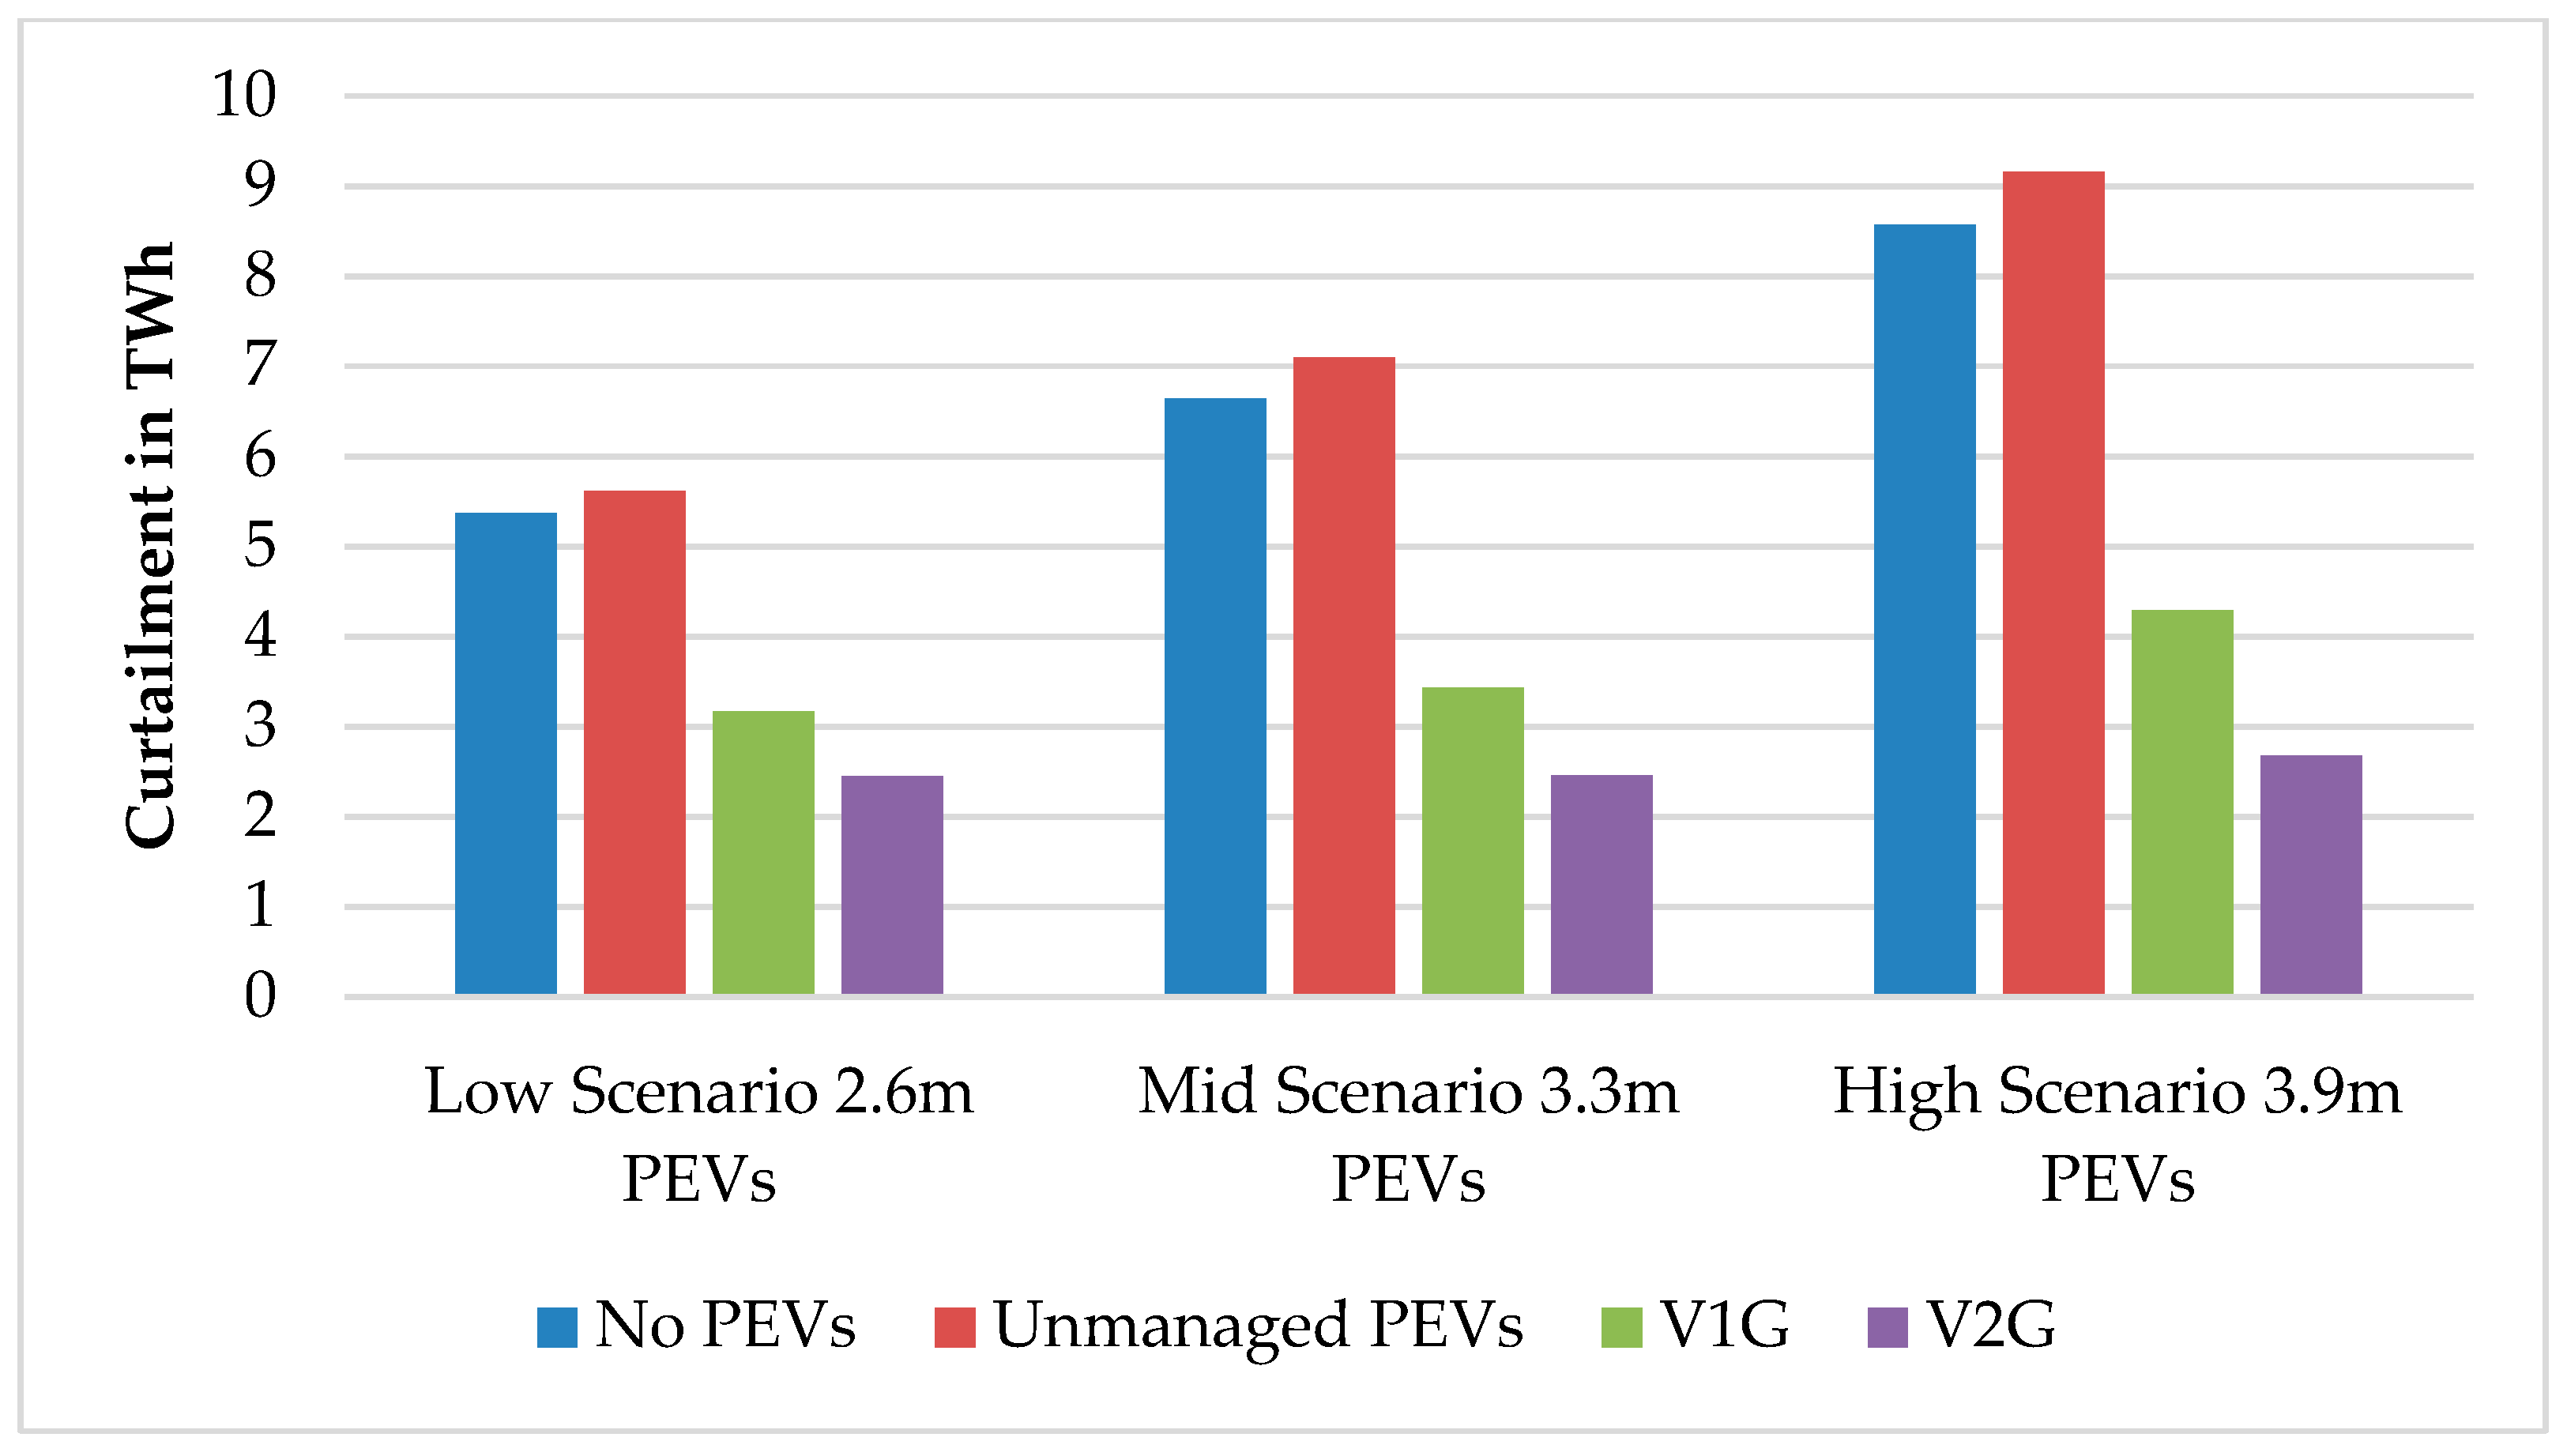
3. Results and Discussion

The output from the SWITCH simulation serves as a base for the GridSim dispatch model in the following analysis to determine hourly grid operations and curtailment figures that meet the 60% RPS goal in 2030. GridSim is run with three different load scenarios that align with the demand projections from the CEC Energy Demand Forecast [24]. To be able to sufficiently determine the influence of electric vehicles to hourly grid operations, there are four different load profiles created for each demand scenario:
  • Case 1—No ZEVs
  • Case 2—Unmanaged Charging
  • Case 3—Managed Charging—V1G
  • Case 4—Managed Charging—V2G
In this section the overall impacts of both optimization functions to mitigate curtailment in the annual grid operations in California are analyzed. When running the model with the different charging cases and optimization objectives, the following results and findings for curtailment and system demand can be found for the mid scenario in 2030. As shown in Table 16, managed charging with either peak-valley optimization or ramp-rate optimization to help flatten the duck curve both reduce curtailment significantly compared with unmanaged charging. Compared with unmanaged PEV charging, peak-valley optimization can reduce curtailment by about 0.77 TWh with V1G and 1.29 TWh with V2G implementation. Ramp-rate optimization provides even greater reductions in estimated curtailment in 2030, of about 1.07 TWh with V1G and Y TWh with V2G.
The simulation results show that adding unmanaged vehicle charging demand to the system demand profiles increases curtailment by 0.45 TWh in 2030. This can be seen for all demand scenarios (see Figure 6). Furthermore, it can be seen that managed charging has a positive influence on mitigating curtailment in the California system. Compared to unmanaged charging, uni-directional controlled charging of 3.3 million PEVs can mitigate curtailment by 3.66 TWh annually. When considering V2G-capable charging stations in the mix, curtailment can be mitigated by 4.64 TWh in total, resulting in 2.45 TWh of total curtailment in 2030 versus 7.09 TWh in the unmanaged charging case.
It can be clearly seen that with increasing system demand and increasing PEV penetration, the positive impacts on curtailment can be significant, proving their potential to help integrate renewable resources into the electricity grid.
Figure 7 visualizes the results for a typical April day when focusing on minimizing the gradient of the net load shape through managed charging. It can be clearly seen that ramping needs are mitigated significantly with the managed charging cases.
The unmanaged charging line in Figure 7 is the base case that represents the net load when PEV charging is not managed or influenced by grid operators. The maximum downward ramp can be seen between 6 am and 9 am with 11 GW in 3 h. The maximum upward ramp can be seen between 2 pm and 5 pm with 17 GW in 3 h. This approximately 13 GW ramp level in 3 h is already causing challenges from a grid operator perspective. The unmanaged charging case exceeds this challenge by 4 GW, most likely creating grid operation problems in the future. Especially, V2G charging seems to have immense potential to help shape system electricity demand through its capabilities to feed energy back to the electricity grid when general electricity demand is high. Uni-directional V1G charging is able to alleviate the maximum upward ramping needs from 17 GW in 3 h to 12 GW. Bi-directional V2G charging could mitigate it to 8.7 GW. The positive impacts of managed charging with a focus on ramping needs are immense.

Estimated Avoided Needs for Grid Storage

The equivalent system-wide stationary storage is determined by systematically simulating storage systems with different power (MW) and energy storage (MWh) capacities and quantifying their impacts on the net load. The energy storage equivalent values of V1G and V2G are analyzed by running multiple simulations in GridSim with the unmanaged charging case. The goal is to find a stationary storage equivalent that represent the curtailment mitigation potentials of PEVs that have been found. The battery storage systems are projected to be 4-h systems with a 90% round-trip efficiency. Table 17 shows the results that have been found through this analysis for the V1G and V2G cases. The levels of curtailment shown are relative to a much higher level of about 7 TWh in the base case, with unmanaged EV charging, as shown in Figure 6 above.
To estimate the equivalent capital costs for dedicated grid storage, the data inputs for Lithium-Ion battery storage price projections from the SWITCH modeling are used. By 2030, the costs and prices of EV batteries are forecast to decrease significantly, perhaps 50%–60% lower than present day levels. We assume for this study an estimate from the base case in the SWITCH model of USD 1302 per kilowatt (kW) as a price input for power capacity. Additionally, the energy capacity price assumptions from [37] used are at USD 200 per kilowatt-hour (kWh) at the storage system level. The equivalent total capital cost equivalent of vehicle grid services can be calculated using the methodology from Coignard et al. [14] in Equation (8).
T P C = P S t C P + E S t C S
The results of these calculations show significant potential for EVs in California to act as energy storage resources in the future. Table 18 shows the results for both V1G and V2G scenarios, where the storage potential with V2G is about 67% higher than with V1G. The calculations show that the equivalent storage costs to a V1G scenario with 30,000 MWh of energy storage capacity are about USD 16 billion and with V2G the equivalent cost of 50,000 MWh of energy storage are over USD 26 billion.

4. Conclusions

This study examined the potential for future fleets of BEVs and PHEVs, collectively called PEVs, to provide flexible load (V1G) and bi-directional grid storage (V2G) resources for California in 2030. This includes future projections of PEV markets along with charging infrastructure development and further progress toward renewable electricity generation. This effort combined modeling capabilities from SWITCH, V2G-Sim, and GridSim and included estimates of the market development of different types of PEVs and the nature of the California grid in 2030, and scenarios for 2030 examining V1G and V2G cases.
With V1G only, 3.3 million PEVs in 2030 could replace USD 15.77 billion in stationary storage investments, providing 7500 MW of power capacity with 30,000 MWh of energy storage potential. The value of V2G services in California would be approximately double, replacing USD 26.28 billion worth of stationary storage investment costs in the same scenario. Thus, the value of enabling vehicle-grid services would be immense in California. PEVs could help enable the integration of renewable energy resources substantially in 2030. Additionally, investment costs for dedicated stationary storage facilities could be significantly avoided in future when vehicle-grid services are being utilized.
We note that adding V1G capability to a product line of PEVs is available with an investment of approximately USD 150 million for a single manufacturer according to Needell et al. [38]. Most vehicle automakers already have remote control or telematics options for their charging services, decreasing the estimated investment costs even further because research and development efforts have already been made. A level of USD 150 million in investment costs for each of several major manufacturers (on the order of USD 1 billion total) is many times lower than the equivalent stationary storage values that we calculate here. These systems are broadly applicable as electricity grids evolve around the world and could be deployed globally as well as in California.

Author Contributions

The analytical work described in this paper was performed by F.v.T. in consultation with T.E.L. The initial manuscript language was drafted by F.v.T. T.E.L. developed the initial draft of the manuscript with extensive editing of the initial text. Both authors worked on addressing helpful reviewer comments and completing the final version of the manuscript. All authors have read and agreed to the published version of the manuscript.

Funding

This research received no external funding.

Acknowledgments

The authors acknowledge the assistance of Patricia Hidalgo-Gonzalez (UC Berkeley), Rodrigo Henriquez-Auba (UC Berkeley), Dipl.-Ing. Kevin Krebs (TU Dresden), and Bernard Bäker (TU Dresden).

Conflicts of Interest

The authors declare no conflict of interest. This research was entirely supported by discretionary research funds from the Univ. of California—Berkeley Transportation Sustainability Research Center, as part of a collaborative program for completion of a Diploma Engineering (Masters) degree by Mr. van Triel.

Glossary

TermDefinition
a (2030−2017)annual growth rate of electricity consumption between 2017–2030
ACalternating current
BEVbattery electric vehicle
California ISOCalifornia Independent System Operator
CECCalifornia Energy Commission
CPequation term for capital cost of power in U.S. dollars per kilowatt
CSequation term for capital cost of storage in U.S. dollars per kilowatt
DCdirect current
EG,2030generated electricity in 2030
EL,2030system electricity consumption in 2030
EOG,2030over-generated electricity in 2030
ES,2030stored electricity in 2030
EStequation term for storage capacity in kilowatt hours
EVelectric vehicle
FCEVfuel cell electric vehicle
GHGgreenhouse gas
GWgigawatt
GWhgigawatt-hour
ISOindependent system operator
kWkilowatt
kWhkilowatt-hour
LBNLLawrence Berkeley National Laboratory
MWmegawatt
MWhmegawatt-hour
NHTSNational Highway Travel Survey
PEVplug-in electric vehicle
PHEVplug-in hybrid electric vehicle
Pi (t)charging power of a single vehicle in kW
Pi,2030equation term for…
P(L-V),2017system electricity power demand—sum of vehicle charging loads in kW in 2017
P(L-V),2030system electricity power demand—sum of vehicle charging loads in kW in 2030
PL.2017system electricity power demand in 2017
P(NL),2030net load in 2030 (electricity demand—solar and wind power)
P(NL-V),2030net load in 2030—sum of vehicle charging load
PS,2030solar power generation in 2030
PStequation term for storage rated net power
PW,2030wind power generation in 2030
RPSrenewable portfolio standard
t/Tequation term representing the variable time
TPCequation term representing the total plant cost
TWhterawatt hours
U.S.United States
V1Ga term for smart charging of electric vehicles
V2Gvehicle to grid: a concept where electric vehicles can send electricity back into the grid as well as vary their charging rate
ZEVzero-emission vehicle

References

  1. Executive Orders on California Climate Change. Available online: https://www.climatechange.ca.gov/state/executive_orders.html (accessed on 17 February 2019).
  2. Climate Action Report 2017 on the German Government’s Climate Action Programme 2020; Bundesministerium für Umwelt, Naturschutz und nukleare Sicherheit (BMU): Berlin, Germany, 2019.
  3. California Energy Commission. Integrated Energy Policy Report; California Energy Commission: Sacramento, CA, USA, 2017.
  4. Governor’s Interagency Working Group on Zero-Emission Vehicles. 2018 ZEV Action Plan—Priorities Update; Office of Governor Edmund G. Brown Jr.: Sacramento, CA, USA, 2018.
  5. Office of Governor Edmund G. Brown Jr. Governor Brown Takes Action to Increase Zero-Emission Vehicles, Fund New Climate Investments. Available online: https://www.ca.gov/archive/gov39/2018/01/26/governor-brown-takes-action-to-increase-zero-emission-vehicles-fund-new-climate-investments/index.html (accessed on 21 February 2019).
  6. Office of Governor Edmund G. Brown Jr. Governor Brown Announces $120 Million Settlement to Fund Electric Car Charging Stations Across California. Available online: https://www.ca.gov/archive/gov39/2012/03/23/news17463/index.html (accessed on 11 January 2019).
  7. California Senate Bill SB-1090 (Monning); Diablo Canyon Nuclear Powerplant: San Luis Obispo County, CA, USA, 2019; p. 109.
  8. Energy and Environmental Economics. Investigating a Higher Renewables Portfolio Standard in California: Executive Summary. Available online: https://www.ethree.com/wp-content/uploads/2017/01/E3_Final_RPS_Report_2014_01_06_ExecutiveSummary-1.pdf (accessed on 15 January 2018).
  9. Fraunhofer-ISI. Model Forecast—REflex. Available online: http://reflex-project.eu/model-coupling/forecast-and-eload/ (accessed on 19 April 2020).
  10. SB-100 California Renewables Portfolio Standard Program: Emissions of Greenhouse Gases; California Energy Commission: Sacramento, CA, USA, 2018.
  11. Kammen, D.M. Switch-Wecc—Data, Assumptions, and Model Formulation; Renewable and Appropriate Energy Laboratory: Berkeley, CA, USA, 2013. [Google Scholar]
  12. Fripp, M. Switch: A Planning Tool for Power Systems with Large Shares of Intermittent Renewable Energy. Environ. Sci. Technol. 2012, 46, 6371–6378. [Google Scholar] [CrossRef] [PubMed] [Green Version]
  13. Das, P.; Chermakani, D.; Fripp, M. Development of SWITCH-Hawaii Model: Loads and Renewable Resources; Electric Vehicle Transportation Center: Honolulu, HI, USA, 2016. Available online: http://evtc.fsec.ucf.edu/publications/documents/HI-13-16.pdf (accessed on 15 April 2019).
  14. Coignard, J.; Saxena, S.; Greenblatt, J.; Wang, D. Clean Vehicles as an Enabler for a Clean Electricity Grid. Environ. Res. Lett. 2018, 13, 054031. [Google Scholar] [CrossRef]
  15. Szinai, J.K.; Sheppard, C.J.R.; Abhyankar, N.; Gopal, A.R. Reduced Grid Operating Costs and Renewable Energy Curtailment with Electric Vehicle Charge Management. Energy Policy 2020, 136, 111051. [Google Scholar] [CrossRef]
  16. Loisel, R.; Pasaoglu, G.; Thiel, C. Large-Scale Deployment of Electric Vehicles in Germany by 2030: An Analysis of Grid-To-Vehicle and Vehicle-To-Grid Concepts. Energy Policy 2014, 65, 432–443. [Google Scholar] [CrossRef]
  17. California Department of Motor Vehicles (DMV). Registered Vehicles by Fuel Type in California; CA Department of Motor Vehicles: Sacramento, CA, USA, 2018.
  18. EVAdoption. EV Statistics of the Week: Range, Price and Battery Size of Currently Available (in the US) BEVs—EVAdoption. Available online: http://evadoption.com/ev-statistics-of-the-week-range-price-and-battery-size-of-currently-available-in-the-us-bevs/ (accessed on 17 January 2019).
  19. EVAdoption. EV Statistics of the Week: PHEVs by the Numbers. Available online: http://evadoption.com/ev-statistics-of-the-week-phevs-by-the-numbers/ (accessed on 17 January 2019).
  20. EV Models—EVAdoption. Available online: https://evadoption.com/ev-models/ (accessed on 1 March 2019).
  21. California Energy Commission. Zero-Emission Vehicles and Infrastructure–Tracking Progress; California Energy Commission: Sacramento, CA, USA, 2018.
  22. National Household Travel Survey. 2017. Available online: https://nhts.ornl.gov/ (accessed on 6 April 2019).
  23. National Household Travel Survey 2017—User Guide. 2018. Available online: https://nhts.ornl.gov/assets/2017UsersGuide.pdf (accessed on 6 April 2019).
  24. California Energy Commission. Electricity Assessments Division, California Energy Demand 2018–2030 Revised Forecast, CEC-200-2018-002-CMF; California Energy Commission: Sacramento, CA, USA, 2018; p. 189.
  25. California Energy Commission. Transportation Energy Demand Forecast, 2018–2030; California Energy Commission: Sacramento, CA, USA, 2017.
  26. U.S. Department of Energy, Energy Information Agency. EIA—Electricity Data. Available online: https://www.eia.gov/electricity/monthly/epm_table_grapher.php?t=epmt_1_10_a (accessed on 8 April 2019).
  27. Bedir, A.; Crisostomo, N.; Allen, J.; Wood, E.; Rames, C. California Plug-In Electric Vehicle Infrastructure Projections: 2017–2025; California Energy Commission: Sacramento, CA, USA, 2018.
  28. Annual Generation—Plant Unit. Available online: https://www.energy.ca.gov/almanac/electricity_data/web_qfer/Annual_Generation-Plant_Unit.php (accessed on 17 December 2018).
  29. Western Wind and Solar Integration Study. National Renewable Energy Laboratory. Available online: https://www.nrel.gov/grid/wwsis.html (accessed on 8 April 2019).
  30. U.S. Energy Information Administration. Cost and Performance Characteristics of New Generating Technologies. Annual Energy Outlook 2018; U.S. Energy Information Administration: Washington, DC, USA, 2018.
  31. 2018 ATB, Utility-Scale PV–Plant Cost and Performance Projections Methodology. Available online: https://atb.nrel.gov/electricity/2018/index.html?t=su&s=md (accessed on 14 November 2018).
  32. Wiser, R.; Jenni, K.; Seel, J.; Baker, E.; Hand, M.; Lantz, E.; Smith, E. Expert Elicitation Survey on Future Wind Energy Costs. Nat. Energy 2016. [Google Scholar] [CrossRef]
  33. California Energy Commission. Tracking Progress-Energy Storage. 2018. Available online: https://www.energy.ca.gov/data-reports/tracking-progress (accessed on 4 June 2019).
  34. Bill Text—AB-2514 Energy Storage Systems. Available online: https://leginfo.legislature.ca.gov/faces/billNavClient.xhtml?bill_id=200920100AB2514 (accessed on 8 April 2019).
  35. California Independent System Operator. What the Duck Curve Tells Us about Managing a Green Grid-Fast Facts. 2016. Available online: http://caiso.com (accessed on 7 May 2019).
  36. Governor Edmund G. Brown Jr. Executive Order B-16-2012. Available online: https://www.ca.gov/archive/gov39/2012/03/23/news17472/index.html (accessed on 21 February 2019).
  37. International Renewable Energy Agency (IRENA). Electricity Storage and Renewables: Costs and Markets to 2030; International Renewable Energy Agency (IRENA): Masdar City, Abu Dhabi, 2017. [Google Scholar]
  38. Needell, Z.A.; McNerney, J.; Chang, M.T.; Trancik, J.E. Potential for widespread electrification of personal vehicle travel in the United States. Nat. Energy 2016, 1, 9. [Google Scholar] [CrossRef]
Figure 1. Example plug-in electric vehicle (PEV) Charging Profiles for Weekdays and Weekends.
Energies 13 05277 g001
Figure 2. Unmanaged Charging Demands in California—2017 and 2030—Mid Scenario
Energies 13 05277 g002
Figure 3. SWITCH Model Overview [12].
Energies 13 05277 g003
Figure 4. SWITCH Results for 2030 in California—Mid Demand Scenario—Power Capacity.
Energies 13 05277 g004
Figure 5. California Independent System Operator Duck Curve [35].
Energies 13 05277 g005
Figure 6. Curtailment in California 2030 with the influence of PEVs.
Energies 13 05277 g006
Figure 7. California Managed Charging: April 2030—Mid Scenario—Ramp-Rate Mitigation.
Energies 13 05277 g007
Table 1. California Transportation and Energy/Environmental Policy Drivers.
SourceDate EffectiveContent
EO B-16-2012 (Brown)23 March, 2012
  • 1 million ZEVs on the road by 20231.
  • 5 million ZEVs by 2025
  • By 2025, install 200 hydrogen stations and 250,000 ZEV chargers (incl. 10,000 DCFC)
SB 350 (DeLeon)7 October 2015
  • Require utilities to plan and invest in PEV charging
SB 32 (Pavley/Garcia)1 January 2017
  • Extends landmark California climate bill AB32 to reach a 40% reduction in 1990 greenhouse gas emissions by 2030
EO B-48-18 (Brown)26 January 2018
  • Goal of 5 million ZEVs by 2030
SB100 (DeLeon)10 September 2018
  • Requires California electricity generation to transition to 100% carbon neutral by 2045
Air Resources Board1 January 2019
  • Low carbon fuel standard extended to 2030 with 20% reduction in carbon-intensity of transportation fuels from 2010 level
Table 2. Vehicle Stock as of January 2018 from California Department of Motor Vehicles [17].
Vehicle TypeRegistered VehiclesPercent of ZEVsPercent of Total Stock
BEV178,00051.9%0.73%
PHEV164,00046.9%0.66%
FCEV51171.2%0.02%
All ZEVs/PHEVs432,480100%1.41%
All Vehicles30,660,209 100%
Note: BEV is battery electric vehicle; PHEV is plug-in hybrid electric vehicle; FCEV is fuel cell electric vehicle; and ZEV is zero-tailpipe emission vehicle.
Table 3. Electric Vehicle Assumptions for Simulation.
Consumption (kWh/100 km)Battery Pack Size (kWh)Max Charging Power (kW)Resulting Range (km)
BEV17.7340120~226
PHEV28.4677.2~24.59
Table 4. Charging Infrastructure Assumptions for Modeling Year 2017.
No ChargerAC Level 1: 1.4 kWAC Level 2: 7.2 kWDC: 24 kWDC: 50 kWDC: 120 kW
Home10%70%20%---
Work60%-30%5%5%-
Other65%-20%5%5%5%
Table 5. Total Annual Charging Demand in 2017.
CategoryValue
Total PEVs342,000
Annual Charging Demand466.4 GWh
Annual Electricity Consumption in California~292 TWh
Percentage of Annual Total Consumption~0.16%
Table 6. Key variables for estimates electricity consumption in California [24,25].
Average Annual Growth (%)
Low Demand CaseMid Demand CaseHigh Demand Case
2017–20300.99%1.2%1.59%
Total Net Consumption (GWh)
2030326,026339,160354,209
Number of PEVs (millions)
20302.63.33.9
Table 7. Electric Vehicle Assumptions for Year 2030 Simulation.
Consumption (kWh/100 km)Battery Pack Size (kWh)Max Charging Power (kW)Average Range (km)
BEV17.7388350~496
PHEV28.4615.422~54
Table 8. PEV Fleet Input Assumptions for 2030.
CategoryAssumption
BEV/PHEV Ratio60%/40% (all cases)
Low PEV Forecast2.6 million vehicles
Mid PEV Forecast3.3 million vehicles
High PEV Forecast3.9 million vehicles
Table 9. Charging Infrastructure Assumptions 2030 (unmanaged).
No ChargerAC Level 1—1.4 kWAC Level 2—7.2 kWDC—24 kWDC—50 kWDC—120 kW
Home10%30%60%---
Work25%-50%10%10%5%
Other25%-50%10%10%5%
Table 10. Annual PEV Charging Demand in 2030—V2G-SIM Results.
ScenarioTotal PEVs (Million)Total Charging Demand (TWh)
Low Charging Demand2.64.38
Mid Charging Demand3.35.56
High Charging Demand3.96.57
Table 11. Total Annual Charging Demand in 2030—Mid Scenario.
CategoryEstimate
Total ZEVs in 20303.3 million
Annual EV Charging Demand in 20305.56 TWh
Annual Electricity Consumption in 2030~339 TWh
Percentage of Annual Total Consumption in 2030~1.64%
Percentage of Annual Total Consumption in 2017~0.16%
Table 12. Cost Factors for New Renewable Generators.
Generator TypeOvernight Capital Costs in 2020 ($/kW)Percent Price Decline by 2030Resulting Overnight 2030 Price ($/kW)Connection Costs ($/kW)Operating Costs ($/kW/Year)
Solar Fixed Tilt176317%146374.222.02
Solar Tracking200417%166374.222.02
Wind On-shore154814%133174.247.47
Sources: [30,31,32].
Table 13. SWITCH Modeling Results for California—Generation Capacity in GW.
YearWind
(GW)
Solar
(GW)
Nat. Gas
(GW)
Biomass
(GW)
Geotherm.
(GW)
Hydro.
(GW)
Coal
(GW)
Nuclear
(GW)
Total
(GW)
2017609012,47844,2581168273011,6931898239382,708
203039,57227,47344,2581168273011,69318980128,792
Table 14. Charging Infrastructure Assumptions 2030 (Managed V1G).
HomeWorkOther
No Charger10%25%25%
AC Level 1—1.4 kW30%--
AC Level 2—7.2 kW (uncontrolled)20%20%50%
AC Level 2—7.2 kW (V1G)40%30%-
DC—24kW (V1G)-10%10%
DC—50 kW (V1G)-10%10%
DC—120 kW (V1G)-5%5%
Table 15. Charging Infrastructure Assumptions 2030 (Managed—V2G).
HomeWorkOther
No Charger10%15%25%
AC Level 1—1.4 kW20%--
AC Level 2—7.2 kW (uncontrolled)10%20%50%
AC Level 2—7.2 kW (V1G)30%20%-
AC Level 2—7.2 kW (V2G)20%10%-
DC—24 kW (V1G)-10%10%
DC—24 kW (V2G)10%10%-
DC—50 kW (V1G)-10%10%
DC—120 kW (V1G)-5%5%
Table 16. Curtailment Figures for California—Mid Scenario 2030—3.3 Million ZEVs.
No PEVsUnmanaged PEVsManaged PEVs with V1GManaged PEVs with V2G
Total Demand in TWh334.81339.19339.19339.19
Curtailment in TWh
Peak-Valley Optimization6.647.094.392.58
Ramp-Rate Optimization3.432.45
Curtailment in % of Total Generation
Peak-Valley Optimization1.942.041.270.75
Ramp-Rate Optimization0.970.71
Table 17. Estimated 2030 Levels of Grid Curtailment and Power/Energy Capacity from V1G/V2G.
Renewable Energy Curtailment
(TWh)
Equivalent Power Capacity
(MW)
Equivalent Energy Capacity
(MWh)
V1G3.43750030,000
V2G2.4512,50050,000
Table 18. Stationary Storage Equivalents and Relative Investment Costs to Managed Charging Scenarios in California—Mid Demand 2030 Scenario.
Power Capacity (MW)Energy Capacity (MWh)Equivalent Storage Cost (Billion U.S. $2019)
V1G750030,00015.77
V2G12,50050,00026.28

