Article

A Probabilistic Modeling Based on Monte Carlo Simulation of Wind Powered EV Charging Stations for Steady-States Security Analysis

1
Department of Electrical Engineering, Sangmyung University, Seoul 03016, Korea
2
Department of Climate and Energy Systems Engineering, Ewha Womans University, Seoul 03760, Korea
*
Author to whom correspondence should be addressed.
Energies 2020, 13(20), 5260; https://doi.org/10.3390/en13205260
Submission received: 2 September 2020 / Revised: 28 September 2020 / Accepted: 5 October 2020 / Published: 10 October 2020

Abstract

:
As renewable energy resources such as wind and solar power are developing and the penetration of electric vehicles (EVs) is increasingly integrated into existing systems, uncertainty and variability in power systems have become important issues. The charging demands for EVs and wind power output are recognized as highly variable generation resources (VGRs) with uncertainty, which can cause unexpected disturbances such as short circuits. This can deteriorate the reliability of existing power systems. In response, research is required to identify the uncertainties presented by VGRs and is required to examine the ability of power system models to reflect those uncertainties. The deterministic method, which is the most basic method that is currently in use, does not reflect the uncertainty of system components. Therefore, this paper proposes a probabilistic method to assess the steady-state security of power systems, reflecting the uncertainty of VGRs using Monte Carlo simulation (MCS). In the proposed method, the empirical EVs charging demand and wind power output data are modeled as a probability distribution, and then MCS is performed, integrating the power system operation to represent the steady-state security as a probability index. To verify the method proposed in this paper, a security analysis was performed based on the systems in Jeju Island, South Korea, where the penetration of wind power and EVs is expanding rapidly.

1. Introduction

In an effort toward reducing greenhouse gas emissions, renewable energy resources, especially wind and solar power, are drawing significant attention worldwide. The power sector in South Korea is also changing with the gradual closure of thermal and nuclear power plants. Korea aims to increase its rate of renewable energy generation from 7% to 20% by 2030 and plans to supply approximately 97% of the capacity of new facilities mainly through wind and solar power [1]. Korea’s other goal is to supply 1 million electric vehicles (EVs), of which 380,000 are intended to replace all internal combustion engine vehicles in Jeju Island [2]. Accordingly, a rapid change in the existing power system is expected. In particular, the reliability of the power system may be negatively affected by wind power and the charging demand for EVs. Wind power generation is significantly influenced by meteorological factors such as wind speed and temperature, and EV charging demand is influenced by users’ charging patterns [3]; thus, both these factors have variable characteristics. In the future, if large-scale wind power and EV charging demand are integrated into the existing power system to achieve the policy goal, problems such as unexpected system short circuits may occur. To cope with this problem, it is necessary to examine the uncertainty of EV charging demand and wind power, and to study the system security evaluations reflecting those uncertainties. The deterministic approach is the most basic method to analyze the security of a system. According to this approach, the deterministic elements of a power system cannot reflect uncertainties; therefore, the risk of security assessment results can be very high. To compensate for this method, a probabilistic approach can be implemented. The probabilistic method has great potential to manage uncertainty in power systems. Consequently, we used Monte Carlo simulation (MCS) as a probabilistic method to model the uncertainty of wind power output and EV charging demand. This method is time-consuming but highly accurate. The seasonal uncertainty of EVs and wind power outputs is modeled by MCS to integrate with the Jeju Island’s power system, where wind power generation and EVs are rapidly increasing. Then, the security of the power system reflecting the uncertainty is evaluated by simulation code developed in this paper. We developed code to enable MCS-based repetitive power flow calculation using the Python API of PSS/E; the security of the power system is expressed as a probabilistic index through the results of the MCS. Through comparison with the deterministic method, the proposed method proved that it is efficient to set the priorities of expansion and reinforcement for transmission systems, considering the grid security.

Literature Review

Many independent system operators (ISOs), who are constantly expanding the use of variable resources, apply probabilistic methods to congestion management, power system reinforcement, and expansion plans. Germany performs transmission network security evaluation for various scenarios using probabilistic techniques and uses them for optimization of re-dispatch and curtailment through system congestion prediction [4]. EirGrid, a transmission operator in Ireland, also uses probabilistic indicators to identify system risks and to take appropriate real-time action [5]. The Electric Reliability Council of Texas (ERCOT) solves optimization problems in grid planning using probabilistic models to account for uncertainties in large-scale wind power generation [6,7].
The following papers evaluated power system security using a probabilistic approach. In [8], the assessment method of power system contingency security using MCS with the developed software is proposed. In [9], the self-organizing map (SOM) and MCS-based power system security evaluation method were developed and applied to IEEE RTS. In [10], the authors proposed a power system risk assessment method through a hybrid method of fuzzy sets and MCS, and proved it to be an example using an actual regional system. These methods evaluated the security and risk of the power system based on MCS, but they did not consider the variable energy resources (VERs).
In the following papers, MCS was used to model the uncertainty of VERs including wind power and EV charging demands. In [11], the authors used MCS to evaluate the effect of wind turbines on the network in the market environment, and wind speed was modeled as a probability distribution. In [12], the modeling method that considers the correlation of wind speed is proposed and the authors applied this method to the IEEE 118 Bus power system to prove the accuracy of proposed method. In [13], the authors proposed the optimal offline control settings method based on a stochastic model of EV demand/supply and the wind power generation model, and they applied it to the 14-busbar test system. In [14], the authors analyzed the effect of EV charging on the load profile by a probabilistic method to model wind and solar power generation in the distribution system.
In various literature, variable energy resources were modeled or the security of power systems was evaluated through probabilistic methods. However, in this paper, both renewable energy and electric vehicle charging demands are considered. The novelty of this paper is that we model the variable energy resources and evaluate the steady-state security of power systems in a probabilistic method in integration with Jeju Island’s actual power system.

2. Probabilistic Analysis of Wind Power Output and EVs Charging Demand

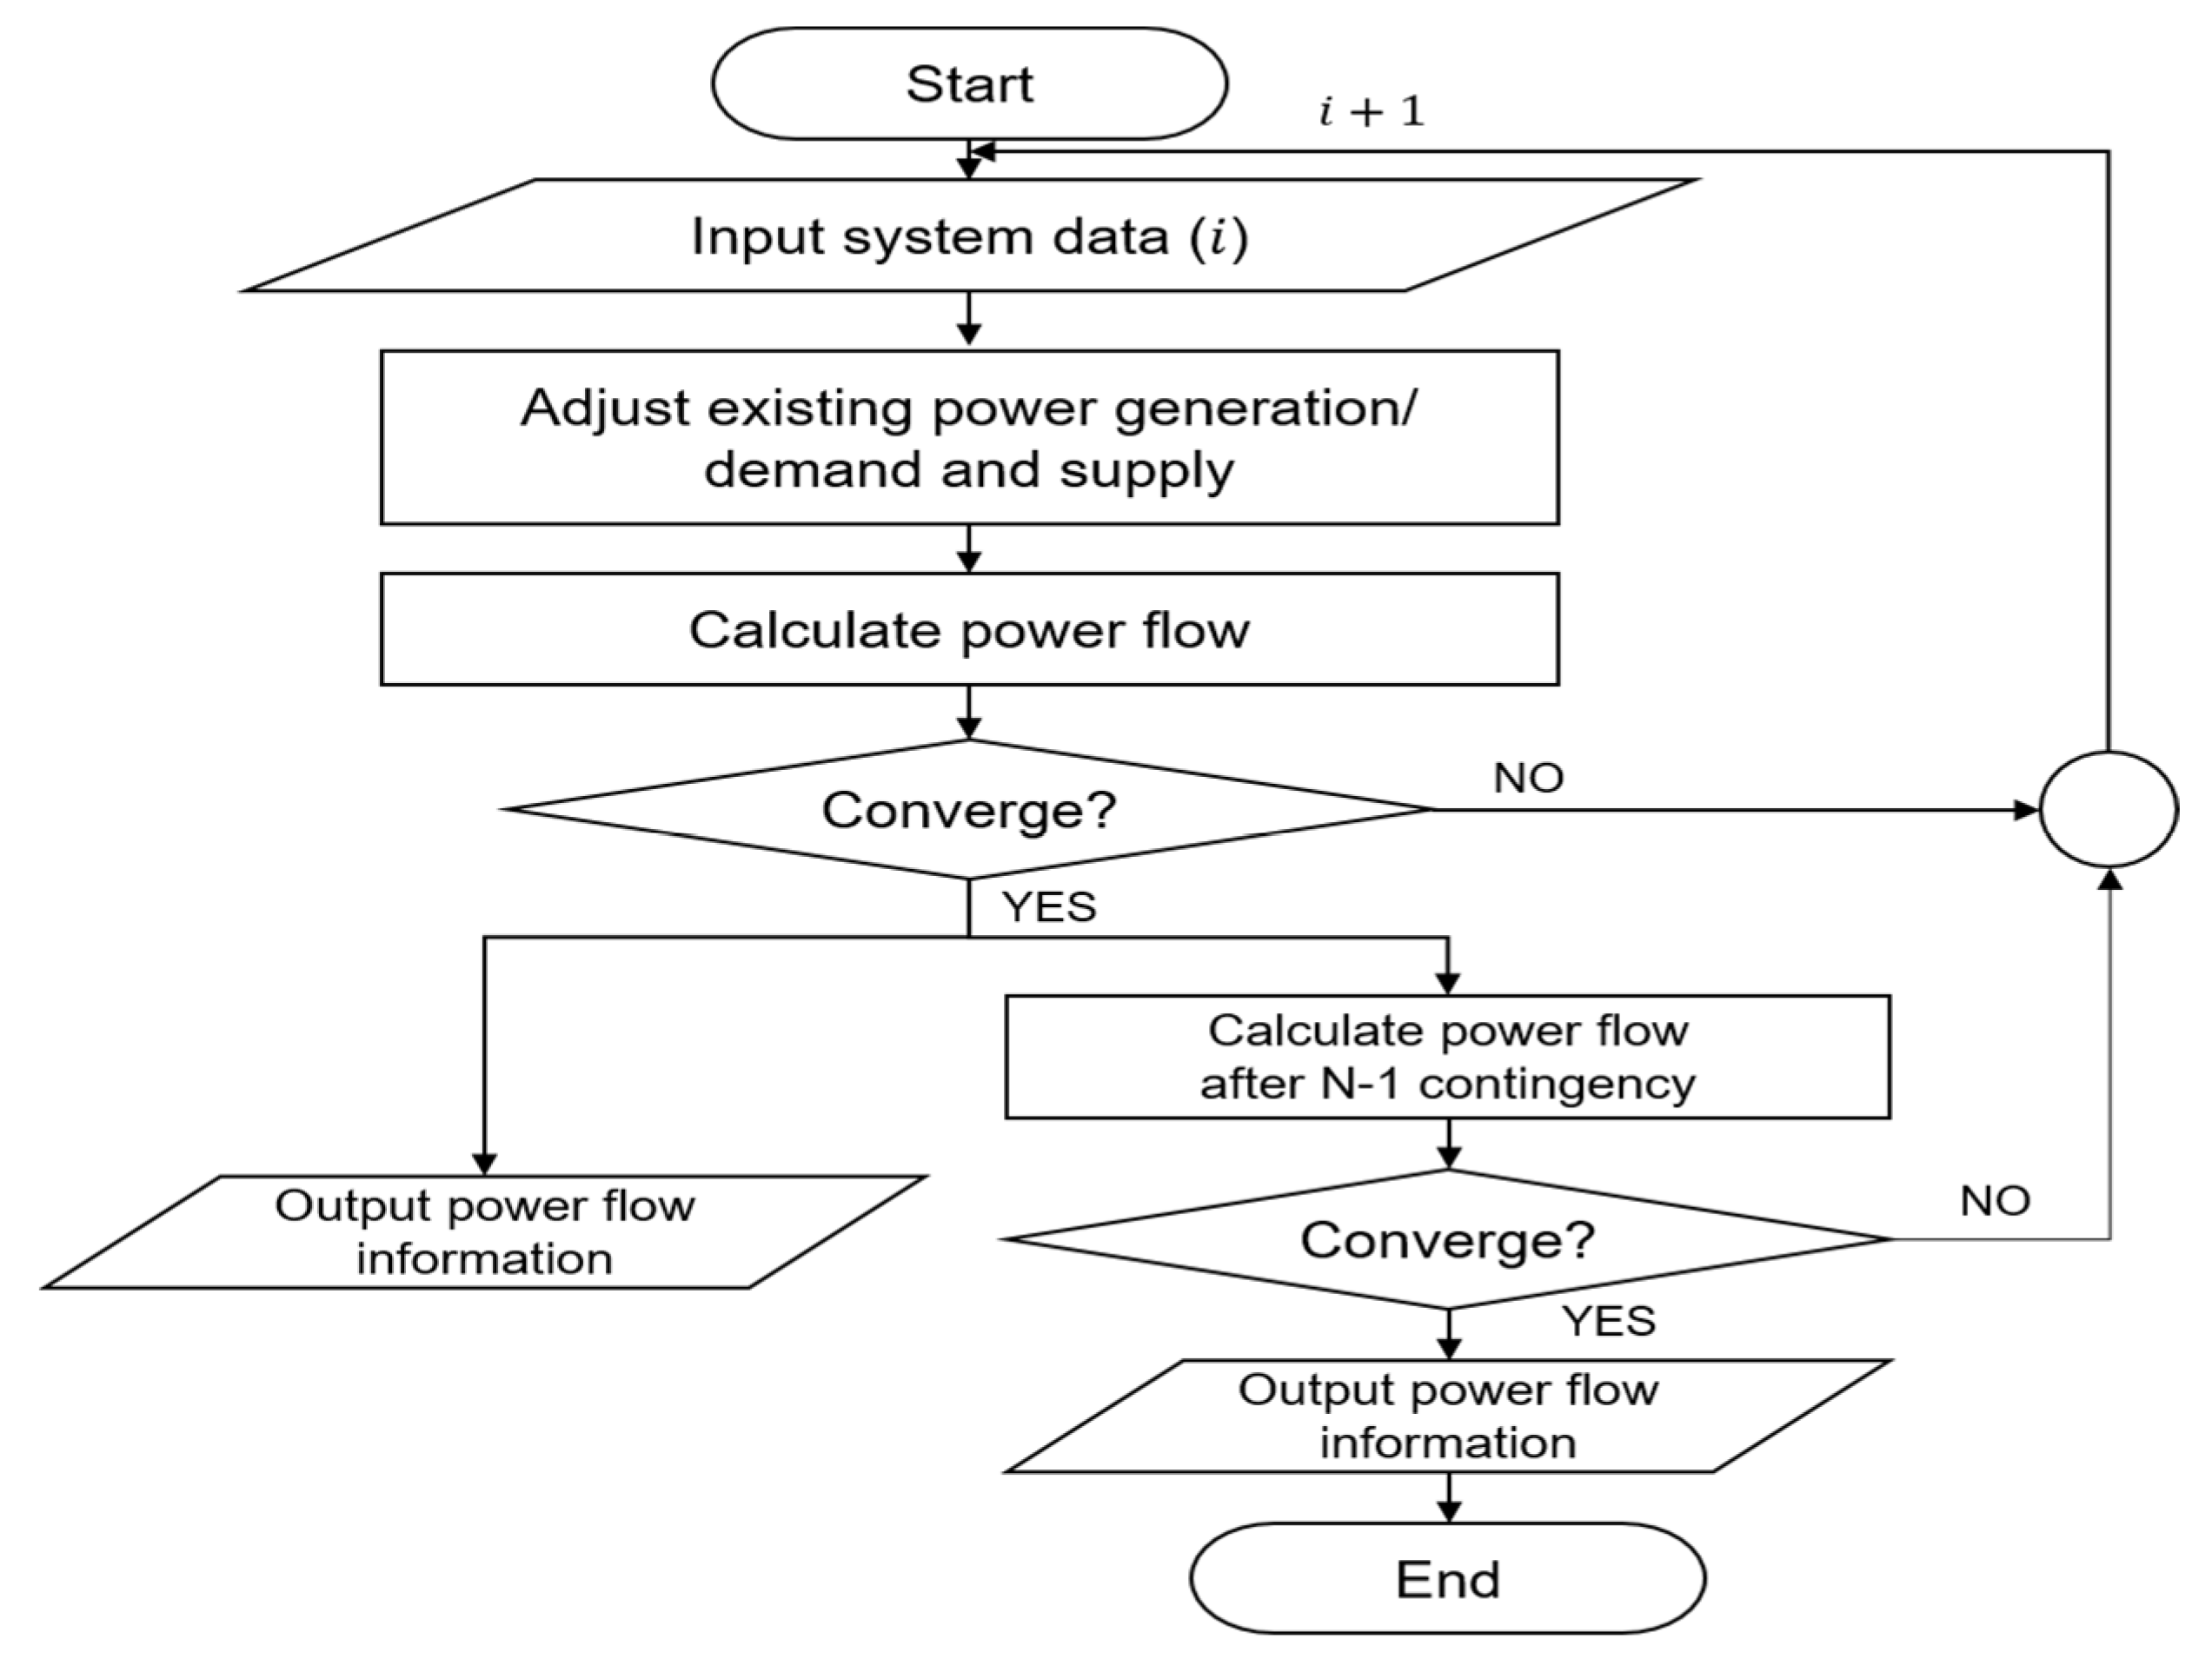
The process of evaluating system security based on the MCS proposed in this paper is shown in Figure 1.
In the first step, the uncertainty in security assessment is modeled by performing probabilistic analysis of the EV charging demand and wind power output. A specific distribution suitable for each data type is selected, and random numbers are extracted based on the distribution. The numerous random numbers generated are used as input data for the system. In the second step, power flow analysis is performed for the random numbers extracted. The results of the power flow calculation have a stochastic indicator, and a highly reliable indicator facilitates accurate interpretation of the security of the power system.
This section describes in detail the processing power system input data of Step 1 shown in Figure 1, and Step 2 is described in Section 3. To understand the uncertainty of the EV charging demand and wind power output in Jeju Island, probabilistic analysis was performed using a probability distribution to reflect this uncertainty in the power system. Because EV charging demand and wind power are variables with uncertainty, all possible data within a certain period should be considered. The probability distribution can be modeled considering all possible random variables, and it can be ignored in some extreme cases where the frequency of occurrence is very small [15]. Therefore, probabilistic analysis using probability distribution is a simple approach to deal with uncertainties. The probability distributions were fitted using actual wind power output data and EV charging demand data for the past year. In the case of EV charging demand data, the accumulated charging amount (MWh) for one year was converted into one-hour unit electric power (MW) for this study. Jeju Island has a distinct climate for each season, which affects electricity demand and supply patterns. Therefore, probabilistic analysis was performed by dividing one-year data into four seasons.

2.1. Gaussian Mixture Distribution of EVs Charging Demand

EV charging demand data were obtained from 451 charging stations located in Jeju Island. These charging stations were classified based on 14 substation locations to aggregate charging power data. The Euclidean distance in [16] was used as a method of mapping EV charging stations to their corresponding substation location, and the point where the Euclidean distance between the charging station and the substation was the minimum was selected. Table 1 shows the EV charging demand information classified by substations. The substation numbers shown in Table 1 are independent of the actual numbers. Max values are peak demands for one year, and the number of charging stations indicates the number of charging stations included in each substation.
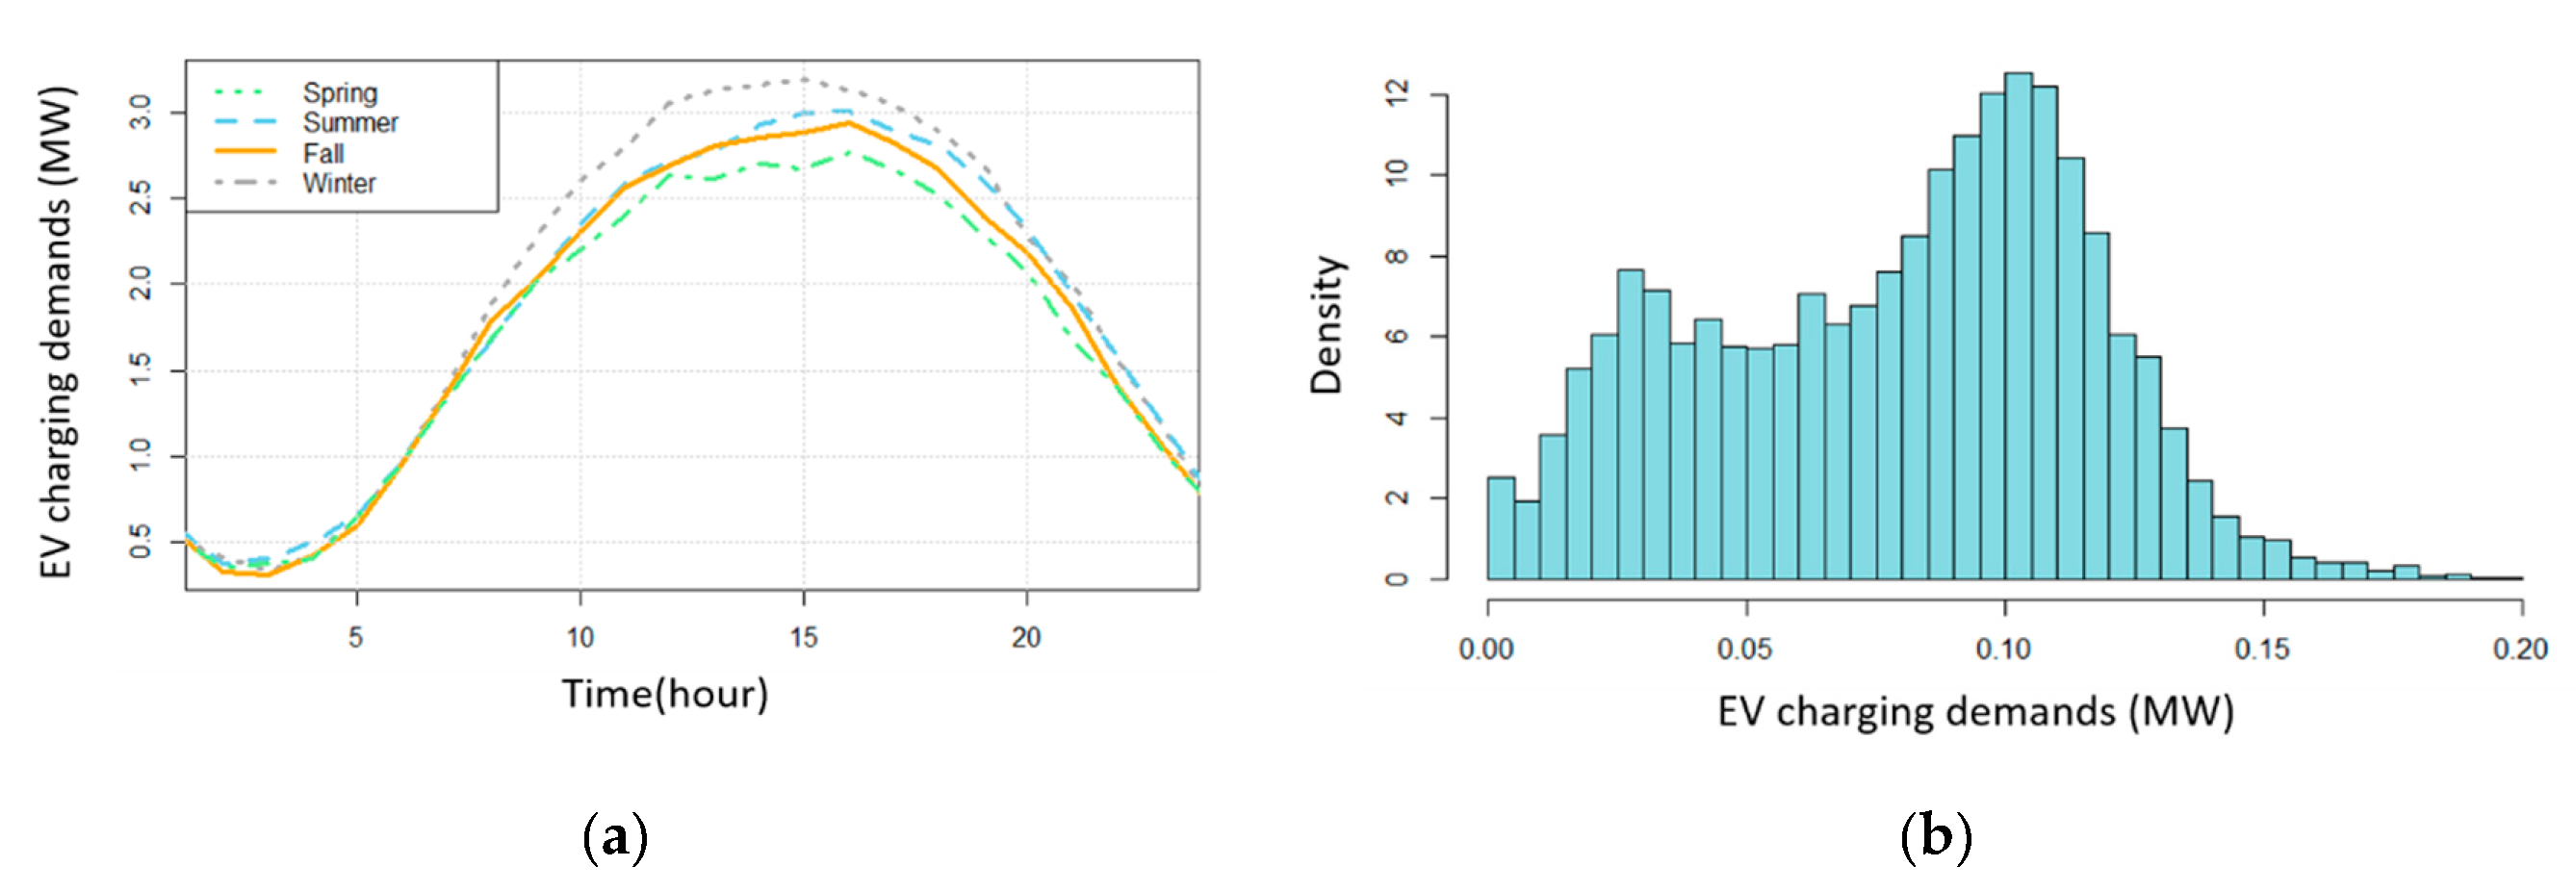
Since EV charging power varies significantly according to the user’s charging pattern, it is essential to consider charging power over a long period of time. Figure 2 shows the daily charging power and the histogram of the charging power used in Jeju Island in one year. Figure 2a shows the charging demands over time at a specific charging station, and Figure 2b shows a histogram of charging demand per hour over a year.
As illustrated in Figure 2, the charging power for each time zone is largely divided into an increasing time zone and a decreasing time zone. Due to this temporal characteristic, the charging data can be divided into two or more populations as shown in Figure 2b, and in this case, it is possible to obtain a more accurate estimate by applying a Gaussian mixture distribution rather than the widely used single distribution [17]. Therefore, in this study, a Gaussian mixture distribution was used to fit the EV charging demand. To estimate the parameters of the Gaussian mixture distribution, the expectation-maximization (EM) algorithm was used [18]. The EM algorithm alternately applies the expected value (E) step of calculating the expected value of the log likelihood as the estimation value of the parameter and the maximization (M) step of obtaining parameter estimation values maximizing the expected value [19]. The algorithm ends when the increment between the likelihoods in each process falls below a predefined reference point. A mixed normal distribution based on sample data using the EM algorithm formula proposed in [20] is shown in Figure 3.
The histogram in the figure represents the actual charging power for each season, and the red and green lines represent the Gaussian mixture distribution optimized using the EM algorithm. Each of the two normal distributions has a probability of p < 1, which indicates the probability of belonging to one of the two normal distributions. Table 2 presents the parameters of the mixed normal distribution shown in Figure 3.
Here, µ is the mean of the sample data, and σ is the standard deviation of the sample data. The normal distribution is defined by the mean and standard deviation of random variables. The variable p is the probability that each normal distribution is included, and the sum of p1 and p2 is 1. For the analysis of the security assessment in Section 3, the same method used above is applied, and all EV charging demand data for the 14 substations were fitted to the seasonal mixed normal distribution.

2.2. Weibull Distribution of Wind Power Output

Table 3 shows the data used for probabilistic analysis of the output of six wind farms located in Jeju Island. Max values represent the peak output of each wind farm for one year.
Several studies examining renewable energy sources have used the Weibull probability distribution [21,22,23,24,25]. Moreover, it is commonly used in wind energy assessments [21]. The Weibull distribution for a random variable v can be expressed by Equation (1) [22]:
{ f ( v ; k , c ) = ( k c ) ( v c ) ( k 1 ) e ( v c ) k     ,   v > 0 ,           k , c > 0 0 ,       v 0
where c is a scale parameter with the same units as the random variable v, and k is a shape parameter. In this paper, wind power output is represented by v. We used an empirical method to estimate the shape (k) parameter and scale (c) parameter of the Weibull distribution [25]. The empirical method based on two parameters is defined with Equations (2) and (3):
k = ( σ v ¯ ) 1.086
c = v ¯ Γ ( 1 + 1 k )
where v ¯   is the mean, σ is the standard deviation, and Γ is the gamma function. In addition, the mean and standard deviation of the variables are calculated using Equations (4) and (5), respectively:
v ¯ = ( 1 n i = 1 n v i )
σ = [ ( i = 1 n ( v i v ¯ ) ] 0.5
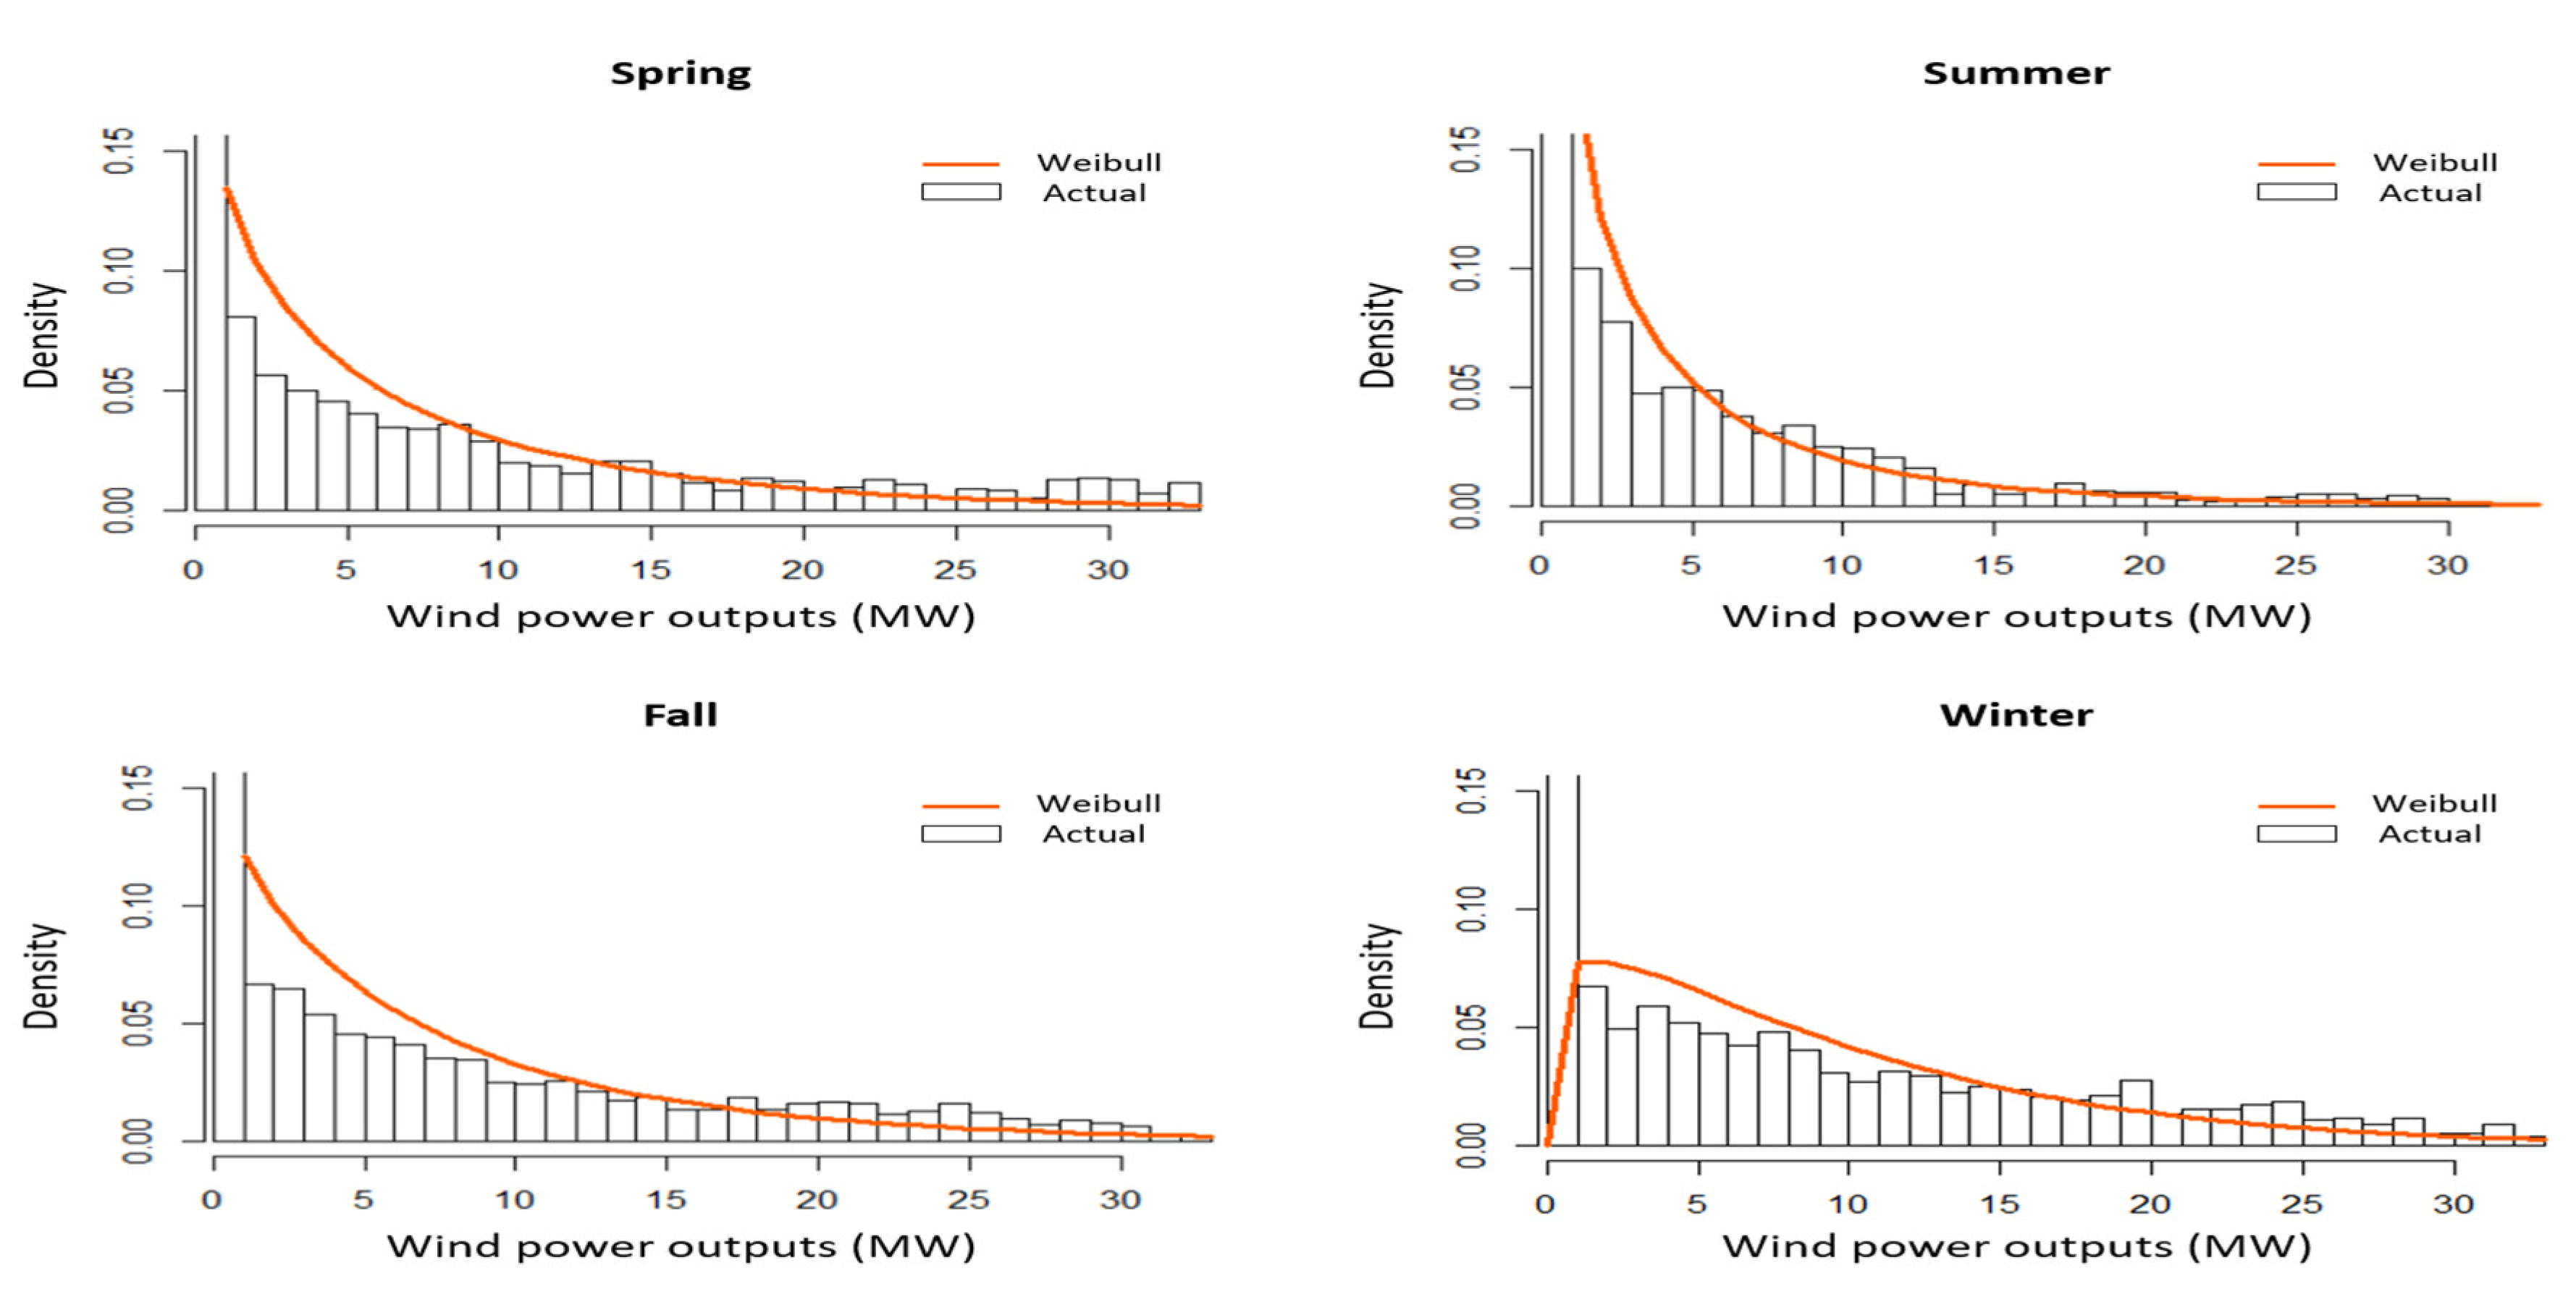
where n is the number of observations and v i is the wind power output measured at the interval i. Figure 4 shows the fitted Weibull distribution based on the sample wind power output data.
According to Figure 4, the shape of the Weibull distribution in winter is significantly different from the shapes of the distribution in other seasons. This means that the win power output in winter is higher than the output in other seasons. Through the parameters shown in Table 4, the difference in the probability of occurrence of seasonal output can be confirmed.
As the shape parameter increases, the mode value of the random variable tends to increase. Therefore, it can be interpreted that Jeju Island generates a large amount of wind power in the winter and a low amount in the summer. We performed stochastic analysis of the data obtained from six wind farms in the same way that was used to analyze the steady-state system security of Jeju Island.

3. Steady-State Security Analysis Method based on Monte Carlo Simulation (MCS)

To integrate large-scale EV charging demand and wind power output with the power system, the power system operator needs to consider all possible situations. Therefore, it is very important to deal with uncertainty through a stochastic approach rather than a deterministic approach. In this paper, MCS was performed for the stochastic method. MCS is a probabilistic simulation for decision-making in uncertain situations, and it can be used to obtain stochastic or accidental results of random variables [26]. MCS is divided into three main steps. (1) The first step is to obtain the probability density function of the variable with uncertainty and express it as a cumulative probability distribution. (2) The second step sets the range of the probability distribution according to the range of the variables. (3) The third step is to perform a simulation for randomization based on the range of the probability distribution. Random numbers extracted via these three steps can be interpreted in various ways for decision-making. In this study, 10,000 scenarios for probabilistic security analysis were generated through 10,000 simulations. To evaluate the security of a power system using MCS, we developed Python- and PSS/E-based code. Based on PSS/E, a software that can evaluate the steady-state security of the transmission system, we developed an MCS-based algorithm that can represent the security of power system as a probabilistic index by performing 10,000 power flow calculations. We added the automatic function for iterative power flow calculation and probabilistic result analysis using the Python-PSS/E API. The developed code consists of the algorithm shown in Figure 5.
To perform the first step of the algorithm, the EV charging demand and the wind power output, which is a random variable, were respectively fitted with the two proposed probability distributions. Table 5 shows the parameters of the mixed normal distribution of the EV charging demand categorized according to the 14 substations, and Table 6 shows the parameters of the Weibull distribution of wind power output obtained from six wind farms. The values shown in Table 5 and Table 6 were calculated using the respective probability distribution parameter estimation method and formula described in Section 2.
We performed MCS of the EV charging demand and wind power output, represented by the probability distributions shown in the tables above, and generated system input data for power flow calculations. The wind power output and the EV charging demand are inputs to the power system supply and demand, respectively. Before performing 10,000 power flow calculations, the existing power generation, supply, and demand were adjusted according to the new input data. If the power flow calculation reached convergence, N-1 contingency analysis was performed as the next step. If the power flow calculation reached divergence, the system input proceeded to the next scenario. The N-1 contingency was assumed to be the single-line failure of the critical transmission line in Jeju Island.

4. Case Study: Jeju Island

Jeju Island is the largest island in Korea, and according to the “Carbon Free Island Jeju”, the government aims to expand the capacity of wind turbines to 2.35 GW and supply 100% of electric vehicles [27]. To this end, offshore wind farms in Jeju Island are constantly increasing, and the government is building an electric vehicle infrastructure to encourage the conversion to EVs. In this section, a steady-state security analysis was conducted to reflect the uncertainty of EV charging demand and wind power output for Jeju Island’s system. In Jeju Island, power is generated through steam, liquefied natural gas (LNG) combined cycle power, wind, and solar energy [28]. In addition, high-voltage direct current (HVDC) is operated independently from the mainland and generates approximately 30% of the power for Jeju Island as of 2019. For the case study for Jeju Island, the base cases of each season were modeled to have a supply reserve of 10%, based on the seasonal peak load as shown in Table 7.
Using the base cases modeled for different seasons, 10,000 power flow calculations were performed and the N-1 contingency analysis was assumed according to the 10,000 scenarios. Whenever a new scenario was entered, the existing power generation and overall supply and demand were adjusted. To compare the results of the probabilistic power system security analysis, the power system for the deterministic method was modeled as shown in Table 6. In addition, the deterministic values such as the maximum values of the EV charging demands and rated capacity of the wind farm are input for the steady-state power system security analysis.
Table 8 and Table 9 show the results of the steady-state power system security analysis, reflecting the uncertainties of the EV charging demands and wind power outputs for Jeju Island’s power system. These are the results of the post contingency analysis for the winter, when the security of the Jeju Island’s power system is the most vulnerable of the four seasons. Table 8 shows the voltage (p.u.) of each bus and Table 9 shows the MVA of the line load (%) for each transmission line. The bus numbers shown in the tables are randomly assigned numbers and are not related to the actual bus numbers associated with the 14 Jeju electric vehicle charging stations.
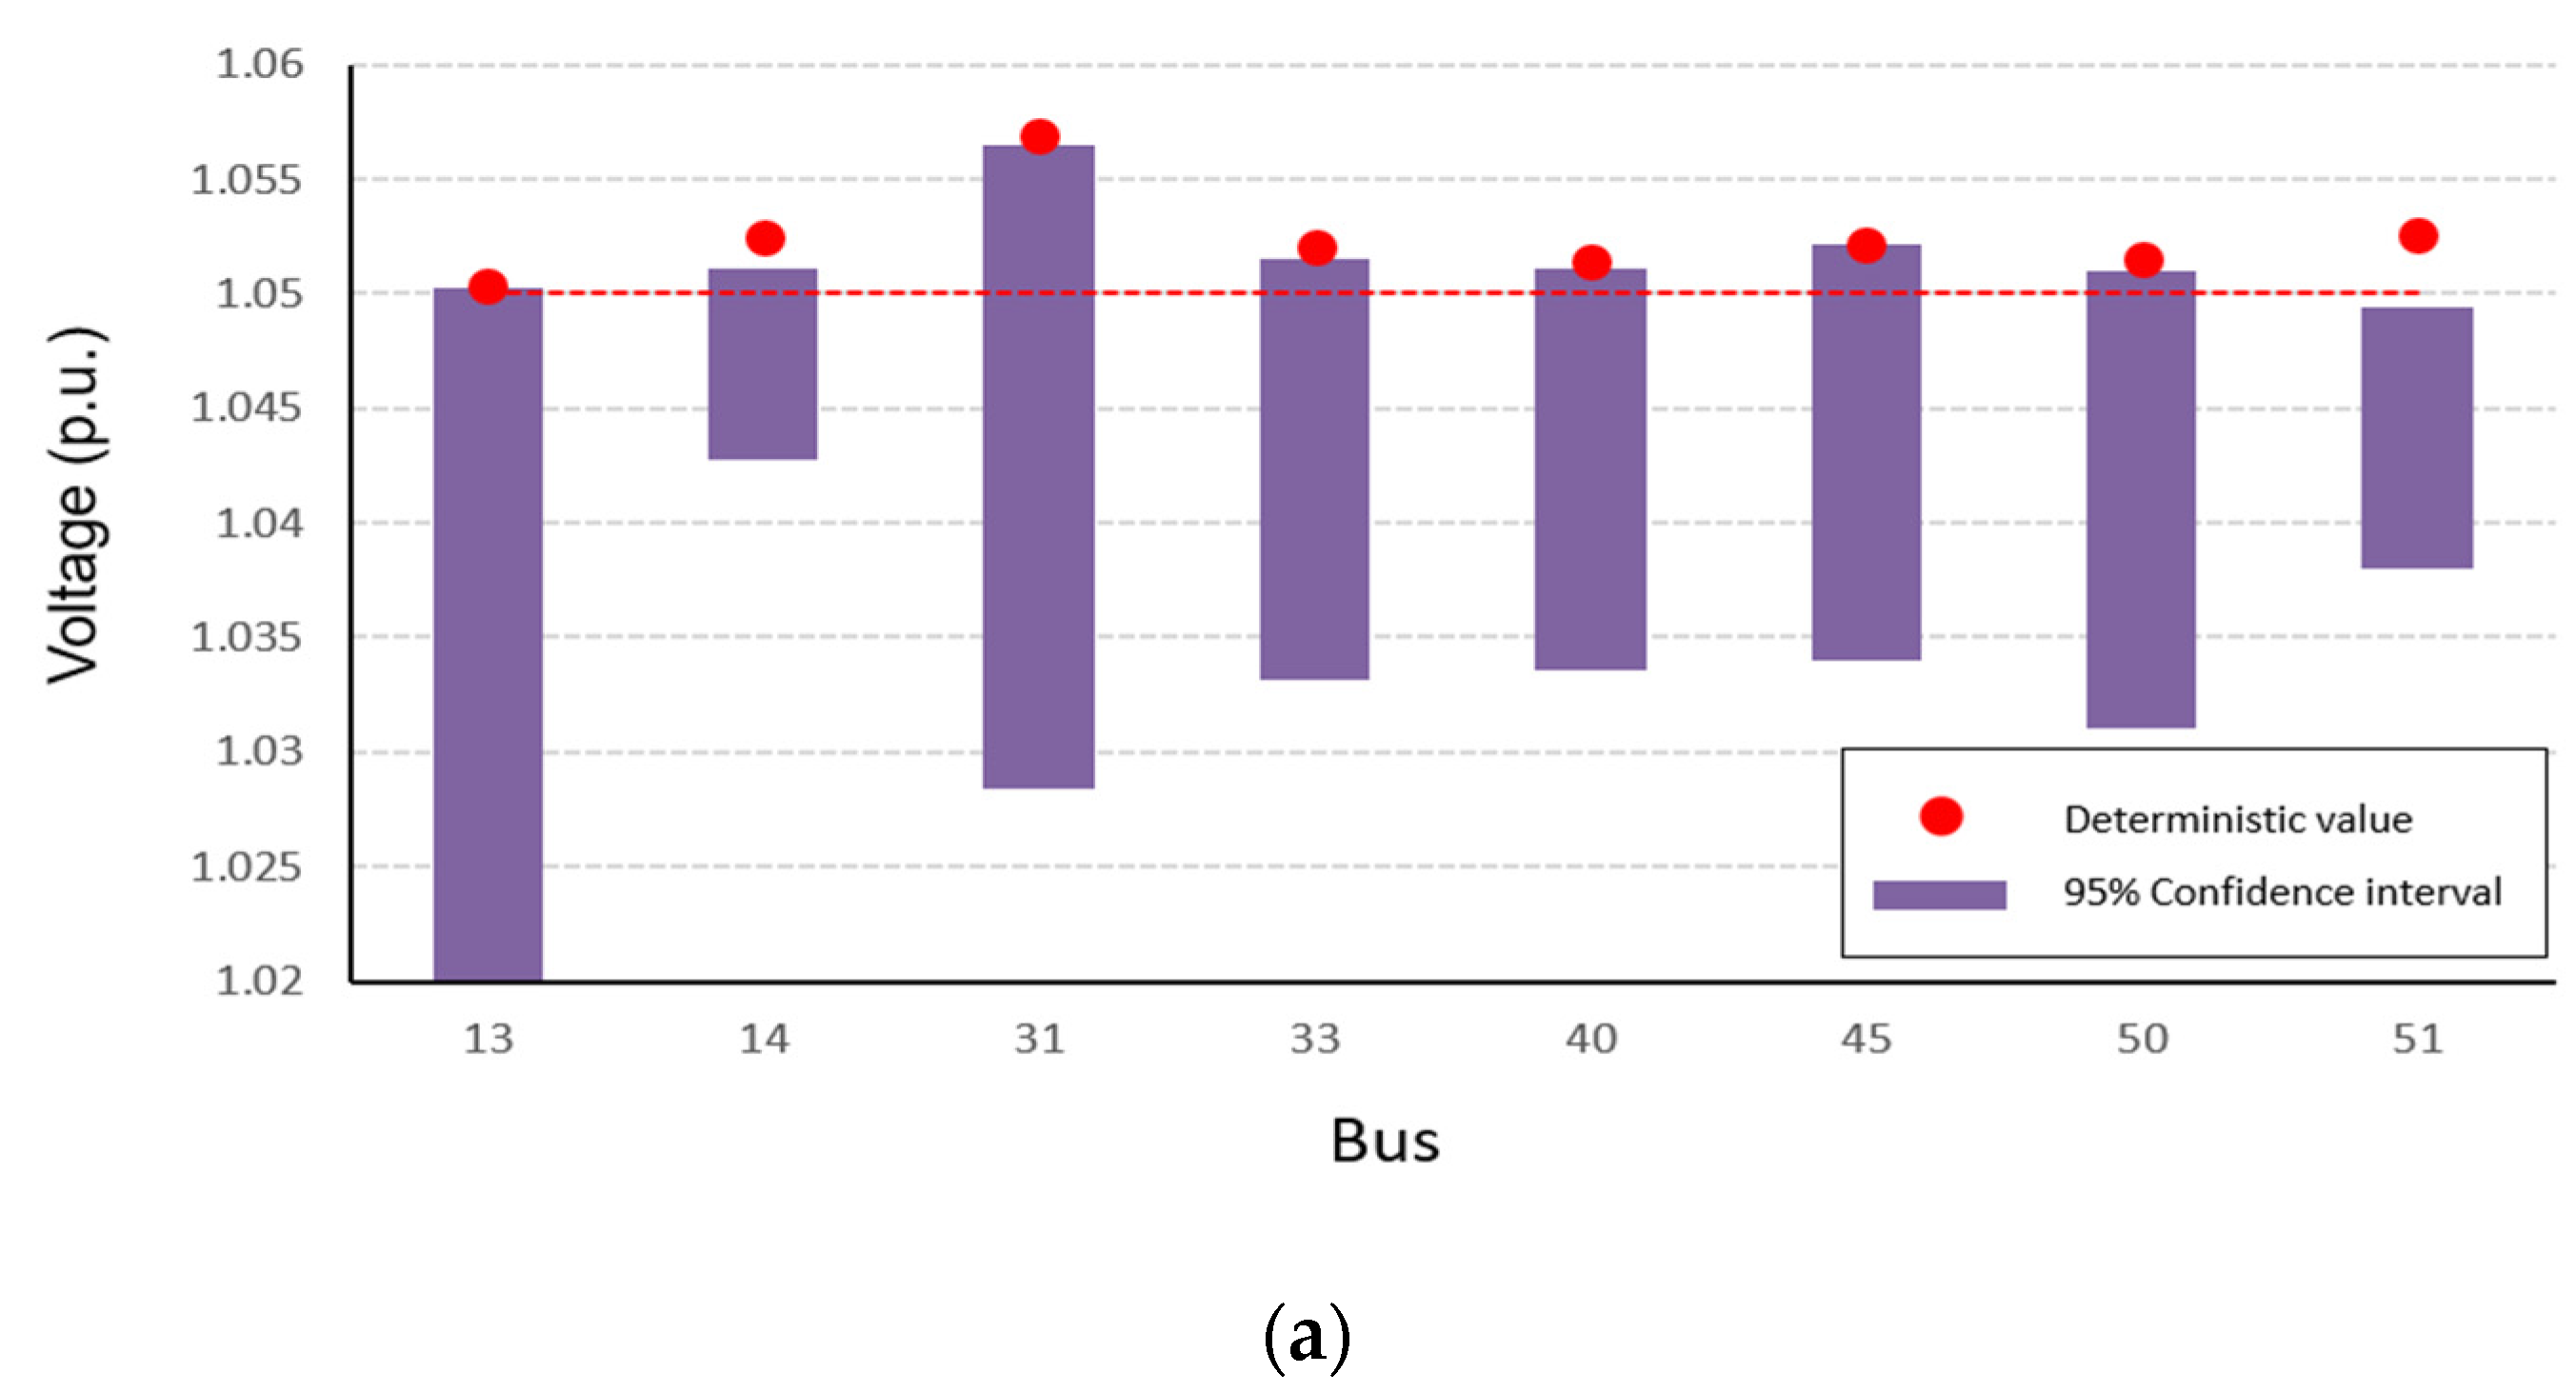
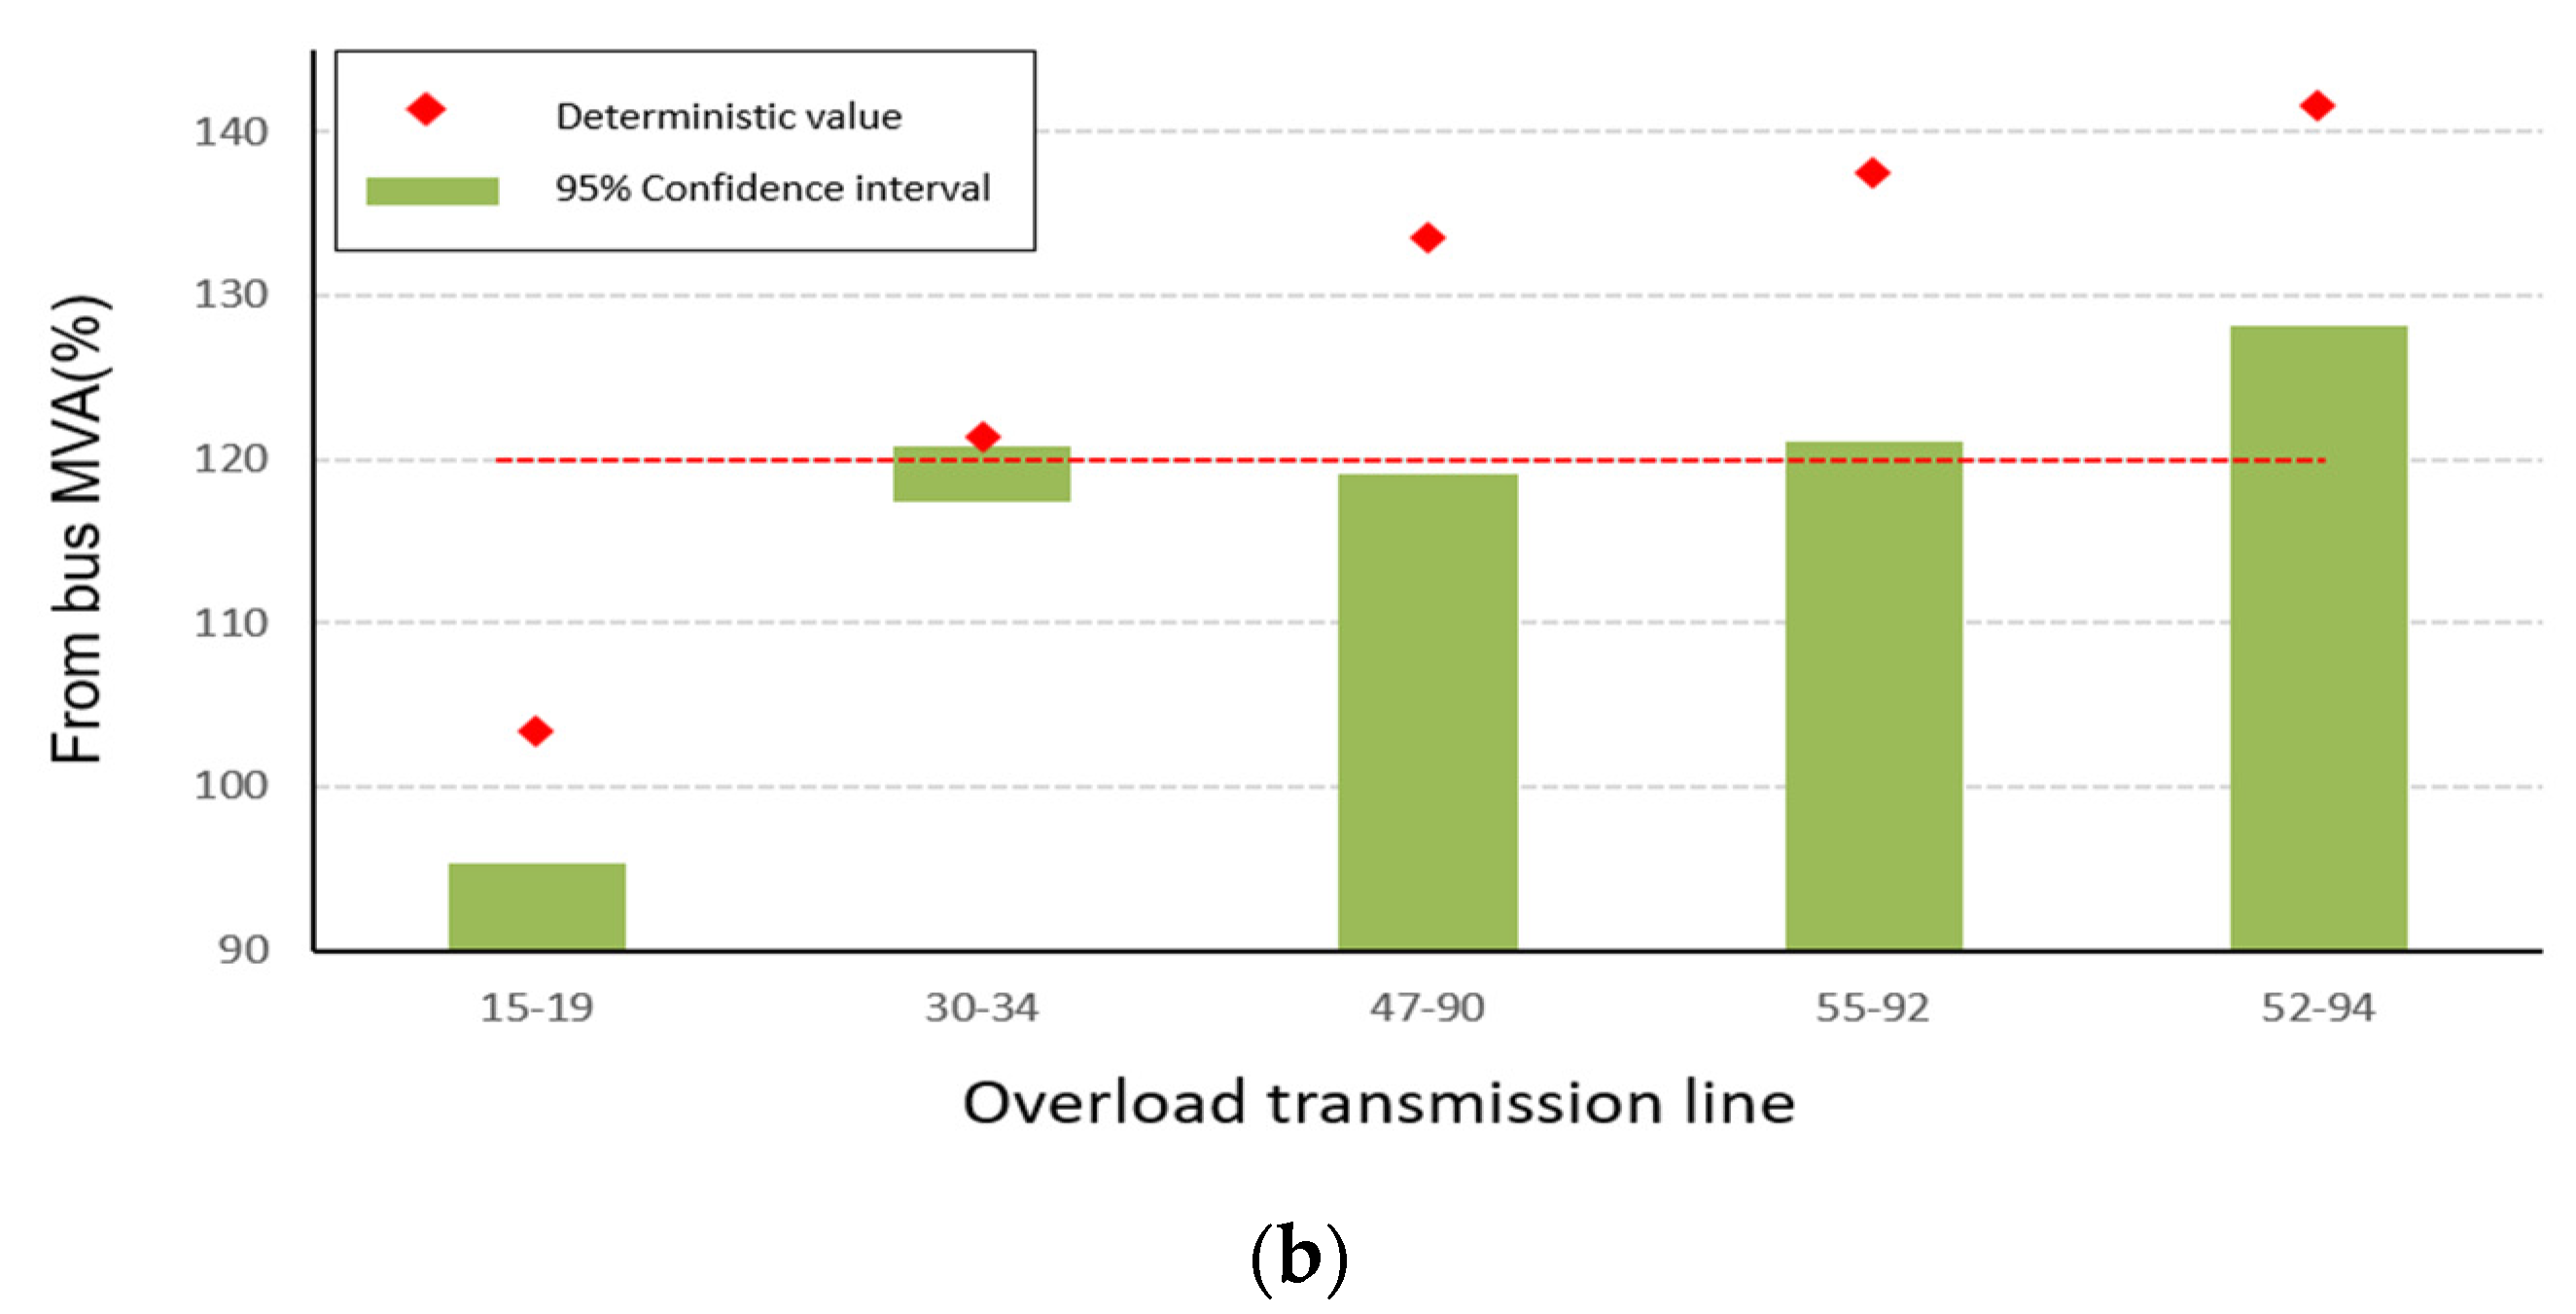
We calculated the 95% confidence intervals and probability of occurrence to represent a probabilistic range for all buses and lines through probabilistic methods. The 95% confidence interval indicates the range of data that can occur with a probability of 95% for each resulting value and can be calculated by determining the 2.5th and 97.5th percentiles [30,31]. The probability of occurrence can be calculated with the total number of scenarios and the occurrences of voltage violation or line overload. Figure 6 shows the 95% confidence intervals for the values of the buses with voltage violations and the transmission lines with an overload greater than 120% in addition to their deterministic values, for the comparison of the power system security analysis results based on the probabilistic and deterministic method.
According to the deterministic values indicated by the red points in Figure 6, the deterministic value excessively deviates from the confidence interval based on the probabilistic method. The transmission system expansion and reinforcement plan according to deterministic results can lead to over-investment. However, using the 95% confidence interval, the decision-maker can assess the range of the overload and voltage violation. In addition, the necessity to reinforce transmission lines 30–34, which have a 28.74% probability of overload occurrence, and bus number 50, which has a 56.38% probability of overvoltage occurrence, can be confirmed by evaluating the occurrence probability. As a result, various interpretations by decision-makers are possible with the application of the probabilistic method, results of which can also help to determine the expansion capacity and reinforcement priority more efficiently than those based on the deterministic method.

5. Conclusions

To achieve Korea’s energy policy goals, larger amounts of variable generation resources will be integrated into the power system, which may cause power system uncertainties in system operations and planning to increase, resulting in a reduction in the power system’s security. In response to the overall plan, it is essential to model the uncertainty of the variable generation resources such as the charging demand of EVs and wind power outputs based on the probabilistic method. In this paper, we proposed a new method to model the EV charging demands and wind power outputs through Monte Carlo simulations. The modeled variable generation resources were integrated into Jeju Island’s power system and the steady-state security of Jeju Island’s power system was analyzed by seasons. The analysis results based on stochastic indicators were compared with those based on the deterministic method.
As a result, it was found that the deterministic method has limitations that can lead to over-investment because it does not take into account uncertainties and cannot recognize situations that indicate the degradation of the security of the power system. In contrast, it was found that the probabilistic method is very useful in conducting a security assessment of a power system. This method can identify all the voltage violations and overloads that may occur with the use of probabilistic indicators, which can help decision-makers develop an efficient transmission grid reinforcement plan. Accordingly, the MCS-based steady-state security analysis method proposed in this paper is a risk mitigation strategy that can contribute to the efficient operation and planning to improve the security of power systems, taking into consideration the uncertainties of large-scale variable generation resources in the next stage. In future, we will analyze Jeju Island’s power system in 2030 by applying the proposed probabilistic method, based on data from the wind farms of 2.53 GW and the data on forecasting EV charging demand according to 100% supply of EVs in Jeju Island. We expect that the proposed method and case studies will play a key role in assessing the priorities of expansion and reinforcement for transmission systems considering the grid security.

Author Contributions

J.H. conceived and designed the overall research; S.K. implemented each modeling method and conducted the experimental simulation; J.H. and S.K. wrote the paper; and J.H. guided the research direction and supervised the entire research process. All authors have read and agreed to the published version of the manuscript.

Funding

This research received no external funding.

Acknowledgments

This work was supported by Korea Institute of Energy Technology Evaluation and Planning (KETEP) grant funded by the Korea government (MOTIE) (2019371010006B, Development of core stabilizing technology for renewable power management system).

Conflicts of Interest

The authors declare no conflict of interest.

References

  1. Ministry of Trade. Industry and Energy (MOTIE). The 8th Basic Plac for Long-Term Electricity Supply and Demand. Available online: www.motie.go.kr (accessed on 25 June 2020).
  2. Jeju Special Self-Governing Province. Carbon Free Island JEju by 2030; Korea Energy Economics Institute: Ulsan, Korea. Available online: www.jeju.go.kr (accessed on 25 June 2020).
  3. Onishi, V.C.; Antunes, C.H.; Trovão, J.P.F. Optimal Energy and Reserve Market Management in Renewable Microgrid-PEVs Parking Lot Systems: V2G, Demand Response and Sustainability Costs. Energies 2020, 13, 1884. [Google Scholar] [CrossRef] [Green Version]
  4. Lange, M.; Focken, U. State-of-the-Art in Wind Power Predictions in Germany and International Developments; Energymeteo: Oldenburg, Germany; Available online: http://80.228.47.133/media/fic_eeg_article.pdf (accessed on 25 June 2020).
  5. Haupt, S.E.; Casado, M.G.; Davidson, M.; Dobschinski, J.; Du, P.; Lange, M.; Miller, T.; Mohrlen, C.; Motley, A.; Pestana, R.; et al. The use of probabilistic forecasts: Applying them in theory and practice. IEEE Power Energy Mag. 2019, 17, 46–57. [Google Scholar] [CrossRef]
  6. Short, W.; Blair, N.; Sullivan, P.; Mai, T. ReEDS Model Documentation: Base Case Data and Model Description; National Renewable Energy Laboratory: Golden, CO, USA, 2009. [Google Scholar]
  7. Park, H.; Baldick, R. Transmission planning under uncertainties of wind and load: Sequential approximation approach. IEEE Trans. Power Syst. 2013, 28, 2395–2402. [Google Scholar] [CrossRef]
  8. Agreira, C.F.; de Jesus, S.F.; de Figueiredo, S.L.; Ferreira, C.M.; Pinto, J.D.; Barbosa, F.M. Probabilistic steady-state security assessment of an electric power system using a Monte Carlo approach. In Proceedings of the 41st International Universities Power Engineering Conference, Newcastle-upon-Tyne, UK, 6–8 September 2006; IEEE: Piscataway, NJ, USA, 2006. [Google Scholar]
  9. Kim, H.; Singh, C. Probabilistic security analysis using SOM and Monte Carlo simulation. In Proceedings of the 2020 IEEE Power Engineering Society Winter Meeting (Cat. No. 02CH37309), New York, NY, USA, 27–31 January 2002; IEEE: Piscataway, NJ, USA, 2002. [Google Scholar]
  10. Li, W.; Zhou, J.; Xie, K.; Xiong, X. Power system risk assessment using a hybrid method of fuzzy set and Monte Carlo simulation. IEEE Trans. Power Syst. 2008, 23, 336–343. [Google Scholar]
  11. Mokryani, G.; Siano, P. Evaluating the integration of wind power into distribution networks by using Monte Carlo simulation. Int. J. Electr. Power Energy Syst. 2013, 53, 244–255. [Google Scholar] [CrossRef]
  12. Xie, Z.Q.; Ji, T.Y.; Li, M.S.; Wu, Q.H. Quasi-Monte Carlo based probabilistic optimal power flow considering the correlation of wind speeds using copula function. IEEE Trans. Power Syst. 2017, 33, 2239–2247. [Google Scholar] [CrossRef]
  13. Vlachogiannis, J.G. Probabilistic constrained load flow considering integration of wind power generation and electric vehicles. IEEE Trans. Power Syst. 2009, 24, 1808–1817. [Google Scholar] [CrossRef]
  14. Osório, G.J.; Shafie-khah, M.; Coimbra, P.D.; Lotfi, M.; Catalão, J.P. Distribution system operation with electric vehicle charging schedules and renewable energy resources. Energies 2018, 11, 3117. [Google Scholar] [CrossRef] [Green Version]
  15. Zhao, M.; Chen, Z.; Blaabjerg, F. Probabilistic capacity of a grid connected wind farm based on optimization method. Renew. Energy 2006, 31, 2171–2187. [Google Scholar] [CrossRef]
  16. Sun, G.; Jiang, C.; Cheng, P.; Liu, Y.; Wang, X.; Fu, Y.; He, Y. Short-term wind power forecasts by a synthetical similar time series data mining method. Renew. Energy 2018, 115, 575–584. [Google Scholar] [CrossRef]
  17. Buckley, I.; Saunders, D.; Seco, L. Portfolio optimization when asset returns have the Gaussian mixture distribution. Eur. J. Oper. Res. 2008, 185, 1434–1461. [Google Scholar] [CrossRef]
  18. Xiang, W.; Karfoul, A.; Yang, C.; Shu, H.; Jeannès, R.L.B. An exact line search scheme to accelerate the EM algorithm: Application to Gaussian mixture models identification. J. Comput. Sci. 2020, 41, 101073. [Google Scholar] [CrossRef]
  19. Vlassis, N.; Likas, A. A greedy EM algorithm for Gaussian mixture learning. Neural Process. Lett. 2020, 15, 77–87. [Google Scholar] [CrossRef]
  20. Ge, F.; Ju, Y.; Qi, Z.; Lin, Y. Parameter estimation of a Gaussian mixture model for wind power forecast error by Riemann L-BFGS optimization. IEEE Access 2018, 6, 38892–38899. [Google Scholar] [CrossRef]
  21. Su, H.; Wang, D.; Duan, X. Condition Maintenance Decision of Wind Turbine Gearbox Based on Stochastic Differential Equation. Energies 2020, 13, 4480. [Google Scholar] [CrossRef]
  22. Yip, C.M.A.; Gunturu, U.B.; Stenchikov, G.L. Wind resource characterization in the Arabian Peninsula. Appl. Energy 2016, 164, 826–836. [Google Scholar] [CrossRef] [Green Version]
  23. Irwanto, M.; Gomesh, N.; Mamat, M.R.; Yusoff, Y.M. Assessment of wind power generation potential in Perlis, Malaysia. Renew. Sustain. Energy Rev. 2014, 38, 296–308. [Google Scholar] [CrossRef]
  24. Nusair, K.; Alasali, F. Optimal Power Flow Management System for a Power Network with Stochastic Renewable Energy Resources using Golden Ratio Optimization Method. Energies 2020, 13, 3671. [Google Scholar] [CrossRef]
  25. Chang, T.P. Performance comparison of six numerical methods in estimating Weibull parameters for wind energy application. Appl. Energy 2011, 88, 272–282. [Google Scholar] [CrossRef]
  26. Hajian, M.; Rosehart, W.D.; Zareipour, H. Probabilistic power flow by Monte Carlo simulation with Latin supercube sampling. IEEE Trans. Power Syst. 2012, 28, 1550–1559. [Google Scholar] [CrossRef]
  27. SIDS, The Path to Carbon-Free Island. Available online: www.sustainablesids.org (accessed on 23 September 2020).
  28. KPX, Power System Operation Performance of Jeju Island on 2019. Available online: www.kpx.or.kr (accessed on 25 June 2020).
  29. KPX, Real-Time Power Supply and Demand. Available online: http://www.kpx.or.kr (accessed on 25 June 2020).
  30. McMurray, A.; Pearson, T.; Casarim, F. Guidance on Applying the Monte Carlo Approach to Uncertainty Analyses in Forestry and Greenhouse Gas Accounting; Winrock International: Arlington, VA, USA, 2017. [Google Scholar]
  31. Wang, Y.; Infield, D. Markov Chain Monte Carlo simulation of electric vehicle use for network integration studies. Int. J. Electr. Power Energy Syst. 2018, 99, 85–94. [Google Scholar] [CrossRef]
Figure 1. Process of the power-system security assessment based on probabilistic analysis.
Energies 13 05260 g001
Figure 2. The EV charging demand in Jeju Island: (a) 24-h charging power pattern; and (b) the histogram of the charging power used in one year.
Energies 13 05260 g002
Figure 3. Seasonal Gaussian mixture distributions of the EV charging demand.
Energies 13 05260 g003
Figure 4. Seasonal Weibull distributions of wind power output.
Energies 13 05260 g004
Figure 5. Probabilistic steady-state security analysis algorithm based on Monte Carlo simulation.
Energies 13 05260 g005
Figure 6. Comparison of the post N-1 contingency results based on the probabilistic and deterministic methods: (a) voltage of the buses where a voltage violation occurred; and (b) the overload rate of transmission lines where the overload occurred.
Energies 13 05260 g006aEnergies 13 05260 g006b
Table 1. Electric vehicle (EV) charging demand data from classified substations in Jeju Island.
Substation Number1234567
Number of Charging stations6665611277325
Max (MW)0.19700.77580.68630.15330.44330.70540.2739
Substation Number891011121314
Number of Charging Stations45233021212918
Max (MW)0.64180.26650.29650.26330.33480.34120.2366
Table 2. Seasonal Gaussian mixture distribution parameters of EVs charging demand.
Comp 1Comp 2
µ1σ1p1µ2σ2p2
Spring0.09260.01560.64950.03670.01560.3504
Summer0.10910.02380.65780.04580.02380.3421
Fall0.17830.03010.60140.07320.03010.3985
Winter0.03730.01790.34540.10060.01790.6545
Table 3. Data from wind farms in Jeju Island.
ABCDEF
Installed Capacity (MW)333030302118
Max (MW)32.9409428.48829.3743020.1821117.072
Table 4. Seasonal Weibull distribution parameters of wind power output.
ParameterSpringSummerFallWinter
Shape (k)0.84350.72000.92701.1336
Scale (c)7.02013.75737.641210.0279
Table 5. The Gaussian mixture distribution parameters of EV charging demand in Jeju Island.
SpringSummerFallWinter
1comp1mu10.09260.10920.17840.0373
sigma10.01570.02380.03010.0179
p10.64960.65790.60150.3455
comp2mu20.03680.04580.07330.1007
sigma20.01570.02380.03010.0179
p20.35040.34210.39850.6545
2comp1mu10.14300.04360.44200.1507
sigma10.05250.03690.08810.0697
p10.37410.55960.58990.4032
comp2mu20.35150.13820.15210.3841
sigma20.05250.03690.08810.0697
p20.62590.44040.41010.5968
14comp1mu10.34540.08890.42030.0870
sigma10.06270.07920.08620.0588
p10.60370.53610.58590.4253
comp2mu20.10600.30280.12580.3241
sigma20.06270.07920.08620.0588
p20.39630.46390.41410.5747
Table 6. The Weibull distribution parameters of wind power output in Jeju Island.
ABCDEF
Springshape(k)0.84350.88490.82010.71830.80670.8908
scale(c)7.02027.59466.32355.18553.29685.4306
Summershape(k)0.72000.80180.72040.63940.69160.7394
scale(c)3.75744.92493.56273.03492.27962.8585
Fallshape(k)0.92700.83680.89860.68390.84860.9630
scale(c)7.64125.89518.10234.17413.61695.6558
Wintershape(k)1.13361.12061.23450.94081.21671.3760
scale(c)10.027911.761512.16479.53936.46949.6211
Table 7. Each season’s peak load in Jeju Island [29].
SpringSummerFallWinter
Peak Load (MW)810910770880
Table 8. Power flow data for post N-1 contingency; bus voltage (p.u.).
Bus Number95% Confidence IntervalProbability of Occurrence (%)
11.0386~1.04910
21.0386~1.04860
31.0339~1.04390
41.0278~1.03770
51.0177~1.02760
61.0342~1.04410
1010.9694~0.99950
1021.0201~1.05049.66
1031.9693~1.00000
Table 9. Power flow data for post N-1 contingency; transmission line load (%).
From BusTo Bus95% Confidence IntervalProbability of Occurrence (%)
1441.8368~41.79270
12415.4355~33.92350
1255.5342~89.55520
1256.1733~90.58170
122.3267~21.13430
24941.1461~41.27500
51821.6605~122.340935.3814
52941.7479~128.155137.1902
55920.9897~121.029227.0477