Abstract
Microalgae and cyanobacteria are unicellular microorganism that contain high-added-value compounds. To make their extraction economically feasible, the biorefinery concept is the only solution. In this study, the residues resulting from lipid or protein extraction from Arthrospira platensis biomass were valorized by catalytic pyrolysis using ZSM5 zeolite or amorphous silica–alumina as catalyst. The reaction was performed in a quartz reactor, and the catalysts were placed in a fixed bed, to force the reaction gases to pass through it. The reaction products were analyzed by FTIR and GC–MS analyses. The reaction gases and liquids obtained from the extraction residues had higher hydrocarbon contents compared with the untreated biomass. Moreover, the pyrolysis of biomass after protein extraction led to fractions with lower nitrogenated component contents, while that after lipid extraction to fractions with lower oxygenated component contents. This study showed that the pyrolysis process could be used to valorize the microalgae extraction residues, aiming to make biofuels production and extraction of high-added-value products more economically feasible.
1. Introduction
The growing industrialization, the high level of pollution, and the reduction of resources have led to an urgent need to find an alternative way to handle entire production chains from raw materials to finished products. The zero-waste strategy and the circular economy are the best solutions to remediate the dramatic conditions in which our planet is located. In this context, the biorefinery concept, according to which biomass is converted into high-added-value products, reaction intermediates, and biofuels, is a sustainable alternative to that of a conventional refinery. To make the biorefinery a real alternative, increase the feasibility of the process, and reduce its cost, biomass selected as raw material needs to be easily available and cheap, contain components important for the market, and have high growth rates [1].
Microalgae and cyanobacteria have in recent years become attractive because of their multiple applications in different fields. They are generally used in human or animal nutrition, biofuel production, and extraction of high-added-value components for chemical, cosmetic, and pharmaceutical industries [2]. Due to their multiple applications, they are a promising raw material for biorefinery [3]. Such unicellular microorganisms composed mainly of lipids, proteins, and carbohydrates, whose relative proportions depend mainly on the species and growth conditions, have higher growth rates compared to higher plants and can be cultivated in marginal lands, seas, and fresh water. Their capability to grow under drastic conditions and in land not used for agriculture is also an answer to the food vs. fuel conflict [4].
In recent years, lipid, protein, and pigment extraction from microalgae have been widely studied for various applications such as the productions of biodiesel from the lipid fraction and of nutraceuticals and dyes from vitamins, proteins, and pigments [5,6]. As such, it is important to stress that the microalgae biorefinery concept is the only way to make microalgae competitive with products obtained from conventional sources, and that the use of microalgae to produce only biofuels or only nutraceuticals has not yet reached clear-cut economic feasibility. The biggest challenges are the relatively high cost of biomass production and the energy demand for the extraction and separation processes. Therefore, in order to make microalgae products economically viable and increase their marketability, it is necessary to reduce costs, for example by valorizing process residues as co-products [7]. It is generally accepted that the sale of co-products will make the production of biofuels from microalgae economically feasible [8,9]. Indeed, Bryant et al. [10] estimated that the residue of microalgal biomass after lipid extraction could be worth between 100 and 225 USD per ton and could yield co-products ranging in value from 0.95 to 2.43 USD per gallon of biodiesel produced. Moreover, the microalgae protein fraction has an economic value that ranges from 0.86 USD/kg as feed to 5.57 USD/kg as food [11].
Pyrolysis is a thermochemical process that can efficiently recover most of the energy available in biomass, in which chemicals, in the absence of oxygen, are converted into bio-oil, biogas, and bio-char [12]. The pyrolysis process is characterized by complex mechanisms in which decarboxylation, dehydration, cracking, dehydrogenation, and rearrangement reactions take place. Pyrolysis bio-oil is generally composed of a wide range of different compounds including hydrocarbons, acids, alcohols, polyaromatics, nitrogenated compounds, indole, and carbonyls, with molecular weight from 18 to 5000 g/mol [13,14]. The presence of oxygenated and nitrogenated compounds in the bio-oil leads to a few undesirable properties, such as low heating value and high viscosity, which do not allow miscibility with fossil fuels [15]. To improve microalgae pyrolysis performance and upgrade the quality of reaction products, it is necessary to add catalysts during thermal treatment, or to follow a second biooil refining catalytic treatment [16]. The catalytic pyrolysis process can be used to reduce the content of N- and O-components and increase that of aromatic hydrocarbons [17].
Several studies were conducted on different species of microalgae, using acid catalysts, in particular protonic molecular sieves [18,19,20]. Protonic molecular sieves are strongly acidic heterogenous catalysts used for the interconversion of hydrocarbons in different processes such as isomerization, alkylation, thermal cracking, and aromatization [21]. Different acid solid zeolite catalysts such as ZSM5, zeolite Y, mordenite, and beta have been used to achieve microalgae pyrolysis, among which ZSM5 zeolite has been mainly investigated for its ability to reduce oxygenate compounds and increase the aromatic fraction [13]. Since the strong acidity of zeolite generally leads to deep deoxygenation and severe coke formation, mesoporous materials with milder acidity, such as silica–alumina [22], have been tested to solve this problem [23].
The aim of this work was to valorize the lipid and protein extraction residues from Arthrospira platensis by catalytic pyrolysis using H-ZSM-5 zeolite and silica–alumina as catalysts. The different distribution and composition of pyrolysis products were investigated as functions of the different behaviors of these catalysts.
2. Materials and Methods
2.1. Materials
Dried Arthrospira platensis was purchased from a commercial supplier (Genoa, Italy). The influence of two different catalysts on the pyrolysis products was investigated, namely silica–alumina (SA) and H-ZSM-5 zeolite (ZSM5). SA, with 13% alumina and a specific surface area of 220 m2/g, was obtained from Strem Chemicals (Newburyport, MA, USA), while ZSM5, with 23 Al2O3/SiO4 ratio and a specific surface area of 425 m2/g, was purchased from Zeolyst (Conshohocken, PA, USA) and calcined at 500 °C for 1 h before use.
2.2. Biomass Characterization
Arthrospira platensis without preliminary treatment (AP) after lipid extraction (LE) or after protein extraction (PE) was characterized in terms of calorific value, moisture and ash content, CHNS-O elemental composition, and morphology. Moisture and ash contents of the three different biomasses were determined according to AOAC methods [24]. The morphology of AP, LE, and PE was investigated using a scanning electron microscopy (SEM Hitachi 2500, Tokyo, Japan), while the calorific value was determined by a bomb calorimeter (IKA C200, Staufen, Germany). The elemental composition of samples in terms of C, H, N, and S contents was determined by a CHNS-O elemental analyzer (FLASH EA1112, ThermoQuest, Cleveland, OH, USA), while that of oxygen was calculated considering both moisture and ash contents. Thermogravimetric analyses (TGA) were performed on AP, LE, and PE by a thermal analyzer, model STA 409 (Netzsch Gerätebau, Selb, Germany), with a weight sensitivity of 0.01 mg. For this purpose, a mass of sample ranging between 100 and 130 mg was placed in a 0.1 cm3 alumina crucible and introduced into the thermobalance. Samples were flushed with nitrogen at a flow rate of 40 mL min−1, and temperature was raised from room temperature to 650 °C at a rate of 10 °C min−1. Results of characterization of the three biomasses, already shown in previous work [25], are summarized in Table 1 to make for easier reader understanding.

Table 1.
Quantification of components of Arthrospira platensis biomass before extractions (AP), after extraction of lipids (LE), and after extraction of proteins (PE) [25].
2.3. Lipid and Protein Extraction
The lipid fraction from A. platensis was extracted following a modified version of the Folch method [26], in which a 2:1 (v/v) chloroform/methanol solution was used as solvent. The protein fraction of A. platensis was extracted by conventional solid–liquid extraction using water as solvent. The 1:20 (w/v) A. platensis water suspension was kept for 16 h under continuous agitation [27]. After the extraction, proteins were quantified using the bicinchoninic acid assay (Novagen, EMD Chemicals Inc., San Diego, CA, USA) at 562 nm using a biophotometer, model D30 (Eppendorf, Hamburg, Germany).
2.4. Catalytic Pyrolysis Setup
The reaction system (Figure 1) consisted of a quartz tubular reactor placed in an oven (Carbolite, MTF 10/25/130, Pocklington, UK). Temperature was increased up to 450 °C and kept at this value for 1 h. It was controlled by a thermocouple attached to the heating zone, while the temperature of the reaction products was measured by a thermometer, as shown in Figure 1. About 10 g of each sample (AP, LE, and PE) was charged into the reactor, and then the system was purged with nitrogen to guarantee complete oxygen removal. The catalyst was placed as a fixed bed and immobilized between two quartz wool supports, allowing reaction vapors to pass through the porous structure. The reaction system was provided with an integrated condenser for the separation of reaction vapors. Incondensable gases (G) were collected in a latex balloon, while the liquid, made up of two different immiscible fractions, i.e., light reaction liquid (LL) and heavy reaction liquid (HL), was collected in a flask. After pyrolysis, the solid residue present in the reactor was collected and washed with acetone to separate the liquid residue (LR) from the solid residue (SR).
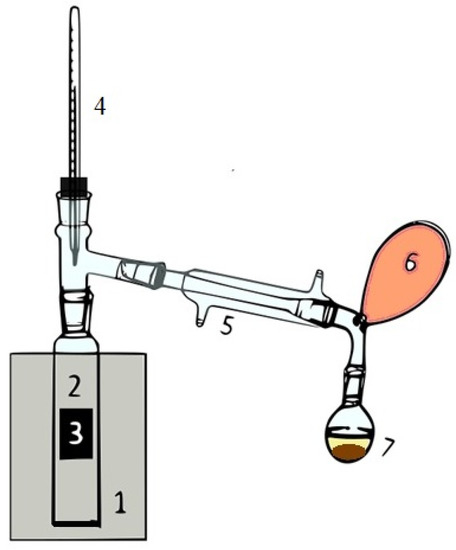
Figure 1.
Schematic catalytic pyrolysis setup. 1—oven, 2—quartz tubular reactor, 3—catalyst, 4—thermometer, 5—condenser, 6—latex balloon, 7—flask.
2.5. Reaction Products Characterization
The initial biomasses (AP, LE, and PE) and the reaction products (G, LL, HL, LR, and SR) were characterized by Fourier transform infrared spectroscopy (FTIR) using a Nicolet 380 FTIR spectrometer (Thermo Scientific, Madison, WA, USA). All the spectra were elaborated using Omnic Lite Software (Thermo Electron Corporation, Madison, WA, USA). The reaction gases were forced to pass through an IR glass cell with KBr windows and analyzed by the same spectrometer. Liquid samples were prepared depositing a small amount of liquid on a KBr pressed disk, while the solid fractions were prepared by mixing KBr with samples (1:50, w/w) and pressing; the above instrument was used for analyses. Reaction gases (Gs) were also analyzed using a gas chromatograph, model 4890 (Agilent Technologies, Santa Clara, CA, USA), with a Flame Ionization Detector (FID) detector. For this purpose, 400 µL of G sample were injected with a 500-µL gas chromatography syringe using a split ratio of 1:10. The instrument was equipped with a Varian capillary column, model Molsieve 5A/Porabond Q Tandem (Agilent). Helium (purity > 99.9%) was used as a carrier gas at a flow rate of 1.6 mL min−1. The column temperature was set at 70 °C, increased to 136 °C at 10 °C min−1, held for 10 min, and then further increased up to 230 °C at the same rate. For LRs analysis, samples were diluted with CHCl3 up to a ratio of 1:10 (v/v) and injected in a gas chromatography–mass spectrometer (GC–MS), model Focus-ISQ (Thermo Scientific, Milan, Italy). For quantification, the results were expressed as percentages of the areas of peaks detected for the individual compounds with respect to the total peak area. SR calorific value and elemental composition were analyzed by the above-mentioned bomb calorimeter and CHNS-O elemental analyzer [25].
3. Results and Discussion
3.1. Yields of Catalytic Pyrolysis Products
The catalytic pyrolysis of Arthrospira platensis biomass without any pretreatment (AP) or after lipid (LE) or protein (PE) extractions was performed at 450 °C for 1 h. The reaction products were classified as reaction gas (G), light reaction liquid (LL), heavy reaction liquid (HL), liquid residue (LR), and solid residue (SR). G was mainly composed of incondensable gases (light gases and short chain hydrocarbons); LR of long chain hydrocarbons (C > 6), oxygenates (mainly alcohols and carboxylic acids), and nitrogenates (mainly amines and amides); HL mainly of water soluble components; and SR of carbon substances. A previous study carried out on the same residues without any catalyst showed that thermal pyrolysis led to a generalized decrease in the content of nitrogenated compounds and an increase in that of hydrocarbons [25].
Figure 2 illustrates the distribution of products resulting from the catalytic pyrolysis of the three biomasses using either H-ZSM-5 zeolite (ZSM5) or silica–alumina (SA) as catalyst. The results of AP catalytic pyrolysis in terms of percentage distribution of products were quite similar using either catalyst, being G 29.1–29.5%, LL 13.2–16.4%, HL 14.9–15.8%, LR 3.7–6.7%, and SR 34.0–34.7%, while significant differences were observed between the two biomasses pretreated differently. For instance, the G percentage from LE was 26 and 33% using SA and ZSM5, respectively. An opposite distribution was observed for PE, with an almost twice as high G percentage using SA (39%) rather than ZSM5 (20%). Moreover, the LL percentages from LE were 14 and 9% using SA and ZSM5, respectively, while from PE they completely reversed (7 and 25%, respectively). On the other hand, no significant variation in HL and LR percentages were detected. Finally, SR from PE was slightly higher using ZSM5 (34%) rather than SA (31%) as a catalyst.
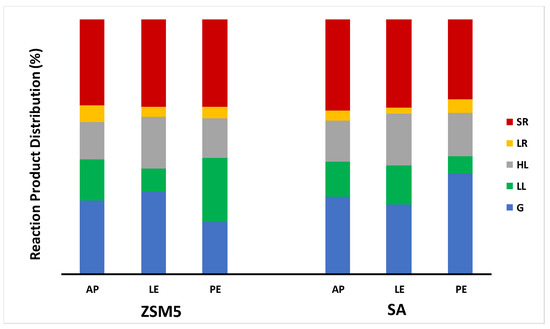
Figure 2.
Percentage distribution (%) of products from catalytic pyrolysis of Arthrospira platensis biomass without any pretreatment (AP), after lipid extraction (LE), and after protein extraction (PE). G, reaction gas; LL, light reaction liquid; HL, heavy reaction liquid; LR, liquid residue; SR, solid residue.
Although it is very difficult to relate these results to the type and structure of the acidic sites of the two catalysts, some interesting insights on the most significant percentage variations within each class of compounds may come from data available in the literature for similar catalysts. Suzuki et al. [28] reported, for a similar ZSM-5 zeolite (Tosoh Co.) with an Si/Al ratio of 24 and silica–alumina containing 12.5 wt% Al2O3, Brønsted acid site numbers of 0.70 and 0.47 mol/kg, Lewis acid site numbers of 0 and 0.17 mol/kg, and Brønsted acid strengths (ΔH) of 137 and 120–155 kJ/mol, respectively. Comparing these data with the results of Figure 2, it can be inferred that the higher percentages of G from LE and LL from PE obtained using ZSM-5 were due solely to its Brønsted acidity, while the higher percentages of LL from LE and G from PE with silica–alumina to the significant presence in this catalyst also of Lewis acid sites, which highlights different catalytic mechanisms depending on both the class of compounds and the type of catalyst. On the other hand, the percentage differences found for the other classes were too low to allow for similar considerations.
To go deeper into the influence of the type of catalyst on the different biomasses, all the reaction products were analyzed by FTIR spectrometry, and the G and LL fractions were also submitted to GC–MS.
3.2. Reaction Gas Characterization
One can see in Figure 3 that the FTIR spectra of gases obtained from AP, LE, and PE pyrolysis using either catalyst were qualitatively similar, all exhibiting the characteristic asymmetric stretching bands of carbon dioxide at 2317 and 3728 cm−1, the rotovibrational band due to CO2 deformation at 771 cm−1, the rotovibrational band of carbon monoxide stretching (minimum at 2140 cm−1), and the asymmetric C–H stretching at 2965 cm−1 due to the presence of hydrocarbons.
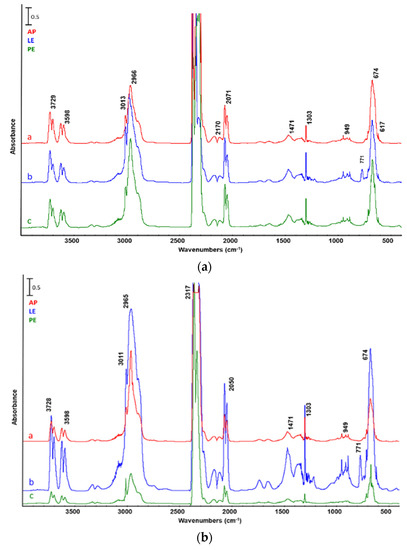
Figure 3.
FTIR analysis of reaction gases from the catalytic pyrolysis of a—A. platensis untreated biomass (AP), b—biomass after lipid extraction (LE), and biomass after c—protein extraction (PE). Catalyst: (a) ZSM5, (b) silica–alumina.
The bands at 3011 and 1303 cm−1 can be assigned to methane stretching deformation, while the ones at 949 cm−1 and 912 cm−1 to that of ethylene and propylene, respectively. The band at 1470 cm−1 is representative of methylene deformation vibration and that at 2069 cm−1 of a thiocyanate group. As expected, the FTIR spectrum obtained from biomass after lipid extraction also presented the typical C–Cl band at 771 cm−1 due to residual chloroform used as solvent.
The reaction gases were also analyzed by GC–MS, the results of which in terms of the main classes of identified compounds are shown in Figure 4, while Table 2 lists the main individual components classified according to their retention time. Consistent with the information resulting from the FTIR spectra, the major gaseous components obtained from the catalytic pyrolysis of the different biomasses with both catalysts were the light gases, which were mainly composed of CO2, CO, CH4, C2H4, and C2H6. The much higher content of light gases in G from AP (98%) using ZSM5 as a catalyst compared to LE (57 and 30% with ZSM5 and SA, respectively) was probably due to the production of CO2 and H2 mainly by dehydrocyclization and decarboxylation of amino acids, while that of CH4 and the other hydrocarbons to end-chain fission reactions of long-chain lipids [29].
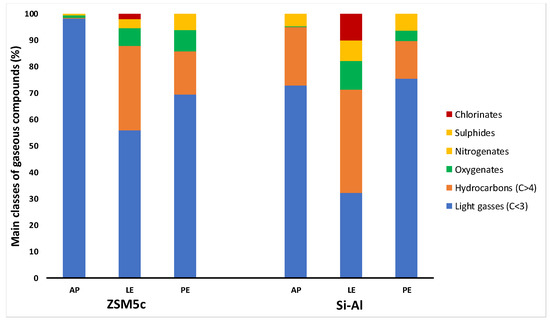
Figure 4.
Percentage distribution (%) of the main classes of gaseous compounds from catalytic pyrolysis carried out using ZSM5 or SA as catalysts. Analytical determinations were made by GC–MS on gases from untreated Arthrospira platensis biomass (AP), biomass after lipid extraction (LE), biomass after protein extraction (PE).
Table 2.
Percentage composition (%) of gases from catalytic pyrolysis using ZSM5 or silica–alumina as catalyst in terms of individual compounds. Analytical determinations were made by GC–MS on gases from untreated Arthrospira platensis biomass (AP), biomass after lipid extraction (LE), biomass after protein extraction (PE).
The highest content of hydrocarbons in Gs was obtained using LE as initial biomass with either catalyst, i.e., 32 and 39% with ZSM5 and SA, respectively. These hydrocarbon fractions were mainly composed of branched unsaturated hydrocarbons from 9 to 21% using PE and LE biomasses with SA as catalyst, respectively. In particular, the main component of these fractions was 2-methyl-1-propene, as shown in Table 2. On the other hand, the fractions of saturated hydrocarbons were mainly constituted of propane (8 and 6%, with ZSM5 and SA, respectively) using LE as initial biomass, with both catalysts. The use of LE compared to raw A. platensis led to an increase not only in the production yield of Gs fraction but also in the selectivity in hydrocarbons.
Moreover, the use of LE as biomass and SA as a catalyst allowed for a greater oxygenated fraction in the incondensable gases (11%) compared with AP (0.3%) and PE (3.8%), while PE was the most effective (8%) using ZSM5 (0.7 and 6.5% from AP and LE, respectively). The main oxygenated component found in all the fractions was 2(3H)-furanone,dihydro-3,5-dimethyl, with a maximum percentage of 8.9% from LE using SA.
The presence of sulfur compounds in the reaction gases can be ascribed to the decomposition of the amino acid methionine [30], while the chlorinate components observed in Gs from LE were due to the residual solvent used for the lipid extraction.
3.3. Characterization of Reaction Liquids
The reaction liquid obtained from catalytic pyrolysis of the three biomasses was composed of an oily top phase called light reaction liquid (LL) and an aqueous bottom phase called heavy reaction liquid (HL), which separated spontaneously.
LLs obtained from the catalytic pyrolysis of AP, LE, and PE in the presence of both catalysts were characterized by FTIR and GC–MS, while HLs only by FTIR. The composition of liquid fraction does in fact influence its quality and application. In particular, heavy components, namely aldehydes and ketones, can start aging reactions that greatly affect the bio-oil quality [31], while polycyclic aromatic compounds are hazardous for the environment and carcinogenic [32]. Moreover, in general, oxygenated compounds reduce the heating value and increase the viscosity of bio-oil, and the high acid content makes it corrosive [33]. Therefore, to use the bio-oil for energetic purposes, all the above components are considered undesirable. The highly desirable components to improve the bio-oil quality are aromatic and aliphatic hydrocarbons and alcohols.
The FTIR spectra of LLs obtained using either ZSM5 or SA are shown in Figure 5. In all the spectra, we can identify the characteristic bands of –OH stretching at 3100 cm−1; the C–H stretching and valence and asymmetric banding at 2925, 2858, and 1459 cm−1, respectively; and the band relative to the deformation of methyl groups at 1379 cm−1. Moreover, the C=C stretching at 1610 and 812 cm−1, the rocking at 752 cm−1, and the deformation of the methyl at 1379 cm−1 can also be recognized. Finally, the bands at 1269 and 1648 cm−1 can be assigned to the presence of =C–O–R groups and nitrogenates, respectively, while that at 700–600 cm−1 to S–O stretching.
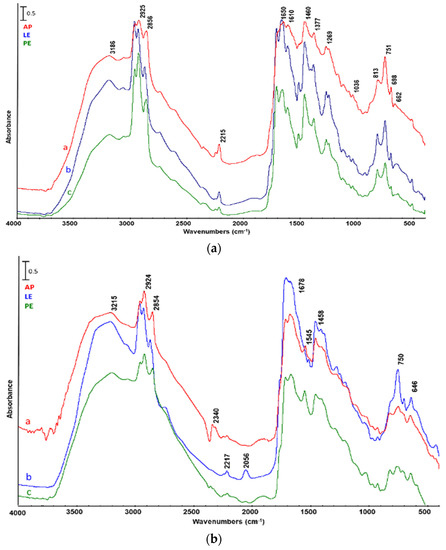
Figure 5.
FTIR analysis of light reaction liquid from catalytic pyrolysis of a—Arthrospira platensis untreated biomass (AP), b—biomass after lipid extraction (LE), and c—biomass after protein extraction (PE). Catalyst: (a) ZSM5, (b) silica–alumina.
Table 3 lists the main components of LLs (area > 3%) quantified by GC–MS, which were grouped in Figure 6 as hydrocarbons, oxygenates, nitrogenates, complex oxygenates/nitrogenates, and other components based on their number of carbons. The hydrocarbon fraction in this study includes both aromatic and aliphatic hydrocarbons, the former fraction increasing and improving the octane number, while the latter being important for its use as a transportation fuel. Hydrocarbons were mainly produced by decarboxylation, deamination, and fragmentation of lipids or by thermal degradation of proteins [34]. The aliphatic ones included long chain alkanes and alkenes, among which 1,6-heptadien-3-yne and eicosane were found in the highest percentages. In general, the catalytic pyrolysis with SA as a catalyst produced more hydrocarbons compared with ZSM5 from all biomasses. In particular, the catalytic pyrolysis of LE with SA produced LLs made up of 21% of 1,6-heptadien-3-yne. Contrary to what was observed for the Gs fraction, PE rather than LE led to an increase in the hydrocarbon yield and selectivity.
Table 3.
Percentage composition (%) of light reaction liquids (LLs) from catalytic pyrolysis using ZSM5 or silica–alumina as catalyst in terms of individual compounds. Analytical determinations were made by GC–MS on LLs from untreated Arthrospira platensis biomass (AP), biomass after lipid extraction (LE), biomass after protein extraction (PE).
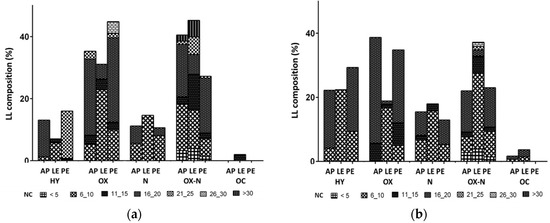
Figure 6.
Composition of light reaction liquids (LL), determined by GC–MS, resulting from catalytic pyrolysis of Arthrospira platensis biomass without any treatment (AP), after lipid extraction (LE), and after protein extraction (PE). HY, hydrocarbons; OX, oxygenates; N, nitrogenates; OX–N, complex oxygenates/nitrogenates; OC, other compounds; NC, number of carbons. Catalyst: (a) ZSM5, (b) silica–alumina.
The oxygenates fraction in LLs consisted of aldehydes, ketones, alcohols, phenols, esters, and ethers, with that obtained from LE pyrolysis being lower compared to the other biomasses with both catalysts. This fraction was reduced from 38 to 19% with SA for AP and LE, respectively, and from 44 to 31% for PE and LE with ZSM5, respectively. The oxygenated components found in the highest percentage were phenol and its derivates. LE catalytic pyrolysis produced 11% of phenol using ZSM5, while a percentage of 7.4% of 3-methyl-phenol was found with SA as catalyst. Even if the oxygenate compounds reduced the quality of bio-oil, phenols and their derivates are considered high-added-value chemicals, and their contents can help the process to become more economically feasible [35].
The nitrogenates compounds present in LL were principally amine, indole, and pyrrole, the presence of which in bio-oil lead to pollution due to nitrogen oxide formation during combustion. These compounds found in the liquid fraction were mainly produced by protein decarboxylation and CO2 elimination or water elimination with the formation of dipeptides, while the presence of N-heterocycles was due to the Maillard reaction that occurred from the interaction between amino acid with sugars or other carbonyl compounds [30]. Biomass after protein extraction did in fact lead to the lowest percentage of nitrogenate compounds (6%) with both catalysts, while that after lipid extraction to the highest one (9 and 22% with SA and ZSM5, respectively). Among them, indole and indolizine were produced in the highest percentages (Table 3), the likely result of thermal degradation of the amino acid tryptophan [30]. Wang et al. [36], who investigated the mechanisms of Nannochloropsis sp. pyrolysis and its main components, proposed that the formation of N-heterocyclic compounds may have been the result of the interaction of proteins and sugars.
The complex oxygenates/nitrogenates mainly consisted of amides or fatty acid amides produced by the interaction between lipids and protein derivates. Among them, hexadecanamide was produced in the highest percentage, especially by the catalytic pyrolysis of AP with both ZSM5 (9%) and SA (16%) and of PE with SA (14%).
The heavy reaction liquid (HL) was principally made up of water and water-soluble components. Figure 7 shows the spectra of this fraction obtained by catalytic pyrolysis of AP, LE and PE with either catalyst. The spectra presented a clear characteristic band of –OH stretching from 3400 to 3100 cm−1, while the other bands from 200 to 500 cm−1 were the same as previously discussed for LLs.
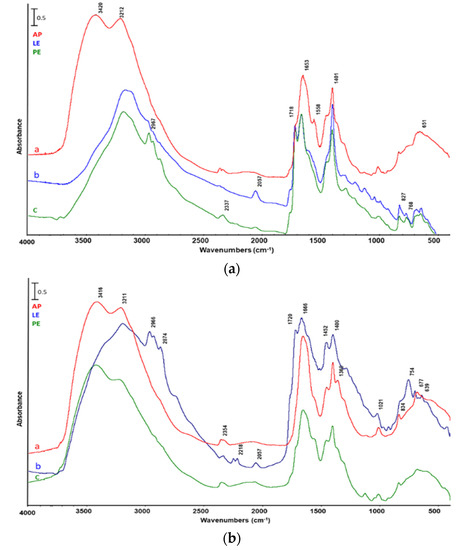
Figure 7.
FTIR analysis of heavy reaction liquid from catalytic pyrolysis of a—Arthrospira platensis untreated biomass (AP), b—biomass after lipid extraction (LE), and c—biomass after protein extraction (PE). Catalyst: (a) ZSM5, (b) silica–alumina.
3.4. Reaction Residues
The pyrolysis residue consisted of the solid remaining in the reactor after the reaction, which was collected and washed with acetone to separate the liquid residue (LR), mainly made up of high molecular weight components, from the solid one (SR). Figure 8 shows the spectra of LR obtained by catalytic pyrolysis of AP, LE, and PE with either catalyst. The presented bands, as expected, were coincident with those present in LL spectra, which confirm that this fraction is made by the same component classes (hydrocarbon, oxygenated, nitrogenated, and oxygenated/nitrogenated complex compounds) but with higher boiling point.
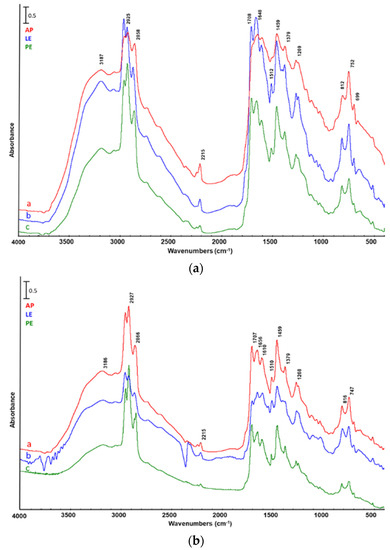
Figure 8.
FTIR analysis of liquid residue from catalytic pyrolysis of a—Arthrospira platensis untreated biomass (AP), b—biomass after lipid extraction (LE), and c—biomass after protein extraction (PE). Catalyst: (a) ZSM5, (b) silica–alumina.
Finally, the solid residue (SR) obtained from catalytic pyrolysis of AP, LE, and PE was analyzed by FTIR as well (Figure 9). One can notice the characteristic bands at 3340 and 1420 cm−1 that are representative of –OH stretching and C–C deformation, respectively. The solid residue from pyrolysis, also called char, could find several applications in different fields. For instance, it can be used as carbon-based biofuel, because of a higher calorific value than that of starting biomass [17,26], or even as fertilizer, being able to improve the soil texture-releasing nutrients [37].
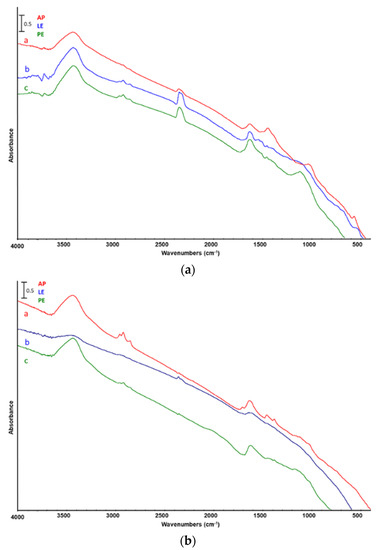
Figure 9.
FTIR analysis of solid residue from catalytic pyrolysis of a—Arthrospira platensis untreated biomass (AP), b—biomass after lipid extraction (LE), and c—biomass after protein extraction (PE). Catalyst: (a) ZSM5, (b) silica–alumina.
4. Conclusions
In this study, residues from Arthrospira platensis biomass obtained after protein or lipid extraction were valorized by catalytic pyrolysis using two different acidic catalysts, namely ZSM5 zeolite and amorphous silica–alumina. Pyrolysis products obtained from the different biomasses gave different results in terms of quantity and composition. Reaction gases from residues after extraction had higher hydrocarbon content compared to that obtained from A. platensis without any treatment, which increases the value of this fraction as well as its applicability as biogas. Moreover, the light reaction liquid to be used as a biofuel exhibited high hydrocarbon content and low oxygenate and nitrogenate contents. The use of silica–alumina as catalyst increased the hydrocarbon content of this liquid fraction from all the biomasses compared with ZSM5 zeolite. The fraction of nitrogenated compounds was reduced after protein extraction, while that of oxygenated compounds after lipid extraction. The results of this study proved that catalytic pyrolysis could be used to valorize the residues of A. platensis in order to make the microalgal production and the extraction of high value-added compounds like proteins and lipids more economically feasible. Future studies will be focused on the use of other catalysts such as faujasite zeolite and the time-dependent pyrolysis reaction mechanism.
Author Contributions
Conceptualization, A.A.C. and E.S.; experimental methodology, A.A.C. and E.S.; validation, A.A.C. and E.S.; writing—original draft preparation, A.A.C., E.S., and A.C.; writing—review and editing, A.A.C., E.S., A.C., and G.B.; visualization, A.A.C., E.S., and A.C.; supervision, A.A.C., A.C., and G.B.; project administration, G.B.; funding acquisition, G.B. All authors have read and agreed to the published version of the manuscript.
Funding
This research received no external funding.
Conflicts of Interest
The authors declare no conflict of interest.
References
- Cherubini, F. The biorefinery concept: Using biomass instead of oil for producing energy and chemicals. Energy Convers. Manag. 2010, 51, 1412–1421. [Google Scholar] [CrossRef]
- Suganya, T.; Varman, M.; Masjuki, H.H.; Renganathan, S. Macroalgae and microalgae as a potential source for commercial applications along with biofuels production: A biorefinery approach. Renew. Sustain. Energy Rev. 2016, 55, 909–941. [Google Scholar] [CrossRef]
- Chew, K.W.; Yap, J.Y.; Show, P.L.; Suan, N.H.; Juan, J.C.; Ling, T.C.; Lee, D.J.; Chang, J.S. Microalgae biorefinery: High value products perspectives. Bioresour. Technol. 2017, 229, 53–62. [Google Scholar] [CrossRef] [PubMed]
- Chowdhury, H.; Loganathan, B. 3rd generation biofuels from microalgae: A review. Curr. Opin. Green Sustain. Chem. 2019, 20, 39–44. [Google Scholar] [CrossRef]
- Soto-Sierra, L.; Stoykova, P.; Nikolov, Z.L. Extraction and fractionation of microalgae-based protein products. Algal Res. 2018, 36, 175–192. [Google Scholar] [CrossRef]
- Cheng, J.; Huang, R.; Yu, T.; Li, T.; Zhou, J.; Cen, K. Biodiesel production from lipids in wet microalgae with microwave irradiation and bio-crude production from algal residue through hydrothermal liquefaction. Bioresour. Technol. 2014, 151, 415–418. [Google Scholar] [CrossRef]
- Nobre, B.P.; Villalobos, F.; Barragán, B.E.; Oliveira, A.C.; Batista, A.P.; Marques, P.A.S.S.; Mendes, R.L.; Sovová, H.; Palavra, A.F.; Gouveia, L. A biorefinery from Nannochloropsis sp. microalga—Extraction of oils and pigments. Production of biohydrogen from the leftover biomass. Bioresour. Technol. 2013, 135, 128–136. [Google Scholar] [CrossRef]
- Williams, P.J.L.B.; Laurens, L.M.L. Microalgae as biodiesel & biomass feedstocks: Review & analysis of the biochemistry, energetics & economics. Energy Environ. Sci. 2010, 3, 554–590. [Google Scholar]
- Richardson, J.W.; Outlaw, J.L. The economics of microalgae oil. AgBioForum 2010, 13, 119–130. [Google Scholar]
- Bryant, H.L.; Gogichaishvili, I.; Anderson, D.; Richardson, J.W.; Sawyer, J.; Wickersham, T.; Drewery, M.L. The value of post-extracted algae residue. Algal Res. 2012, 1, 185–193. [Google Scholar] [CrossRef]
- Phusunti, N.; Cheirsilp, B. Integrated protein extraction with bio-oil production for microalgal biorefinery. Algal Res. 2020, 48, 101918. [Google Scholar] [CrossRef]
- Sannita, E.; Aliakbarian, B.; Casazza, A.A.; Perego, P.; Busca, G. Medium-temperature conversion of biomass and wastes into liquid products, a review. Renew. Sustain. Energy Rev. 2012, 16, 6455–6475. [Google Scholar] [CrossRef]
- Stefanidis, S.D.; Kalogiannis, K.G.; Iliopoulou, E.F.; Lappas, A.A.; Pilavachi, P.A. In-situ upgrading of biomass pyrolysis vapors: Catalyst screening on a fixed bed reactor. Bioresour. Technol. 2011, 102, 8261–8267. [Google Scholar] [CrossRef] [PubMed]
- Li, F.; Srivatsa, S.C.; Bhattacharya, S. A review on catalytic pyrolysis of microalgae to high-quality bio-oil with low oxygeneous and nitrogenous compounds. Renew. Sustain. Energy Rev. 2019, 108, 481–497. [Google Scholar] [CrossRef]
- Zainan, N.H.; Srivatsa, S.C.; Li, F.; Bhattacharya, S. Quality of bio-oil from catalytic pyrolysis of microalgae Chlorella vulgaris. Fuel 2018, 223, 12–19. [Google Scholar] [CrossRef]
- Pires, A.P.P.; Arauzo, J.; Fonts, I.; Domine, M.E.; Arroyo, A.F.; Garcia-Perez, M.E.; Montoya, J.; Chejne, F.; Pfromm, P.; Garcia-Perez, M. Challenges and opportunities for bio-oil refining: A review. Energy Fuels 2019, 33, 4683–4720. [Google Scholar] [CrossRef]
- Du, Z.; Ma, X.; Li, Y.; Chen, P.; Liu, Y.; Lin, X.; Lei, H.; Ruan, R. Production of aromatic hydrocarbons by catalytic pyrolysis of microalgae with zeolites: Catalyst screening in a pyroprobe. Bioresour. Technol. 2013, 139, 397–401. [Google Scholar] [CrossRef]
- Borges, F.C.; Xie, Q.; Min, M.; Muniz, L.A.Ô.R.; Farenzena, M.; Trierweiler, J.O.; Chen, P.; Ruan, R. Fast microwave-assisted pyrolysis of microalgae using microwave absorbent and HZSM-5 catalyst. Bioresour. Technol. 2014, 166, 518–526. [Google Scholar] [CrossRef]
- Thangalazhy-Gopakumar, S.; Adhikari, S.; Chattanathan, S.A.; Gupta, R.B. Catalytic pyrolysis of green algae for hydrocarbon production using H + ZSM-5 catalyst. Bioresour. Technol. 2012, 118, 150–157. [Google Scholar] [CrossRef]
- Hu, Z.; Ma, X.; Li, L.; Wu, J. The catalytic pyrolysis of microalgae to produce syngas. Energy Convers. Manag. 2014, 85, 545–550. [Google Scholar] [CrossRef]
- Busca, G. Acidity and basicity of zeolites: A fundamental approach. Microporous Mesoporous Mater. 2017, 254, 3–16. [Google Scholar] [CrossRef]
- Busca, G. Silica-alumina catalytic materials: A critical review. Catal. Today 2019, 1–9. [Google Scholar] [CrossRef]
- Zabeti, M.; Nguyen, T.S.; Lefferts, L.; Heeres, H.J.; Seshan, K. In situ catalytic pyrolysis of lignocellulose using alkali-modified amorphous silica alumina. Bioresour. Technol. 2012, 118, 374–381. [Google Scholar] [CrossRef] [PubMed]
- AOAC. Official Methods of Analysis of the AOAC International, 17th ed.; AOAC: Gaithersburg, MD, USA, 2000. [Google Scholar]
- Casazza, A.A.; Spennati, E.; Converti, A.; Busca, G. Production of carbon-based biofuels by pyrolysis of exhausted Arthrospira platensis biomass after protein or lipid recovery. Fuel Process. Technol. 2020, 201, 106336. [Google Scholar] [CrossRef]
- Montoya, E.Y.O.; Casazza, A.A.; Aliakbarian, B.; Perego, P.; Converti, A.; De Carvalho, J.C.M. Production of Chlorella vulgaris as a source of essential fatty acids in a tubular photobioreactor continuously fed with air enriched with CO2 at different concentrations. Biotechnol. Prog. 2014, 30, 916–922. [Google Scholar] [CrossRef]
- Alzate, M.E.; Muñoz, R.; Rogalla, F.; Fdz-Polanco, F.; Pérez-Elvira, S.I. Biochemical methane potential of microalgae biomass after lipid extraction. Chem. Eng. J. 2014, 243, 405–410. [Google Scholar] [CrossRef]
- Suzuki, K.; Aoyagi, Y.; Katada, N.; Choi, M.; Ryoo, R.; Niwa, M. Acidity and catalytic activity of mesoporous ZSM-5 in comparison with zeolite ZSM-5, Al-MCM-41 and silica–alumina. Catal. Today 2008, 132, 38–45. [Google Scholar] [CrossRef]
- Chen, W.; Li, K.; Xia, M.; Yang, H.; Chen, Y.; Chen, X.; Che, Q.; Chen, H. Catalytic deoxygenation co-pyrolysis of bamboo wastes and microalgae with biochar catalyst. Energy 2018, 157, 472–482. [Google Scholar] [CrossRef]
- Moldoveanu, S.C. Analytical Pyrolysis of Natural Organic Polymers; Techniques and instrumentation in analytical chemistry; Elevier: Amsterdam, The Netherlands, 1998; Volume 20, ISBN 9788578110796. [Google Scholar]
- Zhao, Y.; Deng, L.; Liao, B.; Fu, Y.; Guo, Q.X. Aromatics production via catalytic pyrolysis of pyrolytic lignins from bio-oil. Energy Fuels 2010, 24, 5735–5740. [Google Scholar] [CrossRef]
- Williams, P.T.; Horne, P.A. Analysis of aromatic hydrocarbons in pyrolytic oil derived from biomass. J. Anal. Appl. Pyrolysis 1995, 31, 15–37. [Google Scholar] [CrossRef]
- Huber, G.W.; Iborra, S.; Corma, A. Synthesis of transportation fuels from biomass: Chemistry, catalysts, and engineering. Chem. Rev. 2006, 106, 4044–4098. [Google Scholar] [CrossRef] [PubMed]
- Du, Z.; Hu, B.; Ma, X.; Cheng, Y.; Liu, Y.; Lin, X.; Wan, Y.; Lei, H.; Chen, P.; Ruan, R. Catalytic pyrolysis of microalgae and their three major components: Carbohydrates, proteins, and lipids. Bioresour. Technol. 2013, 130, 777–782. [Google Scholar] [CrossRef] [PubMed]
- Kersten, S.R.A.; van Swaaij, W.P.M.; Lefferts, L.; Seshan, K. Options for catalysis in the thermochemical conversion of biomass into fuels. Catal. Renew. Feed. Energy Prod. 2007, 119–145. [Google Scholar] [CrossRef]
- Wang, X.; Tang, X.; Yang, X. Pyrolysis mechanism of microalgae Nannochloropsis sp. based on model compounds and their interaction. Energy Convers. Manag. 2017, 140, 203–210. [Google Scholar] [CrossRef]
- Chan, K.Y.; Xu, Z. Biochar: Nutrient properties and their enhancement. Biochar Environ. Manag. Sci. Technol. 2012, 1, 67–84. [Google Scholar]
© 2020 by the authors. Licensee MDPI, Basel, Switzerland. This article is an open access article distributed under the terms and conditions of the Creative Commons Attribution (CC BY) license (http://creativecommons.org/licenses/by/4.0/).