1. Introduction
Charging of aerosol particles is widely used in many technological processes [
1,
2,
3,
4]. Among the most common applications, one can mention agriculture (e.g., pesticide application and artificial pollination) [
5,
6,
7,
8,
9], medicine (e.g., inhalation medications) [
10,
11], industry (e.g., painting, xerography, and food industries) [
12,
13,
14,
15], and others (e.g., thin film deposition, cosmetology, insecticide spraying) [
16,
17,
18]. The use of electroaerosols improves the efficiency of a given process, for example providing more uniform object coverage and increasing the coating efficiency [
19,
20,
21]. In general, there are several methods of aerosol charging, such as induction, conduction, corona discharge, postdispersion, and triboelectrification methods [
2,
12,
13,
22,
23,
24,
25,
26,
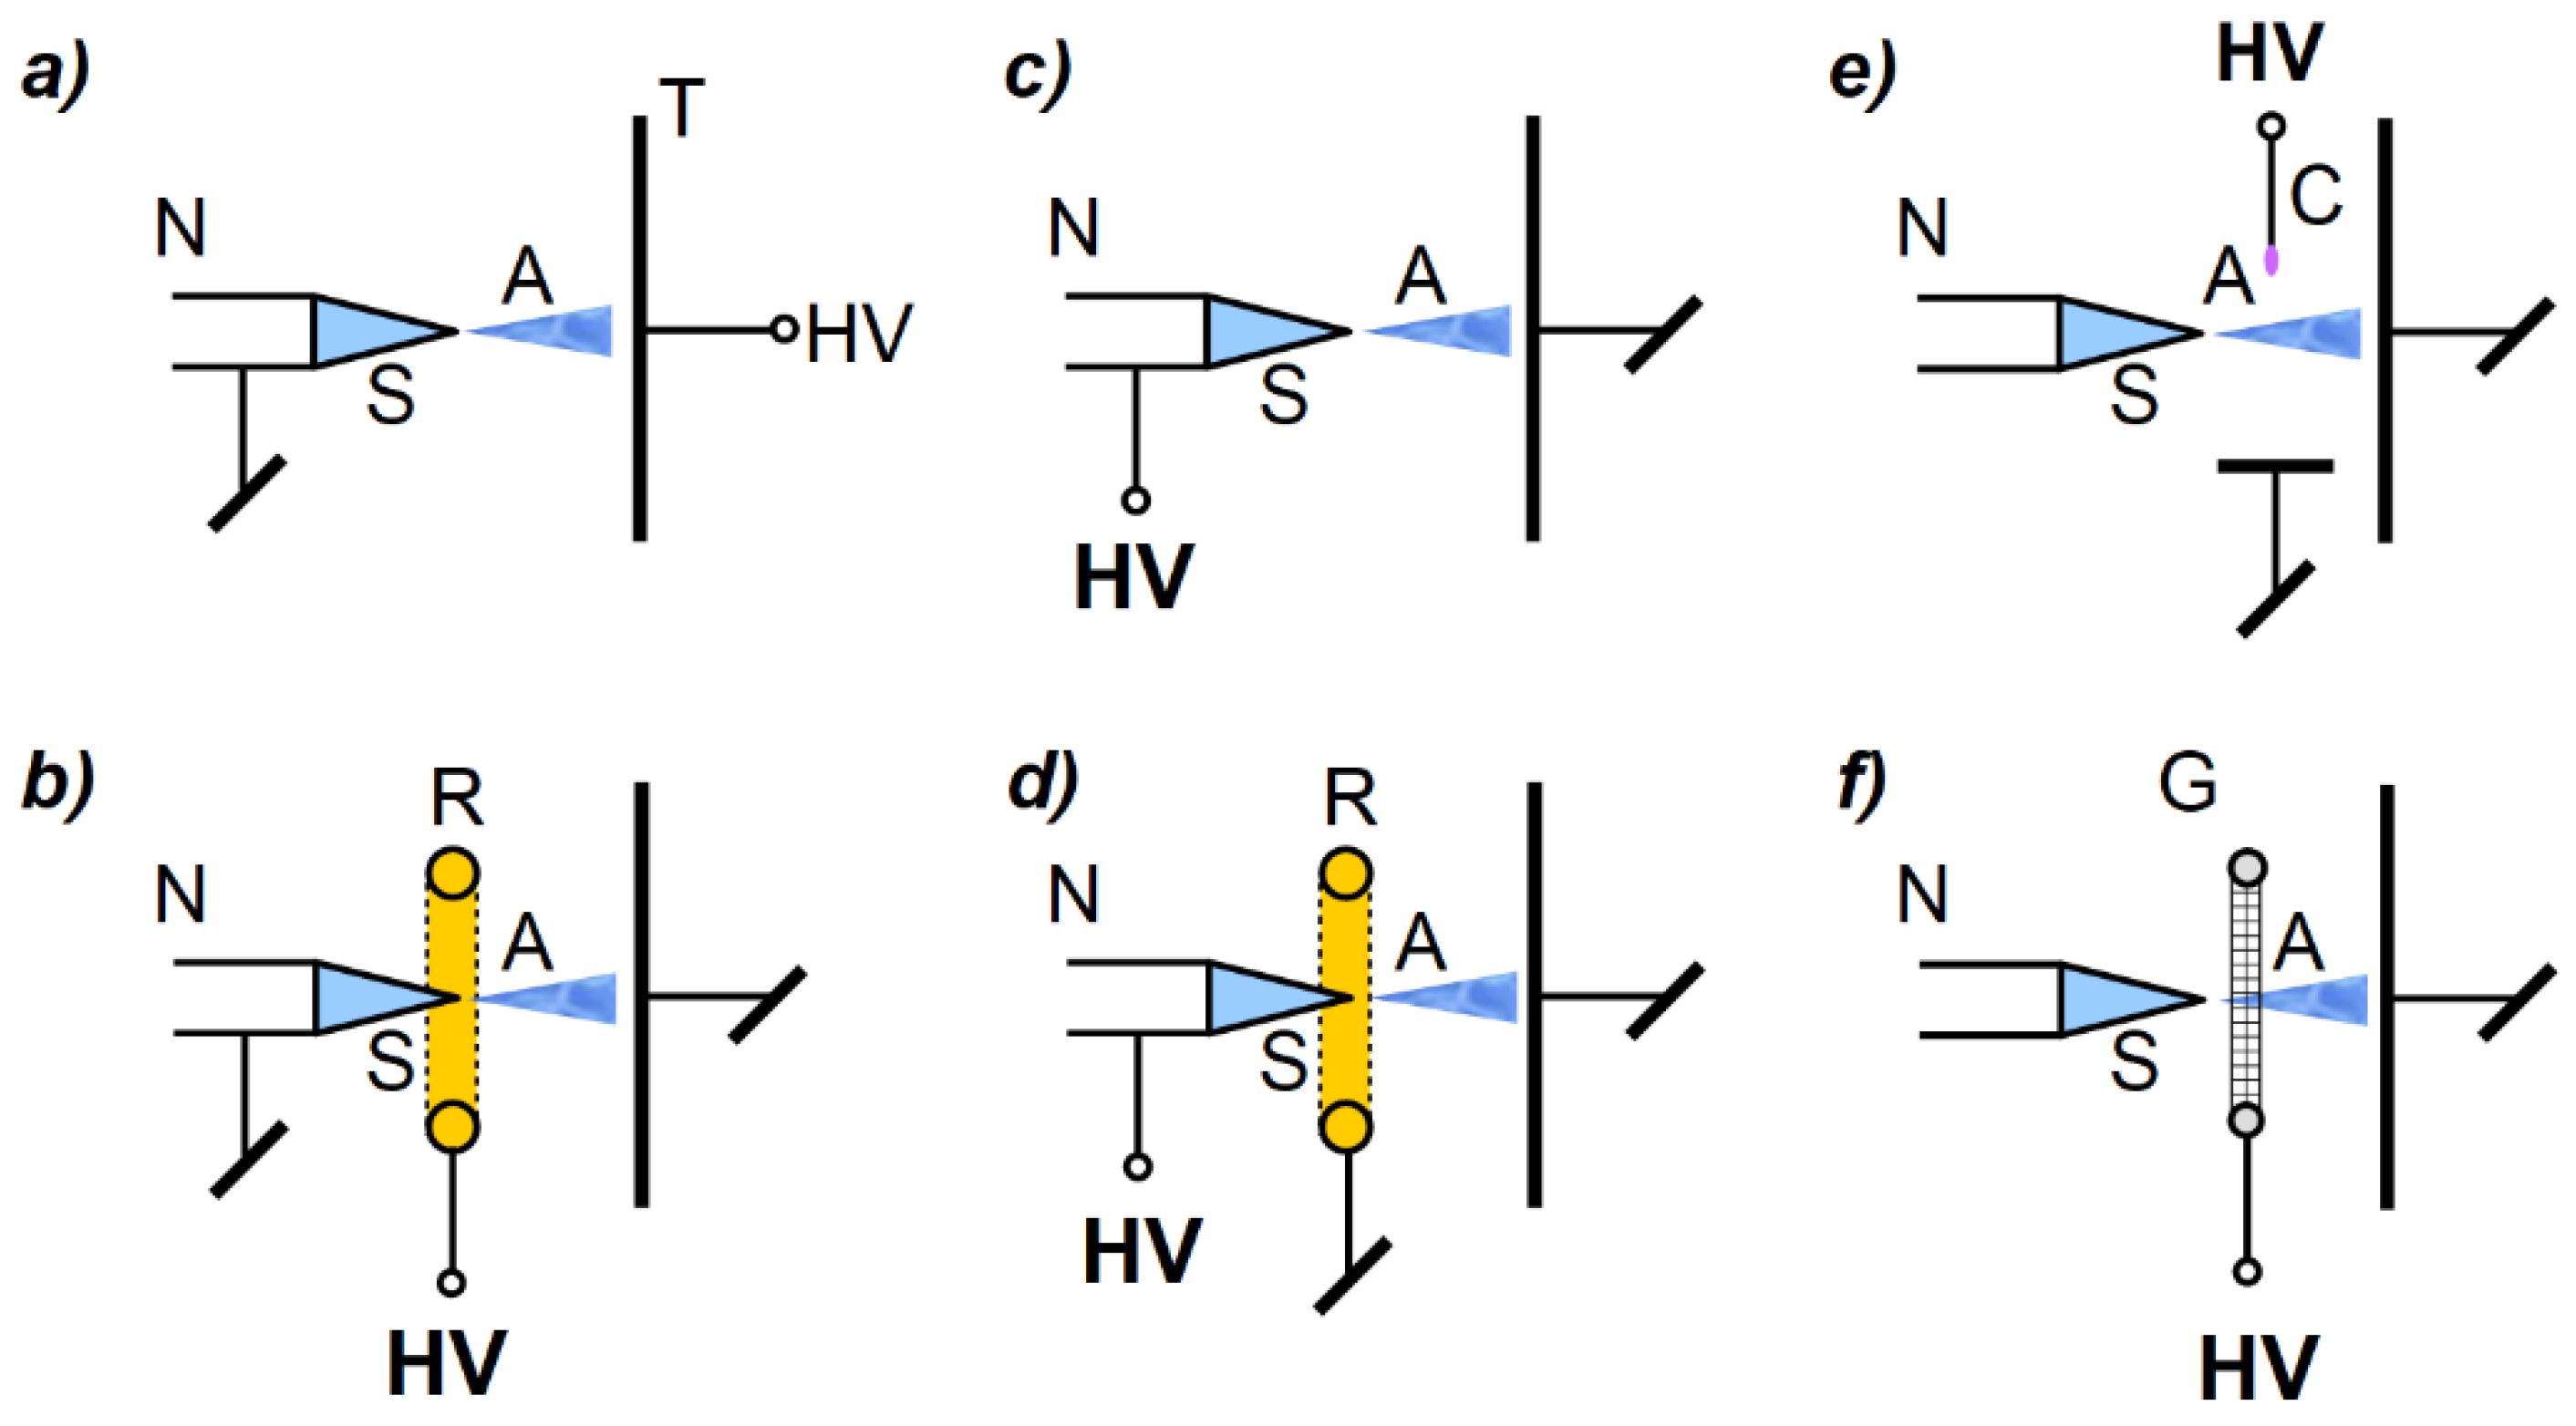
27]. Induction and conduction charging methods are commonly used for conducting liquids. Furthermore, both methods can be implemented in two- or three-electrode systems. All mentioned methods, which require an external high voltage source, are schematically shown in
Figure 1.
It should be noted that both conduction and induction methods are based on the principle of electrostatic induction. The key difference between them is the electric potential of the sprayed liquid. In the case of the induction method, the sprayed liquid is charged while being on ground potential. On the contrary, in the case of the conduction method, the liquid is charged at high potential (negative or positive). For a 2-electrode system, the induction and conduction methods are equivalent in terms of electric field distribution (i.e., if the influence of other surrounding objects, which may act as additional electrodes, are omitted). Moreover, in the case of a 3-electrode system, despite the same geometry (i.e., electrode configuration), there are some important differences, including in the electric field distribution, energy conversion, and the space charge effect. A more detailed description of the mentioned differences can be found in [
25].
To compare different charging systems, a simple capacitance model and electrostatic numerical simulations have been proposed. Furthermore, the suggested concept seems to be sufficient to estimate the value of Q/m at low liquid flow rates. The parameter Q/m provides an unambiguous comparison of the individual charging systems from the point of view of their efficiency.
In our research, both arrangements are analyzed only in terms of the electrostatic field. In general, the induced surface charge density
qsi of conducting objects is proportional to electric field
E acting on that object. For an object in a dielectric medium such as air, for which relative permittivity may be assumed as unitary
εr = 1,
qsi can be given by:
To obtain the total charge
Qi induced on the object (e.g., a droplet), one should integrate the charge over the entire surface
s:
For a conducting object, the induced charge
Qi is a result of the object–environment capacitance
C and the resulting potential difference
V:
2. Capacitance Distribution in the Charging Systems
When spraying with water and aqueous solutions (e.g., pesticides), a droplet can be effectively treated as a conducting object. This is due to the fact that the droplet is affected by an electric field longer than its material charge–transfer time constant
τ [
1,
2]. For the mentioned liquids, this time constant can be lower than 1 μs [
2]. As can be seen from Equation (3), the electrical capacitance of the system used during the charging process is the main factor (i.e., apart from the electric field related to the potential difference
V) that directly influences the value of the charge induced on the droplet. The capacitance distributions in two- and three-electrode systems are schematically shown in
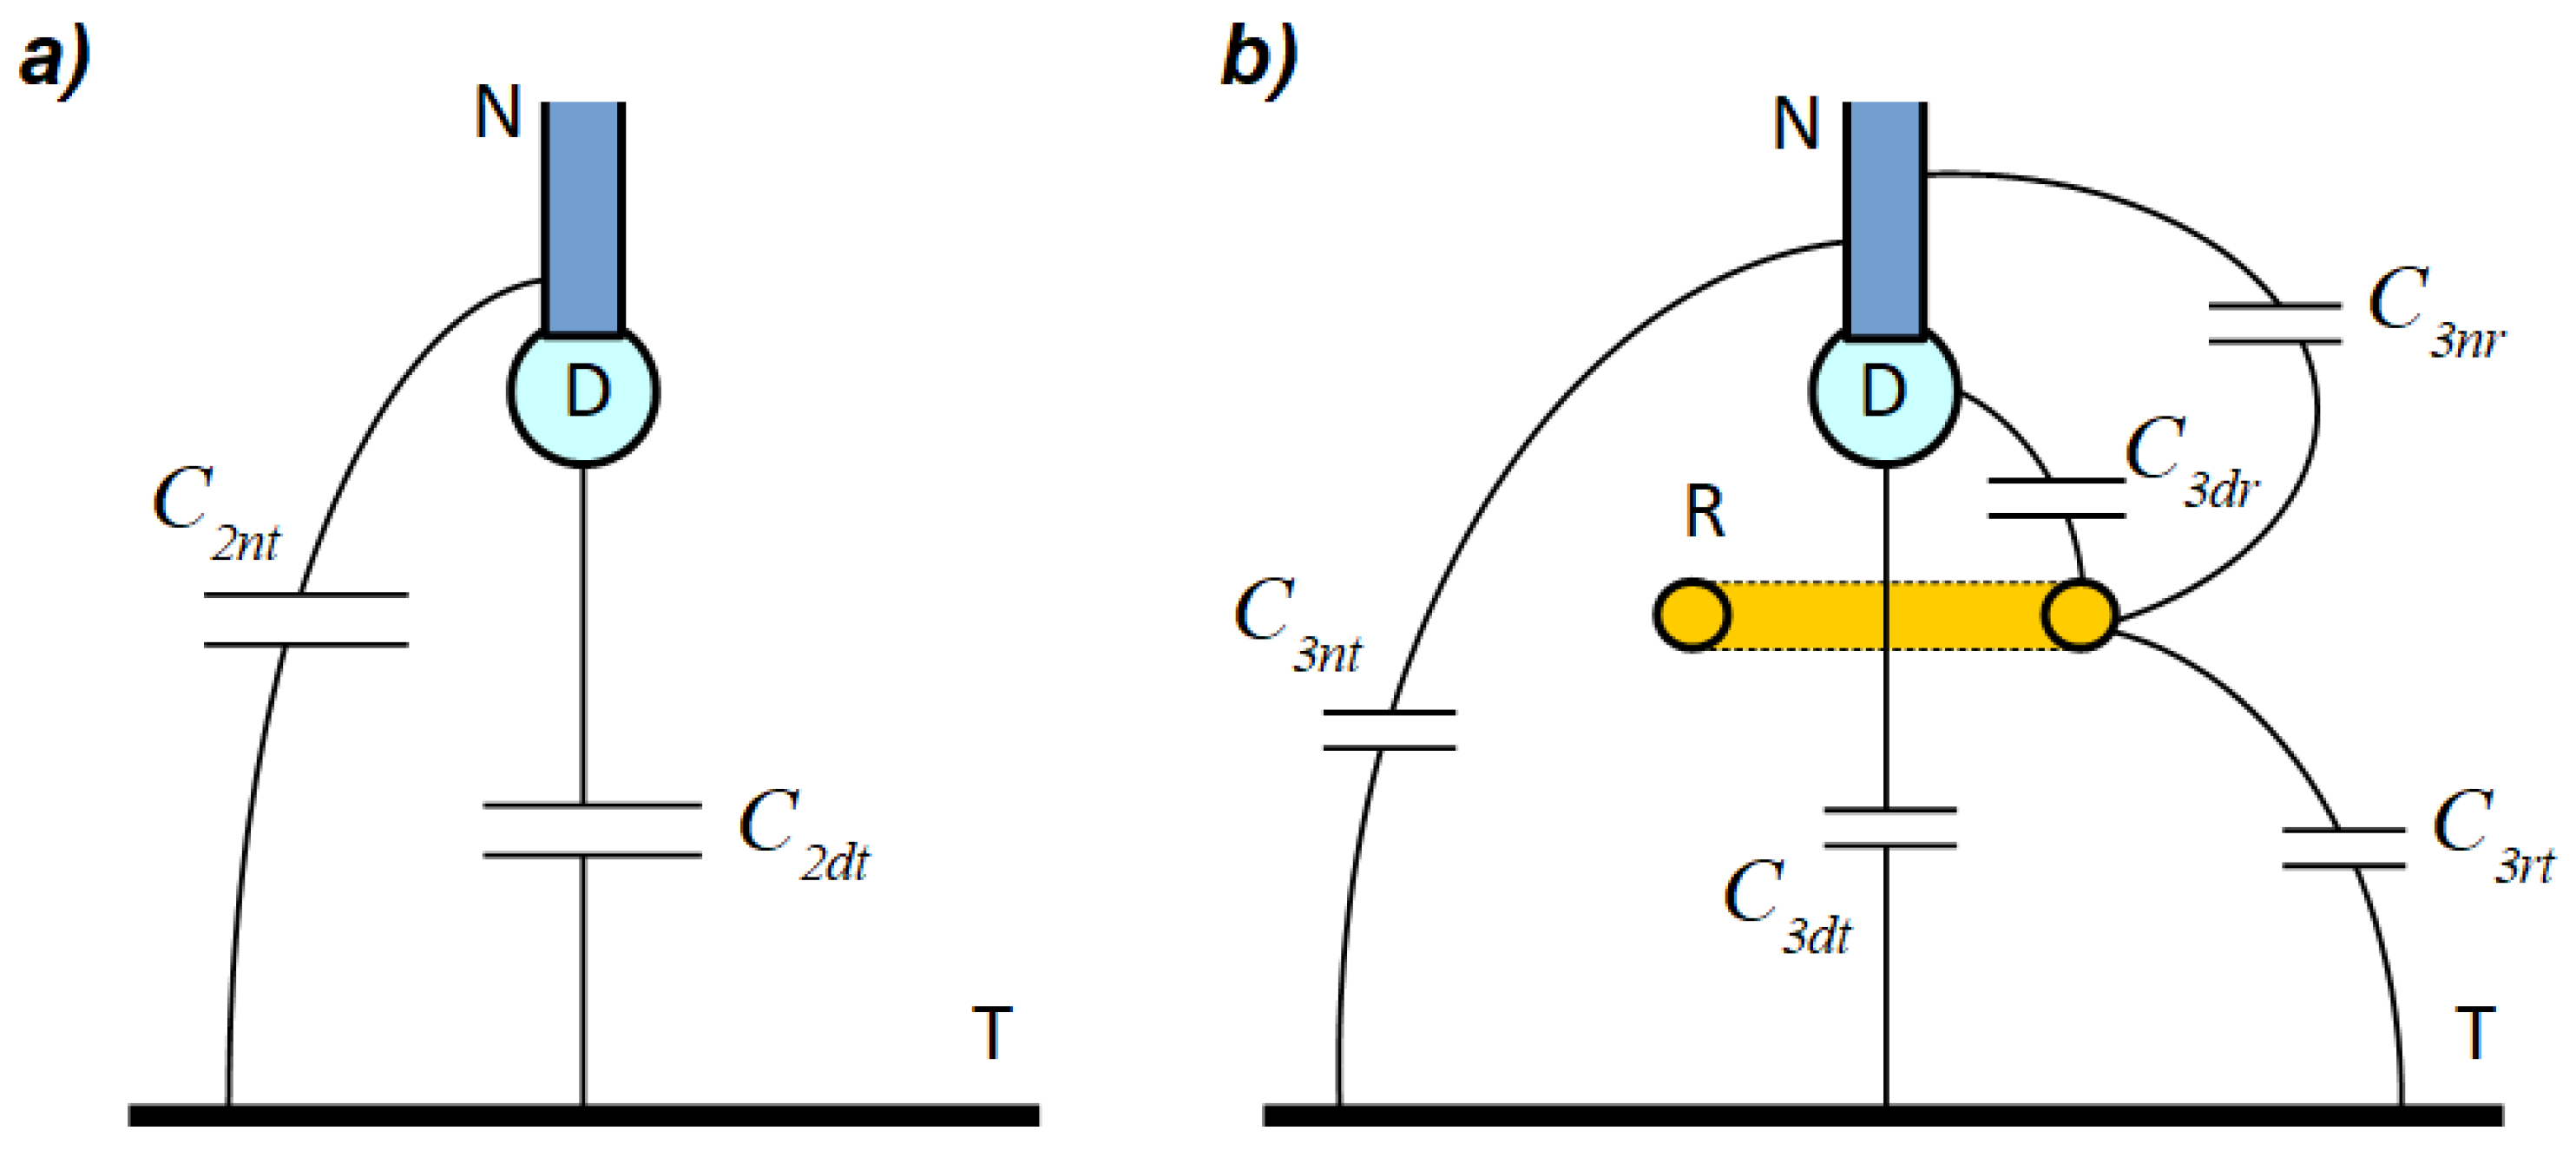
Figure 2.
In the presented model, the influence of any other objects potentially appearing in the surrounds of the system was omitted. To simplify the analysis, it was assumed that all other objects are far from the electrification setup. Thus, capacitances associated with such objects were negligibly small and excluded from further analysis. In the real setup, however, the impact of such capacitances may be significant (especially in a 2-electrode system when the target is far away from a droplet, because the capacitance C2dt can then be comparable to the droplet–environment capacitance). It should be noted that charge induced on the droplet depends only on capacitances associated with the droplet (i.e., C2dt, C3dt, C3dr). The capacitances C2nt, C3nt, C3nr, and C3rt do not directly influence the droplet charging process. However, those additional capacitances were marked because they constitute part of the analyzed systems. It was also assumed that the conductive droplet was always in contact with the conductive nozzle (i.e., a droplet and a nozzle together form a single electrode), and thus droplet potential was well determined.
In a 2-electrode system, regardless of the charging method, droplet-induced charge
Q2el can be given by:
where
V2dt is the potential difference between a droplet and a target in a 2-electrode system (i.e., the charging voltage
V),
Q2el is the induced charge in a case of a 2-electrode system, and
C2el is the total capacitance associated with a droplet in the 2-electrode system (in this case
C2el =
C2dt from
Figure 2).
In general, for a 3-electrode system, the expression for induced charge
Q3el is given by:
where
Vdr is the potential difference between a droplet and a ring electrode, and
V3dt is the potential difference between a droplet and a target in a 3-electrode system.
In the case of the induction method, there is no potential difference between a droplet and a target
V3dt = 0, and the potential difference between a droplet and a ring electrode is equal to the charging voltage
Vdr =
V. Therefore, the induced charge is:
On the other hand, in the case of conduction method, the potential difference between a droplet and a target is equal to the potential difference between a droplet and a ring electrode, and equal to the charging voltage (i.e.,
V3dt =
Vdr =
V). Consequently, the induced charge is given by:
where
Q3el_ind is the induced charge in a case of a 3-electrode system and induction method,
Q3el_cond is the induced charge in a case of a 3-electrode system and conduction method,
C3el_ind is the total capacitance associated with a droplet in the 3-electrode system for induction method (i.e.,
C3el_ind =
C3dr from
Figure 2 and
Figure 3), and
C3el_cond is the total capacitance associated with a droplet in the 3-electrode system for induction method (i.e.,
C3el_cond = (
C3dr +
C3dt) from
Figure 2 and
Figure 3).
Considering that a capacitance is a function of the geometry of the electrodes and the dielectric properties of the medium between them, it is important to note that the potential difference between electrodes does not affect the capacitance distribution in the system or the value of these capacitances. However, if there is no potential difference between the electrodes, no charge can be induced, so the effect of this capacitance can be omitted. The concept of so-called effective capacitance distribution only applies to the capacitances between electrodes with a potential difference. Alternatively, it can be assumed that the electrodes on the same potential are in a galvanic contact with each other, forming one single electrode. The concept of capacitance between such electrodes becomes virtually meaningless.
Effective capacitance distributions for induction and conduction methods are presented in
Figure 3. In the following considerations, it is assumed that 3-electrode systems have the same geometry.
The capacitance distribution in a 2-electrode system is the same regardless of the charging method. In the case of a 3-electrode system, capacitance values do not change, however the effective capacitance distribution varies because of the change in the potential values. In a 3-electrode system where the induction method is due to the lack of potential difference between a droplet and a target, the capacitance
Cdt can be omitted, as shown in
Figure 3b.
As capacitances have always positive values, it is obvious that:
Therefore, in a 3-electrode system, based on Equations (6) and (7):
Thus, if the same value of voltage is applied, it can be shown from Equation (3) that:
If
C3dt <<
C3dr (e.g., the target is far away from the nozzle, and the ring electrode is close to the nozzle), charges induced in the particular systems can be given by:
It should be noted that the capacitances
C2dt and
C3dt are not equal. Geometries in a 2-electrode system and a 3-electrode one are different due to the presence of the ring electrode. The capacitance
C2dt is related to the total droplet surface. However, in the case of a 3-electrode system, the capacitance
C3dt is associated only with part of the droplet surface because of the presence of the
C3dr capacitance, as shown in
Figure 2b. Because the capacitance is directly proportional to the electrode surface area, the relation between these two capacitances is:
In the case of the conduction method, the electric field associated with a droplet affects the target or the ring electrode. If the ring is closer to the droplet than the target it can be hypothesized that:
Considering the conduction method in Equation (13):
Thus, assuming that the same voltage is applied:
The case Q3el_cond ≅ Q2el refers to the situation where the ring electrode is far away from the nozzle in the 3-electrode system with the conduction method, and thus the electric field distribution in that system is similar to that in the 2-electrode system.
In general, the value of
C3dr can be greater, smaller, or equal to the value of
C2dt, so there are possible electrode configurations where:
In the case of the induction method, Equation (16) can be given by:
Thus, assuming that the same voltage is applied:
Equations (16)–(18) are only valid for one of three possible situations (e.g., C2dt > C3dr), which occur when the surface of the ring electrode is much smaller than the target surface. As a consequence of the above-mentioned remark, there may be some electrode configurations in which charge induced in a 2-electrode system is higher than charge induced with the induction method in a 3-electrode system for the same applied voltage.
3. Computer Simulations of the Droplet Charging Process
To show the electric field distribution for cases described in the previous section, numerical finite element method (FEM) simulations were performed in the COMSOL Multiphysics 4.3 software using 2D axisymmetric geometry. Thus, the presented model employs an analysis of the distribution of electrical capacitances in the electrification system with different methods of droplets charging. The area of the calculated electric field distribution was restricted to a cylinder with a height of 150 mm and a diameter of 100 mm. On the external boundaries of the model (excluding the grounded floor, i.e., the target) only the tangential component of the electric field could have existed. The permittivity of the medium filling the space was assumed to be
εr = 1 (i.e., air). Electric field distributions for induction and conduction methods in the 3-electrode system are presented in
Figure 4 and
Figure 5.
In
Figure 5, it can be seen that in the case of the conduction method, the electric field lines (associated with the droplet) are linked to the ring electrode and the target. In contrast, in the case of the induction method, the electric field lines (associated with the droplet) are linked only to the ring electrode, as shown in
Figure 4.
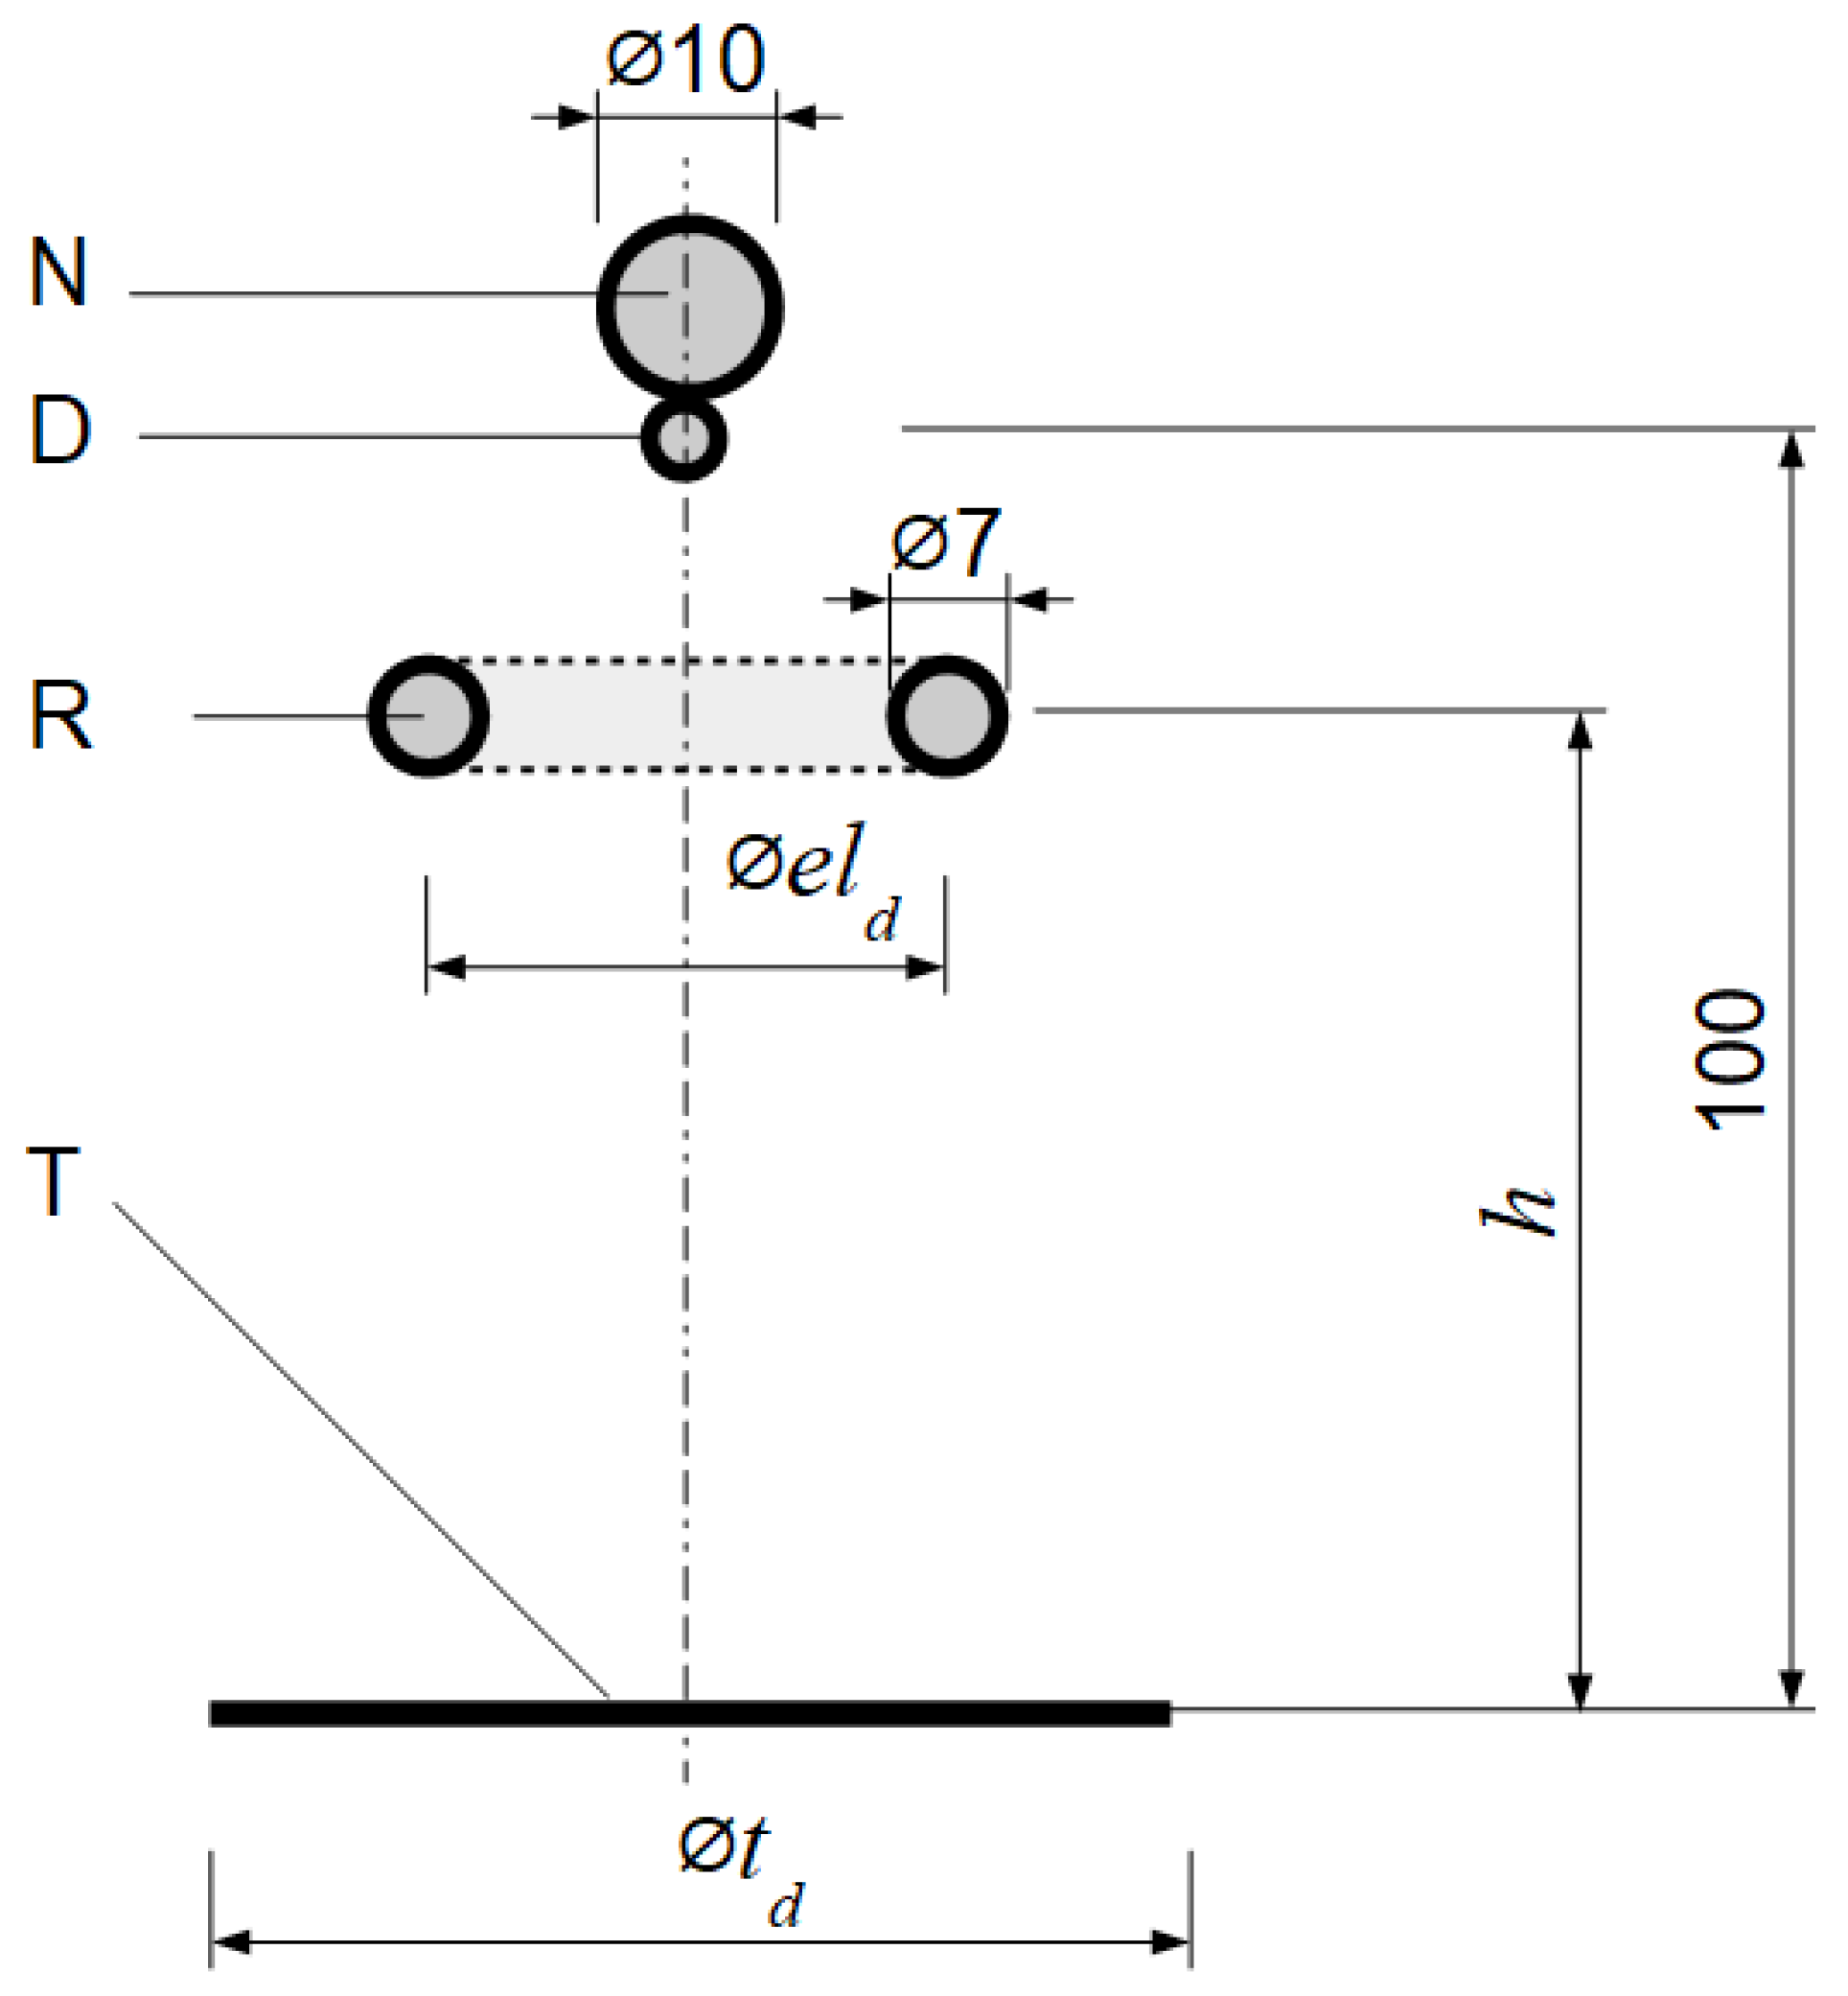
To illustrate the influence of different electrode configurations on the charging process, another FEM model was created using 2D axisymmetric geometry. The geometry of the assumed setup is shown in
Figure 6. The simulation area was again restricted to a cylinder with a height of 500 mm and a diameter of 200 mm. Other parameters of the simulation (i.e., external boundary condition, medium permittivity) were unchanged in comparison to the simulation described previously (
Figure 4 and
Figure 5).
In the analyzed model, the ring electrode can be in a position below (
h < 100 mm) or above (
h > 100 mm) the droplet, because the position of the ring electrode does not affect the capacitance distribution in the system (presented in
Figure 1 and
Figure 2), rather only slightly changes the values of these capacitances.
In the described above model, various scenarios were represented by changing the diameter of the ring electrode eld or the target td. The following cases were analyzed:
eld = 40 mm, td = 20 mm (i.e., a narrow ring electrode and a small target);
eld = 40 mm, td = 200 mm (i.e., a narrow ring electrode and a big target);
eld = 80 mm, td = 200 mm (i.e., a wide ring electrode and a big target).
The terms “small”, “big”, “narrow”, and “wide” should be treated in a relative rather than an absolute manner.
In analyzed situations, the droplet–target distance was kept constant and equal to 100 mm. In the physical system realization, this parameter also plays an important role. However, when the droplet is far away from the target and the ring electrode is close to the nozzle, the capacitance C3dt should be negligible, and then both methods (i.e., conduction and induction) should give similar results. The presented analysis focuses only on cases where the nozzle is relatively close to the grounded target. In all three cases, the ring electrode height h was changed in the range of 25–200 mm. The total capacitance between the droplet and the environment was numerically calculated, and the obtained values were divided by the droplet-environment capacitance for the 2-electrode system, which is the same regardless of the charging method.
Taking into account the capacitance distributions shown in
Figure 3, particular capacitances can be given by:
It should be also pointed out that induced charge is directly proportional to corresponding capacitances, namely in Equations (3), (4), (6), and (7). Capacitances
C2el,
C3el_cond, and
C3el_ind are called droplet capacitances because of their corresponding charging methods. Values of capacitances
C3el_cond and
C3el_ind relative to
C2el for different electrification conditions are shown in
Figure 7 (i.e., case A: a narrow ring electrode and a small target),
Figure 8 (i.e., case B: a narrow ring electrode and a big target), and
Figure 9 (i.e., case C: a wide ring electrode and a big target).
Results for a setup with a narrow ring electrode (
rd = 40 mm) and a small target (
td = 20 mm) are shown in
Figure 7. It can be seen from
Figure 7 that both droplet capacitances
C3el_cond and
C3el_ind have similar values. The differences are most significant when the ring electrode is high above the droplet (
h > 120 mm). In this case,
C3dt is small and
C3dr is dominant when conduction charging is considered, such as in Equations (20) and (21). The maximum values of capacitances
C3el_cond and
C3el_ind were obtained for the height of the ring electrode
h equal to 100 mm (i.e., when the ring electrode is near the droplet). These capacitance values for 3-electrode systems were about 3 times higher than the capacitance
C2el calculated for the setup with two electrodes. Based on the presented results, similar values of the induced charge for both methods using a 3-electrode system can be expected. The presented case corresponds to a system with a well-designed ring electrode.
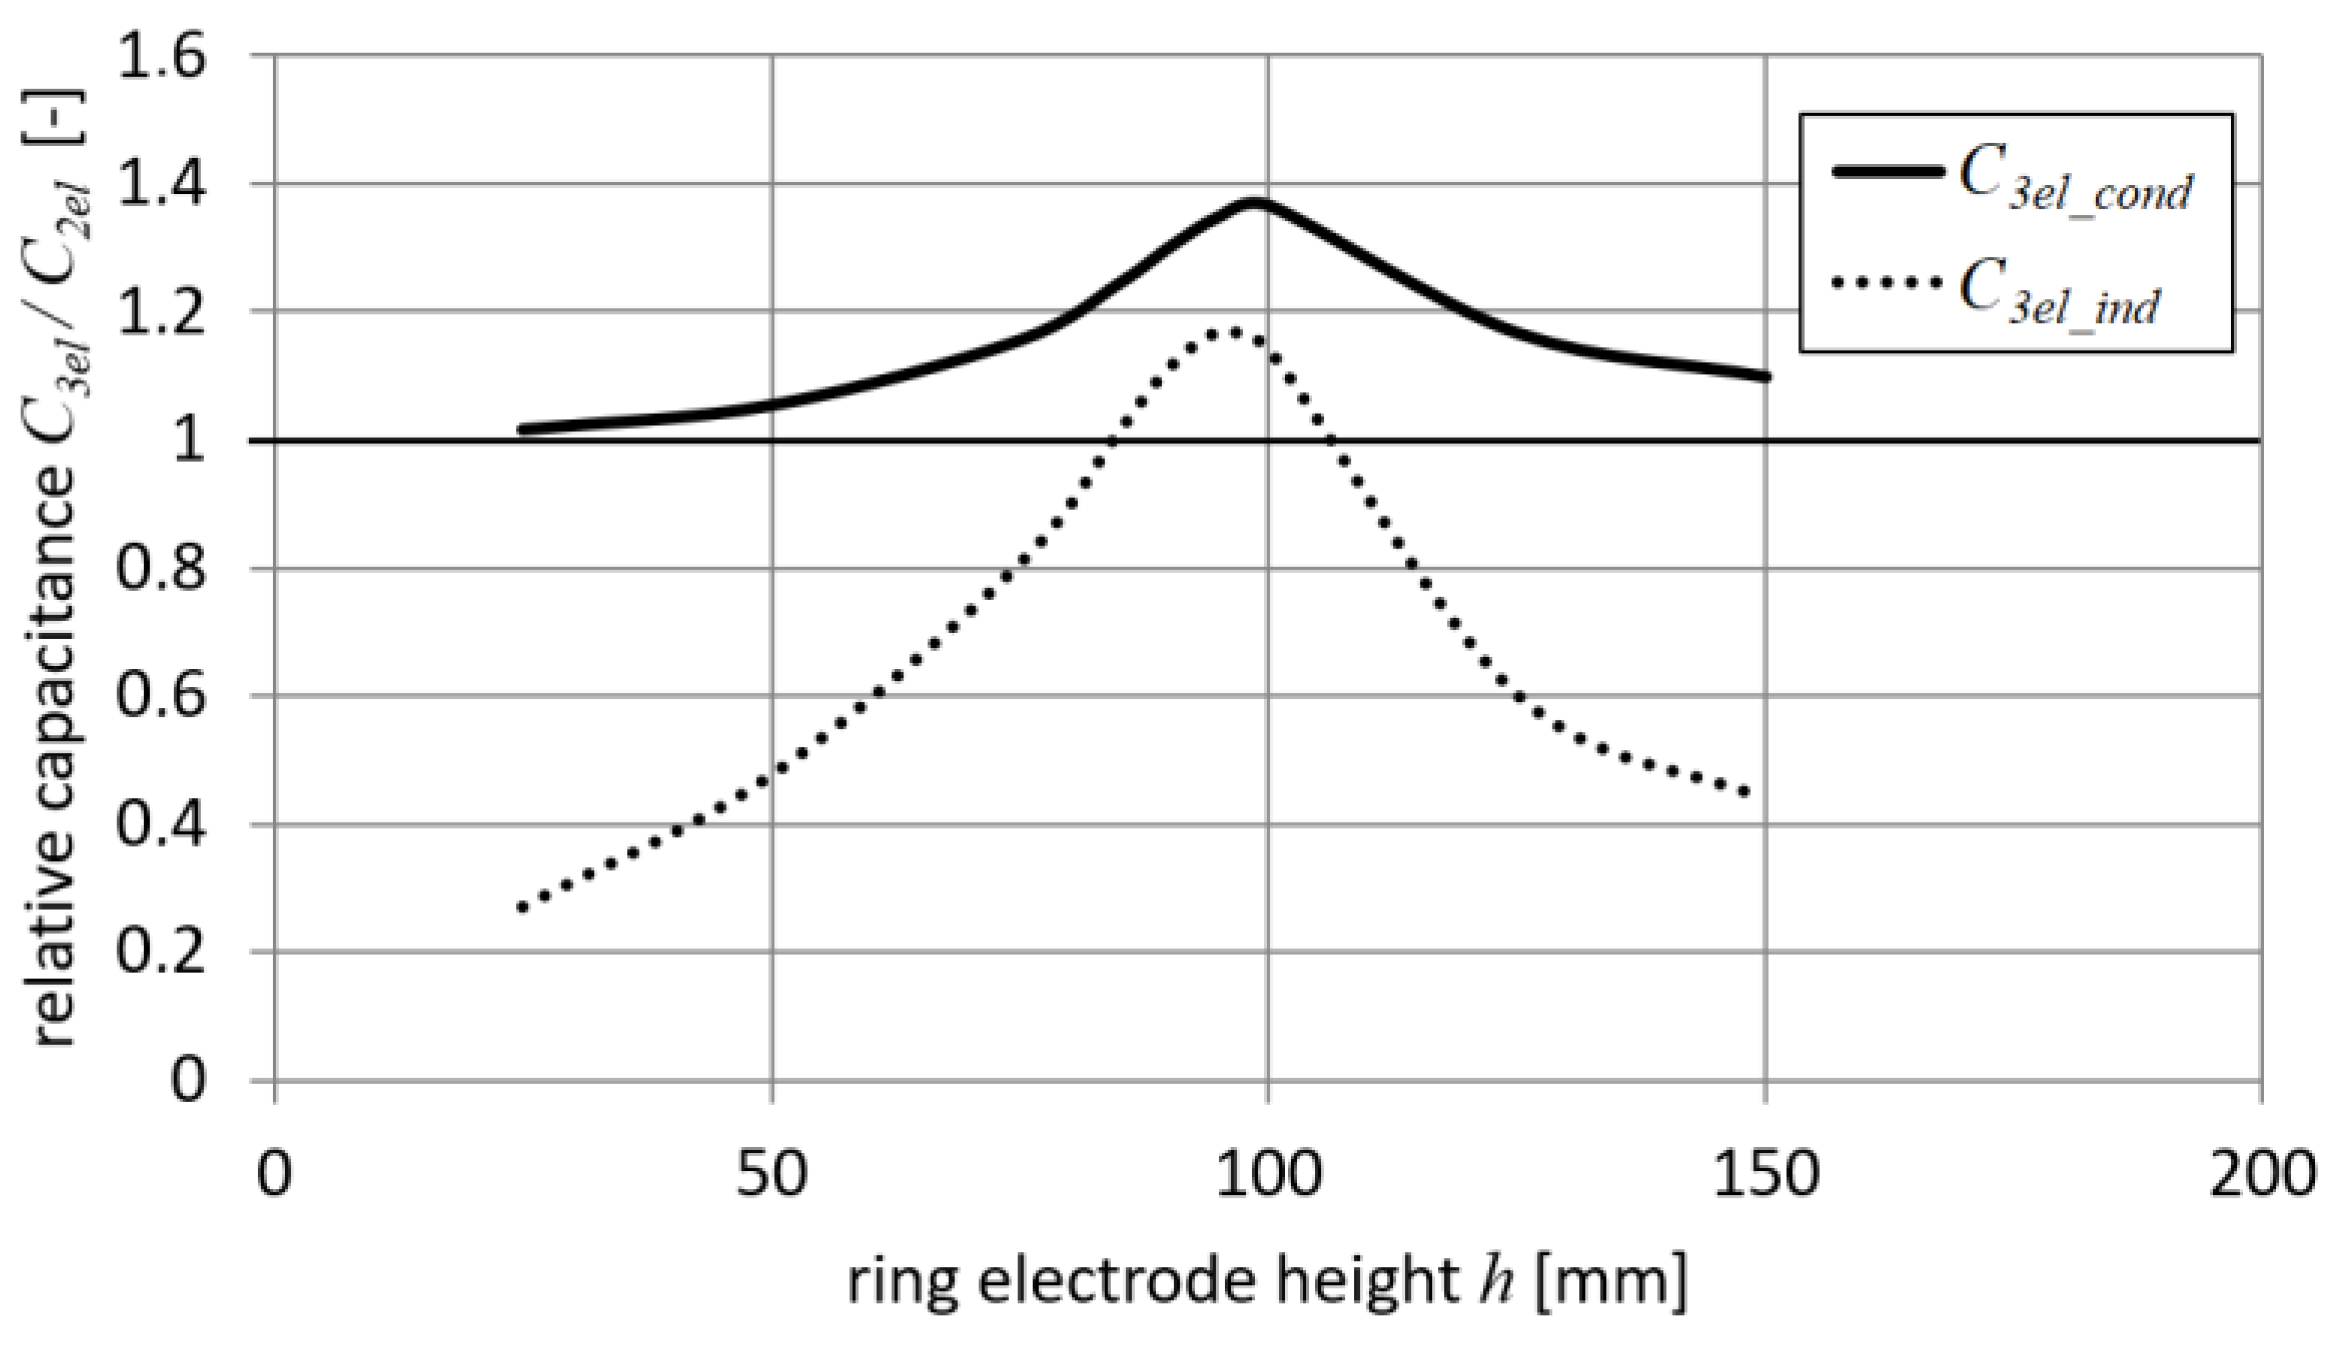
Results for the setup with a narrow ring electrode (
rd = 40 mm) and a big target (
td = 200 mm) are shown in
Figure 8.
Figure 8 shows that the capacitance
C3el_cond always significantly exceeds
C3el_ind, especially when the ring electrode is far away from the droplet position. This effect indicates that for conduction charging, the influence of both capacitances (i.e.,
C3dr and
C3dt) is comparable. Based on these results and Equation (21), it can be concluded that an increase in the distance between the ring electrode and the droplet leads to an increase in the capacitance
C3dt influence. It was also found that there are some positions of the ring electrode
h for which the capacitance
C3el_ind is lower than the droplet capacitance of a 2-electrode system
C2el (i.e., values lower than 1 in
Figure 8). Moreover, it was observed that for a certain narrow range of height
h (i.e., 85 <
h < 105 mm), a 3-electrode system with induction charging provides higher
Q/
m values (i.e., values greater than 1 in
Figure 8).
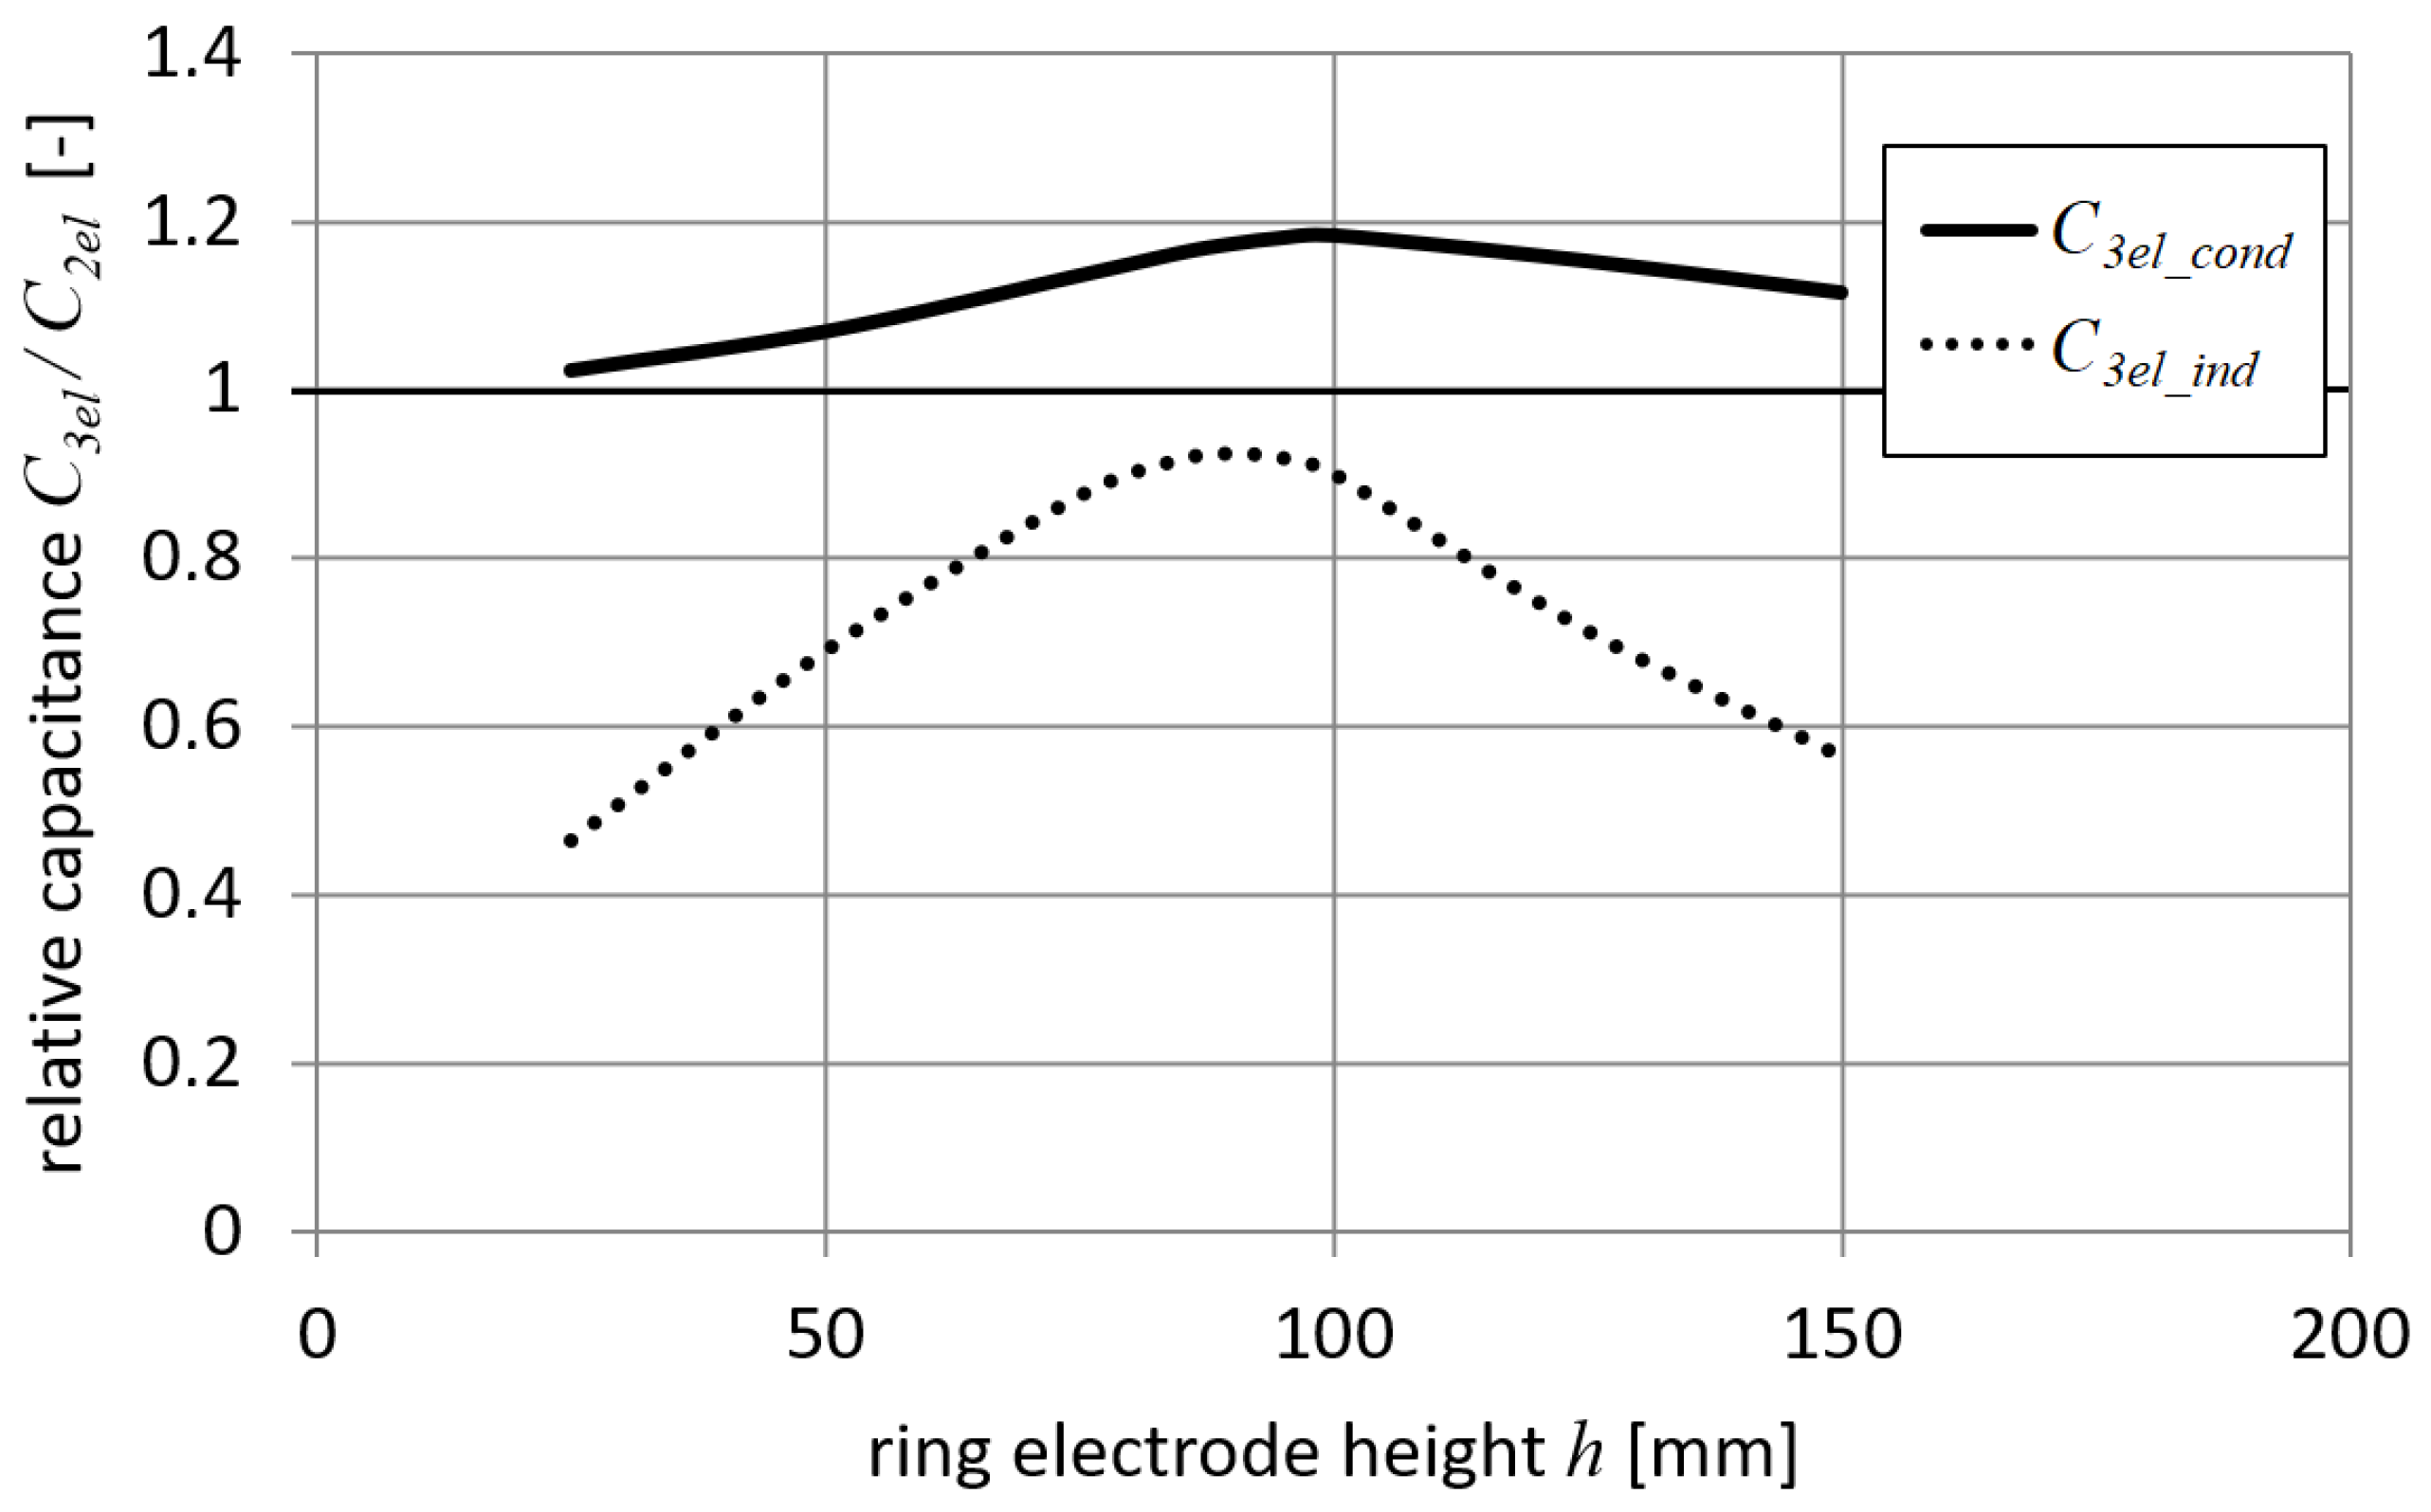
Results for the setup with a wide ring electrode (
rd = 80 mm) and a big target (
td = 200 mm) are shown in
Figure 9. As can be seen in
Figure 9, the capacitance
C3el_cond is always significantly greater than
C3el_ind, which is a similar situation to the previous case. In addition, it can be noticed that the induction charging method in a 3-electrode configuration is always less efficient than electrification in the 2-electrode system (i.e., values lower than 1 in
Figure 9). The discussed case corresponds to a system with a poorly designed electrode arrangement.
The following findings can be made for all analyzed cases:
droplet capacitance in a 3-electrode system is the highest when the ring electrode is slightly under the droplet;
droplet capacitance in the 3-electrode conduction method C3el_cond is always greater than in the 3-electrode induction method C3el_ind or 2-electrode system C2el;
for certain electrode configurations (i.e., the position of the ring electrode), droplet capacitance in the 3-electrode induction method
C3el_ind is lower than in the 2-electrode system
C2el, even if the ring electrode is at the same height as the droplet (
Figure 9);
droplet capacitance in the 3-electrode conduction method C3el_cond is less dependent on the ring electrode position.
Considering that the induced charge is directly proportional to droplet capacitance, as stated in Equation (3), and assuming the same value of applied voltage for 2- and 3-electrode systems, the above-mentioned observations lead to the conclusion that a 3-electrode conduction charging method always gives higher values of droplet charge than a 3-electrode induction method or a 2-electrode system. Moreover, the 3-electrode induction method may sometimes be less efficient in terms of the induced charge than the 2-electrode system.
It should also be noted that the above examples were given to illustrate the influence of different electrode arrangements on the charging levels of droplets, and are not related to any real geometry. When designing the electrode system, other factors should also be taken into account (e.g., electrical strength of the system).
In the real dynamic case of the charging process, the droplet (i.e., water or other liquid) is deformed due to the electric field. Since in each setup the electric field is different (even at the same voltage), the droplet deformation may be different. This effect causes further changes in the electric field distribution, and thus leads to a different induced charge. Other factors affecting the value of the
Q/
m ratio are space charge [
28] and flow rate, as well as sprayed liquid properties [
29]. The charged droplets may also shield the sprayed liquid from the electric field, reducing the charging level [
30]. It should also be mentioned that the charge of a droplet is limited due to the electric field strength of the medium or due to the Rayleigh limit [
1,
2]. For that reason, one droplet can separate into smaller droplets [
1,
2], and very complex numerical simulation techniques (i.e., including particle tracking, moving mesh, and computational fluid dynamics CFD) [
31,
32,
33,
34] are often used to model the droplet charging process.
4. Measurements and Calculations of the Q/m Parameter
To confirm the validity of the previous theoretical considerations, a simple experimental setup for the measurements of the
Q/
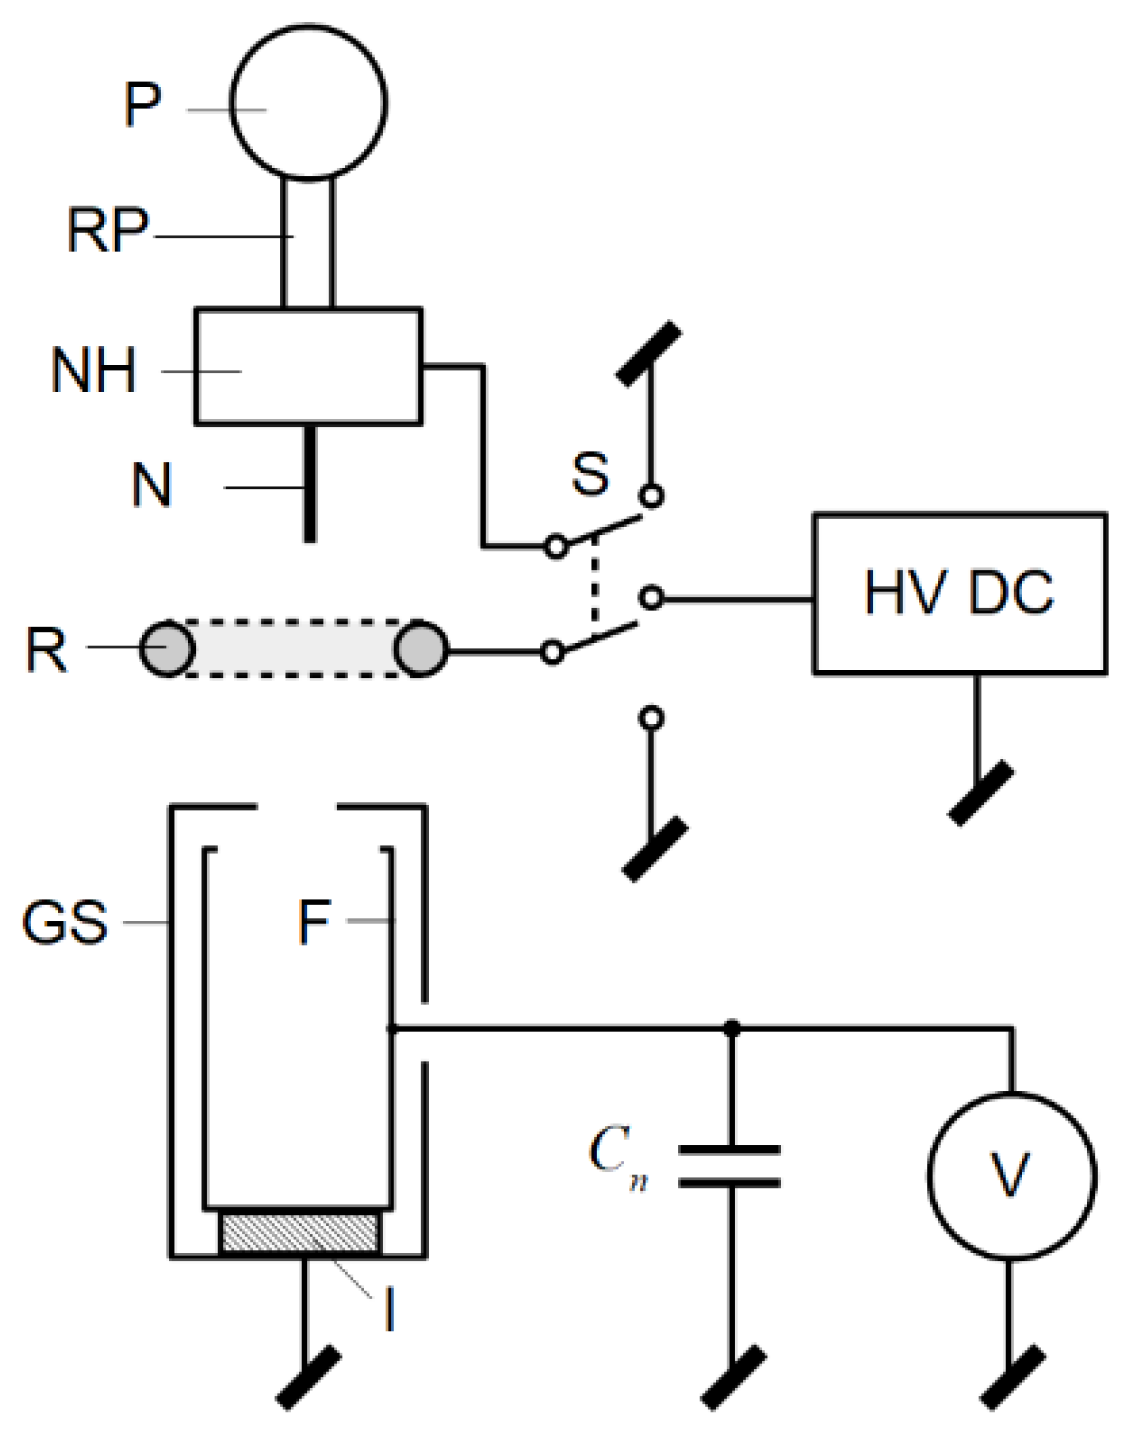
m parameter was proposed. The main parts of the setup were the pump (P) equipped with a rubber pipe (RP) for pumping water, a metallic needle as a nozzle (N) with a needle holder (NH) and a conducting ring electrode (R) (for which height above the ground
h was adjusted during the experiment), and a Faraday cup (F) in a grounded shield (GS). The Faraday cup was almost completely shielded and only had a hole allowing the charged droplets to enter it. In the charging process, a high-voltage DC power supply was used. The switch S was used to change the electrification method (i.e., induction or conduction). The measurement setup is shown in
Figure 10. The capacitance of the cable and Faraday cup
Cn was equal to 1.18 nF. The voltage on
Cn was measured using electrometer.
The diameter and the mass of the droplets formed during the charging process were equal to 2.7 mm and 10.3 mg, respectively. The ratio of droplet generation was equal to 100 droplets per minute to avoid a shielding effect from other charged droplets. The applied voltage was equal to about 5 kV (positive for the conduction method and negative for the induction method), so the droplet charge was always positive. A specific voltage level was chosen to avoid deformation of the liquid droplet or droplet breakdown into smaller droplets. For this reason, the obtained values of Q/m were relatively low. Distilled water with a conductivity of 1.4 µS/cm (measured at 23 °C) was used in the studies.
Based on the measurement setup, another FEM simulation model was proposed, as outlined in
Figure 11. The simulation area was a cylinder measuring 100 mm in height and 1000 mm in diameter. Other simulation parameters (i.e., external boundary condition, medium permittivity) were unchanged in relation to the previously described simulations. The total induced charge on droplet
Qd was numerically calculated. To obtain the
Q/
m parameter, the value of
Qd was divided by the experimentally measured droplet mass.
The first experiment was carried out for a 2-electrode setup (i.e., without the ring electrode). The measured and calculated values of the Q/m parameter were equal to 15.6 µC/kg and 20.4 µC/kg, respectively. This means that the calculated (Q/m)2el_sim was 1.31 times greater than the measured (Q/m)2el_exp.
In the next part of the experimental study, the ring electrode was introduced into the system, which enabled the charging of droplets in a 3-electrode configuration. The height of the ring electrode
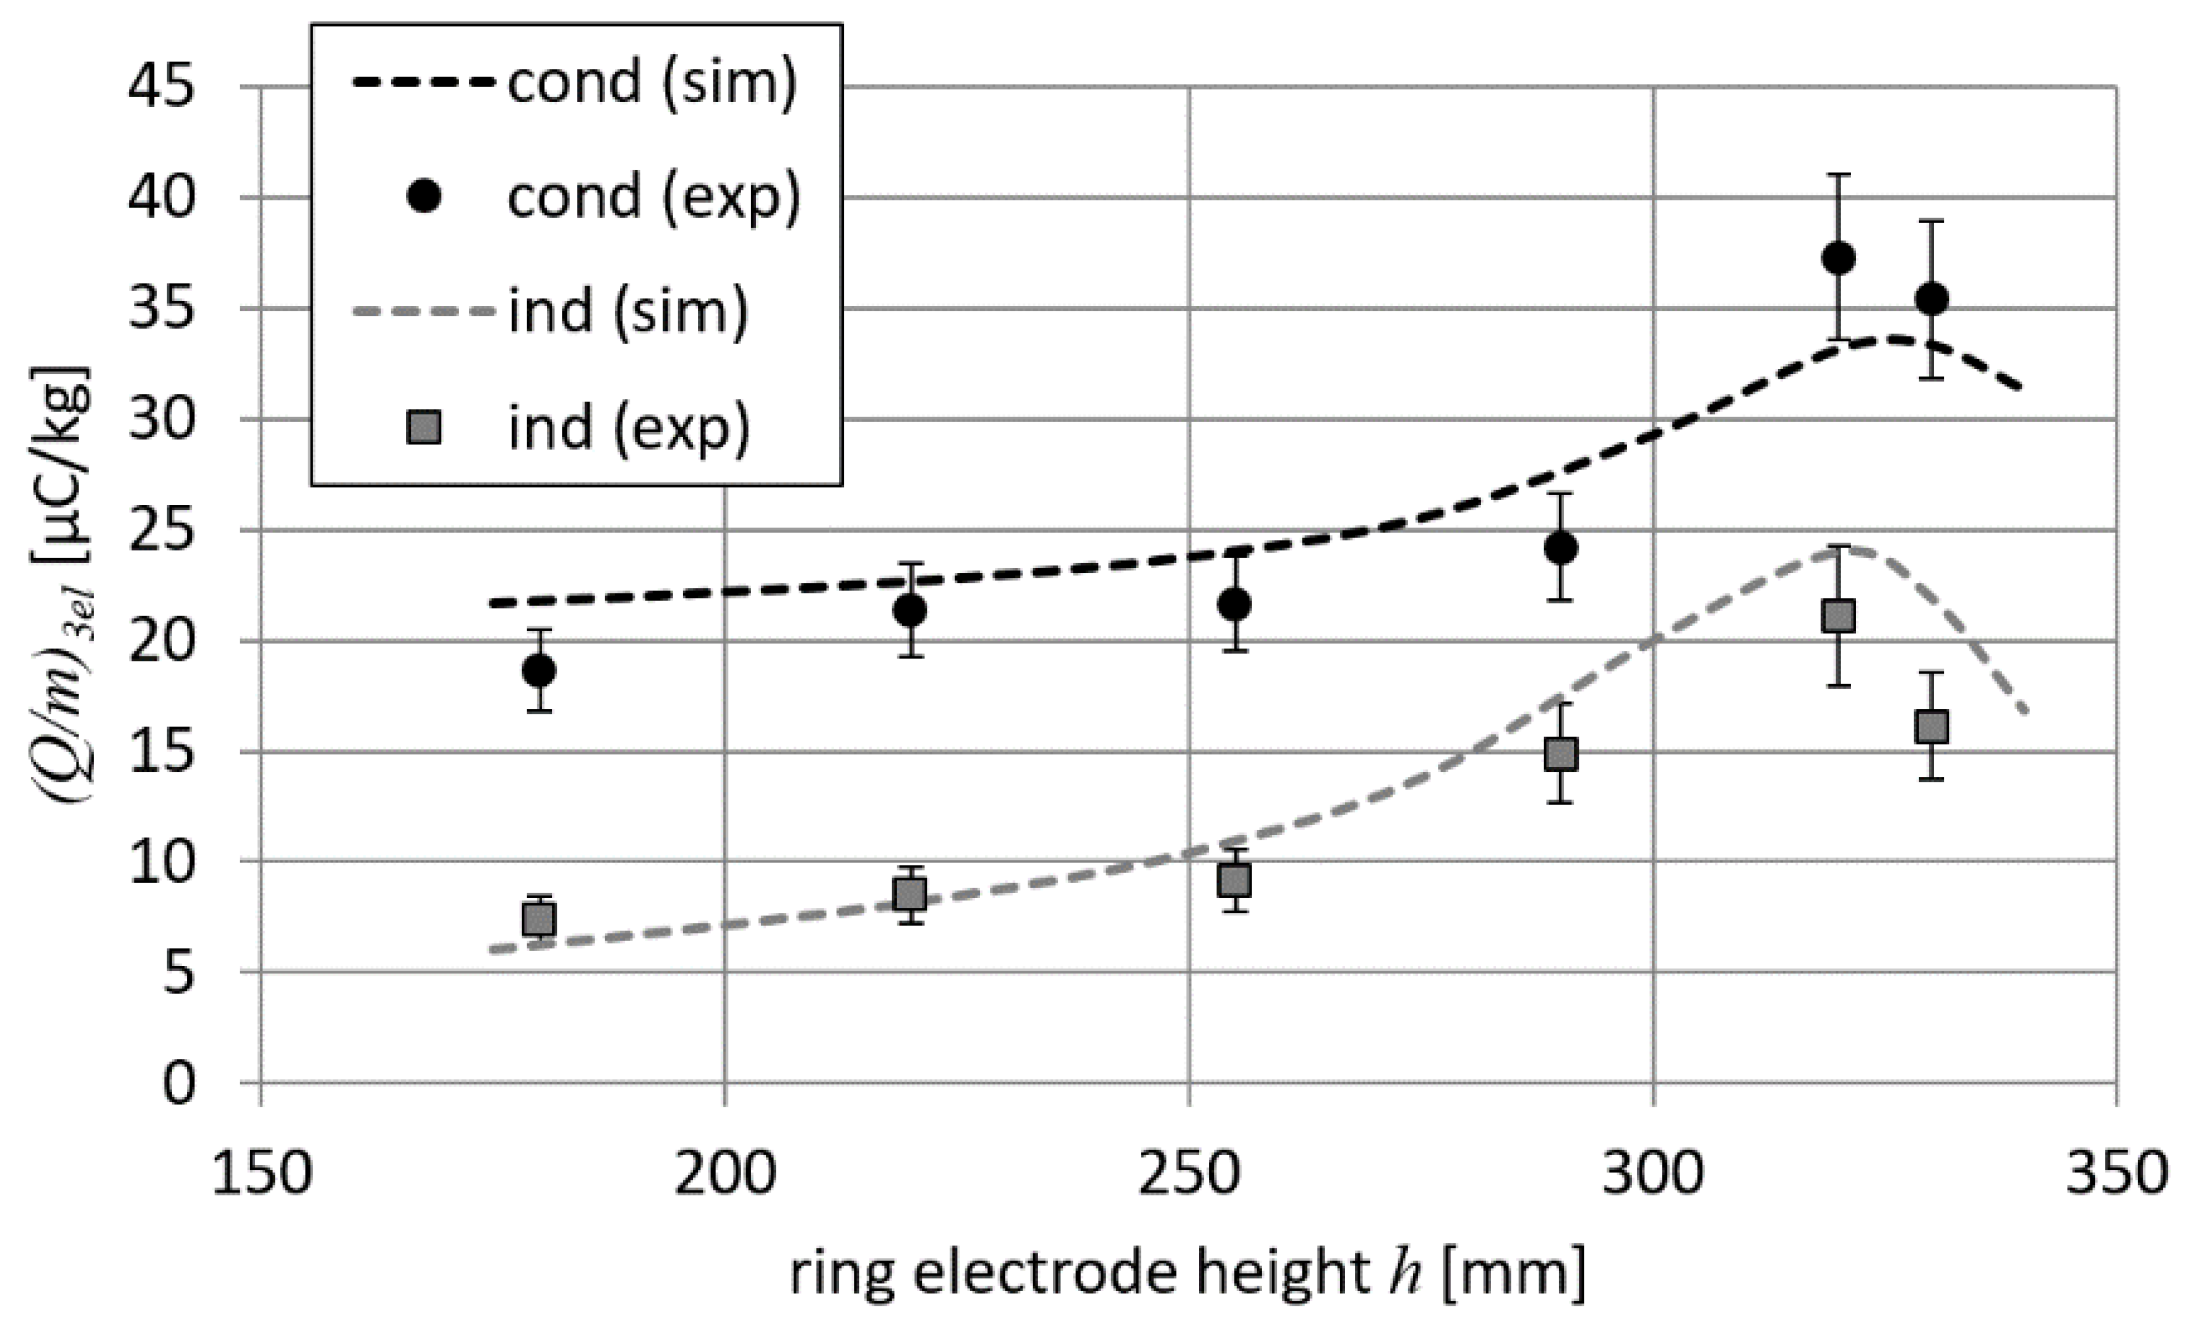
h was in the range of 180 to 330 mm. The results of
Q/
m measurements and simulation-based calculations are shown in
Figure 12. It can be seen from
Figure 12 that the differences between numerically calculated and measured values do not exceed 20%.
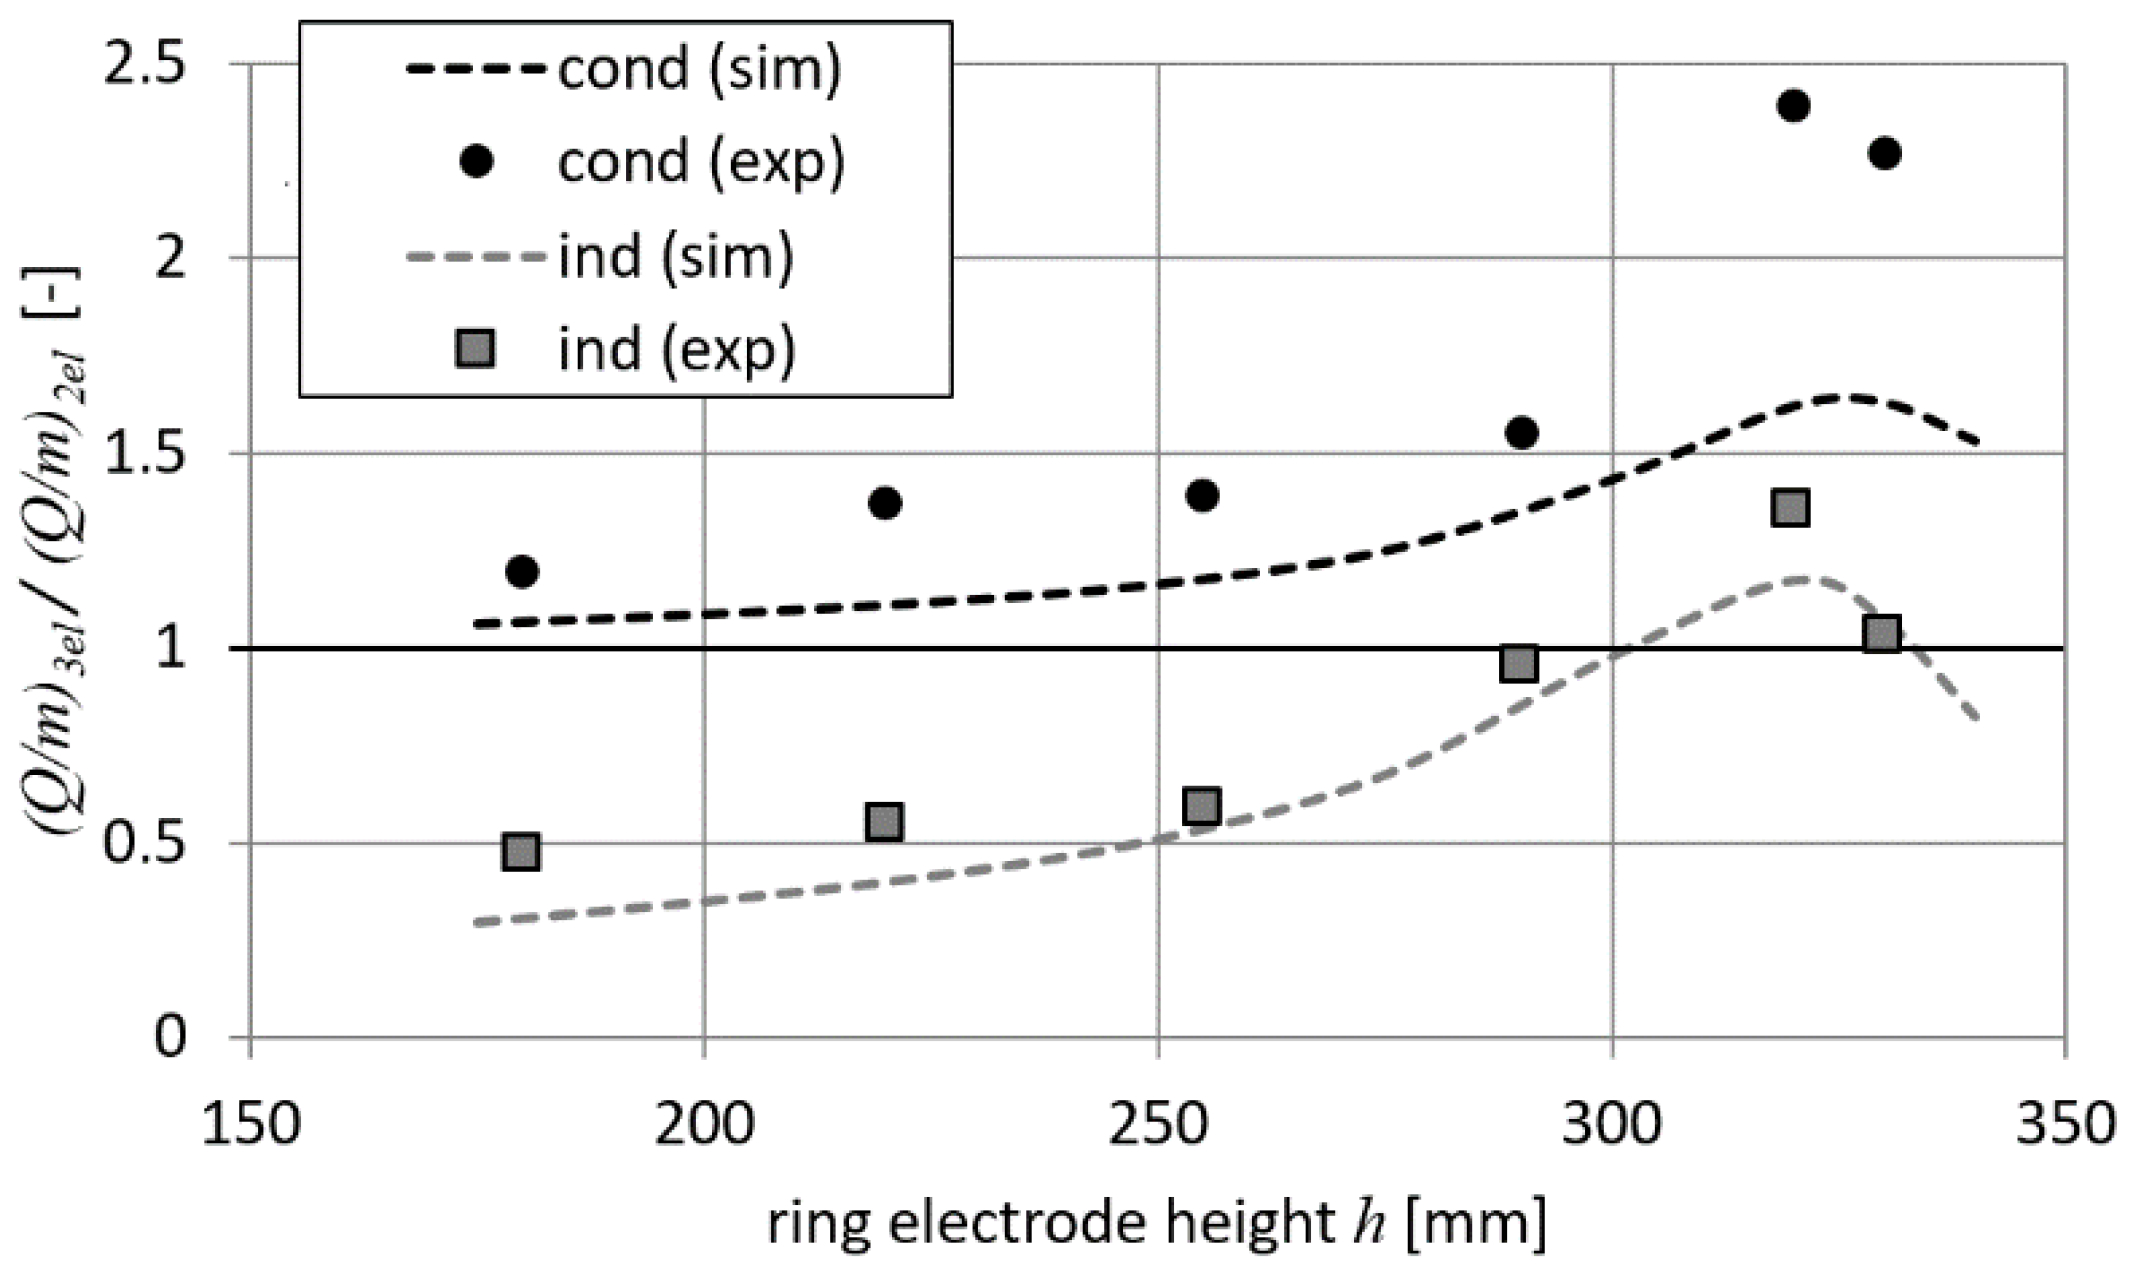
Figure 13 shows the measured and calculated (
Q/
m)
3el parameter values for conduction and induction methods in the 3-electrode system divided by the (
Q/
m)
2el parameter values obtained in 2-electrode systems (i.e., measured and calculated for corresponding cases).
It can be seen from
Figure 13 that the differences between simulation and experimental results are clearly visible. This is the result of different values of (
Q/
m)
2el being obtained from measurements and calculations (15.6 µC/kg and 20.4 µC/kg, respectively). It is also clear that for most of the tested ring electrode positions, the induction method in a 3-electrode system is less efficient than a 2-electrode charging system (i.e., relative values of
Q/
m are lower than 1, as shown in
Figure 13). Only for the case in which a ring electrode is close to the droplet is the induction method better than a 2-electrode system in terms of charging efficiency. On the other hand, the conduction method in a 3-electrode system is always more effective than a 2-electrode charging system (i.e., relative values of
Q/
m parameter are greater than 1, as presented in
Figure 13). The obtained results are consistent with those shown in
Figure 8. It should be noted that according to the simulation data, in a 3-electrode system the
Q/
m parameter should be less dependent on the ring electrode position in the case of conduction method than in the system with the induction method. However, the results of the measurements show that
Q/
m greatly increases in the case of the conduction method when the ring electrode is close to the droplet.
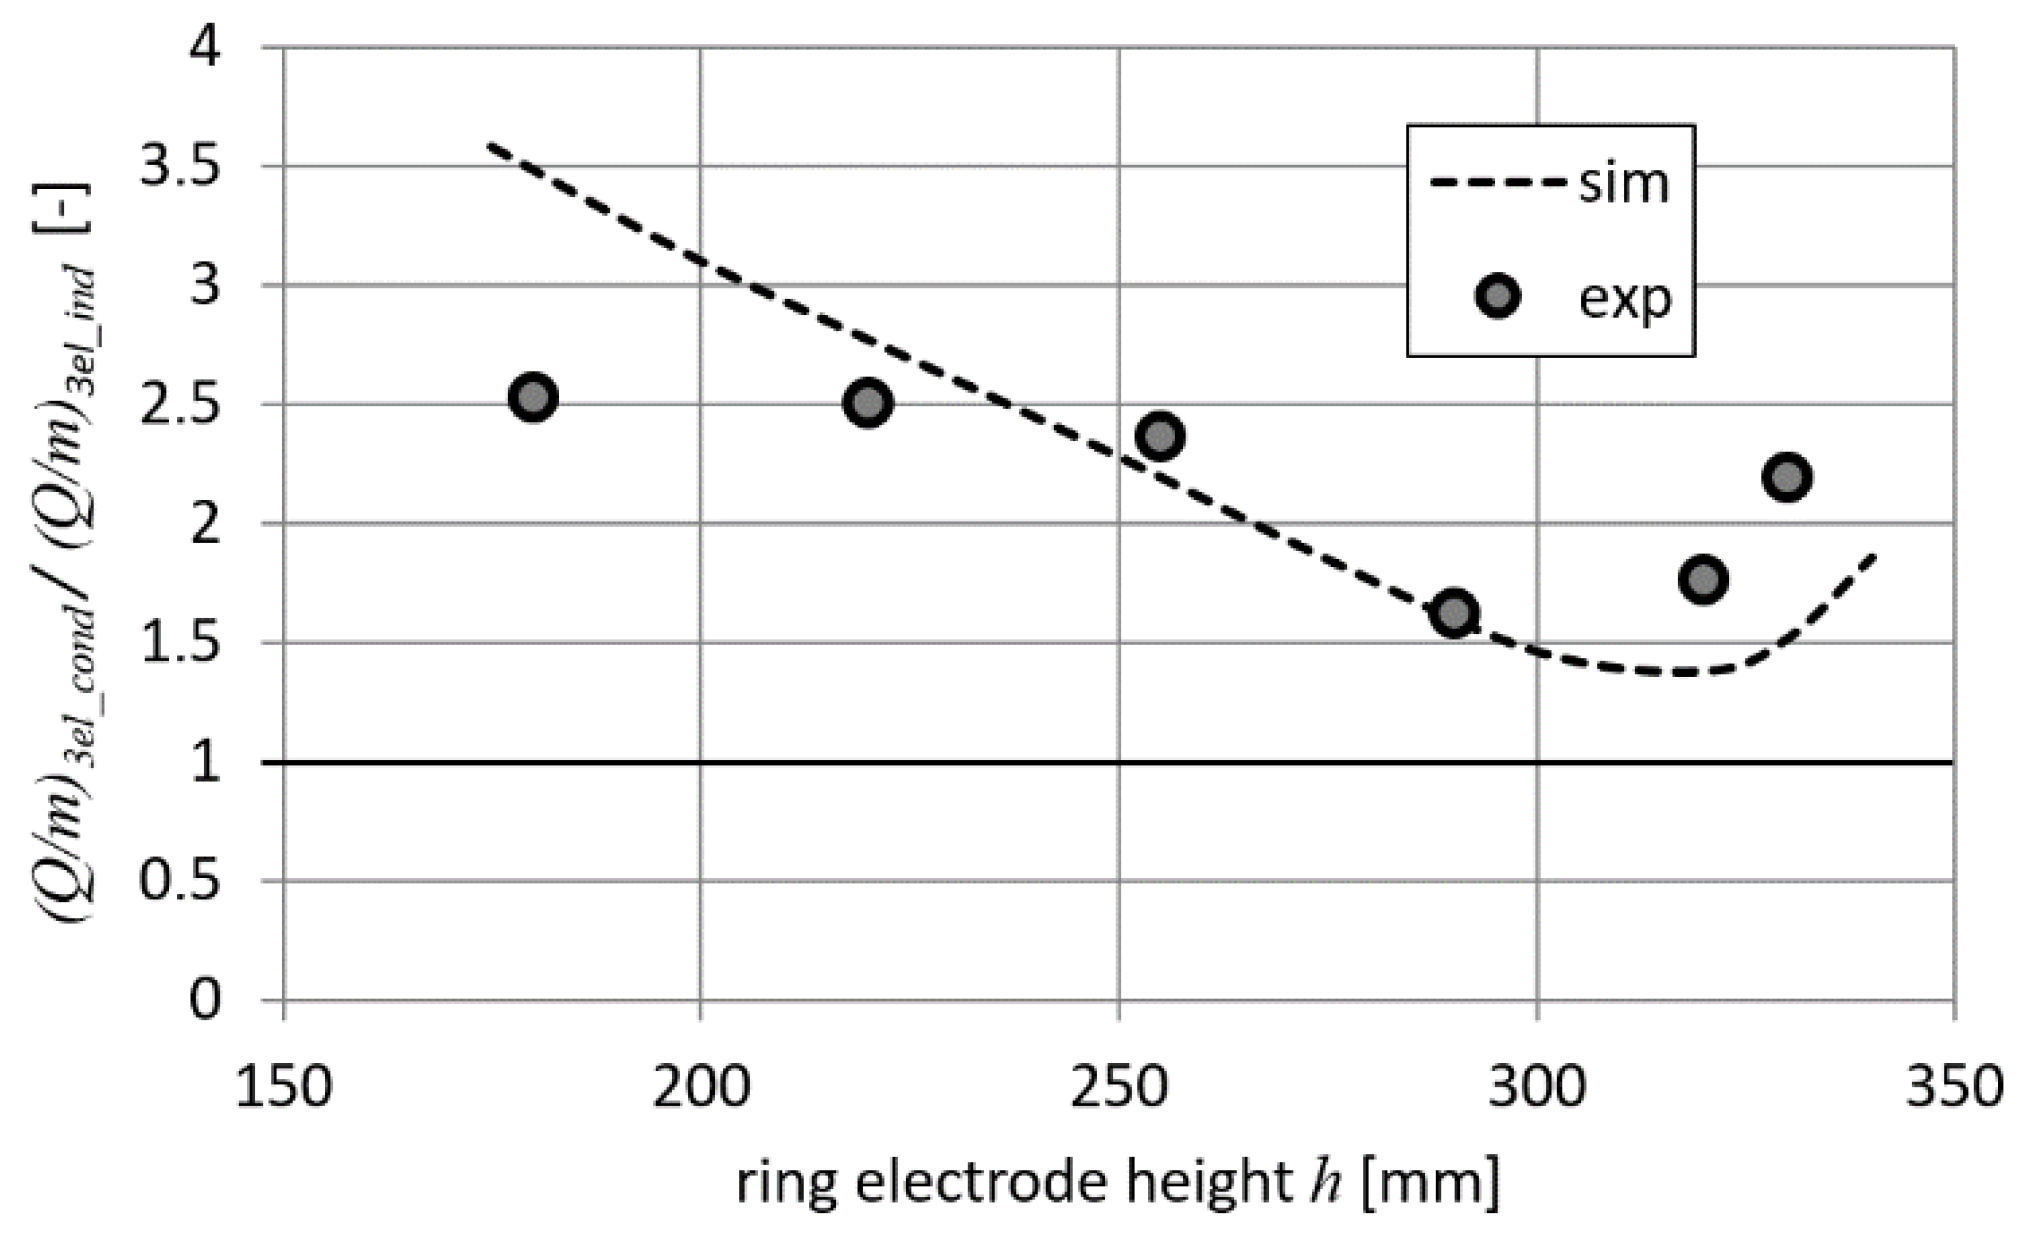
Ratios of
Q/
m parameters for both charging methods are presented in
Figure 14. It can be noticed in
Figure 14 that the conduction method is always more effective than the induction method (i.e., 1.5–2.5 times greater
Q/
m parameter values are obtained). The results of the numerical simulation and measurements are consistent with each other. A noticeable difference for cases when the ring electrode is far from the droplet may be due to the external factors (i.e., the appearance of additional coupling capacitances).
5. Discussion and Conclusions
The proposed simplified model based on the capacitance distribution in different electrification systems can be used to study the process of electrification of liquid droplets. For a 2-electrode system, only the capacitance between the nozzle and the target is responsible for the charging level of the droplets. In the 3-electrode systems, the capacitance distribution is more complex. In the case of the induction method, the value of the charge induced on the droplet depends only on the capacitance between the droplet and the ring electrode. When the conduction method is considered, the capacitance between the droplet and the target has an additional influence on the charging level. The total capacitance responsible for inducing charge on the droplet is the highest in the latter case, making the 3-electrode system with the conduction method the most efficient from the point of view of charging level, assuming that the same voltage is applied in all systems.
Based on the model, it is possible to determine the Q/m parameter describing the efficiency of the electrification systems. It can be noticed that in a 3-electrode system, the conduction charging method can give significantly higher Q/m values than in the induction method, especially when the grounded target is close to the nozzle, which greatly affects the electric field near the droplet. Similar findings were established during experiments. A significant coherence of simulation and measurement results confirms the validity of the proposed model, which can be helpful when designing a real-life charging system (i.e., setting the distance between the ring electrode and the nozzle).
It has also been proven that for a specific electrode configuration using the induction method, the 2-electrode system is more effective than the 3-electrode setup, and in this case, the measured values of the Q/m parameter were even smaller than for the 3-electrode system.
Future studies will focus on developing a model that considers the dynamic processes occurring during droplet electrification, including the screening effect and deformation of droplets.


