Abstract
The objective of this paper is to investigate CO2 emissions in the production of coal sources at the prefecture level and to analyze their spatial distribution and regional differences based on the spatial autocorrelation and standard deviational ellipse analysis. The results indicate that Chinese coal production from 2018 will most likely generate 485.23 million tons of CO2 emissions, and there still exists an obvious gap between the five coal development districts in terms of their CO2 emissions. A significant clustering pattern and positive spatial autocorrelation are revealed in the coal production-based carbon emissions in China. In addition, the spatial pattern of coal production-based CO2 emissions has an obvious central tendency and directional trend, and the ellipse direction is quite consistent with the Aihui–Tengchong Line. Our findings suggest that energy policy-makers should be concerned about the carbon emission effect when implementing regional coal development plans and actively guide the formation of a low-carbon spatial strategic pattern of coal production with a directional distribution of CO2 emissions perpendicular to the Aihui–Tengchong Line.
1. Introduction
China is committed to fighting climate change by cutting carbon emissions under the Paris Agreement [1]. To fulfill the commitments in the most effective way, policy-makers seek to characterize the sources of CO2 in as much detail as possible and to assess the potential for emission reductions related to different policy approaches [2,3]. Taking the energy department as an example, fossil fuels, in particular. have long been identified as having an important role in the department’s efforts to reduce CO2 emissions since the demand for energy is directly affected by the mitigation of climate change [4]. The exploitation and utilization of renewable energy is an inevitable choice for solving energy and environmental issues because of the gradual exhaustion of fossil fuels and serious environmental pollution [5]. Therefore, in recent years, China has vigorously promoted the research of clean energy [6]. However, non-fossil fuels, still make up a relatively low share of China’s primary energy consumption due to energy efficiency and economic problems. For instance, coal remains China’s top source for electricity and will continue to rise in the short term, despite the fact that many industries are slowly phasing out coal in favor of other fossil fuels, such as natural gas [7,8]. The IEA (International Energy Agency) report deduced that in the year 2022, coal consumption will still account for approximately 55% of China’s energy resource consumption [9].
Coal is considered the most polluting source of energy, which contributes a great deal to greenhouse gas emissions and air pollution at various stages of its procurement from mining, transportation, stockpiling, preparation, and utilization [10]. Generally, carbon emissions from coal utilization are a major focus of the coal industry, whereas coal production-based CO2 emissions at the front of the coal industry chain are often ignored [11]. However, the key to saving energy and reducing carbon emissions for coal industry operations is to control the source discharge and reduce the abnormal pollutants. For a long time, mining conditions and the technological level of Chinese coal production have lagged behind other countries; moreover, most coal resources are distributed in economically underdeveloped areas, and obsolete equipment, low productivity and complex geological conditions, cause an enormous waste of energy at the coal production stage in China, such as coal and power [12]. The estimation of coal production-based CO2 emissions is essential and imperative for China to provide guiding significance to achieve sustainable coal resource utilization [13].
In addition, coal resources in China have a skewed distribution: it appears on a diminishing scale from west to the east and from north to the south [14]. The differences in geographic location, production techniques, ecological regimes, and level of economic development are likely to cause differences in energy consumption and carbon emission levels. For example, the coal resources in Northeast China are characterized by poor reserves after the longstanding high-intensity exploitation, and deep mining has been an important means for the coal mining enterprises in the region to increase production, but invisibly adding to the energy costs. Coincidentally, the coal enterprises of North China similarly consume vast quantities of energy for mining-disaster prevention [12]. Many people subscribe to the green mining theory of coal resources, but the recent studies have raised concerns about the emissions from coal development upstream of the coal industry chain. Luo et al. developed a conceptual methodology for the estimation of carbon emissions in the four processes of coal mining (i.e., selection, washing, transportation, and consumption) to understand the carbon emissions in the coal supply chains of a mining city [15]. Wang et al. targeted the accounting of carbon emissions in the production of raw coal sources using a source-driven CO2 emissions accounting model [11]. Pandey et al. quantified and provided a comprehensive overview of the climate change impacts of coal production based on a comprehensive GHG inventory assessment of coal mines encompassing all relevant product life cycle stages [10]. Previous studies have contributed greatly to understanding the impact of coal production activities on GHG emissions and identifying key GHG intensity hotspots across product life cycle stages. However, there is still a lack of published research on the spatial estimation of coal production-based CO2 emissions in China, particularly for city-level coal mining.
Thus, using 4383 productive coal mines of China from 2018 as examples, this study aims to quantify the amount of CO2 emissions in the production of coal sources at the prefecture level based on a high spatial resolution mine site dataset and to analyze their spatial characterization and regional differences. First, CO2 emissions in the production of coal sources were estimated, and the regional differences were explored based on five coal development districts in China (defined as Xin-Qing District (XQ), North-East District (NE), East China District (EC), South China District (SC) and Jin-Shan-Meng-Ning-Gan District (JMG)). Second, the spatial autocorrelation and standard deviational ellipse were used to analyze the spatial characteristics of CO2 emissions in Chinese coal cities. This study is expected to provide valuable references for policy-makers in China to formulate the region-specific energy policies for reducing carbon emissions.
2. Materials and Methods
2.1. Data Collection
In this study, the data from 4383 productive coal mines of China in 2018 were obtained from the National Energy Administration of China (NEAC), including 3373 operational coal mines and 1010 ones under construction [16]. The dataset includes information on annual production and geographic location, and we integrate this information with information on the cities in which the coal mines are located. All the coal mines are distributed sporadically across 197 Chinese cities, and the cities in this study are defined as prefecture-level administrative units (including both built-up cities and administrative areas). Generally, China is divided into five coal development districts according to the resource endowment [17]: XQ, NE, EC, SC, and JMG. Thus, to meet the strategic layout and strategic countermeasure of coal resource exploitation, the regional differences and spatial characteristics of coal production-based CO2 emissions were carried out by a comparative study of the five districts.
2.2. Methods
2.2.1. Estimation of Coal Production-Based CO2 Emissions for Mining Cities
Coalbed carbon leaks, energy consumption and motive power for machines are the main sources of coal-based carbon emissions [11]. Since this study mainly focuses on anthropogenic sources, coal mine gas emissions are excluded from the accounting boundary for carbon emissions from the coal development sector. Hence, in this study, the accounting boundary for carbon emissions covers coal mining, selection and washing, and coal production-based CO2 emissions mainly include emissions caused by energy consumption and electricity consumption, which drives equipment operations.
The emission factor method is a common way to calculate carbon emissions; it estimates the carbon emissions by setting the emissions factor (EF) of each fuel and multiplying it by the fuel consumption. In general, the two most widely used approaches can be divided into two types of accounting systems: the top-down approach and bottom-up approach. The top-down approach tends to focus more on the economy as a whole and describes substitution across different inputs on the basis of historically calibrated factors [18]. The 2006 Guidelines for National Greenhouse Gas Inventories published by the Intergovernmental Panel on Climate Change (IPCC) is the most typical case, which measured carbon emission sources through layer-by-layer classification to measure the final carbon emissions [19,20]. By contrast, the bottom-up approach looks at enterprise products or project carbon emissions, but there are some objective limitations in accounting for regional and sectoral carbon emissions [11,21]. In this study, the provincial level coal production-based CO2 emissions were first estimated by setting the EF of each fuel and multiplying it by the fuel consumption at different production stages, and then the carbon emission per unit of coal production was calculated by dividing the provincial level coal production-based CO2 emissions by the coal production of the corresponding province. Finally, the carbon emissions at the prefecture-level scales can be estimated by multiplying the annual production by the carbon emission per unit of coal production (Equations (1) and (2)). Therefore, the top-down approach was adopted here to account for coal production-based CO2 emissions.
where , which is calculated by multiplying the city-level coal production () by the carbon emission per unit of coal production, represents the carbon emissions at the prefecture level; the carbon emission per unit of coal production is calculated by dividing the provincial level coal production-based CO2 emissions () by the coal production of the corresponding province (); , which is calculated by the sum of the CO2 emissions caused by fuel consumption at different coal production stages in the province, represents the coal production-based CO2 emissions at the provincial level; the CO2 emissions caused by fuel consumption at different coal production stages are calculated by multiplying the emissions factor (EF) of each fuel by the corresponding fuel consumption; represents the coal production of the province; represents the city-level coal production (as shown in Figure 1); is the emissions factor of fuel , and represents the consumption of fuel . We extracted the coal production data at the provincial level () from the China Energy Statistics Yearbook 2016 [22] to match the dataset of the emission inventories and emission factors, and the emission inventories and emission factors for the coal mining and selection and washing sector referred to in the China Emission Accounts and Datasets (CEADs) [23,24]. The above calculative processes were operated in Microsoft Excel and then converted to the vector layers in ArcGIS 10.2 (a geographic information system for working with maps and geographic information maintained by Esri).
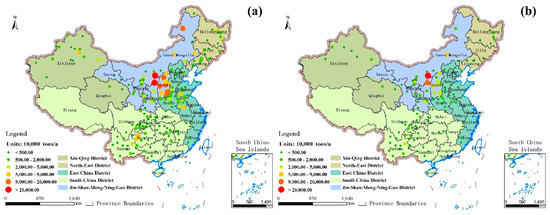
Figure 1.
The distribution of total coal production in Chinese 197 cities, including 3373 operated coal mines (a) and 1010 ones under construction (b).
2.2.2. Nearest-Neighbor Index
The nearest-neighbor index (Equations (3) and (4)) is calculated to analyze the spatial characteristics of point features based on the average distance from each feature to its nearest neighboring feature [25]. Thus, it is designed to explore the spatial pattern of coal production-based CO2 emissions at the prefecture level before the application of the spatial autocorrelation analysis.
where represents the actual nearest-neighbor distance and is the theoretical nearest-neighbor distance; represents the total area, and is the total number of spatial elements. When is greater than 1, the trend is toward dispersion or competition; when is less than 1, the pattern exhibits clustering.
2.2.3. Spatial Autocorrelation Analysis
Numerous geographical phenomena are spatially autocorrelated, that is, influenced by spatial interactions and expansion. The spatial autocorrelation is a spatial statistic used to measure the interdependence of geographic data based on the theory of the continuity of spatial processes in their geographical distributions [26]; this statistic can be divided into a global and local index. The global spatial autocorrelation describes the holistic distribution characteristics of a geographical phenomenon and assesses the agglomeration of it in space [27], whereas the local spatial autocorrelation explores the distribution of individual element attribute values in a heterogeneous space and can measure the degree of local spatial correlation between each area and its surrounding areas [28]. Global Moran’s I, described as in Equation (5), is an important parameter to measure the global spatial autocorrelation. Global Moran’s I can better assess the agglomeration of geographical phenomenon in space and is very widely used in many fields such as resource science, environmental science, social science, and so on. Thus, it is applied in this study to investigate the spatial characteristics of coal production-based CO2 emissions at the prefecture level.
where represents Global Moran’s I, is the total number of study areas, and and are the values of an attribute feature, , at regions and . is an element of the spatial weight matrix, , used to express the relationship of neighboring spatial regions at positions, and is the average of all the observations for an attribute feature, , in study areas. Global Moran’s I varies from −1 to 1; the closer that the value is to −1 or 1, the more obvious the spatial characteristics. Moran’s I values greater than 0 indicate a positive spatial correlation, and values less than 0 indicate a negative spatial correlation.
2.2.4. Standard Deviational Ellipse
A standard deviational ellipse is used to summarize the spatial characteristics of geographic features: the central tendency, dispersion, and directional trends [29]. The size of the ellipse can reflect the centralized degree of the spatial element, and the semimajor axis represents the main direction of the spatial pattern. The standard deviational ellipse reveals the spatial characteristics of geographic features not only from the perspective of the gravity center but also from the areal extent, directions and shapes that can be applied, well and quickly, to explore the spatial characteristics of climate and environmental effects [30,31].
where and represent the lengths of the and axes, respectively; and are the coordinates of ; is the mean center of the spatial elements, and is the total number of spatial elements.
In this study, the nearest-neighbor index, spatial autocorrelation analysis and standard deviational ellipse were carried out in ArcGIS 10.2.
3. Results and Discussion
3.1. Coal Production-Based CO2 Emissions for Mining Cities
Figure 2 shows the coal production-based CO2 emissions in China in 2018. Coal production-based CO2 emissions of EC, SC, JMG, NE, and XQ are 256.37 million tons, 123.06 million tons, 74.79 million tons, 26.61 million tons, and 4.40 million tons, respectively, which are profoundly mismatched with production capacities of 545.65 million tons, 336.07 million tons, 2414.98 million tons, 163.06 million tons, and 180.00 million tons, respectively. EC is mostly distributed in flat area of China, it is the grain and industrial bases, and it has experienced rapid industrialization and urbanization in recent decades [32]. The enormous energy needs required for economic growth have prompted large-scale coal mining, and the shallow coalbed of EC is already nearly used up. Some large-scale mining areas in Shandong, Jiangsu, Henan, Anhui, and Hebei Provinces have had a longstanding presence in deep mining (deeper than 800 m), which causes substantial energy consumption, immensely increasing the CO2 emission. In addition, most coal mines in EC (i.e., in Shandong, Henan, Anhui, and Hebei Provinces) suffer from complicated geological conditions, which will cause disasters or accidents involving mine water inrushing [33], gas explosions [34], and rock bursts [35]. The frequent accidents reduce the production and energy utilization efficiency to a great extent, adding considerably to the carbon emissions. Similar to the situation in EC, NE is characterized by poor reserves after the longstanding high-intensive exploitation for meeting heavy industrial needs, and the implementation of deeper mining is likely to run into issues involving mine water inrushing, gas explosions, and rock bursts, increasing the energy consumption. The second-largest carbon emitter is SC, with the most coal mines distributed in eastern Sichuan Province, Guizhou Province, and eastern Yunnan Province. Such regions are limited not only by the poor condition of occurrence but also by the small production scale, and most coal mines cannot achieve large-scale mining, which may be the cause of high emissions. JMG, characterized by coal resources, serves as an important base for coal and electricity in China. Fine mining conditions and excellent resource endowment contribute greatly to adopting the advanced production process to carry out high-tech, green mining activities, which greatly increase production efficiency and significantly reduce carbon emissions [36]. XQ, a similar version of JMG, features good geological conditions and fine coal seam occurrences, and the coal field is thick and steady. Its coal mines are located mainly in Junggar Basin, western Tianshan, and the northern margin of the Tarim Basin, and large open pit mines are the majority, which provide favorable conditions for high-efficiency, green, and safe exploitation to reduce carbon emissions [37].
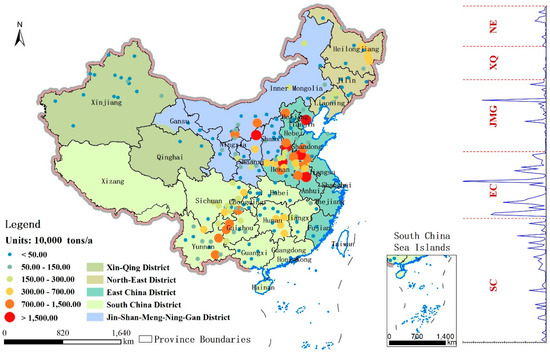
Figure 2.
Coal production-based CO2 emissions in China in 2018. Note: The vertical axis of the line chart represents the prefecture-level cities, and the horizontal axis represents the CO2 emissions.
3.2. Analysis of the Spatial Characteristics of Coal Production-Based CO2 Emissions for Mining Cities
The nearest-neighbor R value for carbon emission data is 0.74 (Z < −1.96, p = 0.0001), which indicates a significant clustering pattern of coal production-based CO2 emissions. Global Moran’s I for carbon emissions from the spatial autocorrelation analysis is 0.14 (Z > 1.96, p < 0.0001), indicating a significant positive spatial autocorrelation in carbon emissions. To further understand the spatial characteristics of the carbon emission data—i.e., the central tendency, dispersion, and directional trends—a standard deviational ellipse analysis is carried out.
Figure 3 shows the results of the standard deviational ellipse analysis for coal production-based CO2 emissions. The Aihui–Tengchong Line (also called the Heihe–Tengchong Line or Hu Line, the blue line in Figure 3) is a traditional geographical boundary that divides China into two roughly equal parts, and it clearly delineates differences in the patterns of socioeconomic development, population distribution and climate [38]. In the eastern region denoted by the line, the level of urbanization and industrialization have both been higher than those in the western areas for a long time due to the different natural geographical environments, although there has been a small amount of development in the eastern regions of western China, such as in Gansu, Ningxia, and Qinghai Provinces [39]. From the geographical pattern, coal production-based CO2 emissions mainly occur east of the Aihui–Tengchong Line, even though their coal production is less than half of the national total. A straightforward and inefficient production scheme has greatly affected emissions in the eastern region. Based on the analysis of the standard deviational ellipse, the spatial pattern of coal production-based CO2 emissions has an obvious central tendency and directional trend with a ratio of approximately 2.10 between the major and minor axes of the ellipse. In addition, the analysis shows that the ellipse direction is rather consistent with the Aihui–Tengchong Line, which indicates that carbon emissions from coal production are influenced by both the resource endowment and the pattern of socioeconomic development. Paying more attention to energy demands for socioeconomic development determines the carbon emission pattern to some extent. Table 1 shows the ratio between the major and minor axes for the five districts based on standard deviational ellipses. From the view of the regional pattern of JMG, the ellipse direction is rather consistent with the Aihui–Tengchong Line, and the direction is also relatively obvious, indicating that the spatial pattern of the population and city’s development, to a great extent, affects coal production-based CO2 emissions. XQ, with the largest ratio of the five districts, shows a strong directional trend with the Lanxin railway [40]. It is also noted from Table 1 that NC and SC appear to have a weak directional trend, which might be due to a relatively similar level of socioeconomic development in their regions, indicated that the spatial pattern depends more on resource endowment.
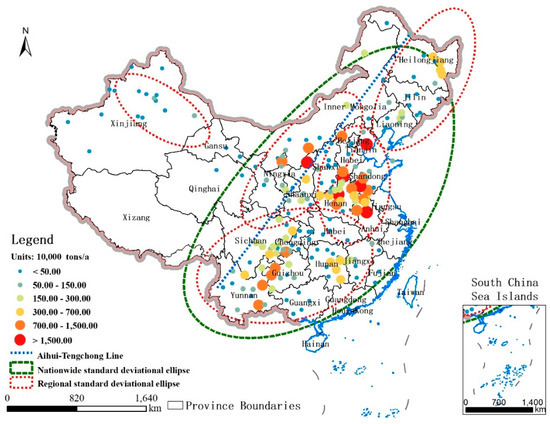
Figure 3.
Spatial characteristics of the coal production-based CO2 emissions of 2018 in China based on standard deviational ellipse.

Table 1.
Ratio between the major and minor axes for the five districts.
3.3. Research Limitations and Policy Implications
Figure 4 shows that coal production-based CO2 emissions might be caused by coal mines under construction. As noted in the figure, new mines would primarily further increase the CO2 emissions in southeast JMG (mainly in Shaanxi Province and Inner Mongolia Autonomous Region), western NC (mainly in Hebei and Henan Provinces), and central SC (mainly in Yunnan and Guizhou Provinces). Based on the above analysis, it is suggested that the cities of SC should strengthen resource integration and enhance mechanized and intelligent mining to improve energy efficiency for carbon emission reduction. To reduce their emissions, the cities in EC and NE should first reduce their production capacity and then actively accept coal resources from the neighboring region of JMG due to the limitations of resource endowment and geological conditions. For the cities in JMG and XQ, policy-makers should develop regional and comparative plans to consider infrastructure construction to guarantee coal resource exportation. In the future, the low-carbon spatial strategic pattern for coal production should be encouraged by policy-makers to be perpendicular to the Aihui–Tengchong Line.
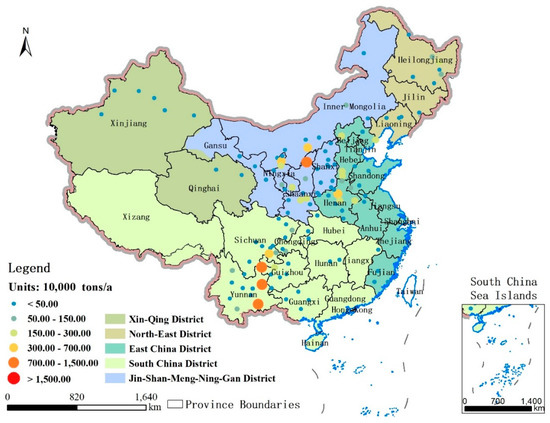
Figure 4.
Coal production-based CO2 emissions at Chinese prefecture-level cities caused by the coal mines under construction.
This study attempts to quantify CO2 emissions from the production of coal sources at the prefecture level and to analyze their spatial characteristics and regional differences. However, the driving mechanism for the spatial patterns and regional differences cannot be provided quantitatively. Therefore, more studies that focus on the relationship between socioeconomic factors and geographic elements and reducing carbon emissions in coal production are needed if relevant and detailed data can be obtained. Another limitation has to do with the availability of data. Only the coal production data at the provincial level, the emission inventories and the emission factors for the coal mining and selection and washing sector in 2015 were obtained for this study. If up-to-date, reliable data are available, future work will improve.
4. Conclusions
This article quantifies the CO2 emissions in the production of coal sources at the prefecture level based on a high spatial resolution mine site dataset and analyzes their spatial characteristics and regional differences based on the spatial autocorrelation and standard deviational ellipse analysis. The main conclusions are as follows:
Chinese coal production in 2018 will most likely generate 485.23 million tons of CO2 emissions, and EC, SC, JMG, NE, and XQ, which are the five coal development districts of China, will generate 256.37 million tons, 123.06 million tons, 74.79 million tons, 26.61 million tons, and 4.40 million tons, respectively. There still exists an obvious gap between the five coal development districts in terms of their CO2 emissions due to differences in resource endowment, technological levels, and geological conditions. Based on the spatial analysis, it is concluded that a significant clustering pattern and positive spatial autocorrelation are present in the coal production-based carbon emissions in China. In addition, the spatial pattern of coal production-based CO2 emissions has an obvious central tendency and directional trend by the standard deviational ellipse analysis, and the ellipse direction is rather consistent with the Aihui–Tengchong Line, indicating that carbon effects by coal production are both influenced by resource endowment and the pattern of socioeconomic development.
Our findings suggest that energy policy-makers should be more concerned about the carbon emission effect when implementing regional coal development plans. For instance, cities in SC should strengthen resource integration and enhance mechanized and intelligent mining to improve energy efficiency for carbon emission reduction; cities in EC and NE should first reduce their production capacity and then actively accept coal resources from the neighboring region of JMG, while policy-makers in JMG and XQ should develop regional and comparative advantages to pay close attention to infrastructure construction to guarantee coal resource exportation. In general, a low-carbon spatial strategic pattern of coal production should be formed with a directional distribution of CO2 emissions perpendicular to the Aihui–Tengchong Line.
Coal cities are formed and supported by coal and are a large class of special and important cities consistent with China’s reform and opening-up policy. With growing concerns over anthropogenic climate change, a scientific understanding of carbon emission characteristics in coal supply chains at the prefecture level from an environmental perspective is urgent. This paper provides a preliminary finding on the estimation of carbon emissions and their spatial pattern in the process of coal production, which is especially significant for policy-makers when developing effective emission reduction policies. However, issues such as the driving factor of the spatial pattern and water consumption during coal production are still important concerns for future research.
Author Contributions
G.L. and J.F. contributed to all aspects of this work; J.F. and D.J. conducted data analysis; and G.L. and X.L. wrote the main manuscript text; D.D. gave some useful comments and suggestions to this work. All authors reviewed the manuscript. All authors have read and agreed to the published version of the manuscript.
Funding
This work was supported by Ministry of Science and Technology of China (grant no. 2016YFC0503507), National Natural Science Foundation of China (grant no. 41971250, U1710258, and 41972255), Youth Innovation Promotion Association (grant no. 2018068), Grant from State Key Laboratory of Resources and Environmental Information System and Grant from China University of Mining and Technology Beijing Campus (grant no. 00-800015Z1175) and Fundamental Research Funds for the Central Universities (grant no. 2019QD01).
Conflicts of Interest
The authors declare no conflict of interest.
References
- Hilton, I.; Kerr, O. The Paris agreement: China’s ‘New Normal’ role in international climate negotiations. Clim. Policy 2017, 17, 48–58. [Google Scholar] [CrossRef]
- Shan, Y.; Guan, D.; Hubacek, K.; Zheng, B.; Davis, S.J.; Jia, L.; Liu, J.; Liu, Z.; Fromer, N.; Mi, Z.; et al. City-level climate change mitigation in China. Sci. Adv. 2018, 4, eaaq0390. [Google Scholar] [CrossRef] [PubMed]
- Yang, Y.; Qu, S.; Wang, Z.; Xu, M. Sensitivity of sectoral CO2 emissions to demand and supply pattern changes in China. Sci. Total Environ. 2019, 682, 572–582. [Google Scholar] [CrossRef] [PubMed]
- Ou, Y.; Zhai, H.; Rubin, E.S. Life cycle water use of coal-and natural-gas-fired power plants with and without carbon capture and storage. Int. J. Greenh. Gas Control 2016, 44, 249–261. [Google Scholar] [CrossRef]
- Erdiwansyah; Mamat, R.; Sani, M.S.M.; Sudhakar, K. Renewable energy in Southeast Asia: Policies and recommendations. Sci. Total Environ. 2019, 670, 1095–1102. [Google Scholar] [CrossRef] [PubMed]
- Wang, Z.; Liu, M.; Guo, H. A strategic path for the goal of clean and low-carbon energy in China. Nat. Gas Ind. B 2016, 3, 305–311. [Google Scholar] [CrossRef]
- Lin, J.; Fridley, D.; Lu, H.; Price, L.; Zhou, N. Has coal use peaked in China: Near-term trends in China’s coal consumption. Energy Policy 2018, 123, 208–214. [Google Scholar] [CrossRef]
- Yan, Q.; Wang, Y.; Baležentis, T.; Streimikiene, D. Analysis of China’s regional thermal electricity generation and CO2 emissions: Decomposition based on the generalized Divisia index. Sci. Total Environ. 2019, 682, 737–755. [Google Scholar] [CrossRef]
- IEA. Coal Market Report 2017; IEA: Beijing, China, 2018. [Google Scholar]
- Pandey, B.; Gautam, M.; Agrawal, M. Greenhouse gas emissions from coal mining activities and their possible mitigation strategies. In Environmental Carbon Footprints; Elsevier: Amsterdam, The Netherlands, 2018; pp. 259–294. [Google Scholar]
- Wang, B.; Cui, C.-Q.; Zhao, Y.-X.; Yang, B.; Yang, Q.-Z. Carbon emissions accounting for China’s coal mining sector: Invisible sources of climate change. Nat. Hazards 2018, 1–20. [Google Scholar] [CrossRef]
- Quan, L. On the status of energy consumption and the development direction of energy saving technology in China’s coal mines (in Chinese with English Abstract). Energy Conserv. 2013, 12, 60–61. [Google Scholar]
- Liang, Y. Strategies of high efficiency recovery and energy saving for coal resources in China. J. China Univ. Min. Technol. (Soc. Sci.) 2018, 1, 1. [Google Scholar]
- JIehua, M.; Huilong, X. Present conditions and prospect of China’s coal distribution. Coal Geol. Explor. 1999, 27, 1–4, (In Chinese with English Abstract). [Google Scholar]
- Luo, G.; Zhang, J.; Rao, Y.; Zhu, X.; Guo, Y. Coal supply chains: A whole-process-based measurement of carbon emissions in a mining city of China. Energies 2017, 10, 1855. [Google Scholar] [CrossRef]
- NEA. Announcement on the Production and Construction of Coal Mine Capacity; NEA: Beijing, China, 2019. (In Chinese) [Google Scholar]
- Wang, J.H.; Kang, H.; Liu, J.; Chen, P.; Fan, Z.; Yuan, W.; Liu, Y. Layout strategic research of green coal resource development in China. J. China Univ. Min. Technol. 2018, 47, 15–20. (In Chinese) [Google Scholar]
- van Vuuren, D.P.; Hoogwijk, M.; Barker, T.; Riahi, K.; Boeters, S.; Chateau, J.; Scrieciu, S.; van Vliet, J.; Masui, T.; Blok, K.; et al. Comparison of top-down and bottom-up estimates of sectoral and regional greenhouse gas emission reduction potentials. Energy Policy 2009, 37, 5125–5139. [Google Scholar] [CrossRef]
- Wiik, M.K.; Fufa, S.M.; Kristjansdottir, T.; Andresen, I. Lessons learnt from embodied GHG emission calculations in zero emission buildings (ZEBs) from the Norwegian ZEB research centre. Energy Build. 2018, 165, 25–34. [Google Scholar] [CrossRef]
- Kalt, G.; Höher, M.; Lauk, C.; Schipfer, F.; Kranzl, L. Carbon accounting of material substitution with biomass: Case studies for Austria investigated with IPCC default and alternative approaches. Environ. Sci. Policy 2016, 64, 155–163. [Google Scholar] [CrossRef]
- Sόwka, I.; Bezyk, Y. Quantifying and reporting greenhouse gas emissions at local level. E3S Web Conf. 2017, 17, 00084. [Google Scholar] [CrossRef]
- NBS. China Energy Statistics Yearbook 2016; China Statistics Press: Beijing, China, 2016. (In Chinese) [Google Scholar]
- Shan, Y.; Guan, D.; Zheng, H.; Ou, J.; Li, Y.; Meng, J.; Mi, Z.; Liu, Z.; Zhang, Q. China CO2 emission accounts 1997–2015. Sci. Data 2018, 5, 170201. [Google Scholar] [CrossRef]
- Shan, Y.; Liu, J.; Liu, Z.; Xu, X.; Shao, S.; Wange, P.; Guan, D. New provincial CO2 emission inventories in China based on apparent energy consumption data and updated emission factors. Appl. Energy 2016, 184, 742–750. [Google Scholar] [CrossRef]
- Bansal, P.; Ardell, A.J. Average nearest-neighbor distances between uniformly distributed finite particles. Metallography 1972, 5, 97–111. [Google Scholar] [CrossRef]
- Miron, J. Spatial autocorrelation in regression analysis: A beginner’s guide. In Spatial Statistics and Models; Springer: Berlin, Germany, 1984; pp. 201–222. [Google Scholar]
- Moran, P.A.P. Notes on continuous stochastic phenomena. Biometrika 1950, 37, 17–23. [Google Scholar] [CrossRef] [PubMed]
- Anselin, L. Local indicators of spatial association—LISA. Geogr. Anal. 1995, 27, 93–115. [Google Scholar] [CrossRef]
- Lefever, D.W. Measuring geographic concentration by means of the standard deviational ellipse. Am. J. Sociol. 1926, 32, 88–94. [Google Scholar] [CrossRef]
- Chen, T.; Deng, S.; Li, M. Spatial patterns of satellite-retrieved PM2.5 and long-term exposure assessment of China from 1998 to 2016. Int. J. Environ. Res. Public Health 2018, 15, 2785. [Google Scholar] [CrossRef] [PubMed]
- Johnson, D.P.; Wilson, J.S. The socio-spatial dynamics of extreme urban heat events: The case of heat-related deaths in Philadelphia. Appl. Geogr. 2009, 29, 419–434. [Google Scholar] [CrossRef]
- Wang, Q.; Zeng, Y.-E.; Wu, B.-W. Exploring the relationship between urbanization, energy consumption, and CO2 emissions in different provinces of China. Renew. Sustain. Energy Rev. 2016, 54, 1563–1579. [Google Scholar] [CrossRef]
- Sun, W.; Zhou, W.; Jiao, J. Hydrogeological classification and water inrush accidents in China’s coal mines. Mine Water Environ. 2016, 35, 214–220. [Google Scholar] [CrossRef]
- Meng, X.; Liu, Q.; Luo, X.; Zhou, X. Risk assessment of the unsafe behaviours of humans in fatal gas explosion accidents in China’s underground coal mines. J. Clean. Prod. 2019, 210, 970–976. [Google Scholar] [CrossRef]
- Chen, X.; Li, W.; Yan, X. Analysis on rock burst danger when fully-mechanized caving coal face passed fault with deep mining. Saf. Sci. 2012, 50, 645–648. [Google Scholar] [CrossRef]
- Ruiyun, T. A review on safe, efficient and green mining technology of coal resources in Shendong mining area. Coal Eng. 2016, 48, 11–14, (In Chinese with English Abstract). [Google Scholar]
- Xu, L.; Yufu, L. Safe and efficient green mining practice of coal resources in Junggar open-pit mining area. Opencast Min. Technol. 2019, 34, 79–82, (In Chinese with English Abstract). [Google Scholar]
- Wang, G.; Pan, Z. The robustness of China’s migration and Heihe-Tengchong line. China Popul. Today 2016, 4, 39. [Google Scholar]
- Chen, M.; Li, Y.; Gong, Y.; Lu, D.; Zhang, H. The population distribution and trend of urbanization pattern on two sides of Hu Huanyong population line: A tentative response to Premier Li Keqiang. Acta Geogr. Sin. 2016, 71, 179–193. [Google Scholar]
- Yue, Y.; Cao, W.; Yao, Z.; Zhang, D.; Yu, H.; Ren, Y. Impact on accessibility and economic relation from Lan-Xin Railway in Northwest of China. Hum. Geogr. 2019, 34, 131–139. (In Chinese) [Google Scholar]


© 2020 by the authors. Licensee MDPI, Basel, Switzerland. This article is an open access article distributed under the terms and conditions of the Creative Commons Attribution (CC BY) license (http://creativecommons.org/licenses/by/4.0/).