Article

Experimental Investigation of Spontaneous Imbibition of Water into Hydrate Sediments Using Nuclear Magnetic Resonance Method

1
State Key Laboratory for Geomechanics and Deep Underground Engineering, China University of Mining and Technology (Beijing), Beijing 100083, China
2
State Key Laboratory of Petroleum Resources and Prospecting, China University of Petroleum, Beijing 102249, China
3
Institute of Geophysics and Geomatics, China University of Geosciences, Wuhan 430074, China
4
Guangzhou Marine Geological Survey, China Geological Survey, Guangzhou 510760, China
*
Author to whom correspondence should be addressed.
Energies 2020, 13(2), 445; https://doi.org/10.3390/en13020445
Submission received: 19 November 2019 / Revised: 2 January 2020 / Accepted: 13 January 2020 / Published: 16 January 2020
(This article belongs to the Special Issue Advances in Natural Gas Hydrates)

Abstract

:
Field observations show that less than one percent of dissociation water can be produced during gas hydrate production, resulting from spontaneous water imbibition into matrix pores. What’s more, the hydrate sediments are easily dispersed in water, and it is difficult to carry out spontaneous imbibition experiments. At present, there is little research work on the imbibition capacity of hydrate sediments. In this paper, a new method of water imbibition is proposed for hydrate sediments, and nuclear magnetic resonance (NMR) technique is used to monitor water migration. The results show that as the imbibition time increases, the water is gradually imbibed into matrix pores. Water imbibition can cause dramatic changes in pore structure, such as microfracture initiation, fracture network generation and skeleton dispersion. When the imbibition time exceeds a critical value, many secondary pores (new large pores and micro-fractures) start to appear. When imbibition time exceeds the dispersion time, fracture networks are generated, eventually leading to dispersion of the sediment skeleton. The imbibition curves of hydrate sediments can be divided into two linear stages, which corresponds, respectively, to water imbibition of primary pores and secondary pores. The imbibition rate of secondary pores is significantly larger than that of primary pores, indicating that the generation of new fractures can greatly accelerate the imbibition rate. Research on the characteristics of water imbibition in hydrate sediments is important for optimizing hydrate production regime and increasing natural gas production.

1. Introduction

By depressurization method, gas hydrate of 1 m3 causes decomposition and releases natural gas of 164 m3 and water of 0.8 m3 [1,2]. According to Omelchenko and Makogon [3], gas hydrate dissociation results in the formation of 45 × 106 m3 water at the Messoyakha field. However, 48 × 103 m3 water is extracted from hydrate sediments. In other words, less than one percent of dissociation water can be produced during gas hydrate production [4,5]. Most of the dissociation water remains in the matrix pores of hydrate sediments. The retention of dissociation water has significant effects on two-phase flow of water and natural gas [6]. The dissociation water is absorbed by clay minerals, causing water sensitivity damage. The increase of water saturation decreases the relative permeability of gas, resulting in the low production of gas. The water and gas retained in the sediment form a higher-pressure system to hinder hydrate depressurization at the bottom of the well, thereby inhibiting the continuous dissociation and exploitation of gas hydrates [7]. Research on the retention of dissociation water contributes to understanding the damage mechanism of hydrate sediments and optimizing production regimes.
The capillary effects of hydrate-bearing sediments have been explored by many scholars. The capillary diameter is about 80–450 nm, which is determined by cold-stage electron microscopy [8]. The strong capillary effects should be considered during the numerical simulations of hydrate formation and dissociation [9]. The formation/dissociation experiments of hydrate were conducted in a sub-millimeter sized capillary. The phase equilibria conditions of gas hydrate are significantly influenced by memory effect, capillary effect, and subcooling degree [10]. The gas hydrate tends to occur at the water–methane interface, and the dissolution of methane in water is significant for hydrate nucleation [11]. Considering capillary effects in hydrate-bearing sediments, the permeability decreases with hydrate saturation, which can be explained by pore-channel blocking and pore size reduction [12,13].
In gas shale, the fracturing fluid imbibition into matrix pores can result in retention and low flowback efficiency of fracturing fluids [14]. Similarly, water imbibition may be the crucial mechanism for the retention of dissociation water in hydrate-bearing sediments. At present, there is less research on the spontaneous imbibition of hydrate sediments. Therefore, hydrate sediments imbibition can be studied by previous experiences of shale reservoirs imbibition. Water imbibition of hydrate sediments refers to the process that water enters matrix pores to expel natural gas under capillary pressure and clay osmotic pressure [15]. The influencing factors of hydrate sediments imbibition may involve porosity, permeability, initial water saturation, surface tension, wetting angle, clay minerals, etc. The imbibition characteristics are related to pore size distribution and pore connectivity [16]. The dynamic distribution of imbibed water can be monitored by T2 spectra of nuclear magnetic resonance (NMR) [15].
A large amount of studies were carried out on the mechanical strength, pore pressure, and formation stability during hydrate dissociation process [17,18,19,20]. However, there is less research on the water imbibition capacity of hydrate-bearing sediments for now. In this paper, spontaneous imbibition experiments were carried out using different hydrate sediment samples, and the dynamic distribution of water was monitored by NMR to analyze the imbibition properties and characteristic parameters of hydrate sediments.

2. Experimental Equipment and Samples

2.1. Experimental Samples

These samples were selected from clay hydrate sediments and used for comparative studies. The physical property, mineral composition, and pore structure are presented in Table 1. The sample pictures of hydrate sediment are shown in Figure 1. The size information of samples has been marked. The porosity is about 21.5~35.4%, and the permeability is about 0.3~7.8 mD. It exhibits high porosity and low permeability characteristics. The porosity and permeability of ZN are about 28.5% and 5.1 mD, and that of LK are about 32.5% and 2.7 mD, respectively. The porosities of two formations are nearly equal. The ZN sediment has the larger permeability.
Table 2 shows mineral composition of formation. They are mainly composed of quartz and clay minerals. The quartz content is 36.0~47.9% and the clay mineral content is 26.1~30.3%. The clay minerals’ content of two formations is nearly equal. In addition, the clay type involves illite, illite/smectite mixed-layer, chlorite, and kaolinite. The illite and illite/smectite mixed-layer are the main clay minerals. Therefore, hydrates sediments present strong water sensitivity.

2.2. Experimental Equipment and Procedures

In this experiment, a NMR instrument was used to carry out experimental research. The NMR instrument can obtain the water distribution in the porous medium, which is a non-destructive test method. The relationship between the relaxation time and pore size can be expressed as:
T 2 = ρ r
where ρ is surface relaxivity r is pore radius, and T2 is relaxation time. The T2 spectra can represent the pore size distribution. In addition, the deionized water is used as experimental fluid to conduct imbibition experiments.
The experimental procedures are as follows:
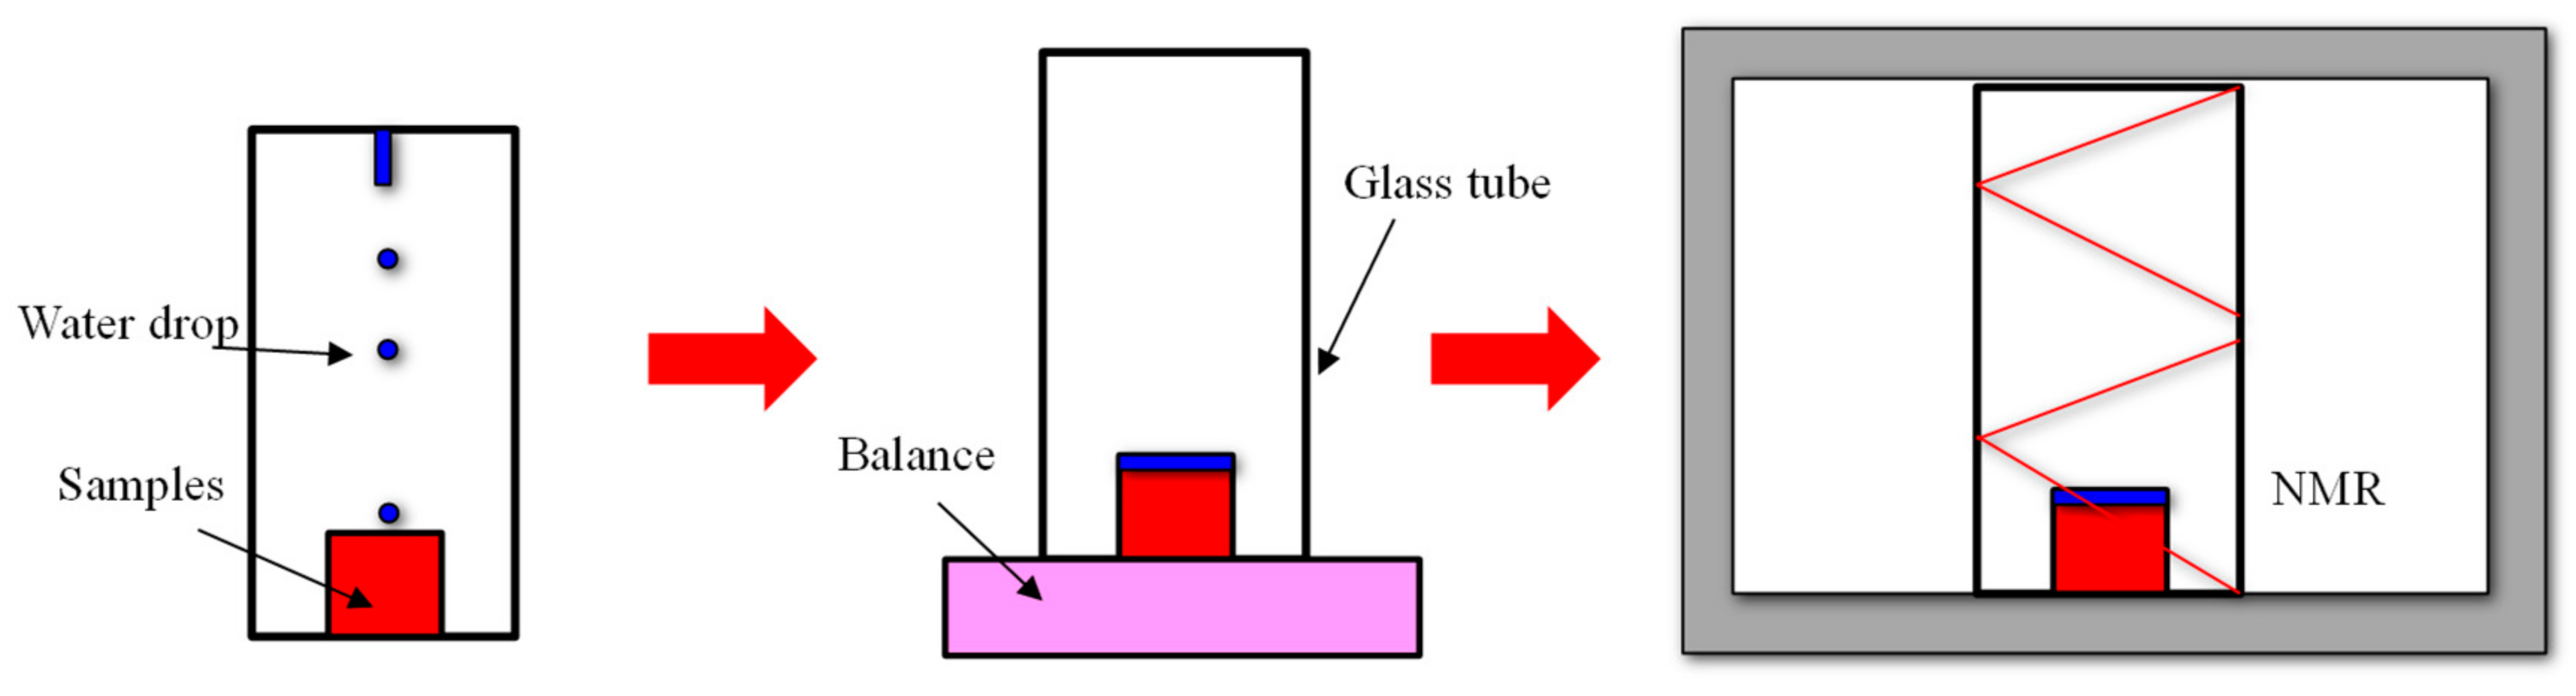
  • Cut six samples into rectangular cuboids of certain shape. Then, it is dried in a drying oven at 75 °C for 24 h until the mass no longer changed. After the samples are taken out, the plastic wrap is kept in a cool place to cool to room temperature.
  • Measure the sample size, place the samples in the glass tube, and determine the mass of samples and glass tube.
  • Drop the water to the sample surface using a long dropper. When the water droplets are completely imbibed into the sample, the mass and T2 values of samples are measured.
  • Repeat step (3) to get the imbibition curves and T2 spectra.
    The schematic diagram of experimental procedures is presented in Figure 2.

3. Experimental Results

3.1. Observations during Water Imbibition

Table 3 presents the sample surface changes during water imbibition. The whole process is divided into four stages: sediment wetting stage, microfracture initiation stage, fracture network stage, and dispersion stage. The sample imbibes water and then is wetted, and the color gradually deepens. After a certain time, micro-fractures occur, and the internal pore size begins to become larger due to water imbibition. More and more microfractures appear and change into a fracture network. At the final stage, the samples tend to disperse completely (Figure 3). The water cannot be retained in matrix pores. In other words, the samples reach the state of maximum water saturation.
The dispersion time of ZN1-1, ZN1-2, ZN1-3, LK1-1, and LK1-2 is 21.2 min, 17.7 min, 80.9 min, 64.5 min, and 17.9 min, respectively. The dispersion time of ZN1-3 and LK1-1 is much larger than that of other samples. It can be explained by clay minerals content. Figure 4 presents the I/S minerals content of different samples. The lower I/S content of ZN1-3 and LK1-1 results in the smaller dispersion time. The I/S has a larger specific surface area and can hold a large amount of water, causing fracture propagation, skeleton expansion, and dispersion. The clay minerals are critical to induce the change of pore structure during water imbibition.
The microfracture initiation time of ZN1-1, ZN1-2, ZN1-3, LK1-1, and LK1-2 is 12.1 min, 15 min, 45 min, 22.5 min, and 6.4 min, respectively. The brittle minerals of ZN1-1, ZN1-2, ZN1-3, LK1-1, and LK1-2 is 70.2%, 70.8%, 72.2%, 73.1%, and 69.7%, respectively. The microfracture initiation time is positively related to brittle minerals content. It can be explained by the basic principle of fracture propagation. When the tensile stress is larger than tensile strength, the fractures begin to propagate. Therefore, the microfracture initiation time should be related to tensile strength. It is generally true that more brittle minerals (quartz, feldspar, calcite, and dolomite) correspond to larger tensile strength. Therefore, more brittle minerals may increase the microfracture initiation time, which contributes to the stability of the pore structure of hydrate sediments.

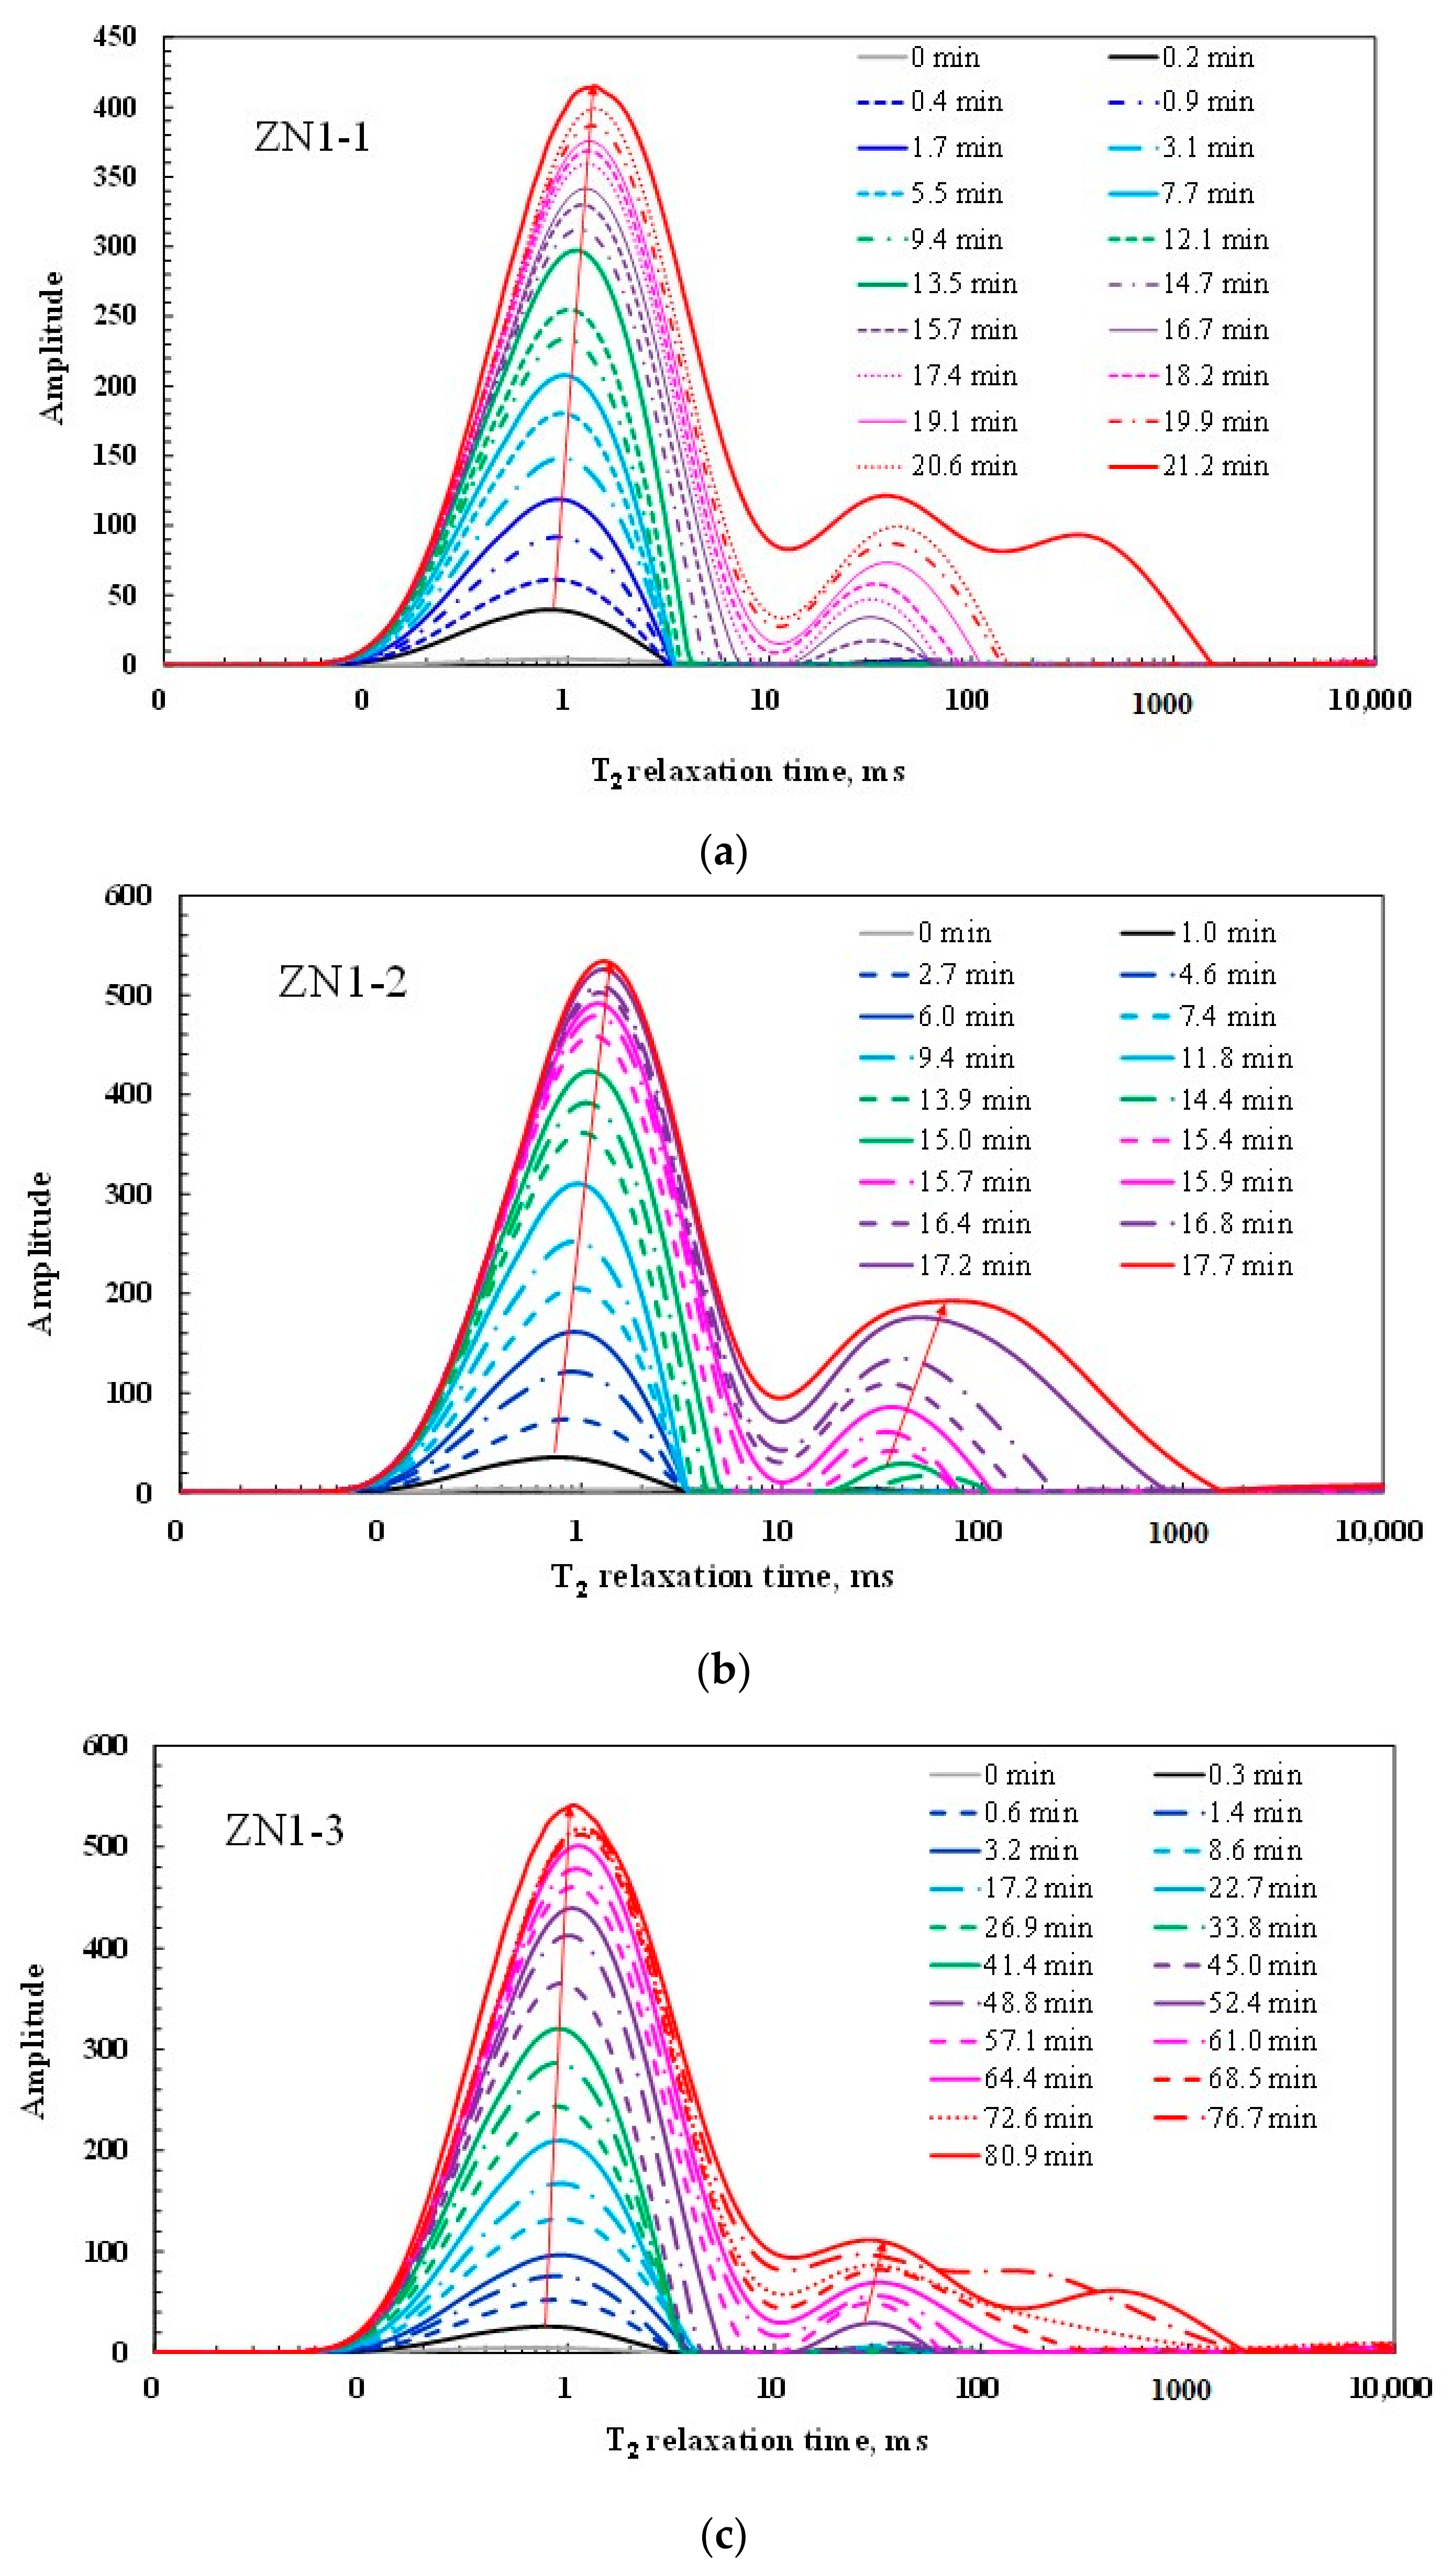
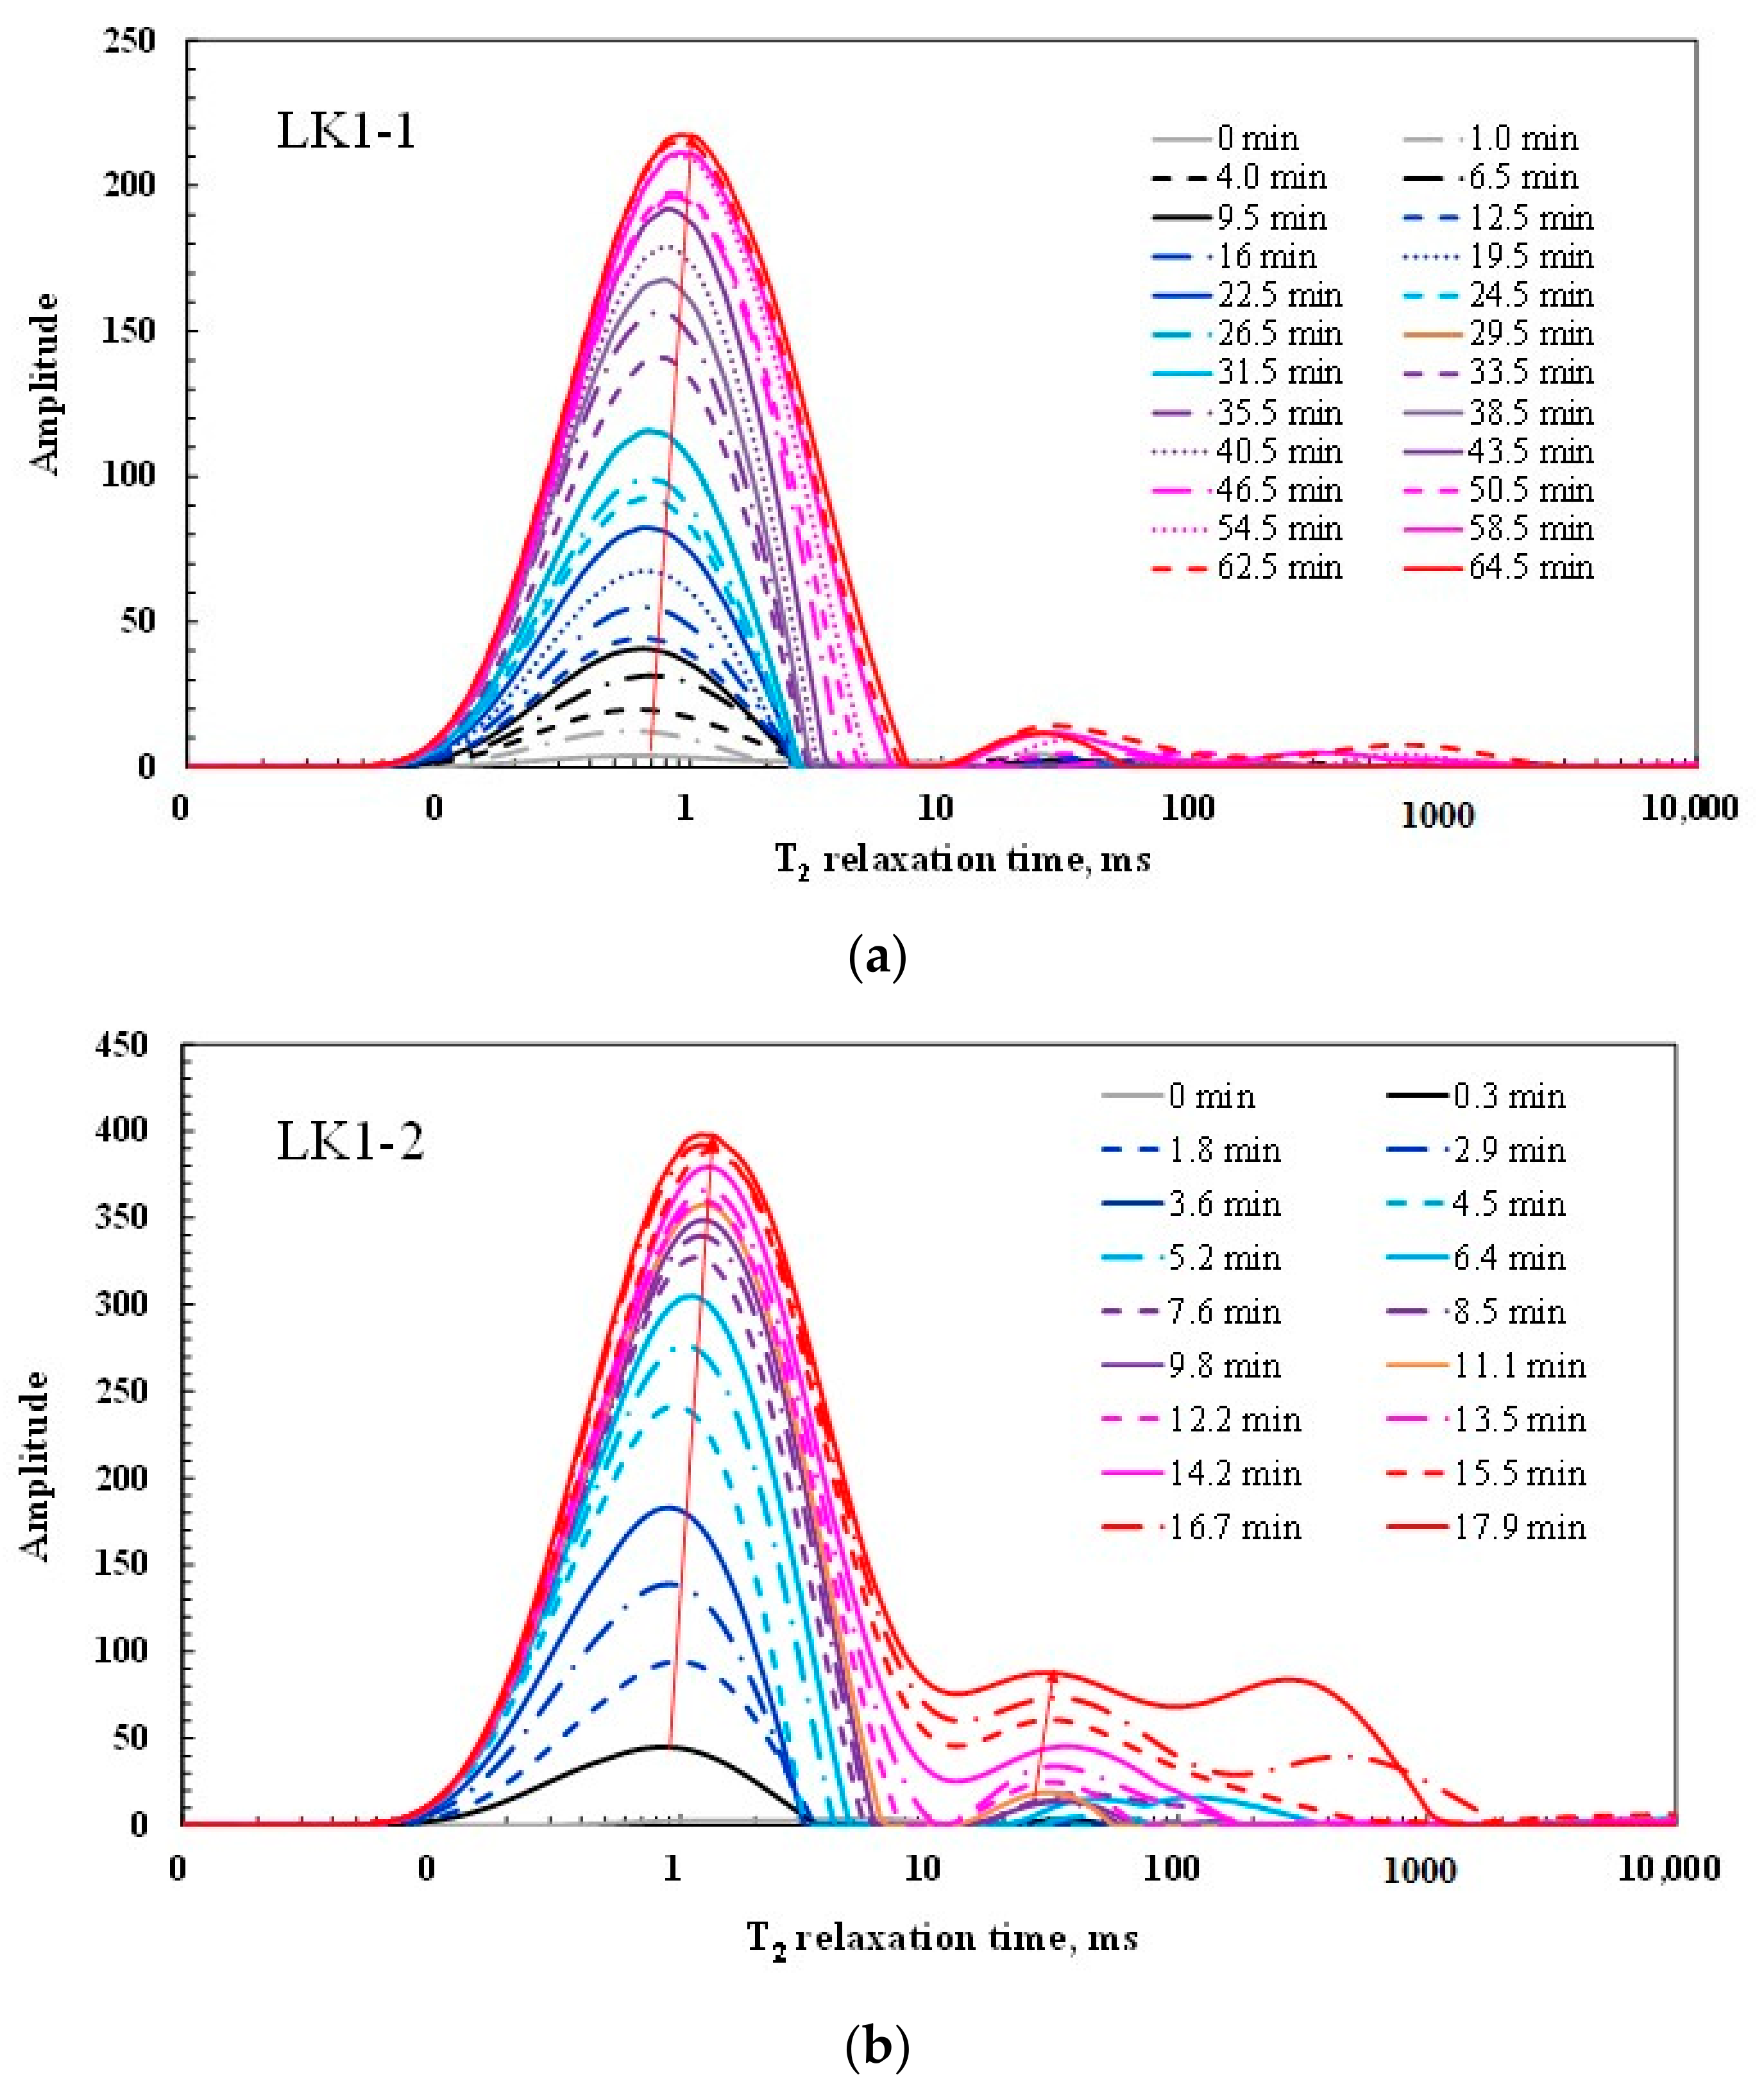
3.2. T2 Spectra Characteristics of Water Imbibition

The ordinate of the T2 spectra is the signal amplitude, representing the fluid volume in certain size pore. The larger the signal amplitude, the more the fluid volume in the certain size pore. The abscissa is the relaxation time T2, which is proportional to pore aperture. The larger the relaxation time T2, the larger the pore aperture. The area of the NMR T2 spectra reflects the amount of pore fluid in the sample. The dynamic migration characteristics of imbibed water can be studied by NMR spectra during water imbibition.
Figure 5 and Figure 6 show the NMR T2 spectra over time of different formation samples. In spite of different formation characteristics, they present similar T2 spectra characteristics of water imbibition. The two formation samples have the general public properties. As the imbibition time increases, the NMR spectra area increases gradually, indicating that a large amount of water is imbibed into the sediment pores. During this process, the peak is tilted to the right, indicating that the water imbibition induces new pores and fractures. When the imbibition time exceeds dispersion time, the peak of the T2 spectra is instantly elevated. The sediment samples are fully penetrated, reaching the state of maximum water saturation.
The bimodal peak characteristics of T2 spectra is presented in the two formations, suggesting a wide range of pore size distribution. Both matrix pores and microfractures are well-developed. The area of left peak with a relaxation time of 0.1–10 ms is much larger than that of the right peak with a relaxation time of 10–100 ms. The micro-nano pores are the main pores, which are in accordance with the results of SEM electron microscopy analysis. It should be noted that the pores of >100 ms do not exist at the beginning of water imbibition. When the imbibition reaches a certain time, it begins to appear, suggesting the appearance of larger size pores and fractures. The bimodal peak of T2 spectra changes into triple peak. As a large amount of water enters into the matrix pores, clay minerals begin to expand, leading to new pores and microfractures.
In the maximum water saturation state, the right peak area of ZN1-1 and ZN1-2 is larger than that of ZN1-3. The samples ZN1-1 and ZN1-2 contain more I/S minerals and have strong expansion capacity resulting in more large pores and fractures. The samples LK1-1 and LK1-2 have equivalent content of I/S minerals. But the right peak area of LK1-1 is smaller than that of LK1-2. It may result from lower permeability of LK1-2. The low permeability is not conducive to fluid flow and pressure transmission. The same content of I/S minerals can produce larger expansion forces in the LK1-2 with lower pressure transmission capacity. It leads to a larger right peak area of LK1-2.

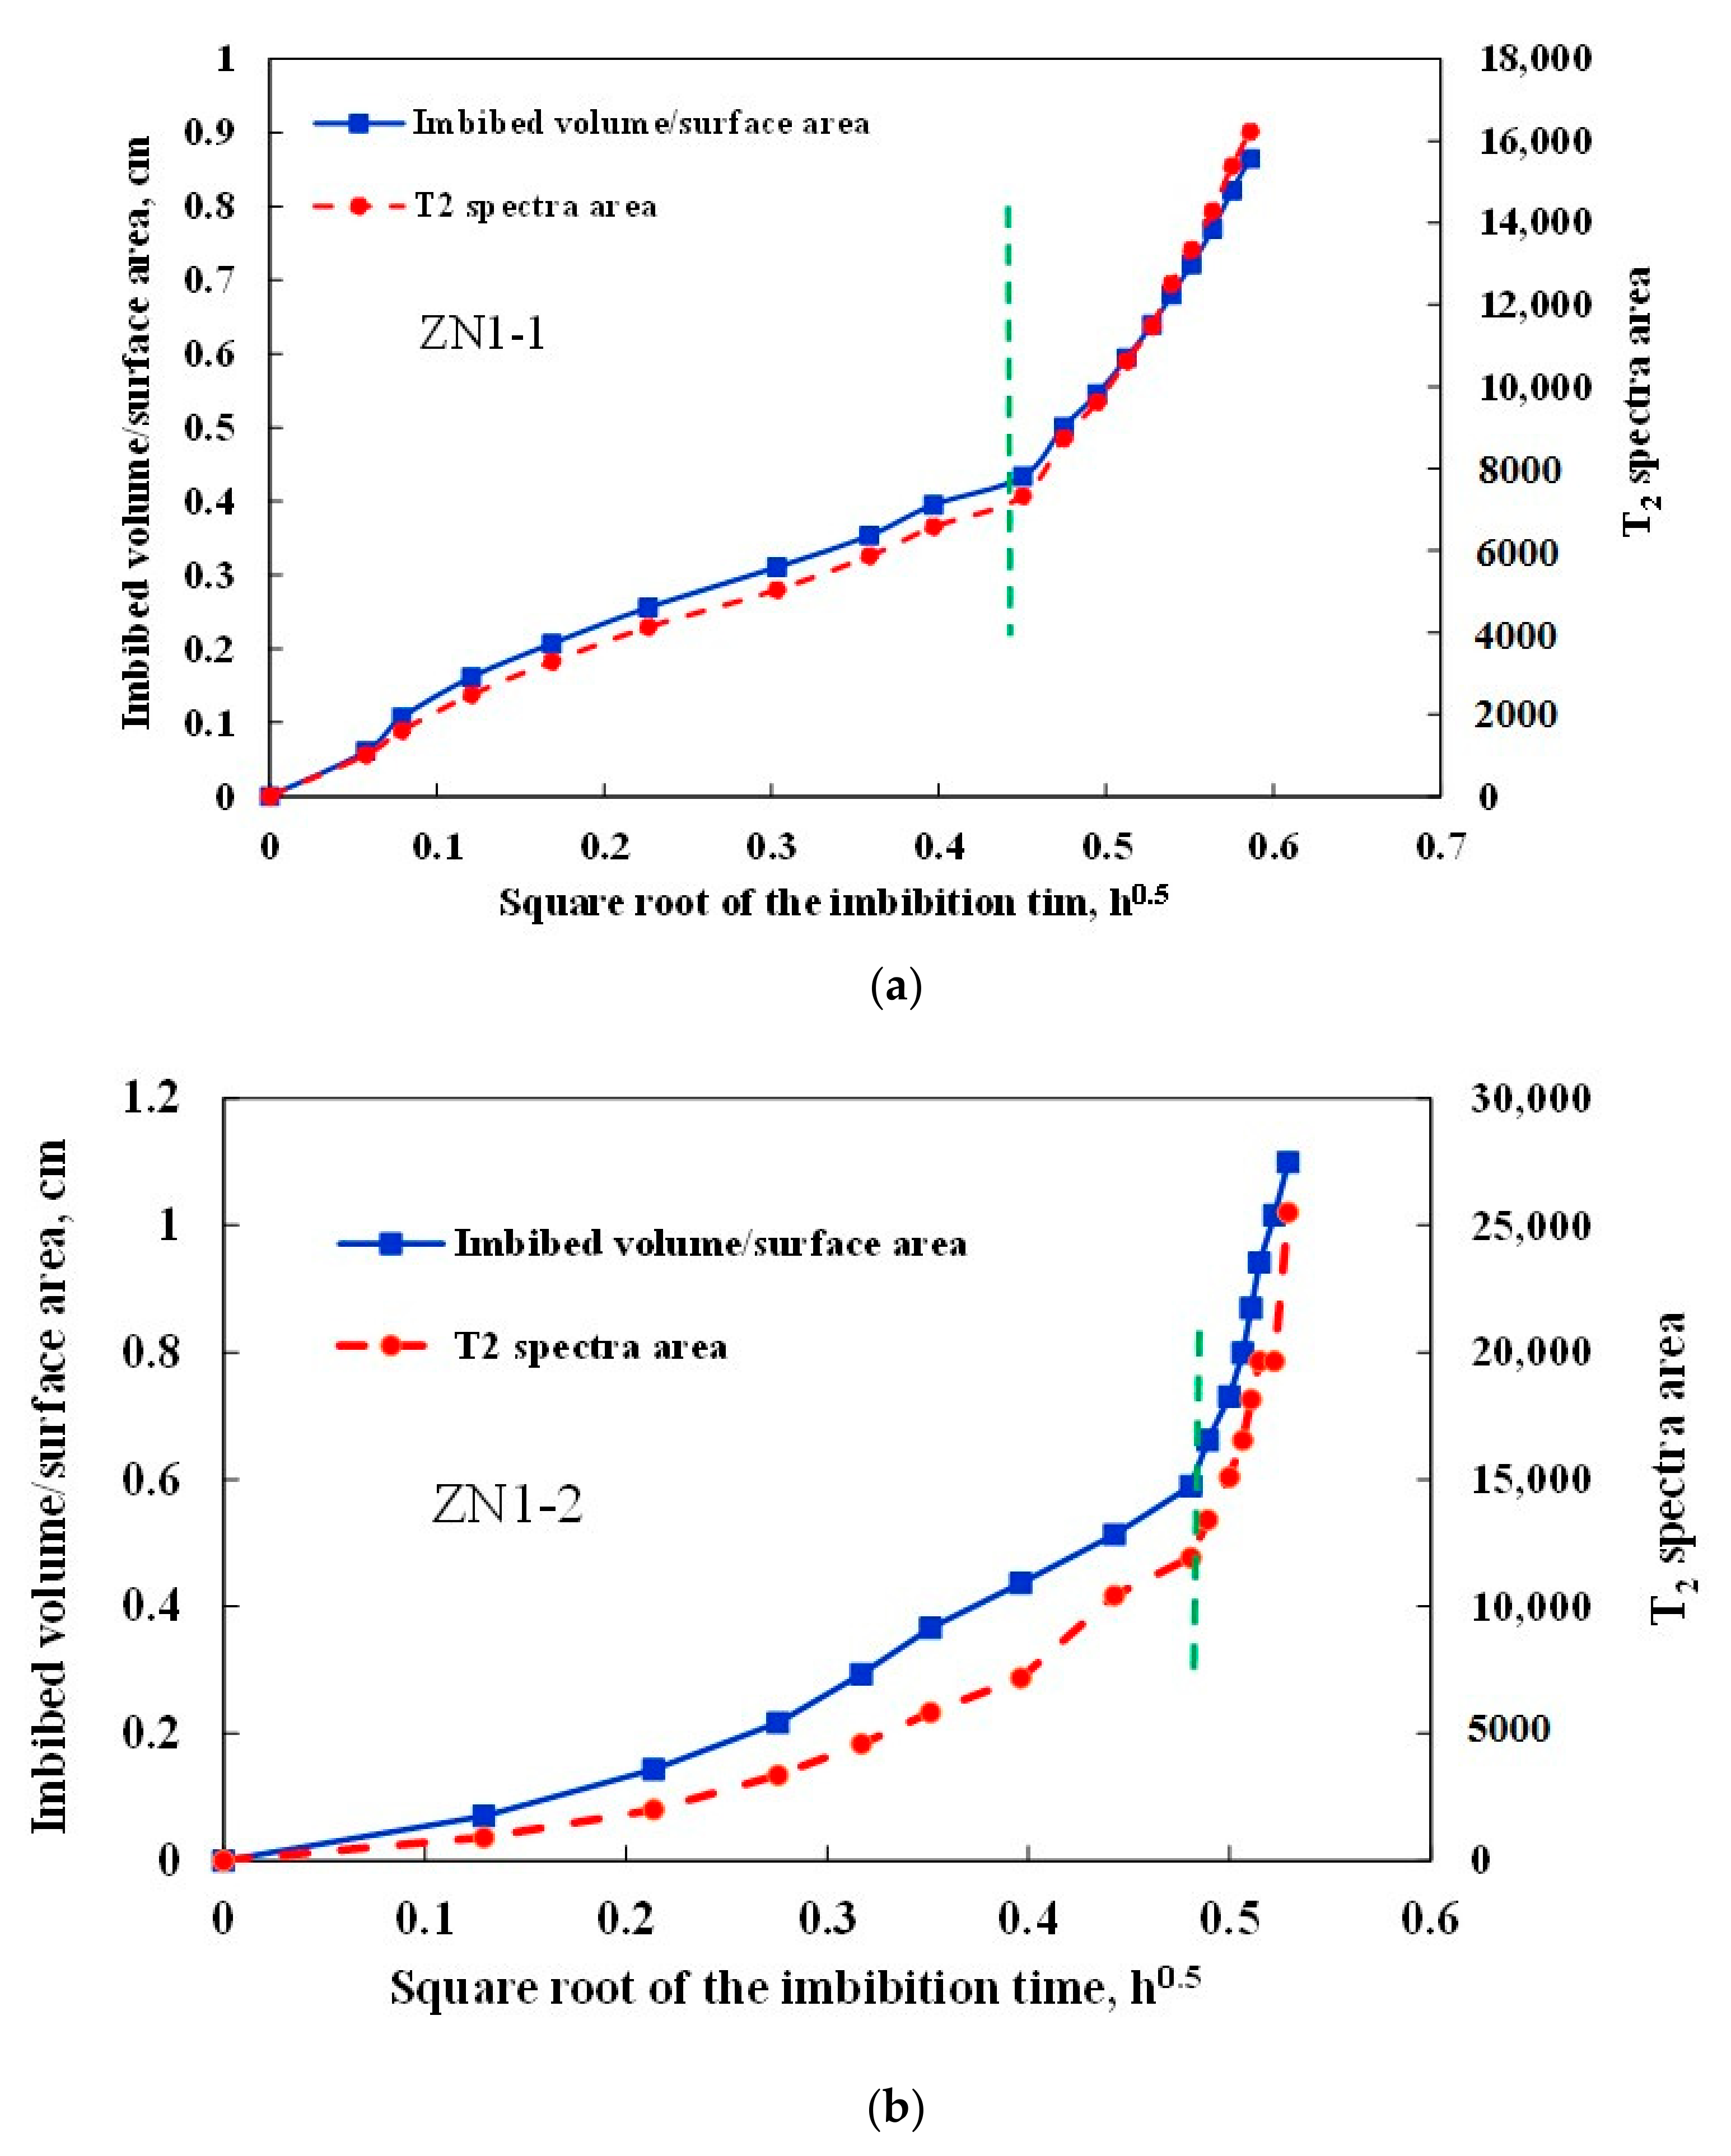
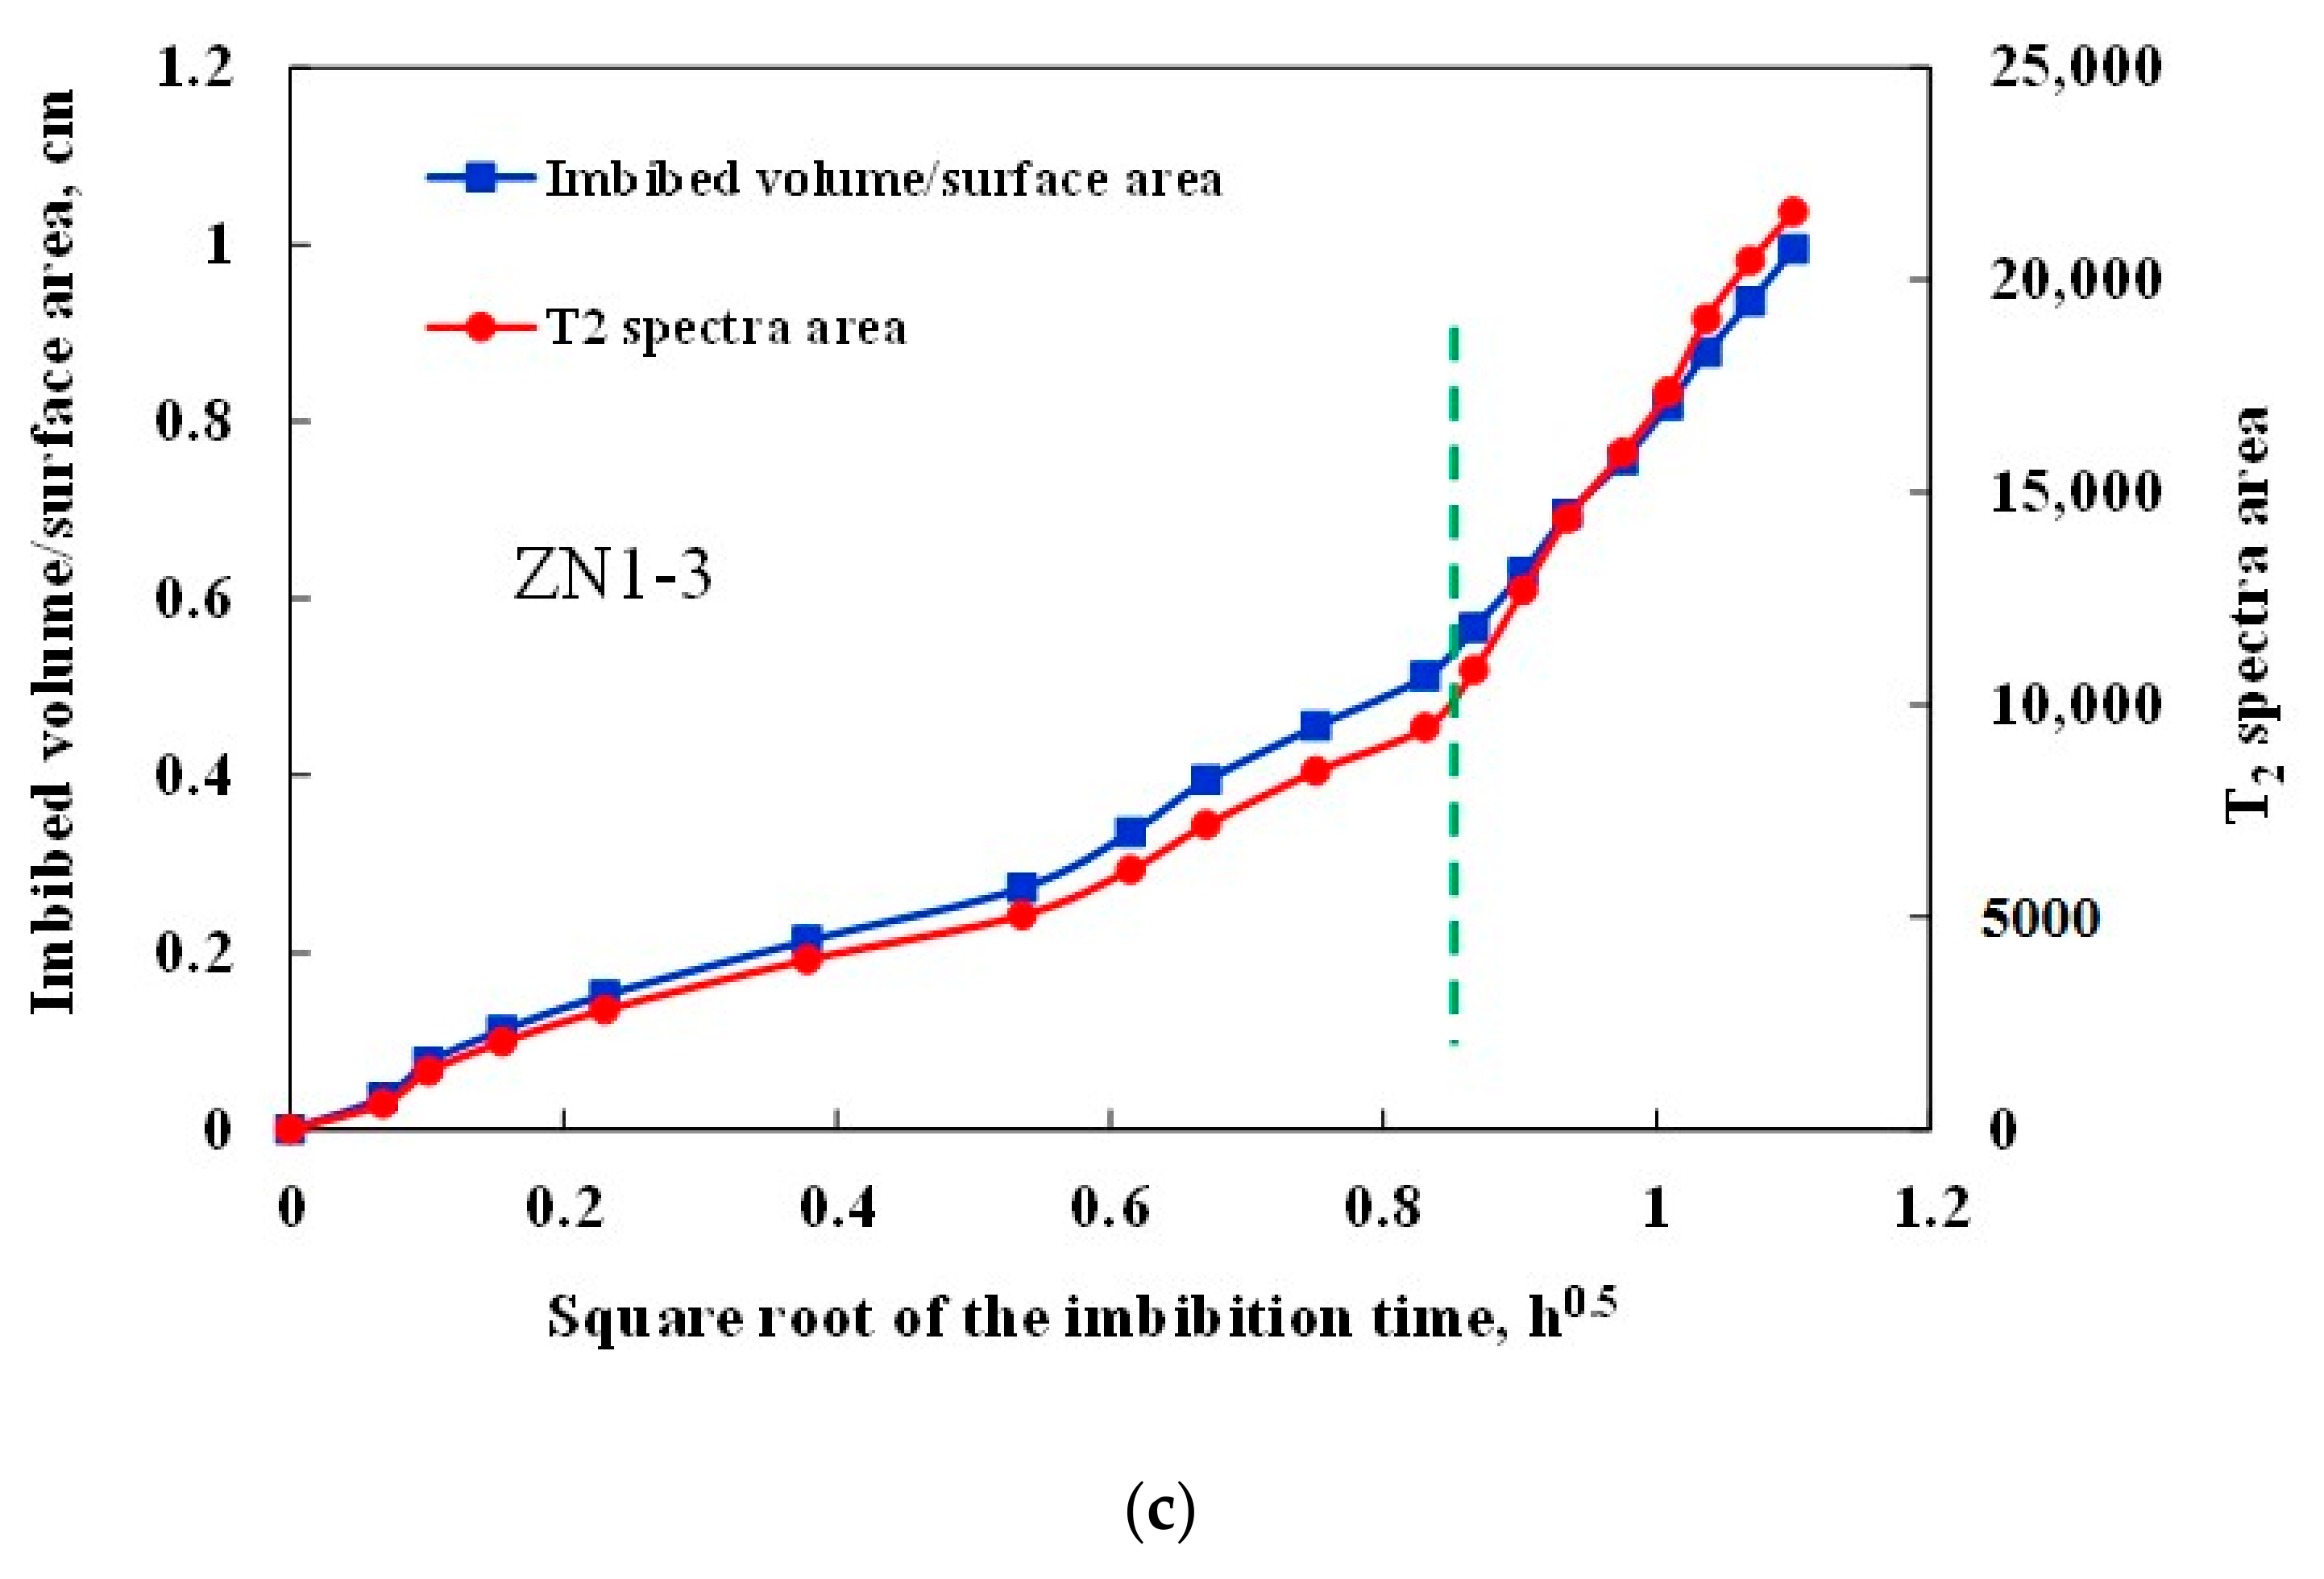
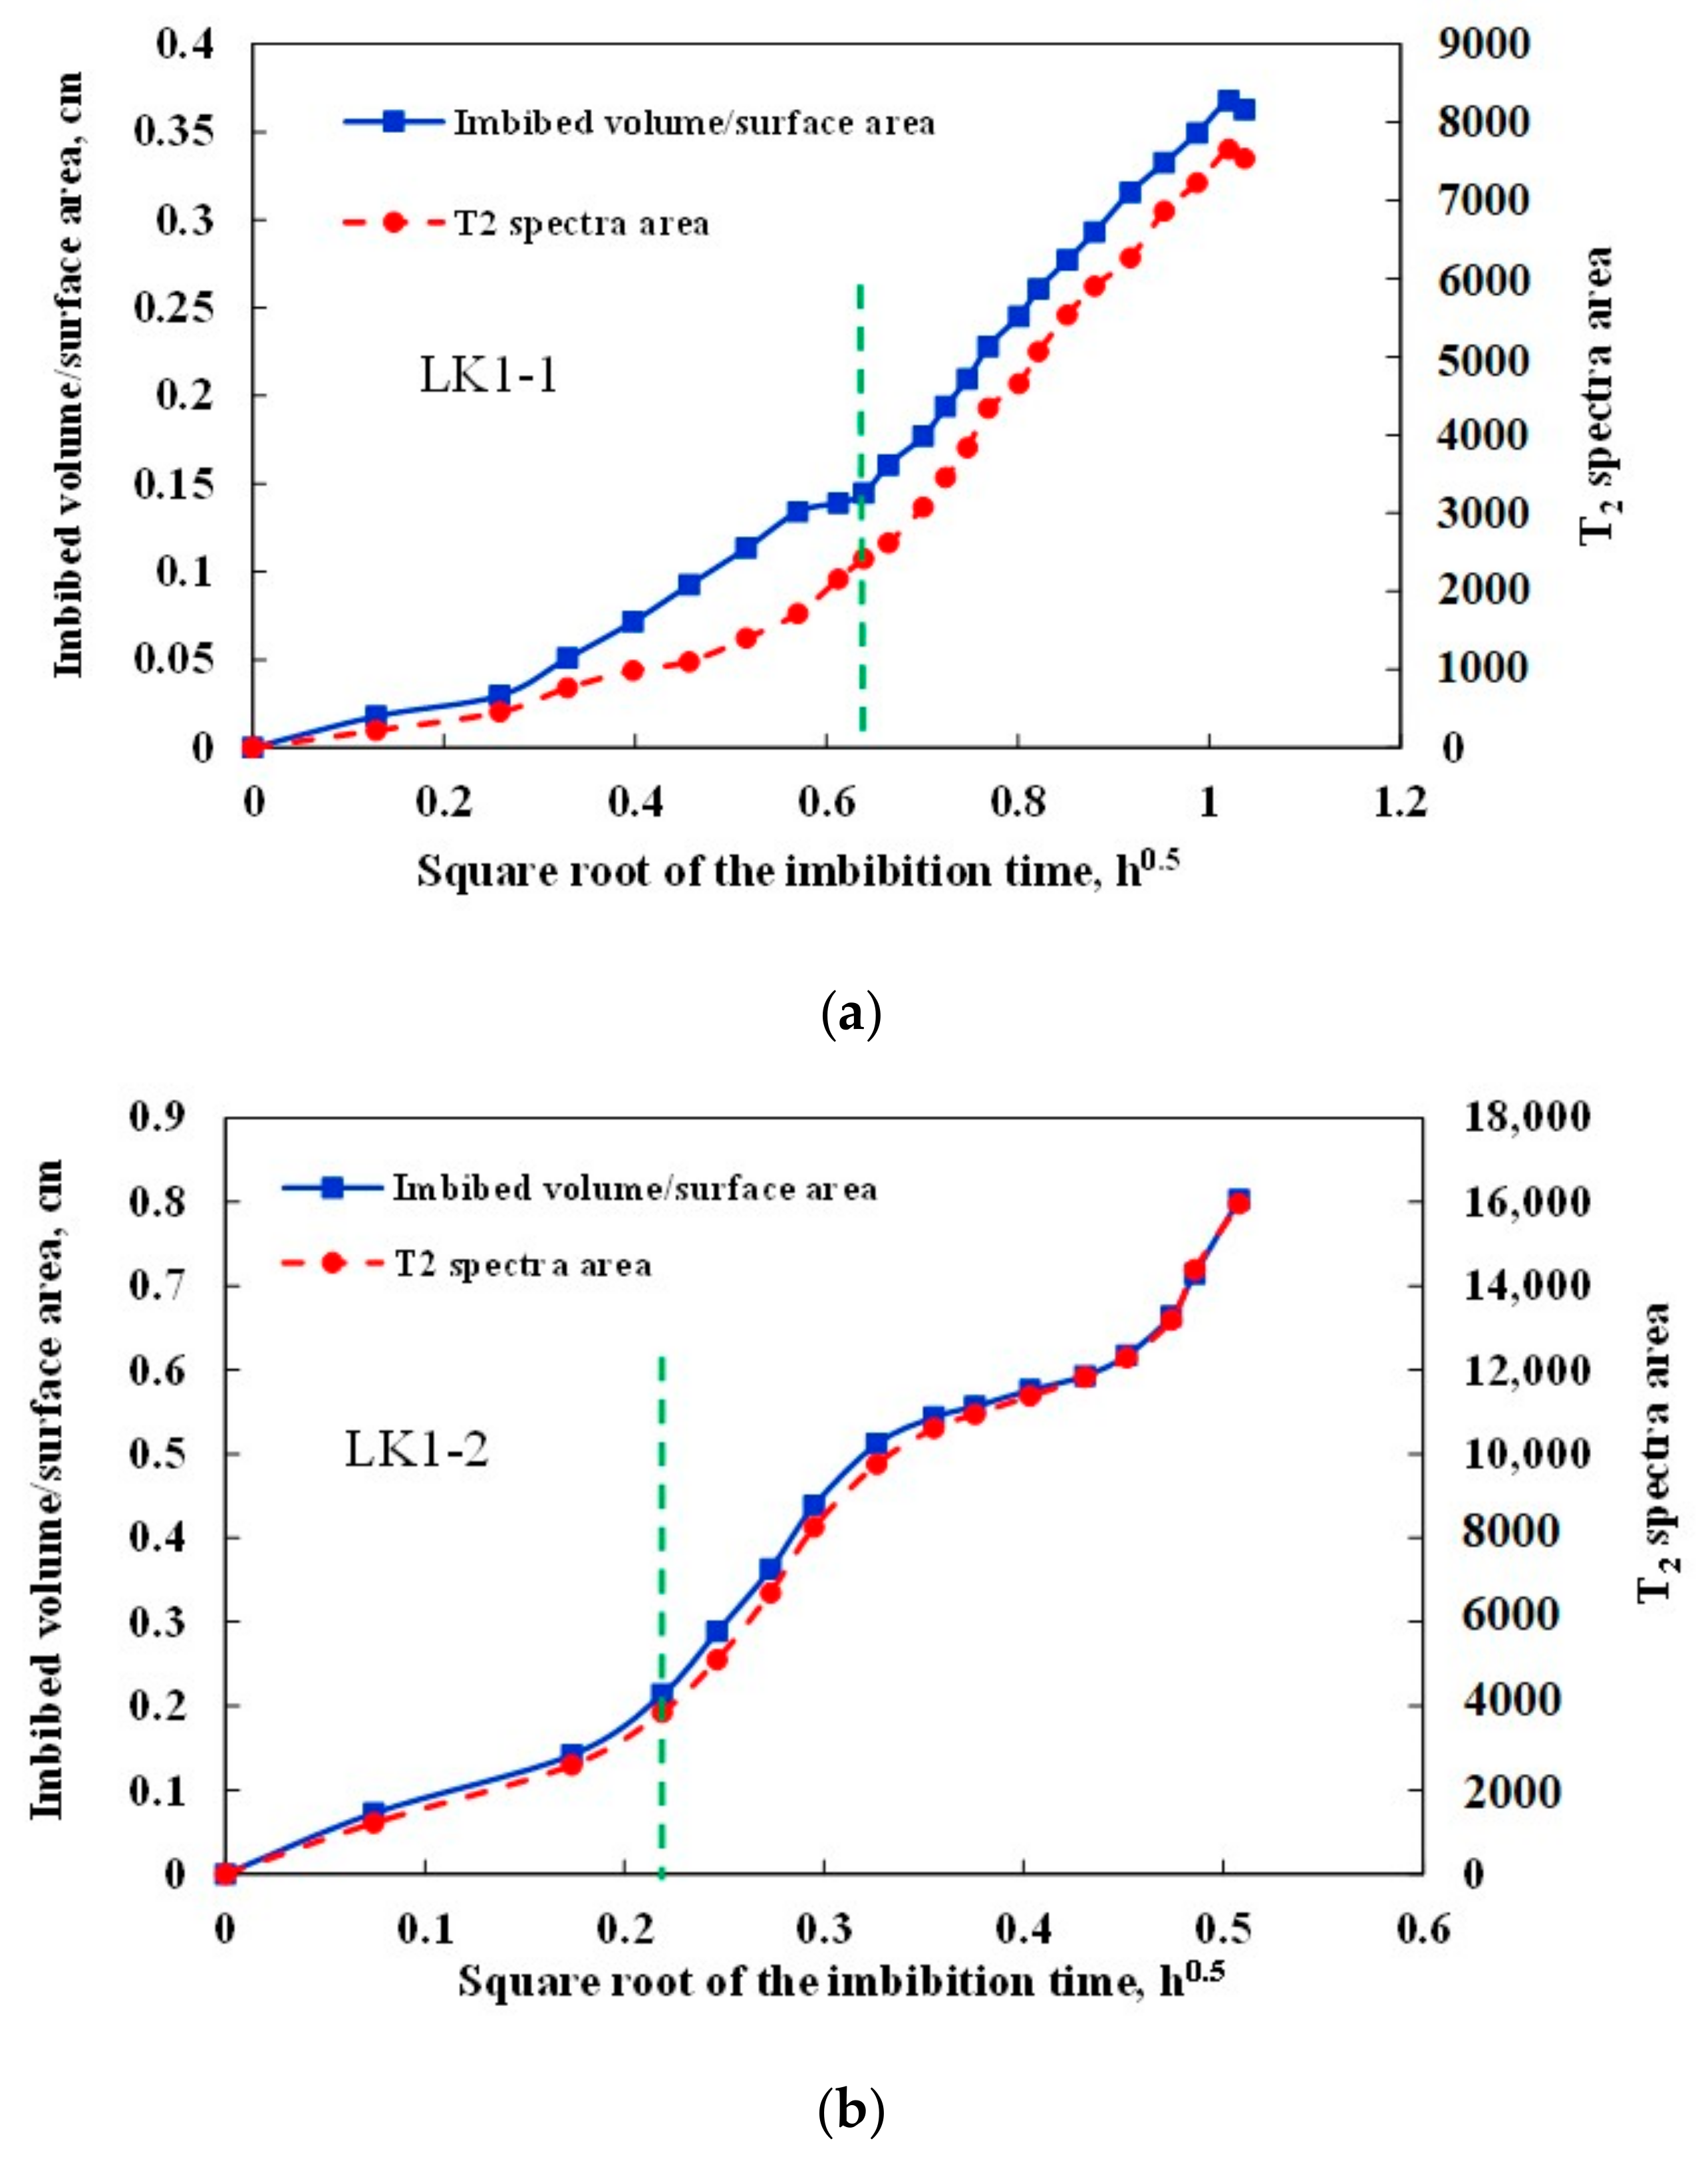
3.3. Imbibition Curve Characteristics

According to Handy model [21], the relationship between the water imbibition volume per unit area and the imbibition time can be characterized by
V i m b A c = 2 p c ϕ k w S w f μ w t
The slope of the spontaneous imbibition curve is the imbibition rate A, which is given by
A = 2 p c ϕ k w S w f μ w
where V i m b is imbibed volume, A c is sectional area, p c is capillary pressure, ϕ is porosity, k w is water permeability, S w f is front water saturation, μ w is water viscosity, and t is imbibition time. It can be seen that the imbibition rate involves capillary force, porosity, permeability, water saturation, and fluid viscosity. It is an attribute parameter of the hydrate sediment itself.
Figure 7 and Figure 8 show the curves of imbibition volume/sectional area and T2 spectra area versus the square root of imbibition time. The water imbibition volume is calculated by the mass of balance test and the water density. According to the imbibition curves, the variation trend of spectra area is consistent with that of the water imbibition volume. It verifies the accuracy of NMR test results, and T2 spectra can be used to study dynamic distribution of water during the imbibition process. The water imbibition volume and spectra area increase rapidly over imbibition time, indicating that a large amount of water is imbibed into the pores of the sediment. The water imbibition volume per unit area is linearly correlated with the square root of imbibition time, which nearly corresponds to the Handy model. Therefore, the slope of imbibition cures gives imbibition rate of different hydrate formations. It should be noted that the imbibition curve is divided into two stages with different slopes. When the imbibition time exceeds the critical imbibition time, the imbibition rate suddenly increases. The initial imbibition rate is much lower than the later imbibition rate (Figure 9). When the imbibition time exceeds the second critical time (dispersion time), the sediment samples are instantaneously dispersed. Therefore, the maximum imbibition capacity of samples are determined by two critical times.
The two linear stages of imbibition curves may result from the change of pore structure during water imbibition (Figure 9). The first linear stage is related to water imbibition of primary pores. According to the sample observations and T2 spectra characteristics during water imbibition, water migrates spontaneously in the primary pores and has little effect on the pore structure in the first linear stage of water imbibition. When the imbibition time exceeds the critical imbibition time, a large number of secondary pores (new large pores and micro-fractures) start to appear, and a large number of fracture networks are generated, eventually leading to dispersion of the sediment sample. The second linear stage corresponds to water imbibition of secondary pores. The imbibition rate of primary pores is A1, and the imbibition rate of secondary pores is A2. The A2 value is significantly larger than A1, which indicates that the generation of new fractures can greatly accelerate the imbibition rate.

4. Discussion

4.1. Imbibition Capacity Comparison of Different Hydrate Formations

The characteristic parameters of imbibition are shown in Table 4. The fracture occurs at the fracture initiation time. It is obtained by observing the surface characteristics of the sample (Table 3). The critical imbibition time is obtained by the imbibition curves (Figure 7 and Figure 8). Figure 10 presents the relationship between the critical imbibition time and the fracture initiation time. It can be concluded that the critical imbibition time is linear with the fracture initiation time. In the ZN1-1 and LK1-1, the critical imbibition time is equal to the fracture initiation time. The fracture initiation time of the samples ZN1-2, ZN1-3, and LK1-2 is approximately equal to the fracture initiation time. The linear correlation shows that the critical imbibition time is the fracture initiation time. In other words, the fracture initiation results in the two linear stages (imbibition stage of primary pore and secondary pore).
At the dispersion time, no more water can be imbibed into the matrix pores and the pore structure is completely destructed. In this study, the imbibition capacity is defined as the ratio of maximum imbibition volume and sample volume. The maximum imbibition volume corresponds to the dispersion time. The imbibition rate and capacity of each formation sample are shown in Table 5. In general, the imbibition rate A2 of each sample is larger than the imbibition rate A1, indicating acceleration effects of micro-fractures. The average imbibition rates of ZN and LK sediment are about 1.0975~5.9844 cm/h0.5 and 0.4017~1.3116 cm/h0.5. The ZN sediment has the larger imbibition rate and the LK sediment has the smaller imbibition rate. The imbibition capacity of ZN and LK is about 0.56~0.65 cm3/cm3 and 0.39~0.53 cm3/cm3, respectively. The ZN sediment has the larger imbibition capacity and the LK sediment has the smaller imbibition capacity. The relative size of imbibition capacity is consistent with that of imbibition rate.

4.2. Imbibition Capacity Comparison of Hydrate Sediments and Other Formations

Figure 11 shows the relationship between the imbibition capacity and imbibition rate of hydrate sediments. The imbibition characteristic parameters of tight sandstone and shale reservoirs is used to compare with hydrate sediments. It suggests that the imbibition capacity and imbibition rate are linearly positively correlated in the double logarithmic coordinate system. The imbibition rate of hydrate sediments is about 0.825~2.186 cm/h0.5, and the imbibition capacity is about 0.49~0.81 cm3/cm3. They are much higher than that of tight sandstone and shale reservoirs. The low flowback efficiency of fracturing fluid results from strong imbibition capacity in gas shale [14]. It can be assumed that a large amount of dissociation water can be also imbibed into matrix pores of hydrate sediments, leading to low water production during gas hydrate exploitation.
It should be noted that the definition of imbibition capacity is controversial in hydrate sediments. In this study, the imbibition capacity corresponds to the dispersion time, which is much larger than that corresponding to critical imbibition time. At the critical imbibition time, the micro-fractures begin to propagate, and the pore structure changes significantly. Despite the acceleration imbibition of micro-fractures, they can act as the high-speed channel of water, which contributes to the water production. The imbibition capacity corresponding to critical imbibition time is also reasonable to some extent. The definition of imbibition capacity deserves further discussion in hydrate sediments. In addition, the experimental results in this study are obtained at atmospheric pressure, which may not be suitable under confining pressure. In the future, the imbibition capacity under confining pressure and its influencing factors should be studied.

5. Conclusions

In this study, the imbibition experiments were carried out on hydrate sediments, and NMR T2 spectra was used to study the characteristics of water migration. The following conclusions were obtained.
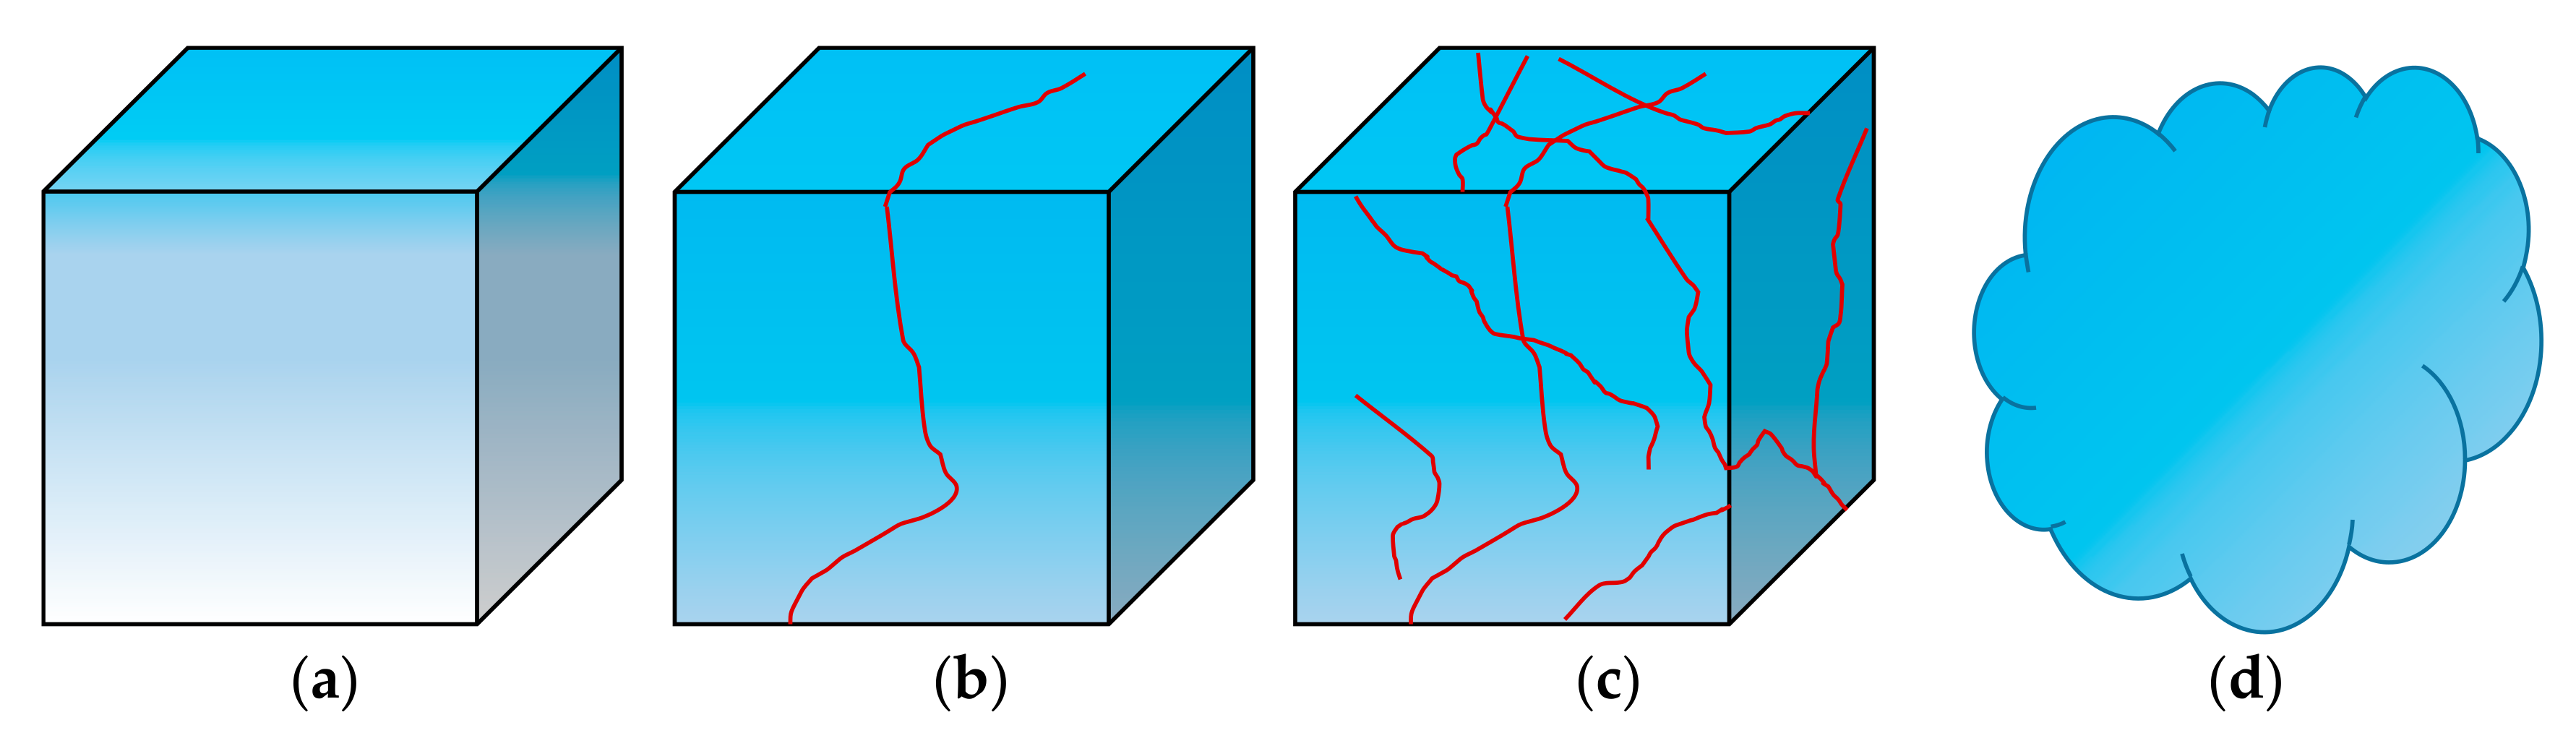
  • As the imbibition time increases, the water is gradually imbibed into matrix pores. Water imbibition can cause dramatic changes in pore structure, such as microfractures initiation, fracture network generation, and dispersion.
  • When the imbibition time exceeds the critical imbibition time, a large number of secondary pores (new large pores and micro-fractures) start to appear. When the imbibition time exceeds the dispersion time, the fracture networks are generated, eventually leading to dispersion of the sediment samples.
  • The imbibition curves of hydrate sediments can be divided into two linear stages, which corresponds to water imbibition of primary pores and secondary pores, respectively. The imbibition rate of secondary pores is significantly larger than that of primary pores, indicating that the generation of new fractures can greatly accelerate the imbibition rate.

Author Contributions

Methodology, L.Y.; data curation, C.Z.; writing-review and editing, J.C.; resources and investigation, H.L. All authors have read and agreed to the published version of the manuscript.

Funding

The research was funded by National Natural Science Foundation of China (No. 11702296), the China Geological Survey (No. DD20190232), and by the Fundamental Research Funds for the Central Universities (No. 2462019YJRC011).

Conflicts of Interest

The authors declare no conflict of interest.

References

  1. Mu, L.; von Solms, N. Hydrate thermal dissociation behavior and dissociation enthalpies in methane-carbon dioxide swapping process. J. Chem. Thermodyn. 2018, 117, 33–42. [Google Scholar] [CrossRef] [Green Version]
  2. Pandey, J.S.; Daas, Y.J.; von Solms, N. Insights into kinetics of methane hydrate formation in the presence of surfactants. Processes 2019, 7, 598. [Google Scholar] [CrossRef] [Green Version]
  3. Omelchenko, R.Y.; Makogon, Y.F. Commercial gas production from Messoyakha deposit in hydrate conditions. J. Nat. Gas Sci. Eng. 2013, 11, 1–6. [Google Scholar]
  4. Englezos, P. Extraction of methane hydrate energy by carbon dioxide injection-key challenges and a paradigm shift. Chin. J. Chem. 2019, 27, 2044–2048. [Google Scholar] [CrossRef]
  5. Linga, P.; Clarke, M. A review of reactor designs and materials employed for increasing the rate of gas hydrate formation. Energy Fuel 2017, 31, 1–13. [Google Scholar] [CrossRef]
  6. Liang, S.; Liang, D.; Wu, N.; Yi, L.; Hu, G. Transient translational and rotational water defects in gas hydrates. J. Phys. Chem. C 2017, 121, 17595–17602. [Google Scholar] [CrossRef]
  7. Safronov, A.F.; Shits, E.Y.; Grigor’ev, M.N.; Semenov, M.E. Formation of gas hydrate deposits in the Siberian Arctic shelf. Russ. Geol. Geophys. 2009, 51, 83–87. [Google Scholar] [CrossRef]
  8. Dearman, J.L. Gas Hydrate Formation in Gulf of Mexico Sediments. Master’s Thesis, Mississippi State University, Starkville, MS, USA, 9 April 2007. [Google Scholar]
  9. Radich, J.; Rogers, R.E.; French, W.T.; Zhang, G. Biochemical reaction and diffusion in seafloor gas hydrate capillaries: Implications for gas hydrate stability. Chem. Eng. Sci. 2009, 64, 4278–4285. [Google Scholar] [CrossRef]
  10. Sun, Q.; Du, M.; Li, X.; Guo, X.; Liu, A.; Chen, G.; Yang, L. Study on ethane hydrate formation/dissociation in a sub-millimeter sized capillary. Chem. Eng. Sci. 2019, 206, 1–9. [Google Scholar] [CrossRef]
  11. Sujith, K.S.; Ramachandran, C.N. Effect of surface roughness on adsorption and distribution of methane at the water-methane interface. J. Mol. Liq. 2018, 266, 856–863. [Google Scholar] [CrossRef]
  12. Kang, D.H.; Yun, T.S.; Kim, K.Y. Effect of hydrate nucleation mechanisms and capillarity on permeability reduction in granular media. Geophys. Res. Lett. 2016, 43, 9018–9025. [Google Scholar] [CrossRef]
  13. Crutchley, G.J.; Fraser, D.R.A.; Pecher, I.A.; Gorman, A.R.; Maslen, G.; Henrys, S.A. Gas migration into gas hydrate-bearing sediments on the southern Hikurangi margin of New Zealand. J. Geophys. Res. 2015, 120, 725–743. [Google Scholar] [CrossRef]
  14. Ge, H.; Yang, L.; Shen, Y.; Ren, K.; Meng, F.; Ji, W.; Wu, S. Experimental investigation of shale imbibition capacity and the factors influencing loss of hydraulic fracturing fluids. Pet. Sci. 2018, 12, 636–650. [Google Scholar] [CrossRef] [Green Version]
  15. Dehghanpour, H.; Lan, Q.; Saeed, Y.; Fei, H.; Qi, Z. Spontaneous imbibition of brine and oil in gas shales: Effect of water adsorption and resulting micro fractures. Energy Fuel 2013, 27, 3039–3049. [Google Scholar] [CrossRef]
  16. Yang, L.; Ge, H.; Shi, X.; Cheng, Y.; Zhang, K.; Chen, H.; Shen, Y. The effect of microstructure and rock mineralogy on water imbibition characteristics in tight reservoirs. J. Nat. Gas Sci. Eng. 2016, 33, 1461–1471. [Google Scholar] [CrossRef]
  17. Shagapov, V.; Tazetdinov, B.I. Formation and dissociation of gas hydrate inclusions during migration in water. Thermophys. Aeromech. 2014, 21, 337–345. [Google Scholar] [CrossRef]
  18. Ge, X.; Liu, J.; Fan, Y.; Xing, D.; Deng, S.; Cai, J. Laboratory investigation into the formation and dissociation process of gas hydrate by low-field NMR technique. J. Geophys. Res. 2018, 123, 3339–3346. [Google Scholar] [CrossRef]
  19. Cui, Y.; Lu, C.; Wu, M.; Peng, Y.; Yao, Y.; Luo, W. Review of exploration and production technology of natural gas hydrate. Adv. Geo-Energy Res. 2018, 2, 53–62. [Google Scholar] [CrossRef] [Green Version]
  20. Liu, L.; Dai, S.; Ning, F.; Cai, J.; Liu, C.; Wu, N. Fractal characteristics of unsaturated sands−implications to relative permeability in hydrate-bearing sediments. J. Nat. Gas Sci. Eng. 2019, 66, 11–17. [Google Scholar] [CrossRef]
  21. Handy, L.L. Determination of effective capillary pressures for porous media from imbibition data. Petroleum Trans. AIME 1960, 219, 75–80. [Google Scholar]
Figure 1. Sediments samples after drying: (a) ZN1-2 and (b) LK1-2.
Energies 13 00445 g001
Figure 2. Schematic of imbibition procedure in hydrate sediment samples.
Energies 13 00445 g002
Figure 3. Schematic of pore structure change: (a) sediment wetting stage, (b) microfracture initiation stage, (c) fracture network stage, and (d) dispersion stage.
Energies 13 00445 g003
Figure 4. The I/S minerals content of different samples.
Energies 13 00445 g004
Figure 5. T2 spectra vs. imbibition of ZN formation. (a) ZN1-1; (b) ZN1-2; (c) ZN1-3.
Energies 13 00445 g005
Figure 6. T2 spectra vs. imbibition of LK formation. (a) LK1-1; (b) LK1-2.
Energies 13 00445 g006
Figure 7. Imbibition volume/sectional area and spectra area vs. square root of time in ZN formation. (a) ZN1-1; (b) ZN1-2; (c) ZN1-3.
Energies 13 00445 g007aEnergies 13 00445 g007b
Figure 8. Imbibition volume/sectional area and spectra area vs. square root of time in LK formation. (a) LK1-1; (b) LK1-2.
Energies 13 00445 g008
Figure 9. Schematic diagram of imbibition curve in hydrate sediments.
Energies 13 00445 g009
Figure 10. Relationship between critical imbibition time and fracture initiation time.
Energies 13 00445 g010
Figure 11. Comparison of hydrate sediments and other formations. The experimental results of tight sandstone and shale are cited from Ge et al. [14].
Energies 13 00445 g011
Table 1. Sample physical characteristics.
SamplesPorosity,
%
Permeability, mDLength,
cm
Width,
cm
Height,
cm
Sectional Area, cm2Dry Mass,
g
ZN1-132.57.81.4721.1831.4461.7413.5483
ZN1-221.51.01.3541.3421.6901.8174.5585
ZN1-331.46.61.6471.3351.7802.1995.9983
LK1-135.45.11.3561.3411.1371.8182.9334
LK1-229.50.31.3921.2841.5121.7873.4324
Note: ZN and LK represent different gas hydrate formations.
Table 2. The results of mineral composition analysis.
LabelTotal Mineral Composition, wt.%Relative Clay Abundance, wt.%
QuartzFeldsparCalciteDolomitePyriteClayIlliteI/S aChloriteKaolinite
ZN1-136.78.713.73.57.629.83641149
ZN1-236.05.923.03.62.329.23243169
ZN1-345.710.412.63.00.527.838331910
LK1-147.98.710.84.61.126.937341811
LK1-244.37.812.44.11.130.338311813
Note: a I/S represents the illite/smectite mixed-layer.
Table 3. Changes of ZN and LK formation sample appearance.
SampleWettingMicrofracture InitiationFracture NetworkDispersion
ZN1-2 Energies 13 00445 i001 Energies 13 00445 i002 Energies 13 00445 i003 Energies 13 00445 i004
LK1-2 Energies 13 00445 i005 Energies 13 00445 i006 Energies 13 00445 i007 Energies 13 00445 i008
Table 4. Different characteristic imbibition time.
SampleCritical Imbibition Time, minFracture Initiation Time, minDispersion Time, min
ZN1-112.112.121.2
ZN1-213.915.017.7
ZN1-341.445.080.9
LK1-122.522.564.5
LK1-22.96.417.9
Table 5. Imbibition capacity and imbibition rate.
No.Sample Volume,
cm3
Water Imbibition Volume, cm3Imbibition Capacity, cm3/cm3Imbibition Rate, cm/h0.5Average Imbibition Rate, cm/h0.5
A1A2A
ZN1-12.5181.5050.601.01923.14432.0818
ZN1-23.0711.9970.651.269810.6995.9844
ZN1-33.9142.1860.560.56101.63391.0975
LK1-12.0680.7970.390.23600.56730.4017
LK1-22.7021.4350.530.92301.70021.3116

