Sustainable Residential Energy Supply: A Literature Review-Based Morphological Analysis


Abstract
1. Introduction
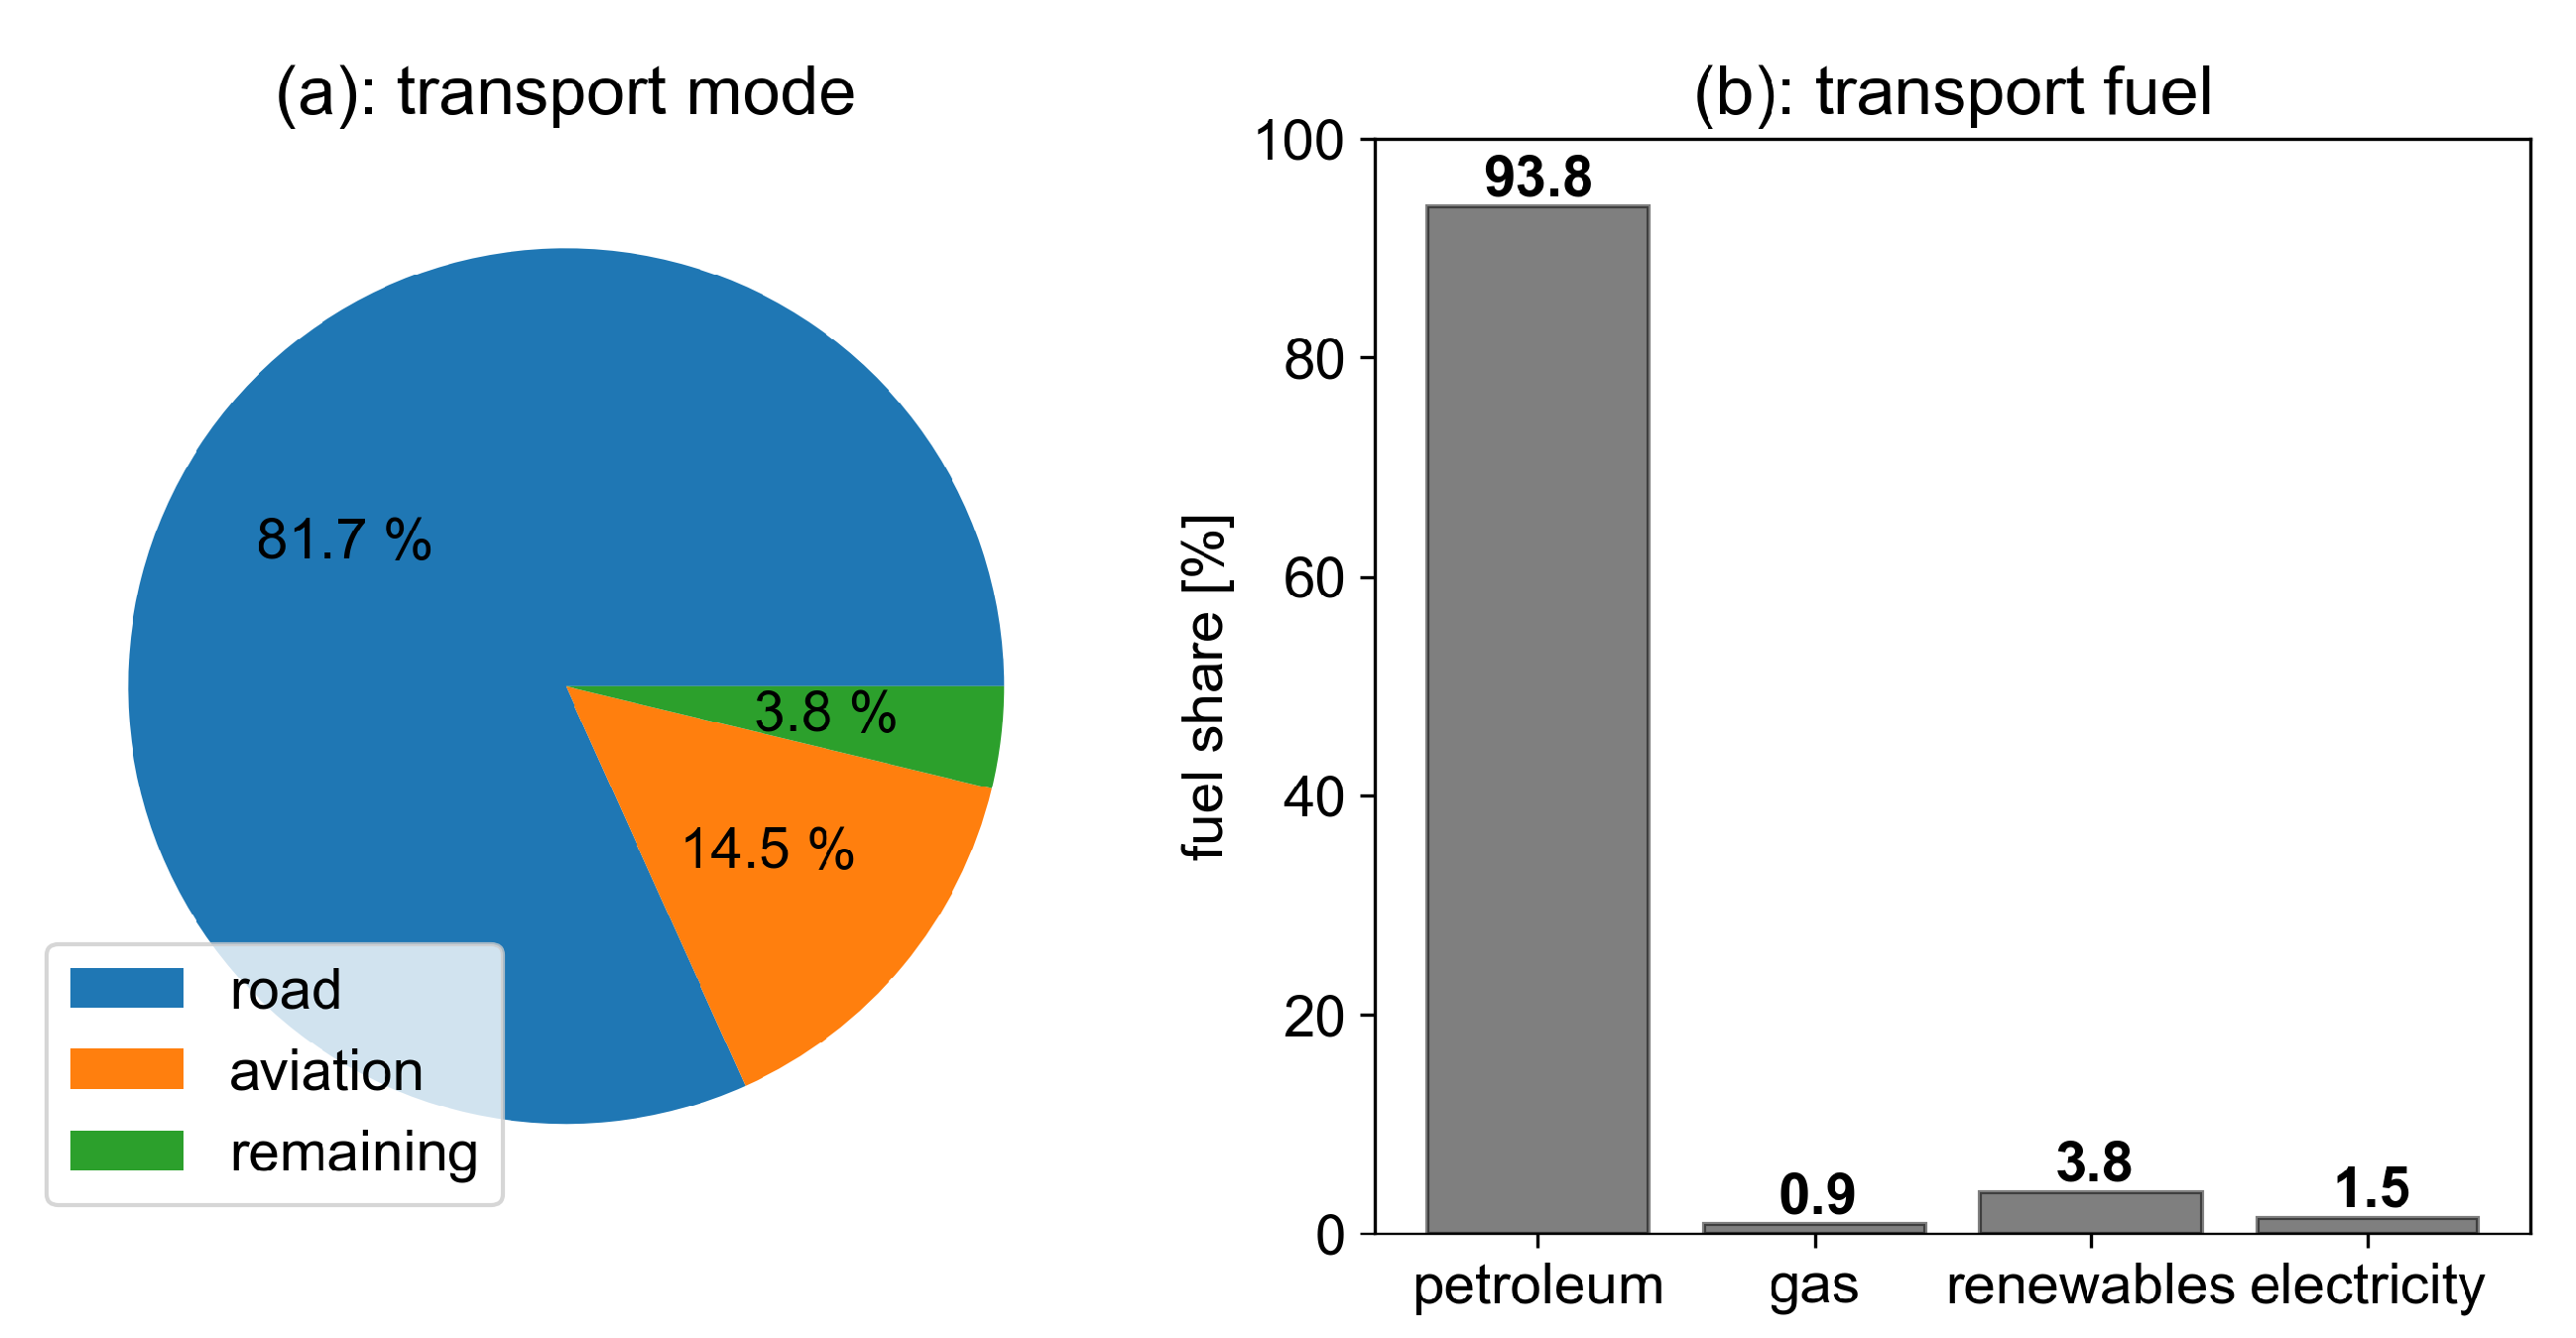
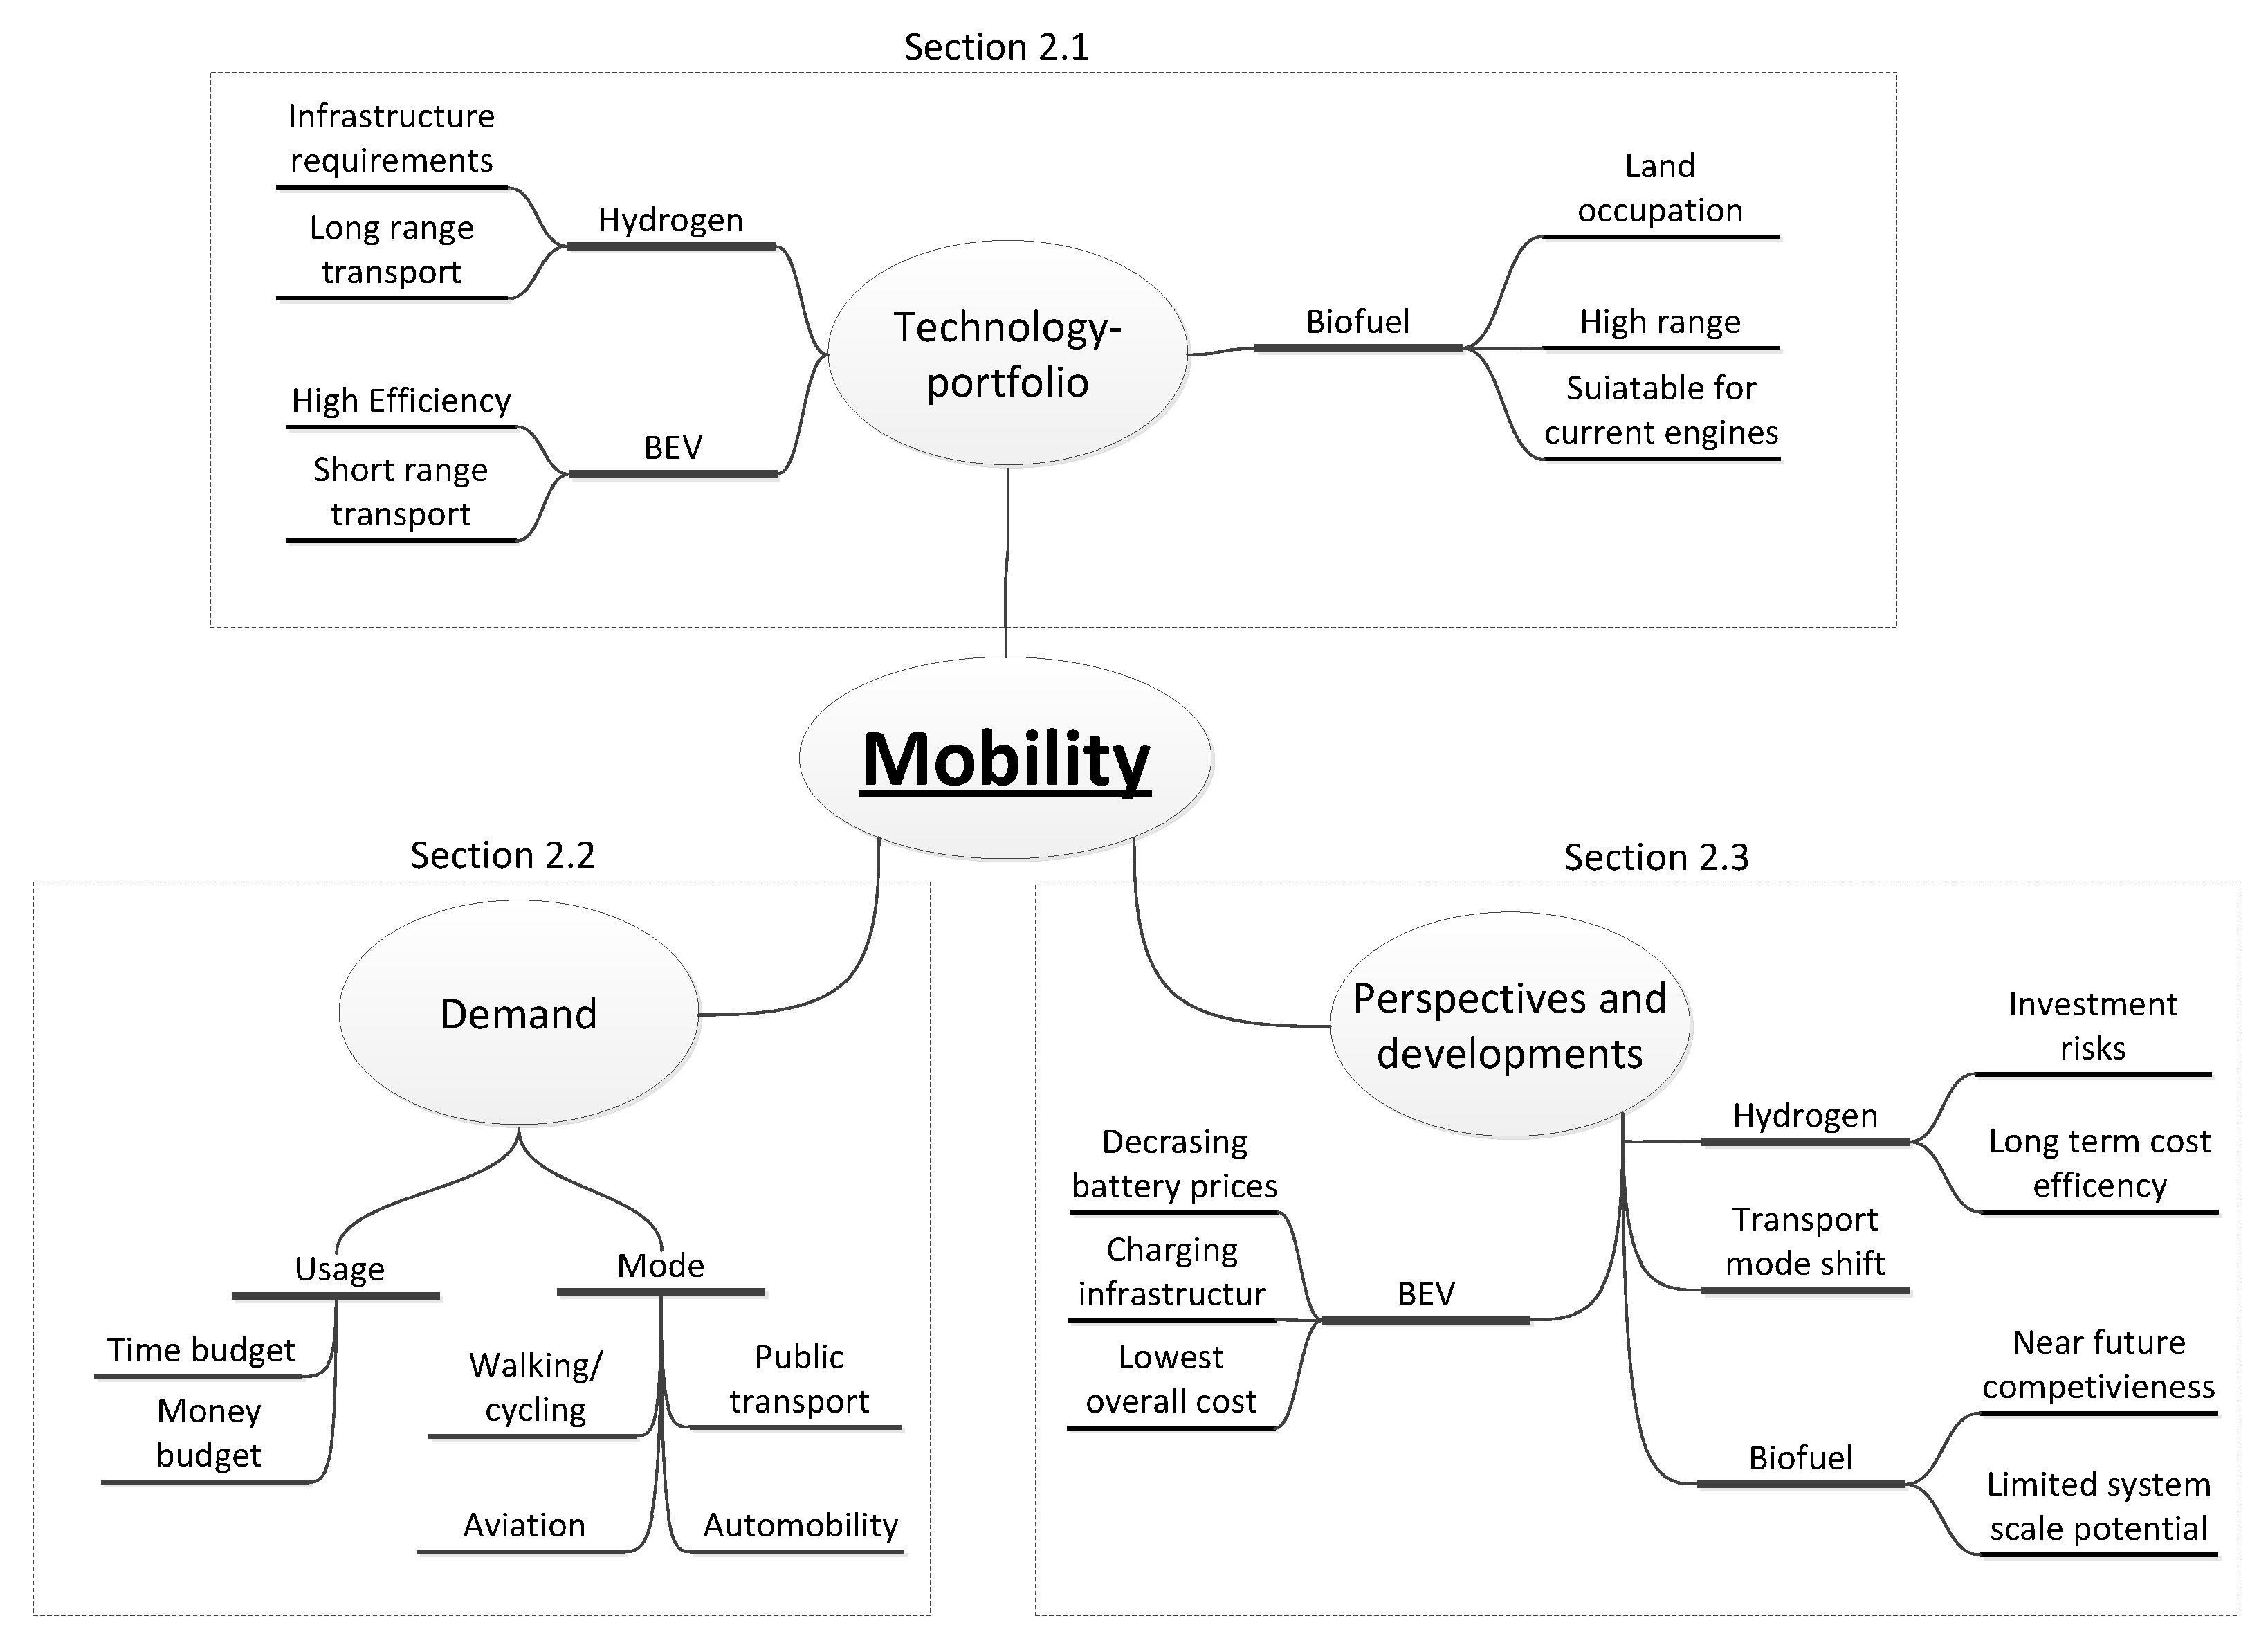
2. Mobility Sector
2.1. Technology Portfolio
2.2. Demand
2.3. Perspectives and Developments
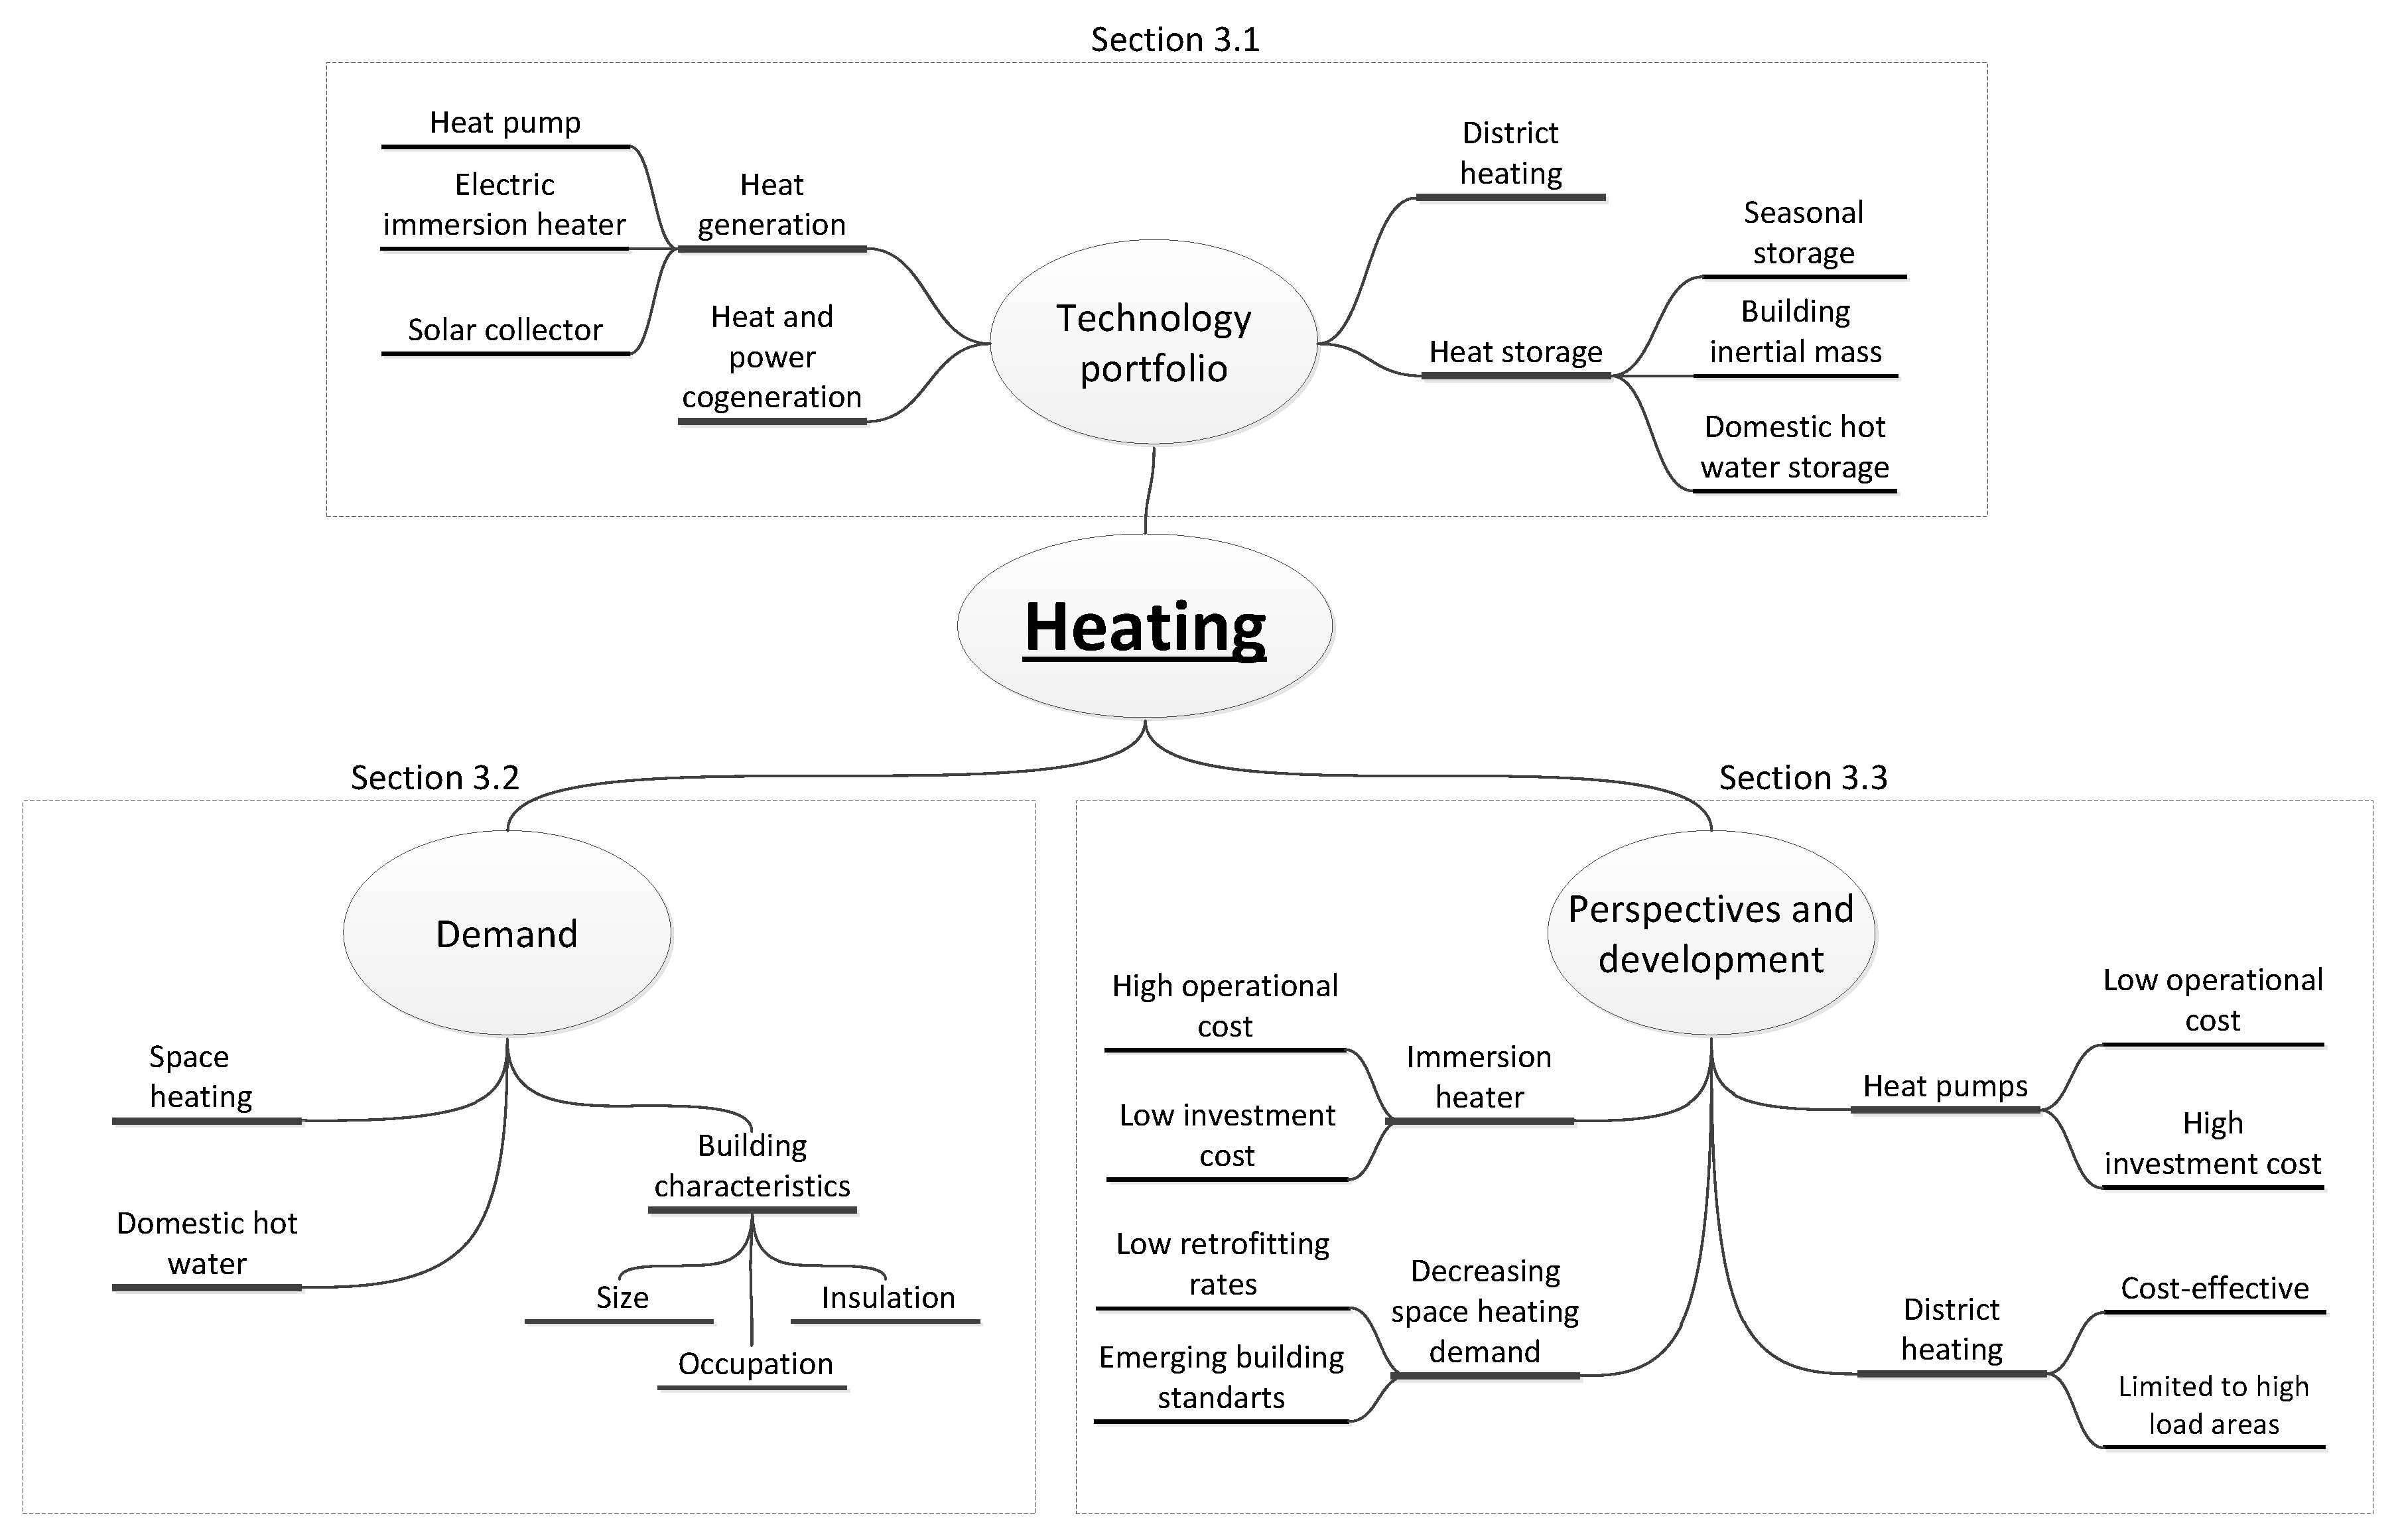
3. Heating Sector
3.1. Technology Portfolio
3.2. Demand
3.3. Perspectives and Developments
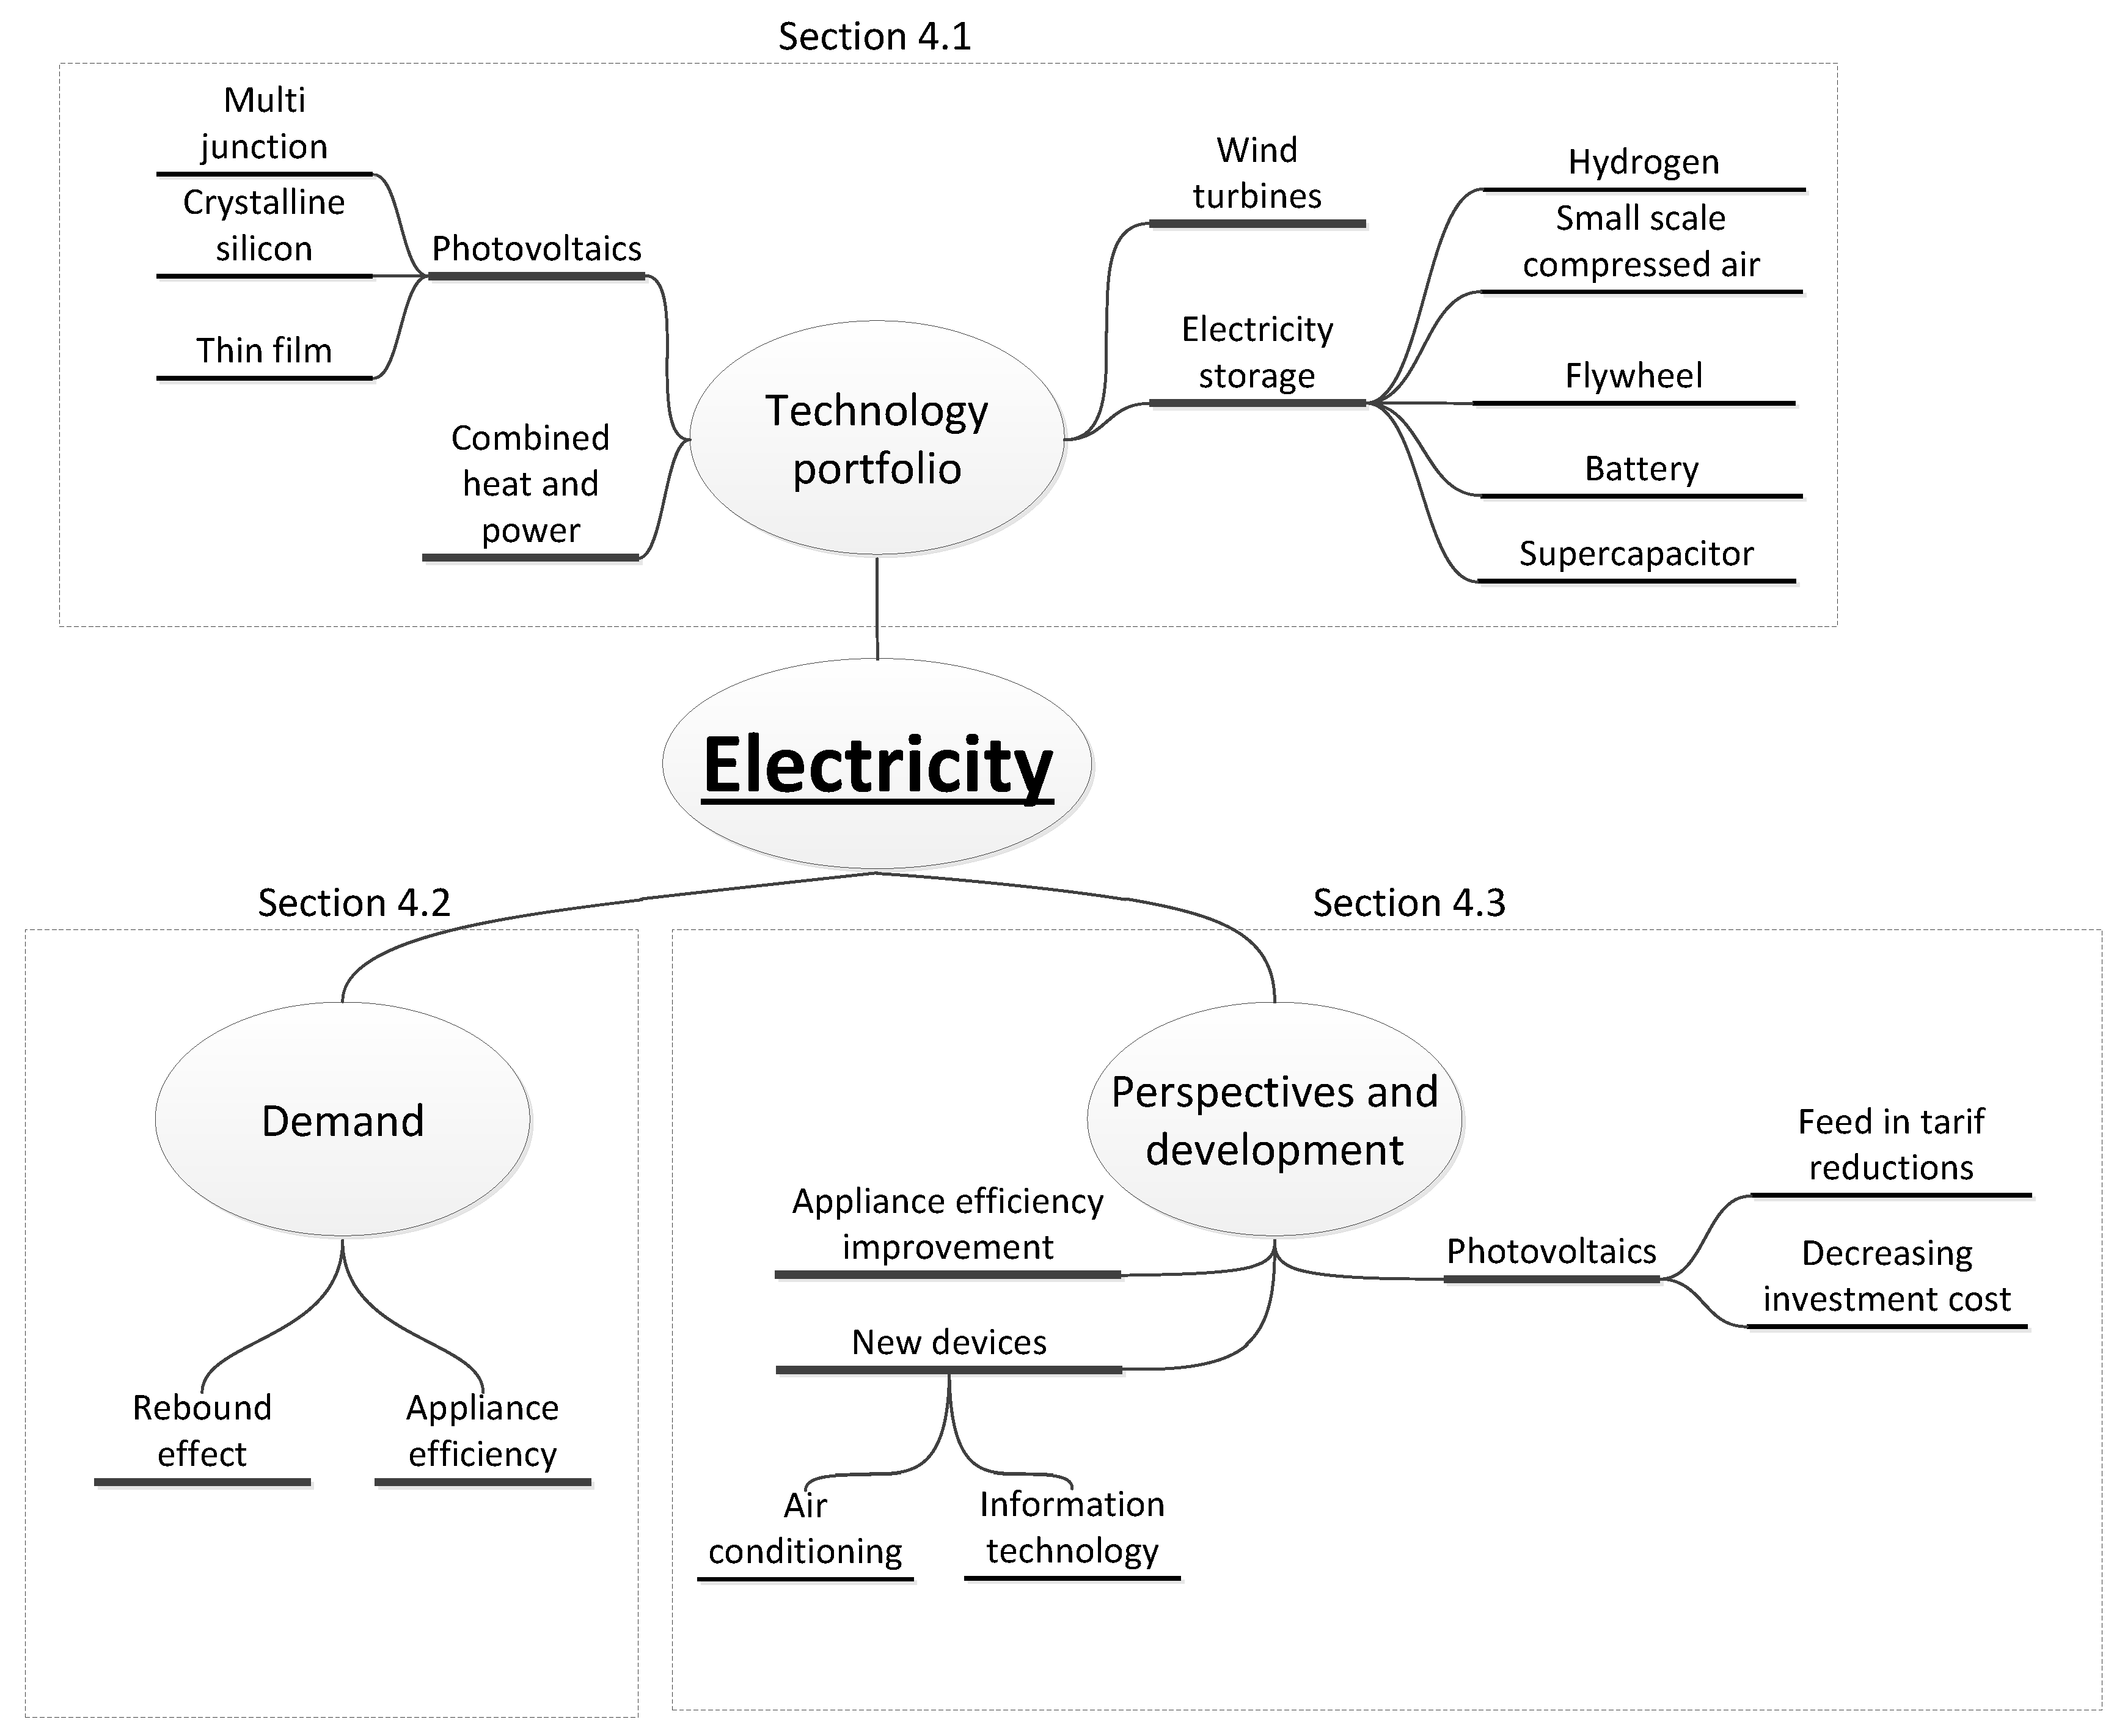
4. Electricity Sector
4.1. Technology Portfolio
4.2. Demand
4.3. Perspectives and Developments
5. Integration
5.1. Technology Coupling
5.2. Grid Structure and Operational Aspects
6. Morphological Analysis
6.1. Scenario Space
- M1 (BEV):
- Current individual mobility is completely replaced by electric mobility. Due to research and economics of scale, the battery prices decrease and BEVs become affordable to everyone.
- M2 (Hydrogen (local)):
- Hydrogen mobility is one of the much-researched technologies. Currently, vehicles are already available. Further development improves hydrogen production technology. Infrastructural development results in on-site production at residential sites to reduce transport infrastructure cost.
- M3 (Hydrogen (central):
- Hydrogen mobility is predominant. To achieve scaling effects, hydrogen will be produced in centralized, large-scale plants outside the district, resulting in no local electricity consumption for hydrogen production at the residential site. Utilizing biofuels would have the same effect due to external fuel production. They could be provided by large scale production of third generation biofuel.
- MD1 (Significant):
- In the urban environment, local public transport and bicycle traffic is pushed severely through the conversion of the urban infrastructure. This way, automobiles are no longe used for short distance traveling.
- MD2 (Minor):
- In the urban environment, local public transport and bicycle traffic is promoted by infrastructure improvement. However, automobiles are still frequently used for short distance traveling.
- MD3 (None):
- The local infrastructure is not adjusted at all. The automobile remains the primary mode of travel.
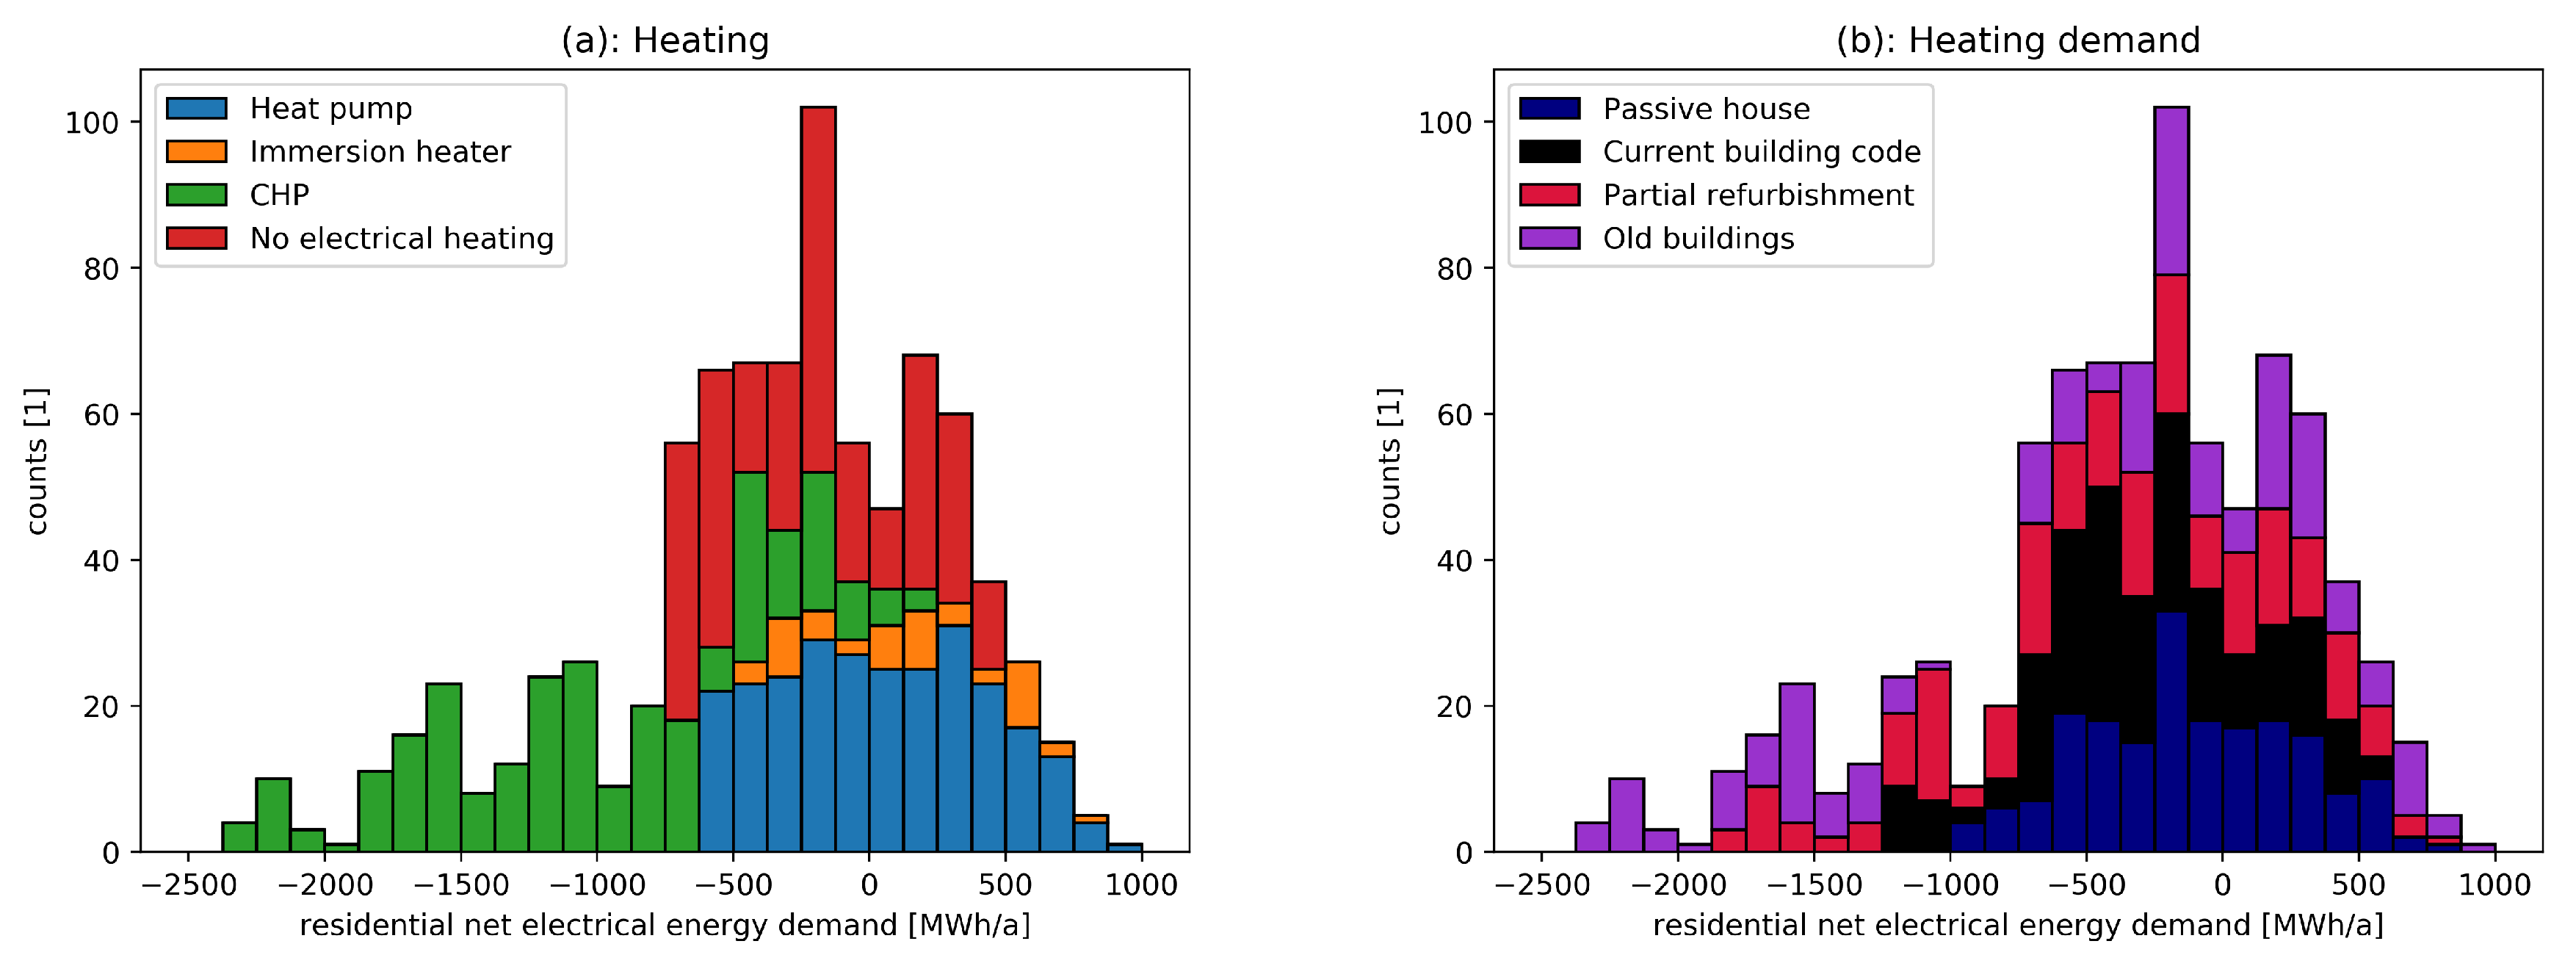
- H1 (Heat pump):
- Heat pumps are the primary technology for heat generation. They are considered to be the most effective technology for using electricity to provide heat and cost are reduced by scaling effects and technological improvement.
- H2 (Immersion heater):
- Advanced building insulation allows the use of fast heating elements. This enables the integration of large scale renewables by providing flexibility to the system.
- H3 (CHP):
- Mikro-CHP plants generate heat and power with high overall efficiency. In this scenario, they are widely installed. The required fuel originates from biomass, externally produced hydrogen, or synthetic natural gas. It is assumed that the CHP unit is operated in heat guided mode.
- H4 (No electrical heating):
- District heating systems, which utilize waste heat, provide cost-effective heat supply. Furthermore, they do not require significant energy, thus they are considered as no electrical heating technology. Another renewable, non-electric heating approach (from a residential grid perspective) is via power to gas utilization and gas heaters at the residential site.
- HD1 (Passive house):
- Thermal building isolation is severely pushed. The passive house standard is applied to every building of the considered district.
- HD2 (Current building code):
- Thermal building isolation is improved. Every building complies with the current building code. Older buildings are refurbished.
- HD3 (Partial refurbishment):
- Refurbishment significantly reduces the heat demand, due to buildings according to current building code. However, many buildings with old insulation are still inhabited.
- HD4 (Old building):
- Thermal insulation is not improved. Older houses are still in use without refurbishment.
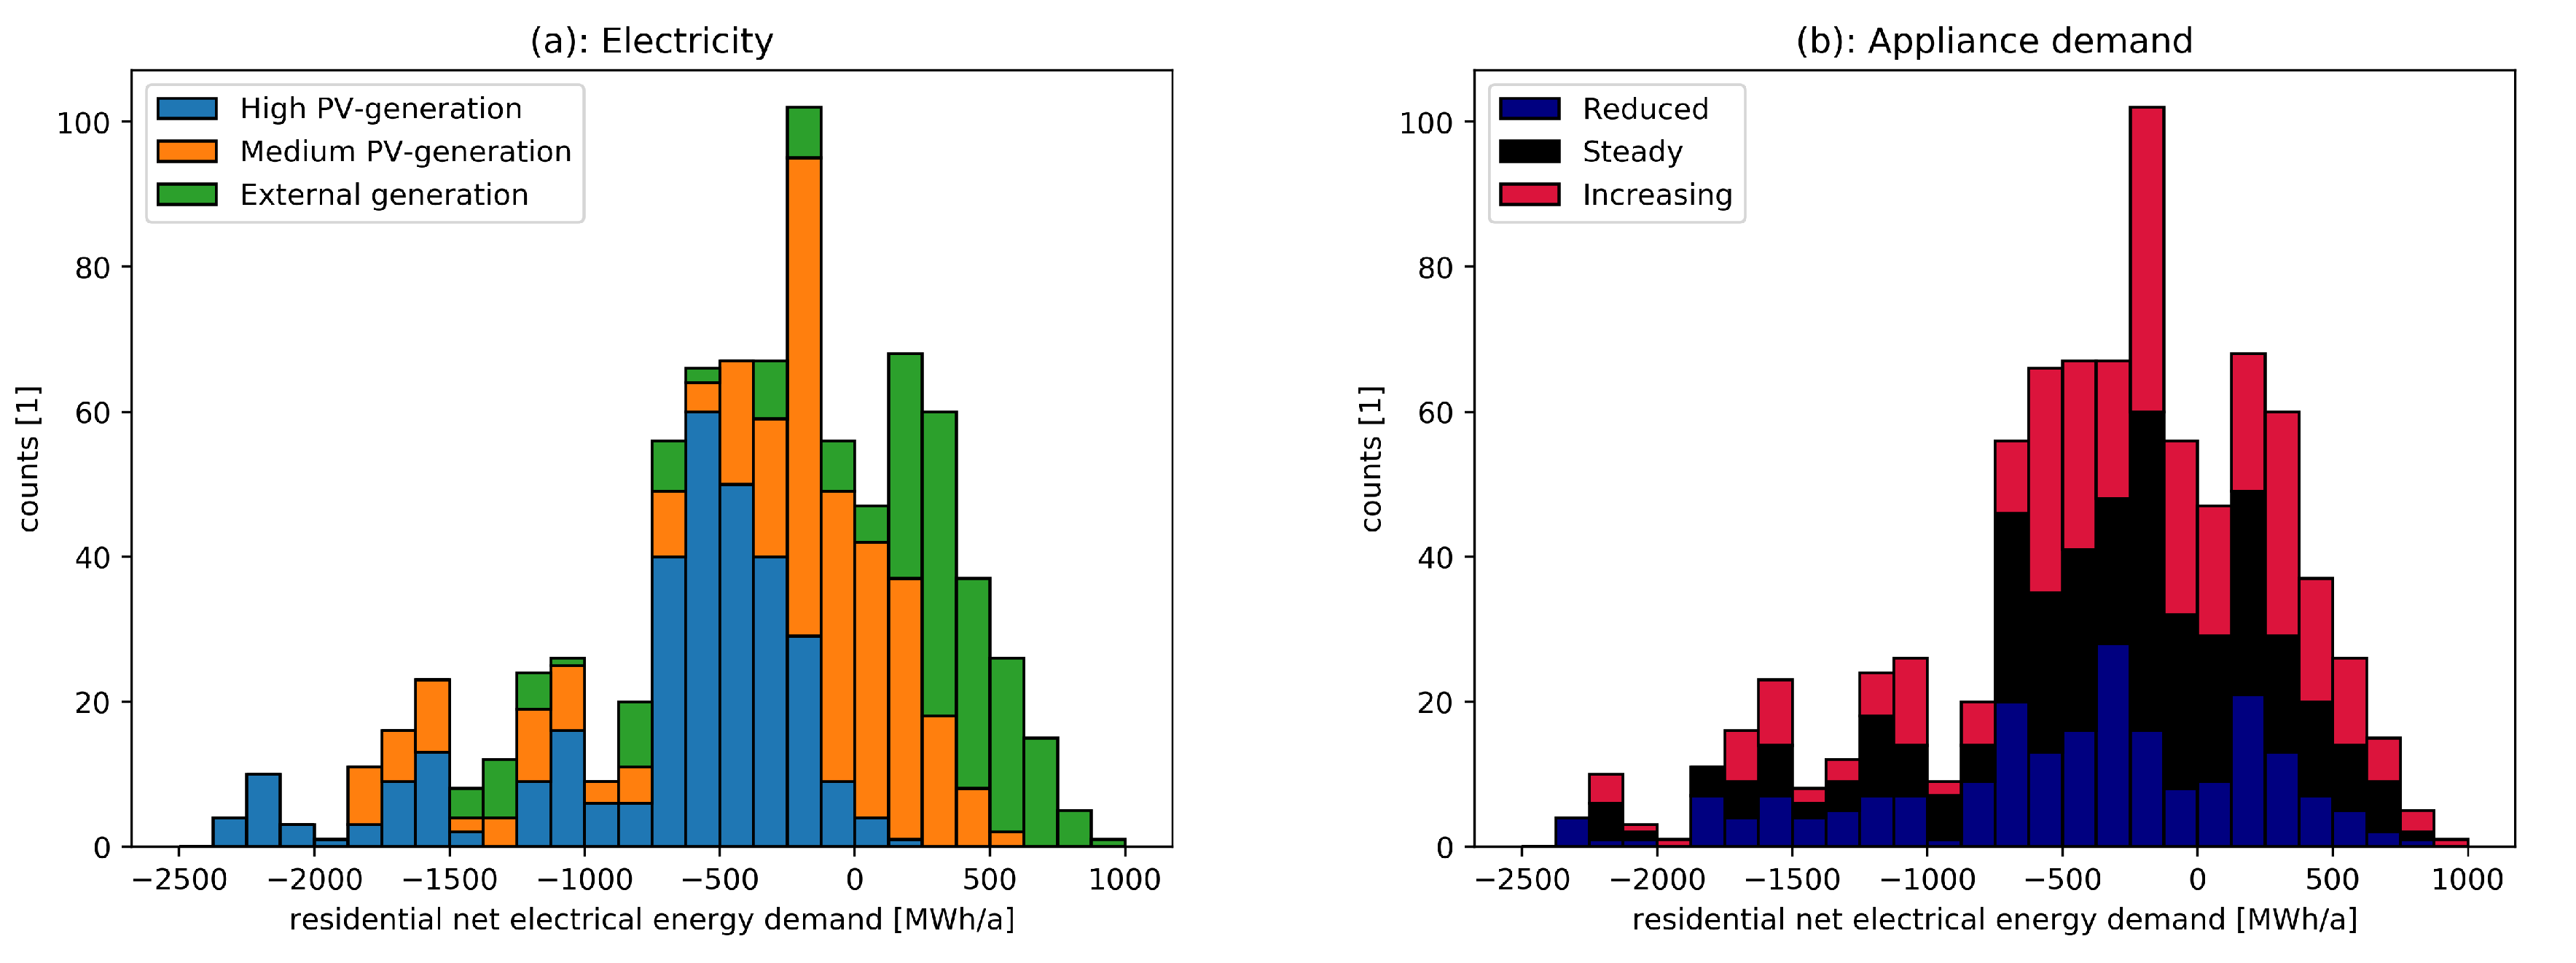
- E1 (High PV-generation):
- PV systems are the primary technology for generating electricity. Their installation is strongly supported. Even non-south-orientated rooftop areas and facades are used for PV-system installation.
- E2 (Medium PV-generation):
- PV-systems are common in districts. They are installed at rooftop areas with optimal properties regarding orientation and inclination.
- E3 (External generation):
- Electricity is not generated locally. Due to our focus on residential aspects, the specific energy source is out of scope for this hypothesis; for example large scale wind energy could be the primary generation technology.
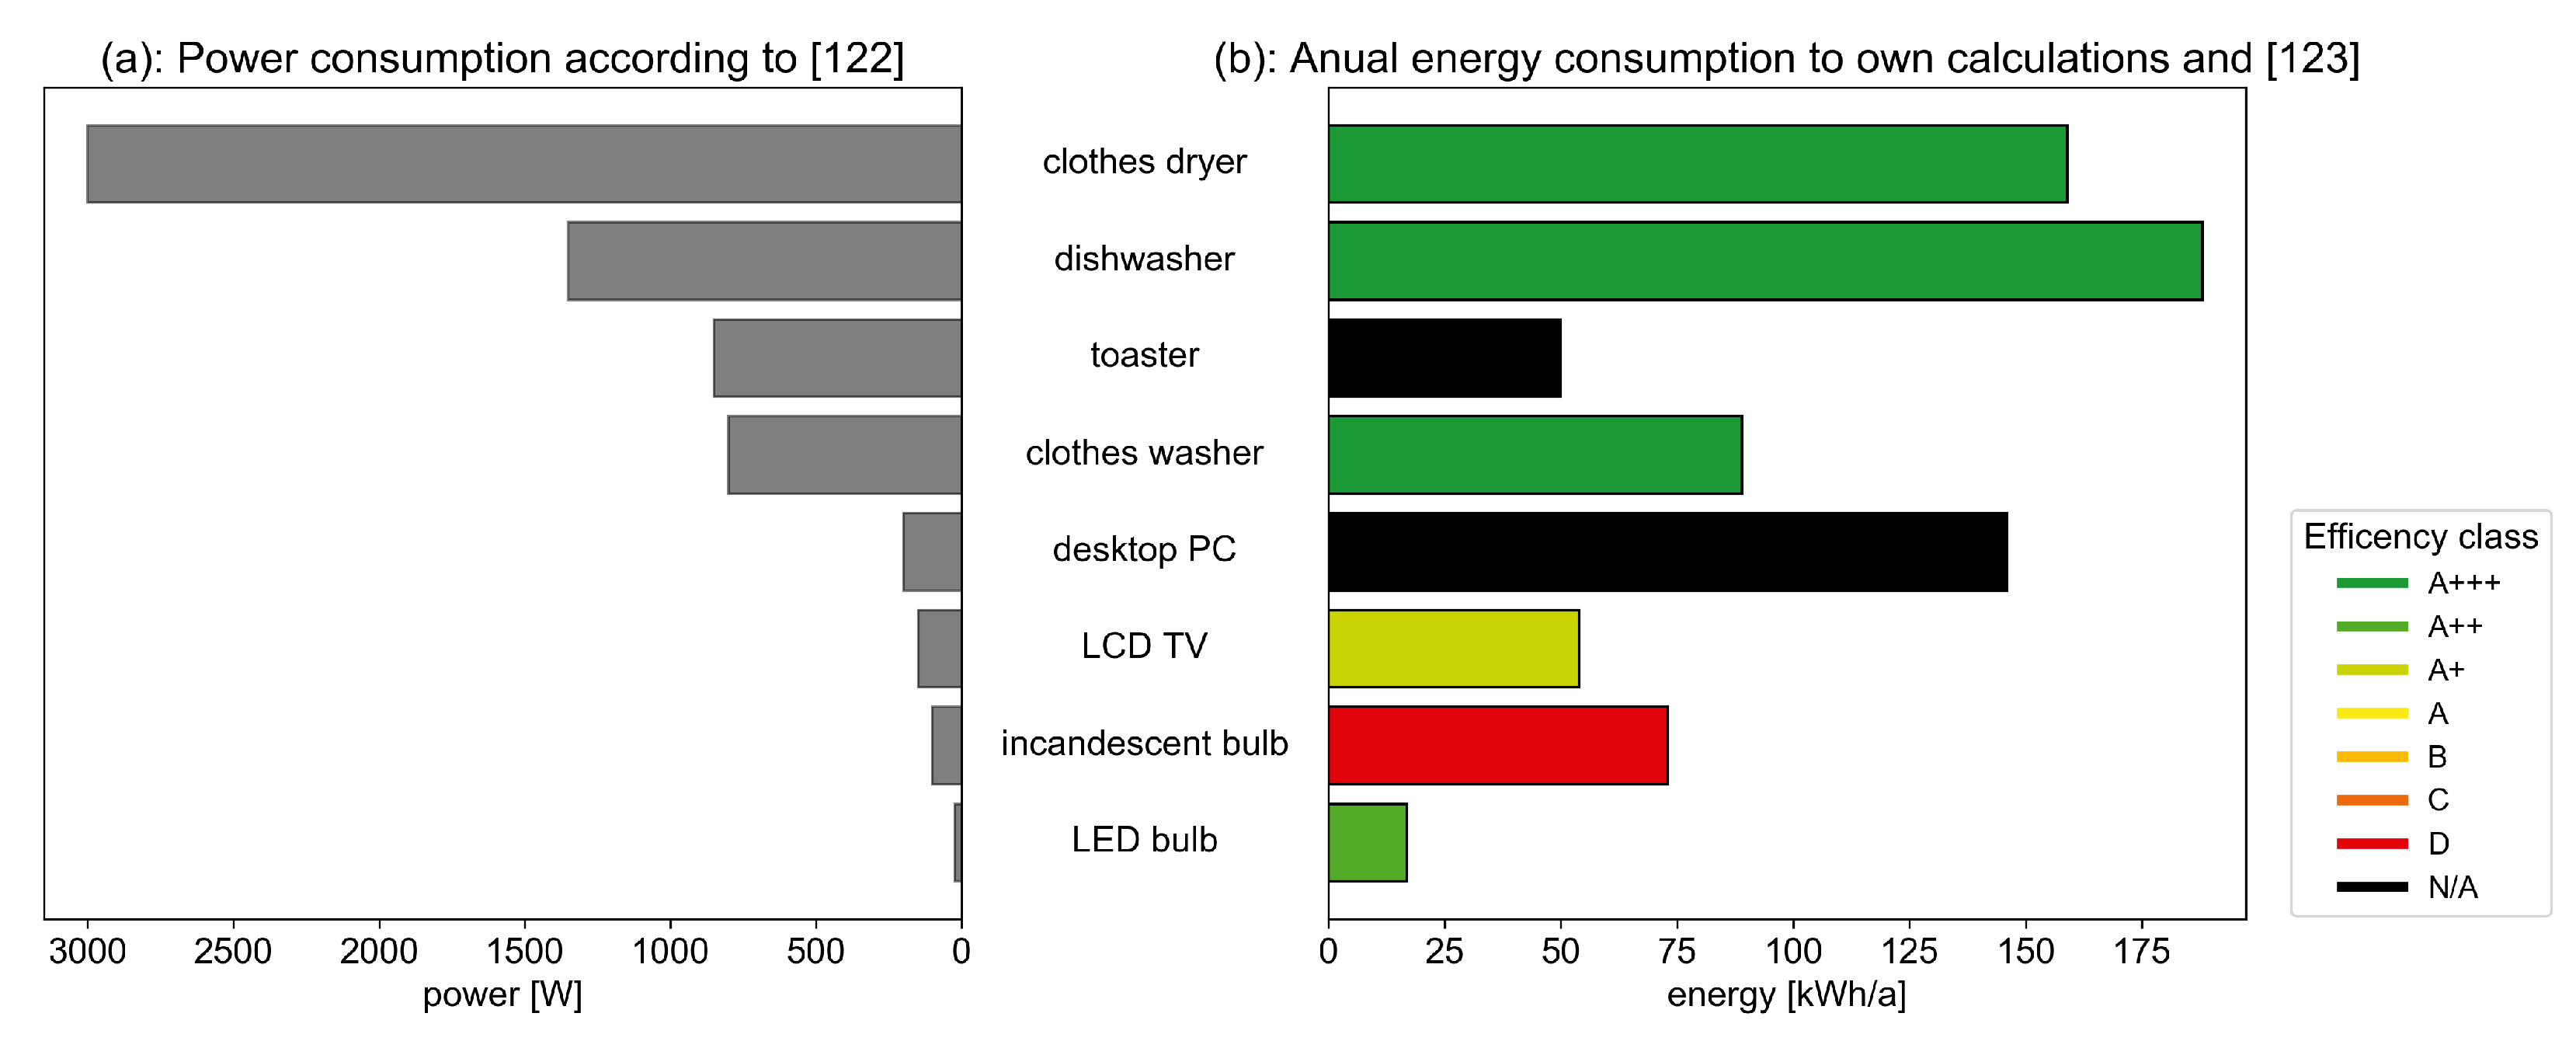
- ED1 (Reduced):
- Electric appliances continue to decrease in energy consumption. New devices will not consume significant amounts of electricity, thus the overall electricity demand decreases.
- ED2 (Steady):
- Appliances efficiency increases, although savings are invested into additional devices which mitigate the savings and, moreover, new technologies are added to the household which consume additional electricity. Overall, the electricity consumption of devices remains constant.
- ED3 (Increasing):
- Appliances efficiency improvements are minor because conversion from electricity to heat is already very efficient and many devices rely on electricity. Moreover, additional appliances are added, such as air conditioning and smart home technology.
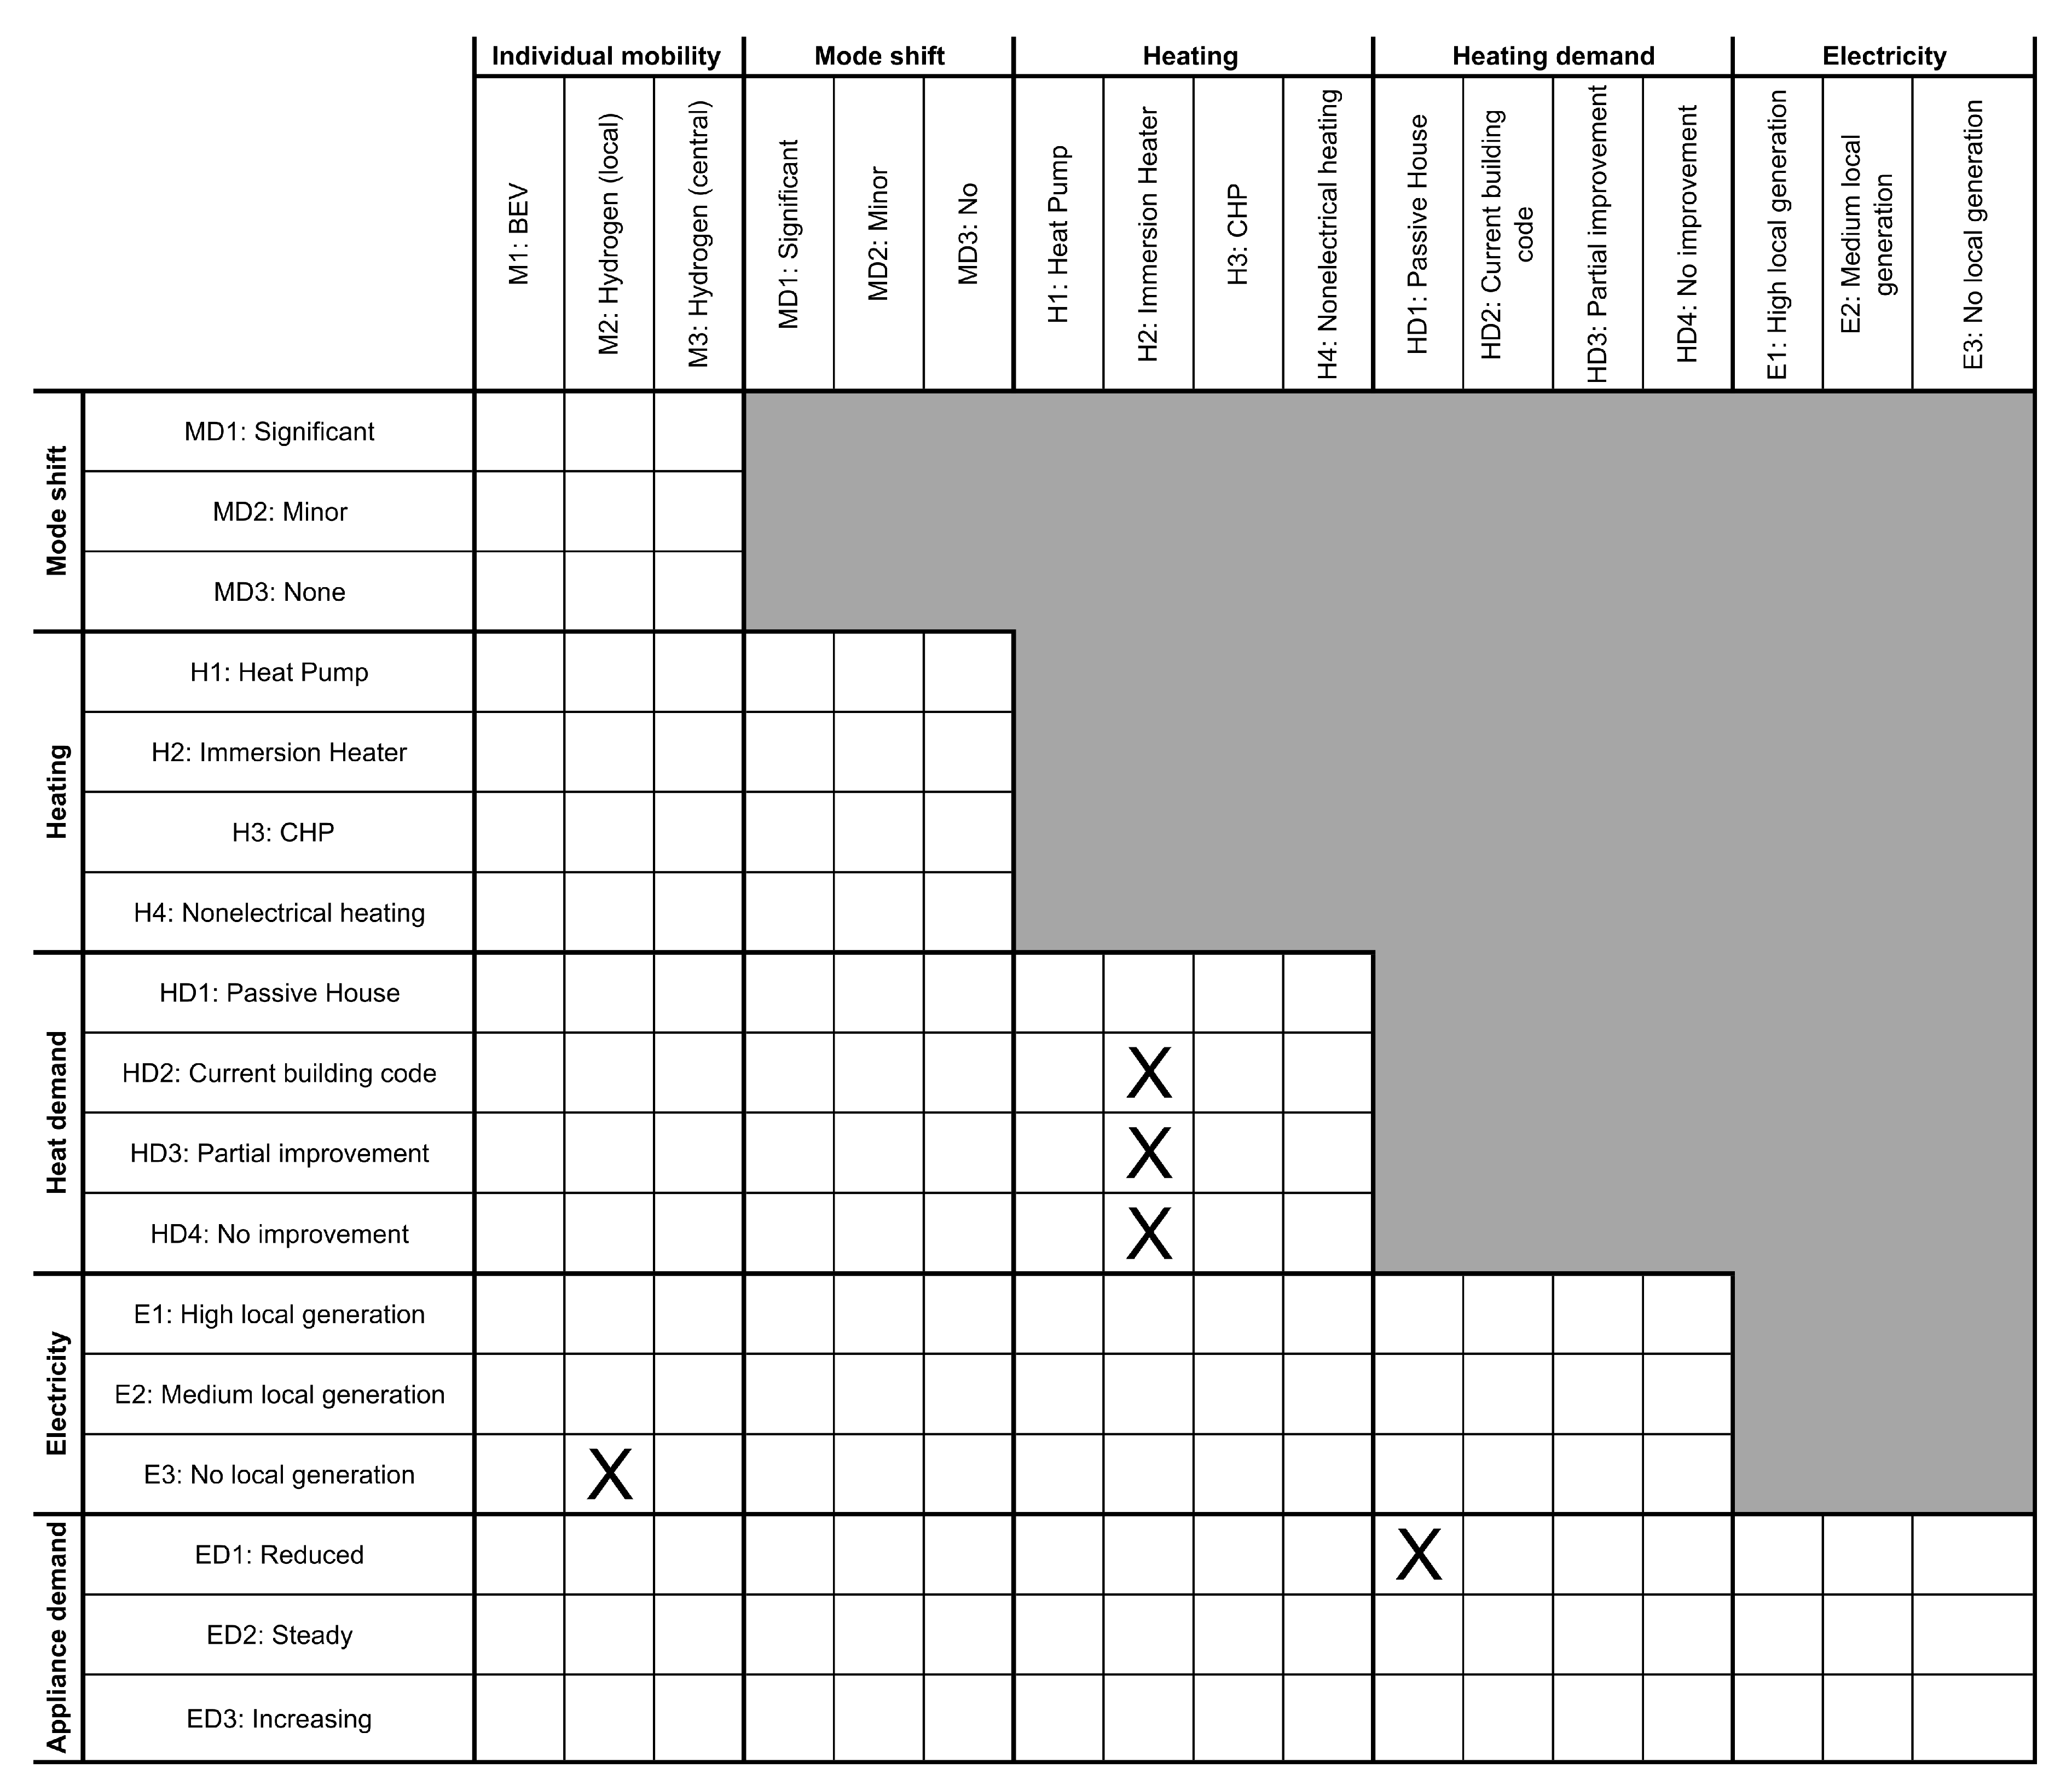
6.2. Scenario Space Pruning
- The immersion heater technology is assumed to be feasible only with low heat demand buildings to compensate for the low efficiency of immersion heaters. For this investigation, it is assumed that only the passive house is feasible to be combined with immersion heaters.
- The pair of device consumption improvement and passive house is not considered because additional air conditioning and ventilation due to building insulation require significant electrical energy.
- Local hydrogen production requires electricity for operation. Thus, if no generation is installed at a residential site, hydrogen production would be more effective closer to electricity producing facilities. Consequently, the combination of locally produced hydrogen for mobility and no local electricity generation is disregarded.
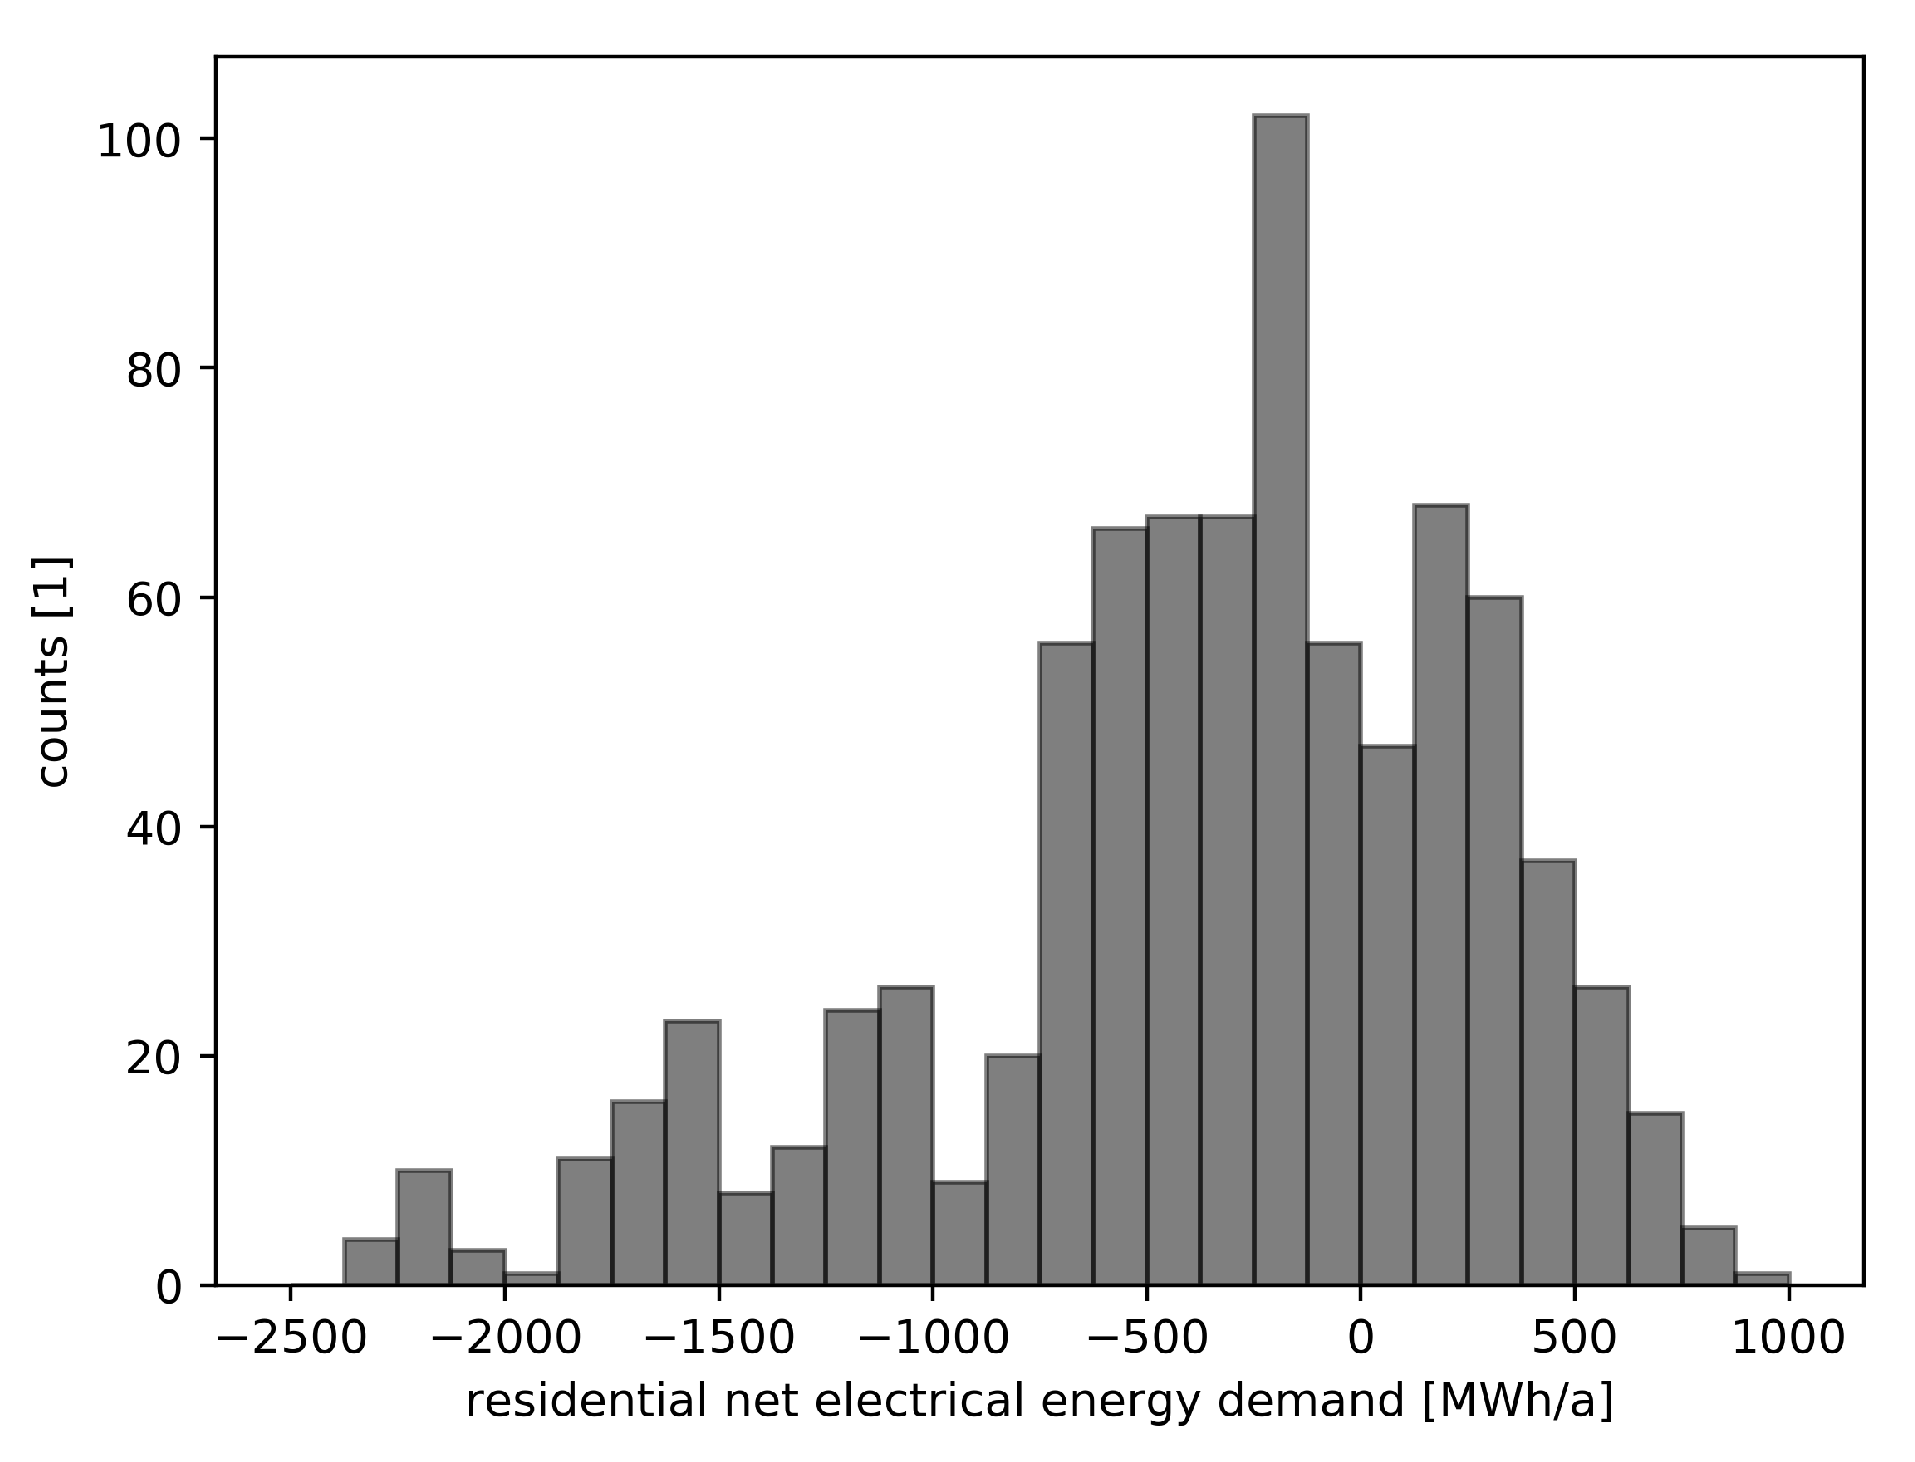
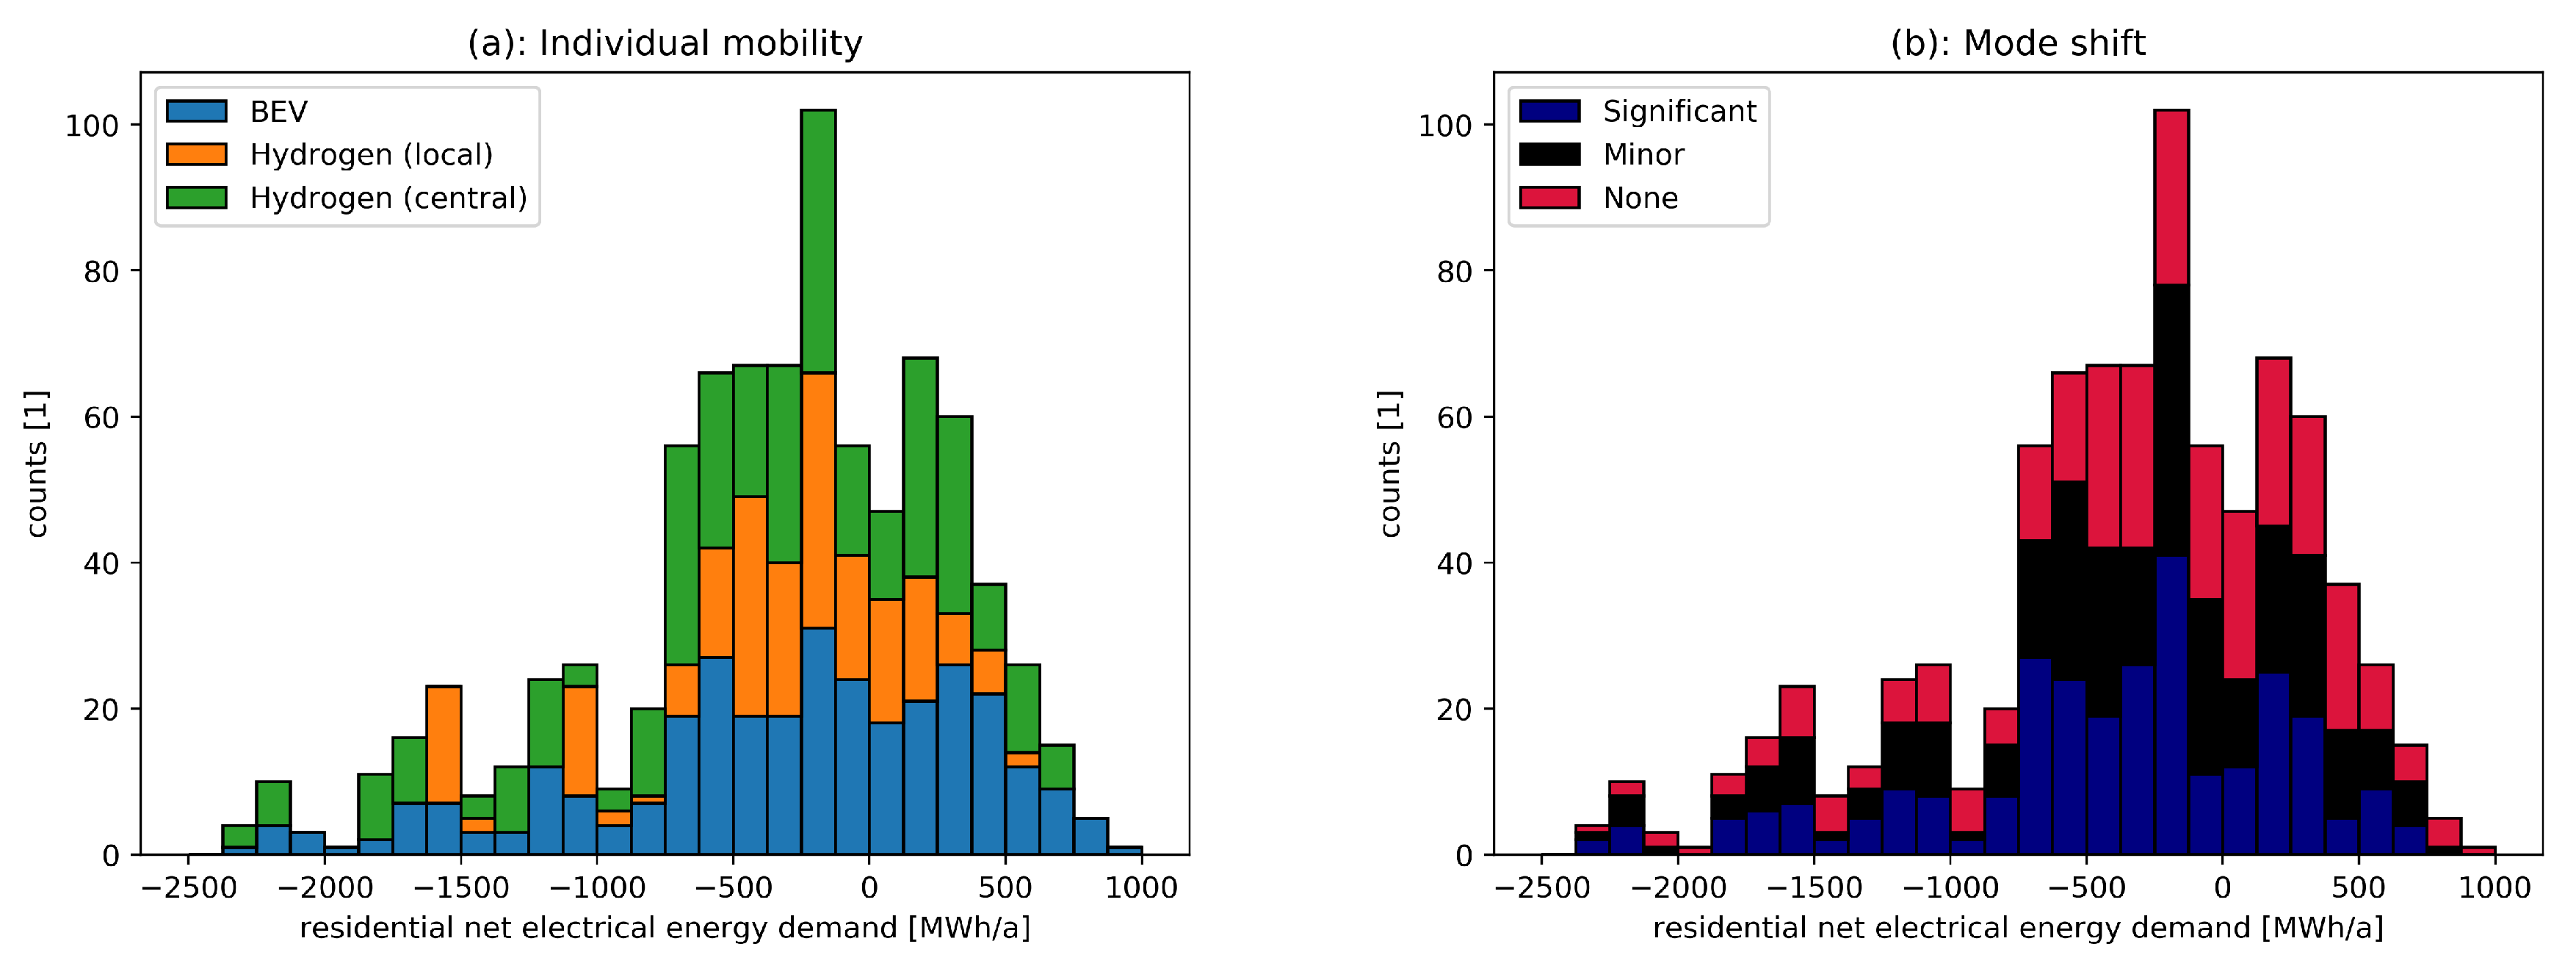
6.3. Scenario Space Evaluation
7. Conclusions
Author Contributions
Funding
Acknowledgments
Conflicts of Interest
References
- Energy Roadmap 2050. Available online: https://ec.europa.eu/energy/sites/ener/files/documents/2012_energy_roadmap_2050_en_0.pdf (accessed on 2 May 2019).
- Lund, H.; Mathiesen, B.V. Energy system analysis of 100% renewable energy systems—The case of Denmark in years 2030 and 2050. Energy 2009, 34, 524–531. [Google Scholar] [CrossRef]
- Mathiesen, B.V.; Lund, H.; Connolly, D.; Wenzel, H.; Østergaard, P.A.; Möller, B.; Nielsen, S.; Ridjan, I.; Karnøe, P.; Sperling, K.; et al. Smart Energy Systems for coherent 100% renewable energy and transport solutions. Appl. Energy 2015, 145, 139–154. [Google Scholar] [CrossRef]
- Jacobson, M.Z.; Delucchi, M.A.; Bauer, Z.A.; Goodman, S.C.; Chapman, W.E.; Cameron, M.A.; Bozonnat, C.; Chobadi, L.; Clonts, H.A.; Enevoldsen, P.; et al. 100% Clean and Renewable Wind, Water, and Sunlight All-Sector Energy Roadmaps for 139 Countries of the World. Joule 2017, 1, 108–121. [Google Scholar] [CrossRef]
- Hohmeyer, O.H.; Bohm, S. Trends toward 100% renewable electricity supply in Germany and Europe: A paradigm shift in energy policies. Wiley Interdiscip. Rev. Energy Environ. 2015, 4, 74–97. [Google Scholar] [CrossRef]
- Hoffert, M.I.; Caldeira, K.; Jain, A.K.; Haites, E.F.; Harvey, L.D.D.; Potter, S.D.; Schlesinger, M.E.; Schneider, S.H.; Watts, R.G.; Wigley, T.M.L.; et al. Energy implications of future stabilization of atmospheric CO2 content. Nature 1998, 395, 881. [Google Scholar] [CrossRef]
- Girardin, L.; Marechal, F.; Dubuis, M.; Calame-Darbellay, N.; Favrat, D. EnerGis: A geographical information based system for the evaluation of integrated energy conversion systems in urban areas. Energy 2010, 35, 830–840. [Google Scholar] [CrossRef]
- Mancarella, P.; Andersson, G.; Peças-Lopes, J.A.; Bell, K.R.W. Modelling of integrated multi-energy systems: Drivers, requirements, and opportunities. In Proceedings of the 2016 Power Systems Computation Conference (PSCC), Genoa, Italy, 20–24 June 2016; pp. 1–22. [Google Scholar] [CrossRef]
- Lund, H.; Østergaard, P.A.; Connolly, D.; Mathiesen, B.V. Smart energy and smart energy systems. Energy 2017, 137, 556–565. [Google Scholar] [CrossRef]
- Robinius, M.; Otto, A.; Heuser, P.; Welder, L.; Syranidis, K.; Ryberg, S.D.; Grube, T.; Markewitz, P.; Peters, R.; Stolten, D. Linking the Power and Transport Sectors—Part 1: The Principle of Sector Coupling. Energies 2017, 10, 956. [Google Scholar] [CrossRef]
- Scholz, Y.; Gils, H.C.; Pietzcker, R.C. Application of a high-detail energy system model to derive power sector characteristics at high wind and solar shares. Energy Econ. 2017, 64, 568–582. [Google Scholar] [CrossRef]
- Ueckerdt, F.; Pietzcker, R.; Scholz, Y.; Stetter, D.; Giannousakis, A.; Luderer, G. Decarbonizing global power supply under region-specific consideration of challenges and options of integrating variable renewables in the REMIND model. Energy Econ. 2017, 64, 665–684. [Google Scholar] [CrossRef]
- Beck, H.P.; von Haaren, C.; Kuck, J.; Rode, M.; Ahmels, J.; Dossola, F.; Hingst, J.; Kaiser, F.; Kruse, A.; Palmas, C.; et al. Szenarien zur Energieversorgung in Niedersachsen im Jahr 2050: Gutachten; Niedersachsisches Ministerium fur Umwelt, Energie und Klimaschutz: Hannover, Germany, 2016. [Google Scholar]
- Brown, T.; Bischof-Niemz, T.; Blok, K.; Breyer, C.; Lund, H.; Mathiesen, B. Response to ‘Burden of proof: A comprehensive review of the feasibility of 100 renewable-electricity systems’. Renew. Sustain. Energy Rev. 2018, 92, 834–847. [Google Scholar] [CrossRef]
- Bui, V.; Hussain, A.; Kim, H. A Multiagent-Based Hierarchical Energy Management Strategy for Multi-Microgrids Considering Adjustable Power and Demand Response. IEEE Trans. Smart Grid 2018, 9, 1323–1333. [Google Scholar] [CrossRef]
- Kok, J.K.; Warmer, C.J.; Kamphuis, I.G. PowerMatcher: multiagent control in the electricity infrastructure. In Proceedings of the 4th International Conference on Autonomous Agents and Multiagent Systems (AAMAS 2005), Utrecht, The Netherlands, 25–29 July 2005. [Google Scholar] [CrossRef]
- Arcos-Aviles, D.; Pascual, J.; Marroyo, L.; Sanchis, P.; Guinjoan, F. Fuzzy Logic-Based Energy Management System Design for Residential Grid-Connected Microgrids. IEEE Trans. Smart Grid 2018, 9, 530–543. [Google Scholar] [CrossRef]
- Talha, M.; Saeed, M.S.; Mohiuddin, G.; Ahmad, M.; Nazar, M.J.; Javaid, N. Energy Optimization in Home Energy Management System Using Artificial Fish Swarm Algorithm and Genetic Algorithm. In Advances in Intelligent Networking and Collaborative Systems; Barolli, L., Woungang, I., Hussain, O.K., Eds.; Springer International Publishing: Berlin/Heidelberg, Germany, 2017; pp. 203–213. [Google Scholar]
- Eurostat. Energy Balance Sheets 2016 Data-2018 Edition; Publications Office of the European Union: Luxembourg, 2018.
- Wüstenhagen, R.; Wolsink, M.; Bürer, M.J. Social acceptance of renewable energy innovation: An introduction to the concept. Energy Policy 2007, 35, 2683–2691. [Google Scholar] [CrossRef]
- Colangelo, G.; Favale, E.; Miglietta, P.; de Risi, A. Innovation in flat solar thermal collectors: A review of the last ten years experimental results. Renew. Sustain. Energy Rev. 2016, 57, 1141–1159. [Google Scholar] [CrossRef]
- Fischer, D.; Madani, H. On heat pumps in smart grids: A review. Renew. Sustain. Energy Rev. 2017, 70, 342–357. [Google Scholar] [CrossRef]
- Pacheco, R.; Ordóñez, J.; Martínez, G. Energy efficient design of building: A review. Renew. Sustain. Energy Rev. 2012, 16, 3559–3573. [Google Scholar] [CrossRef]
- Khan, J.; Arsalan, M.H. Solar power technologies for sustainable electricity generation—A review. Renew. Sustain. Energy Rev. 2016, 55, 414–425. [Google Scholar] [CrossRef]
- Henning, H.M.; Umbach, E.; Drake, F.D.; Fischedick, M.; Haucap, J.; Hübner, G.; Münch, W.; Pittel, K.; Rehtanz, C.; Sauer, J.; et al. Sektorkopplung–Optionen fur die nächste Phase der Energiewende; acatech–Deutsche Akademie der Technikwissenschaften: Munich, Germany, 2017. [Google Scholar]
- Pietzcker, R.C.; Longden, T.; Chen, W.; Fu, S.; Kriegler, E.; Kyle, P.; Luderer, G. Long-term transport energy demand and climate policy: Alternative visions on transport decarbonization in energy-economy models. Energy 2014, 64, 95–108. [Google Scholar] [CrossRef]
- Gröger, O.; Gasteiger, H.A.; Suchsland, J.P. Review—Electromobility: Batteries or Fuel Cells? J. Electrochem. Soc. 2015, 162, A2605–A2622. [Google Scholar] [CrossRef]
- Ligen, Y.; Vrubel, H.; Girault, H.H. Mobility from Renewable Electricity: Infrastructure Comparison for Battery and Hydrogen Fuel Cell Vehicles. World Electr. Veh. J. 2018, 9, 3. [Google Scholar] [CrossRef]
- Bergthorson, J.M.; Thomson, M.J. A review of the combustion and emissions properties of advanced transportation biofuels and their impact on existing and future engines. Renew. Sustain. Energy Rev. 2015, 42, 1393–1417. [Google Scholar] [CrossRef]
- Bentsen, N.S.; Jack, M.W.; Felby, C.; Thorsen, B.J. Allocation of biomass resources for minimising energy system greenhouse gas emissions. Energy 2014, 69, 506–515. [Google Scholar] [CrossRef]
- Gelfand, I.; Sahajpal, R.; Zhang, X.; Izaurralde, R.C.; Gross, K.L.; Robertson, G.P. Sustainable bioenergy production from marginal lands in the US Midwest. Nature 2013, 493, 514. [Google Scholar] [CrossRef]
- Mohr, A.; Raman, S. Lessons from first generation biofuels and implications for the sustainability appraisal of second generation biofuels. Energy Policy 2013, 63, 114–122. [Google Scholar] [CrossRef]
- Sims, R.E.H.; Mabee, W.; Saddler, J.N.; Taylor, M. An overview of second generation biofuel technologies. Bioresour. Technol. 2010, 101, 1570–1580. [Google Scholar] [CrossRef]
- Lee, R.A.; Lavoie, J.M. From first- to third-generation biofuels: Challenges of producing a commodity from a biomass of increasing complexity. Anim. Front. 2013, 3, 6–11. [Google Scholar] [CrossRef]
- Moody, J.W.; McGinty, C.M.; Quinn, J.C. Global evaluation of biofuel potential from microalgae. Proc. Natl. Acad. Sci. USA 2014, 111, 8691–8696. [Google Scholar] [CrossRef]
- Clarens, A.F.; Resurreccion, E.P.; White, M.A.; Colosi, L.M. Environmental Life Cycle Comparison of Algae to Other Bioenergy Feedstocks. Environ. Sci. Technol. 2010, 44, 1813–1819. [Google Scholar] [CrossRef]
- Aro, E.M. From first generation biofuels to advanced solar biofuels. Ambio 2016, 45, 24–31. [Google Scholar] [CrossRef]
- Ochoa Bique, A.; Zondervan, E. An outlook towards hydrogen supply chain networks in 2050—Design of novel fuel infrastructures in Germany. Chem. Eng. Res. Des. 2018, 134, 90–103. [Google Scholar] [CrossRef]
- Yoshida, T.; Kojima, K. Toyota MIRAI Fuel Cell Vehicle and Progress Toward a Future Hydrogen Society. Interface Mag. 2015, 24, 45–49. [Google Scholar] [CrossRef]
- Gurz, M.; Baltacioglu, E.; Hames, Y.; Kaya, K. The meeting of hydrogen and automotive: A review. Int. J. Hydrog. Energy 2017, 42, 23334–23346. [Google Scholar] [CrossRef]
- Ball, M.; Weeda, M. The hydrogen economy—Vision or reality? Int. J. Hydrog. Energy 2015, 40, 7903–7919. [Google Scholar] [CrossRef]
- Goldmann, A.; Sauter, W.; Oettinger, M.; Kluge, T.; Schröder, U.; Seume, R.J.; Friedrichs, J.; Dinkelacker, F. A Study on Electrofuels in Aviation. Energies 2018, 11, 392. [Google Scholar] [CrossRef]
- Schafer, A. The global demand for motorized mobility. Transp. Res. Part A Policy Pract. 1998, 32, 455–477. [Google Scholar] [CrossRef]
- Schafer, A.; Victor, D.G. Global passenger travel: implications for carbon dioxide emissions. Energy 1999, 24, 657–679. [Google Scholar] [CrossRef]
- Millard-Ball, A.; Schipper, L. Are We Reaching Peak Travel? Trends in Passenger Transport in Eight Industrialized Countries. Transp. Rev. 2011, 31, 357–378. [Google Scholar] [CrossRef]
- Buehler, R.; Pucher, J.; Gerike, R.; Götschi, T. Reducing car dependence in the heart of Europe: lessons from Germany, Austria, and Switzerland. Transp. Rev. 2017, 37, 4–28. [Google Scholar] [CrossRef]
- Brown, T.; Schlachtberger, D.; Kies, A.; Schramm, S.; Greiner, M. Synergies of sector coupling and transmission reinforcement in a cost-optimised, highly renewable European energy system. Energy 2018, 160, 720–739. [Google Scholar] [CrossRef]
- Stamenkovic, V.R.; Strmcnik, D.; Lopes, P.P.; Markovic, N.M. Energy and fuels from electrochemical interfaces. Nat. Mater. 2016, 16, 57. [Google Scholar] [CrossRef] [PubMed]
- Connolly, D.; Mathiesen, B.V.; Ridjan, I. A comparison between renewable transport fuels that can supplement or replace biofuels in a 100% renewable energy system. Energy 2014, 73, 110–125. [Google Scholar] [CrossRef]
- Nykvist, B.; Nilsson, M. Rapidly falling costs of battery packs for electric vehicles. Nat. Clim. Chang. 2015, 5, 329. [Google Scholar] [CrossRef]
- Schmidt, O.; Hawkes, A.; Gambhir, A.; Staffell, I. The future cost of electrical energy storage based on experience rates. Nat. Energy 2017, 2, 17110. [Google Scholar] [CrossRef]
- Kittner, N.; Lill, F.; Kammen, D.M. Energy storage deployment and innovation for the clean energy transition. Nat. Energy 2017, 2, 17125. [Google Scholar] [CrossRef]
- Festel, G.; Würmseher, M.; Rammer, C.; Boles, E.; Bellof, M. Modelling production cost scenarios for biofuels and fossil fuels in Europe. J. Clean. Prod. 2014, 66, 242–253. [Google Scholar] [CrossRef]
- Elliott, D.C.; Biller, P.; Ross, A.B.; Schmidt, A.J.; Jones, S.B. Hydrothermal liquefaction of biomass: Developments from batch to continuous process. Bioresour. Technol. 2015, 178, 147–156. [Google Scholar] [CrossRef]
- Mustapha, W.F.; Bolkesjø, T.F.; Martinsen, T.; Trømborg, E. Techno-economic comparison of promising biofuel conversion pathways in a Nordic context—Effects of feedstock costs and technology learning. Energy Convers. Manag. 2017, 149, 368–380. [Google Scholar] [CrossRef]
- Dehghani Madvar, M.; Aslani, A.; Ahmadi, M.H.; Karbalaie Ghomi, N.S. Current status and future forecasting of biofuels technology development. Int. J. Energy Res. 2019, 43, 1142–1160. [Google Scholar] [CrossRef]
- Khan, M.I.; Shin, J.H.; Kim, J.D. The promising future of microalgae: current status, challenges, and optimization of a sustainable and renewable industry for biofuels, feed, and other products. Microb. Cell Factories 2018, 17, 36. [Google Scholar] [CrossRef]
- Sinigaglia, T.; Lewiski, F.; Santos Martins, M.E.; Mairesse Siluk, J.C. Production, storage, fuel stations of hydrogen and its utilization in automotive applications-a review. Int. J. Hydrog. Energy 2017, 42, 24597–24611. [Google Scholar] [CrossRef]
- Reuß, M.; Grube, T.; Robinius, M.; Preuster, P.; Wasserscheid, P.; Stolten, D. Seasonal storage and alternative carriers: A flexible hydrogen supply chain model. Appl. Energy 2017, 200, 290–302. [Google Scholar] [CrossRef]
- Behrendt, F. Why cycling matters for electric mobility: towards diverse, active and sustainable e-mobilities. Mobilities 2018, 13, 64–80. [Google Scholar] [CrossRef]
- Gebhardt, L.; Krajzewicz, D.; Oostendorp, R.; Goletz, M.; Greger, K.; Klötzke, M.; Wagner, P.; Heinrichs, D. Intermodal Urban Mobility: Users, Uses, and Use Cases. Transp. Res. Procedia 2016, 14, 1183–1192. [Google Scholar] [CrossRef]
- Kammerlander, M.; Schanes, K.; Hartwig, F.; Jäger, J.; Omann, I.; O’Keeffe, M. A resource-efficient and sufficient future mobility system for improved well-being in Europe. Eur. J. Futur. Res. 2015, 3, 8. [Google Scholar] [CrossRef]
- König, A.; Grippenkoven, J. From public mobility on demand to autonomous public mobility on demand -Learning from dial-a-ride services in Germany. In Logistik und Supply Chain Management; University of Bamberg Press: Bamberg, Germany, 2017; pp. 295–305. [Google Scholar]
- Edelenbosch, O.Y.; McCollum, D.L.; van Vuuren, D.P.; Bertram, C.; Carrara, S.; Daly, H.; Fujimori, S.; Kitous, A.; Kyle, P.; Ó Broin, E.; et al. Decomposing passenger transport futures: Comparing results of global integrated assessment models. Transp. Res. Part D Transp. Environ. 2017, 55, 281–293. [Google Scholar] [CrossRef]
- Ürge Vorsatz, D.; Cabeza, L.F.; Serrano, S.; Barreneche, C.; Petrichenko, K. Heating and cooling energy trends and drivers in buildings. Renew. Sustain. Energy Rev. 2015, 41, 85–98. [Google Scholar] [CrossRef]
- Connolly, D.; Lund, H.; Mathiesen, B. Smart Energy Europe: The technical and economic impact of one potential 100% renewable energy scenario for the European Union. Renew. Sustain. Energy Rev. 2016, 60, 1634–1653. [Google Scholar] [CrossRef]
- Sabiha, M.A.; Saidur, R.; Mekhilef, S.; Mahian, O. Progress and latest developments of evacuated tube solar collectors. Renew. Sustain. Energy Rev. 2015, 51, 1038–1054. [Google Scholar] [CrossRef]
- Kalogirou, S.A. Solar thermal collectors and applications. Prog. Energy Combust. Sci. 2004, 30, 231–295. [Google Scholar] [CrossRef]
- Rodríguez-Hidalgo, M.C.; Rodríguez-Aumente, P.A.; Lecuona, A.; Legrand, M.; Ventas, R. Domestic hot water consumption vs. solar thermal energy storage: The optimum size of the storage tank. Appl. Energy 2012, 97, 897–906. [Google Scholar] [CrossRef]
- Wang, Y.; Shukla, A.; Liu, S. A state of art review on methodologies for heat transfer and energy flow characteristics of the active building envelopes. Renew. Sustain. Energy Rev. 2017, 78, 1102–1116. [Google Scholar] [CrossRef]
- Nielsen, M.G.; Morales, J.M.; Zugno, M.; Pedersen, T.E.; Madsen, H. Economic valuation of heat pumps and electric boilers in the Danish energy system. Appl. Energy 2016, 167, 189–200. [Google Scholar] [CrossRef]
- Sternberg, A.; Bardow, A. Power-to-What?—Environmental assessment of energy storage systems. Energy Environ. Sci. 2015, 8, 389–400. [Google Scholar] [CrossRef]
- Gudmundsson, O.; Thorsen, J.E.; Zhang, L. Cost analysis of district heating compared to its competing technologies. Wit Trans. Ecol. Environ. 2013, 1, 3–13. [Google Scholar] [CrossRef]
- Lund, H.; Østergaard, P.A.; Chang, M.; Werner, S.; Svendsen, S.; Sorknæs, P.; Thorsen, J.E.; Hvelplund, F.; Mortensen, B.O.G.; Mathiesen, B.V.; et al. The status of 4th generation district heating: Research and results. Energy 2018, 164, 147–159. [Google Scholar] [CrossRef]
- David, A.; Mathiesen, B.V.; Averfalk, H.; Werner, S.; Lund, H. Heat Roadmap Europe: Large-Scale Electric Heat Pumps in District Heating Systems. Energies 2017, 10, 578. [Google Scholar] [CrossRef]
- Arnaudo, M.; Zaalouk, O.A.; Topel, M.; Laumert, B. Techno-economic Analysis Of Integrated Energy Systems At Urban District Level—A Swedish Case Study. Energy Procedia 2018, 149, 286–296. [Google Scholar] [CrossRef]
- Martinez, S.; Michaux, G.; Salagnac, P.; Bouvier, J.L. Micro-combined heat and power systems (micro-CHP) based on renewable energy sources. Energy Convers. Manag. 2017, 154, 262–285. [Google Scholar] [CrossRef]
- Dodds, P.E.; Staffell, I.; Hawkes, A.D.; Li, F.; Grünewald, P.; McDowall, W.; Ekins, P. Hydrogen and fuel cell technologies for heating: A review. Int. J. Hydrog. Energy 2015, 40, 2065–2083. [Google Scholar] [CrossRef]
- Alipour, M.; Zare, K.; Mohammadi-Ivatloo, B. Short-term scheduling of combined heat and power generation units in the presence of demand response programs. Energy 2014, 71, 289–301. [Google Scholar] [CrossRef]
- Nazari-Heris, M.; Abapour, S.; Mohammadi-Ivatloo, B. Optimal economic dispatch of FC-CHP based heat and power micro-grids. Appl. Therm. Eng. 2017, 114, 756–769. [Google Scholar] [CrossRef]
- Pereira da Cunha, J.; Eames, P. Thermal energy storage for low and medium temperature applications using phase change materials—A review. Appl. Energy 2016, 177, 227–238. [Google Scholar] [CrossRef]
- Ibrahim, N.I.; Khan, M.M.A.; Mahbubul, I.M.; Saidur, R.; Al-Sulaiman, F.A. Experimental testing of the performance of a solar absorption cooling system assisted with ice-storage for an office space. Energy Convers. Manag. 2017, 148, 1399–1408. [Google Scholar] [CrossRef]
- Pardo, P.; Deydier, A.; Anxionnaz-Minvielle, Z.; Rougé, S.; Cabassud, M.; Cognet, P. A review on high temperature thermochemical heat energy storage. Renew. Sustain. Energy Rev. 2014, 32, 591–610. [Google Scholar] [CrossRef]
- Hedegaard, K.; Mathiesen, B.V.; Lund, H.; Heiselberg, P. Wind power integration using individual heat pumps—Analysis of different heat storage options. Energy 2012, 47, 284–293. [Google Scholar] [CrossRef]
- Lanahan, M.; Tabares-Velasco, C.P. Seasonal Thermal-Energy Storage: A Critical Review on BTES Systems, Modeling, and System Design for Higher System Efficiency. Energies 2017, 10, 743. [Google Scholar] [CrossRef]
- Pérez-Lombard, L.; Ortiz, J.; Pout, C. A review on buildings energy consumption information. Energy Build. 2008, 40, 394–398. [Google Scholar] [CrossRef]
- Rüttenauer, T. Neighbours matter: A nation-wide small-area assessment of environmental inequality in Germany. Soc. Sci. Res. 2018, 70, 198–211. [Google Scholar] [CrossRef]
- Harvey, L.D.D. Recent Advances in Sustainable Buildings: Review of the Energy and Cost Performance of the State-of-the-Art Best Practices from Around the World. Annu. Rev. Environ. Resour. 2013, 38, 281–309. [Google Scholar] [CrossRef]
- Guillén-Lambea, S.; Rodríguez-Soria, B.; Marín, J.M. Review of European ventilation strategies to meet the cooling and heating demands of nearly zero energy buildings (nZEB)/Passivhaus. Comparison with the USA. Renew. Sustain. Energy Rev. 2016, 62, 561–574. [Google Scholar] [CrossRef]
- Jennings, M.; Hirst, N.; Gambhir, A. Reduction of Carbon Dioxide Emissions in the Global Building Sector to 2050; Grantham Institute for Climate Change: London, UK, 2011. [Google Scholar]
- Weiss, J.; Dunkelberg, E.; Vogelpohl, T. Improving policy instruments to better tap into homeowner refurbishment potential: Lessons learned from a case study in Germany. Energy Policy 2012, 44, 406–415. [Google Scholar] [CrossRef]
- Diefenbach, N.; Cischinsky, H.; Rodenfels, M.; Clausnitzer, K.D. Datenbasis Gebäudebestand Datenerhebung zur energetischen Qualität und zu den Modernisierungstrends im deutschen Wohngebäudebestand; Institut für Wohnen und Umwelt GmbH: Darmstadt, Germany, 2010. [Google Scholar]
- Ahmed, K.; Pylsy, P.; Kurnitski, J. Monthly domestic hot water profiles for energy calculation in Finnish apartment buildings. Energy Build. 2015, 97, 77–85. [Google Scholar] [CrossRef]
- Ahmed, K.; Pylsy, P.; Kurnitski, J. Hourly consumption profiles of domestic hot water for different occupant groups in dwellings. Sol. Energy 2016, 137, 516–530. [Google Scholar] [CrossRef]
- Hofmeister, M. Technology Data for Energy Plants for Electricity and District Heating Generation, Chapter 40 and 41; Danish Energy Agency: Copenhagen, Denmark, 2016. [Google Scholar]
- Ellabban, O.; Abu-Rub, H.; Blaabjerg, F. Renewable energy resources: Current status, future prospects and their enabling technology. Renew. Sustain. Energy Rev. 2014, 39, 748–764. [Google Scholar] [CrossRef]
- Staffell, I.; Green, R. The cost of domestic fuel cell micro-CHP systems. Int. J. Hydrog. Energy 2013, 38, 1088–1102. [Google Scholar] [CrossRef]
- Buttler, A.; Spliethoff, H. Current status of water electrolysis for energy storage, grid balancing and sector coupling via power-to-gas and power-to-liquids: A review. Renew. Sustain. Energy Rev. 2018, 82, 2440–2454. [Google Scholar] [CrossRef]
- Nitsch, J.; Pregger, T.; Naegler, T.; Heide, D.; de Tena, D.L.; Trieb, F.; Scholz, Y.; Nienhaus, K.; Gerhardt, N.; Sterner, M.; et al. Langfristszenarien und Strategien für den Ausbau der erneuerbaren Energien in Deutschland bei Berücksichtigung der Entwicklung in Europa und global (Leitstudie 2011—Schlussbericht an das BMU); Deutsches Zentrum für Luft- und Raumfahrt, Fraunhofer-Institut für Windenergie und Energiesystemtechnik, Ingenieurbüro für neue Energien: Stuttgart, Germany, 2012. [Google Scholar]
- Ahshan, R.; Al-Badi, A.; Hosseinzadeh, N.; Shafiq, M. Small Wind Turbine Systems for Application in Oman. In Proceedings of the 2018 5th International Conference on Electric Power and Energy Conversion Systems (EPECS), Kitakyushu, Japan, 23–25 April 2018; pp. 1–6. [Google Scholar] [CrossRef]
- Kolanowski, B.R. Small-Scale Cogeneration Handbook, 2nd ed.; Fairmont Press: Lilburn, Georgia, 2003. [Google Scholar]
- Weniger, J.; Tjaden, T.; Quaschning, V. Sizing of Residential PV Battery Systems. Energy Procedia 2014, 46, 78–87. [Google Scholar] [CrossRef]
- Borenstein, S. Private Net Benefits of Residential Solar PV: The Role of Electricity Tariffs, Tax Incentives, and Rebates. J. Assoc. Environ. Resour. 2017, 4, S85–S122. [Google Scholar] [CrossRef]
- Chapman, A.J.; McLellan, B.; Tezuka, T. Residential solar PV policy: An analysis of impacts, successes and failures in the Australian case. Renew. Energy 2016, 86, 1265–1279. [Google Scholar] [CrossRef]
- Wirth, H. Recent Facts about Photovoltaics in Germany; Fraunhofer ISE: Freiburg im Breisgau, Germany, 2018. [Google Scholar]
- Ghazali, A.; Salleh, E.I.; Haw, L.C.; Mat, S.; Sopian, K. Feasibility of vertical photovoltaic system on high-rise building in Malaysia: performance evaluation. Int. J. Low-Carbon Technol. 2017, 12, 263–271. [Google Scholar] [CrossRef][Green Version]
- Becerra, M.; Morán, J.; Jerez, A.; Cepeda, F.; Valenzuela, M. Wind energy potential in Chile: Assessment of a small scale wind farm for residential clients. Energy Convers. Manag. 2017, 140, 71–90. [Google Scholar] [CrossRef]
- Tummala, A.; Velamati, R.K.; Sinha, D.K.; Indraja, V.; Krishna, V.H. A review on small scale wind turbines. Renew. Sustain. Energy Rev. 2016, 56, 1351–1371. [Google Scholar] [CrossRef]
- Eckel, H.; Hartmann, S.; Eggersglüß, W. Wirtschaftlichkeit von kleinen Windenergieanlagen; Kuratorium für Technik und Bauwesen in der Landwirtschaft e. V. (KTBL): Darmstadt, Germany, 2012. [Google Scholar]
- Karl, B.; Gösta, B.; Gabriella, E.; Mats, E.N. Infrasound and low frequency noise from wind turbines: Exposure and health effects. Environ. Res. Lett. 2011, 6, 035103. [Google Scholar]
- Berger, R.G.; Ashtiani, P.; Ollson, C.A.; Whitfield Aslund, M.; McCallum, L.C.; Leventhall, G.; Knopper, L.D. Health-Based Audible Noise Guidelines Account for Infrasound and Low-Frequency Noise Produced by Wind Turbines. Front. Public Health 2015, 3, 31. [Google Scholar] [CrossRef] [PubMed]
- Nikolaidis, P.; Poullikkas, A. A comparative review of electrical energy storage systems for better sustainability. J. Power Technol. 2017, 97, 220–245. [Google Scholar]
- Ould Amrouche, S.; Rekioua, D.; Rekioua, T.; Bacha, S. Overview of energy storage in renewable energy systems. Int. J. Hydrog. Energy 2016, 41, 20914–20927. [Google Scholar] [CrossRef]
- Merei, G.; Moshövel, J.; Magnor, D.; Sauer, D.U. Optimization of self-consumption and techno-economic analysis of PV-battery systems in commercial applications. Appl. Energy 2016, 168, 171–178. [Google Scholar] [CrossRef]
- Prasanna, A.; Dorer, V. Feasibility of renewable hydrogen based energy supply for a district. Energy Procedia 2017, 122, 373–378. [Google Scholar] [CrossRef]
- Luderer, G.; Pietzcker, R.C.; Carrara, S.; de Boer, H.S.; Fujimori, S.; Johnson, N.; Mima, S.; Arent, D. Assessment of wind and solar power in global low-carbon energy scenarios: An introduction. Energy Econ. 2017, 64, 542–551. [Google Scholar] [CrossRef]
- Anderson, B.; Lin, S.; Newing, A.; Bahaj, A.; James, P. Electricity consumption and household characteristics: Implications for census-taking in a smart metered future. Comput. Environ. Urban Syst. 2017, 63, 58–67. [Google Scholar] [CrossRef]
- Kavousian, A.; Rajagopal, R.; Fischer, M. Ranking appliance energy efficiency in households: Utilizing smart meter data and energy efficiency frontiers to estimate and identify the determinants of appliance energy efficiency in residential buildings. Energy Build. 2015, 99, 220–230. [Google Scholar] [CrossRef]
- Belaïd, F. Understanding the spectrum of domestic energy consumption: Empirical evidence from France. Energy Policy 2016, 92, 220–233. [Google Scholar] [CrossRef]
- Rogelj, J.; Luderer, G.; Pietzcker, R.C.; Kriegler, E.; Schaeffer, M.; Krey, V.; Riahi, K. Energy system transformations for limiting end-of-century warming to below 1.5 °C. Nat. Clim. Chang. 2015, 5, 519. [Google Scholar] [CrossRef]
- Buskirk, R.D.V.; Kantner, C.L.S.; Gerke, B.F.; Chu, S. A retrospective investigation of energy efficiency standards: policies may have accelerated long term declines in appliance costs. Environ. Res. Lett. 2014, 9, 114010. [Google Scholar] [CrossRef]
- Wholesale Solar Home Page. Available online: https://www.wholesalesolar.com/solar-information/how-to-save-energy/power-table (accessed on 17 January 2019).
- EcoTopTen Home Page-Energy Consumption of Different Devices. Available online: www.ecotopten.de (accessed on 21 February 2019).
- Antal, M.; van den Bergh, J.C.J.M. Re-spending rebound: A macro-level assessment for OECD countries and emerging economies. Energy Policy 2014, 68, 585–590. [Google Scholar] [CrossRef]
- Nässén, J.; Holmberg, J. Quantifying the rebound effects of energy efficiency improvements and energy conserving behaviour in Sweden. Energy Effic. 2009, 2, 221–231. [Google Scholar] [CrossRef]
- Berrill, P.; Arvesen, A.; Scholz, Y.; Gils, H.C.; Hertwich, E.G. Environmental impacts of high penetration renewable energy scenarios for Europe. Environ. Res. Lett. 2016, 11, 014012. [Google Scholar] [CrossRef]
- Gils, H.C.; Scholz, Y.; Pregger, T.; Luca de Tena, D.; Heide, D. Integrated modelling of variable renewable energy-based power supply in Europe. Energy 2017, 123, 173–188. [Google Scholar] [CrossRef]
- Burger, B.; Kiefer, K.; Kost, C.; Nold, S.; Philipps, S.; Preu, R.; Rentsch, J.; Schlegl, T.; Stryi-Hipp, G.; Willenke, G.; et al. Photovoltaics Report; Fraunhofer Institute for Solar Energy Systems, ISE: Freiburg im Breisgau, Germany, 2018. [Google Scholar]
- Karneyeva, Y.; Wüstenhagen, R. Solar feed-in tariffs in a post-grid parity world: The role of risk, investor diversity and business models. Energy Policy 2017, 106, 445–456. [Google Scholar] [CrossRef]
- Papachristos, G. Household electricity consumption and CO2 emissions in the Netherlands: A model-based analysis. Energy Build. 2015, 86, 403–414. [Google Scholar] [CrossRef]
- Boßmann, T.; Staffell, I. The shape of future electricity demand: Exploring load curves in 2050s Germany and Britain. Energy 2015, 90, 1317–1333. [Google Scholar] [CrossRef]
- Laicane, I.; Blumberga, D.; Blumberga, A.; Rosa, M. Evaluation of Household Electricity Savings. Analysis of Household Electricity Demand Profile and User Activities. Energy Procedia 2015, 72, 285–292. [Google Scholar] [CrossRef]
- Borg, S.P.; Kelly, N.J. The effect of appliance energy efficiency improvements on domestic electric loads in European households. Energy Build. 2011, 43, 2240–2250. [Google Scholar] [CrossRef]
- Cooper, D.R.; Gutowski, T.G. The Environmental Impacts of Reuse: A Review. J. Ind. Ecol. 2015, 21, 38–56. [Google Scholar] [CrossRef]
- Jylhä, K.; Jokisalo, J.; Ruosteenoja, K.; Pilli-Sihvola, K.; Kalamees, T.; Seitola, T.; Mäkelä, H.M.; Hyvönen, R.; Laapas, M.; Drebs, A. Energy demand for the heating and cooling of residential houses in Finland in a changing climate. Energy Build. 2015, 99, 104–116. [Google Scholar] [CrossRef]
- Aebischer, B.; Catenazzi, G.; Jakob, M. Impact of Climate Change on Thermal Comfort, Heating and Cooling Energy Demand in Europe. 2007. Available online: http://www.verozo.be/sites/verozo/files/files/ImpactClimateChange_ETHSwitzerland.pdf (accessed on 10 January 2020).
- Knopf, B.; Nahmmacher, P.; Schmid, E. The European renewable energy target for 2030—An impact assessment of the electricity sector. Energy Policy 2015, 85, 50–60. [Google Scholar] [CrossRef]
- Nepustil, U.; Laing-Nepustil, D.; Lodemann, D.; Sivabalan, R.; Hausmann, V. High Temperature Latent Heat Storage with Direct Electrical Charging – Second Generation Design. Energy Procedia 2016, 99, 314–320. [Google Scholar] [CrossRef]
- Götz, M.; Lefebvre, J.; Mörs, F.; McDaniel Koch, A.; Graf, F.; Bajohr, S.; Reimert, R.; Kolb, T. Renewable Power-to-Gas: A technological and economic review. Renew. Energy 2016, 85, 1371–1390. [Google Scholar] [CrossRef]
- Bloess, A.; Schill, W.P.; Zerrahn, A. Power-to-heat for renewable energy integration: A review of technologies, modeling approaches, and flexibility potentials. Appl. Energy 2018, 212, 1611–1626. [Google Scholar] [CrossRef]
- Klement, P.; Thomsen, T.; Lammers, F.; Zobel, M.; Hanke, B.; Maydell, K.V. Photovoltaic-Energy-Profiles used in Power to Heat Time-Lapse Tests. Environ. Sci. 2014. [Google Scholar] [CrossRef]
- Blanco, H.; Faaij, A. A review at the role of storage in energy systems with a focus on Power to Gas and long-term storage. Renew. Sustain. Energy Rev. 2018, 81, 1049–1086. [Google Scholar] [CrossRef]
- Jentsch, M.; Trost, T.; Sterner, M. Optimal Use of Power-to-Gas Energy Storage Systems in an 85Renewable Energy Scenario. Energy Procedia 2014, 46, 254–261. [Google Scholar] [CrossRef]
- Robledo, C.B.; Oldenbroek, V.; Abbruzzese, F.; van Wijk, A.J.M. Integrating a hydrogen fuel cell electric vehicle with vehicle-to-grid technology, photovoltaic power and a residential building. Appl. Energy 2018, 215, 615–629. [Google Scholar] [CrossRef]
- Izadkhast, S.; Garcia-Gonzalez, P.; Frías, P. An Aggregate Model of Plug-In Electric Vehicles for Primary Frequency Control. IEEE Trans. Power Syst. 2015, 30, 1475–1482. [Google Scholar] [CrossRef]
- Besheer, A.H.; Smyth, M.; Zacharopoulos, A.; Mondol, J.; Pugsley, A. Review on recent approaches for hybrid PV/T solar technology. Int. J. Energy Res. 2016, 40, 2038–2053. [Google Scholar] [CrossRef]
- Hawlader, M.N.A.; Chou, S.K.; Ullah, M.Z. The performance of a solar assisted heat pump water heating system. Appl. Therm. Eng. 2001, 21, 1049–1065. [Google Scholar] [CrossRef]
- Fischer, D.; Rautenberg, F.; Wirtz, T.; Wille-Haussmann, B.; Madani, H. Smart Meter Enabled Control for Variable Speed Heat Pumps to Increase PV Self-Consumption. In Proceedings of the 24th IIR International Congress of Refrigeration, Yokohama, Japan, 22–16 August 2015. [Google Scholar] [CrossRef]
- Ramos, A.; Chatzopoulou, M.A.; Freeman, J.; Markides, C.N. Optimisation of a high-efficiency solar-driven organic Rankine cycle for applications in the built environment. Appl. Energy 2018, 228, 755–765. [Google Scholar] [CrossRef]
- Nam, J.Y.; Gao, Y.X.; Yoon, H.S.; Lee, H.K. Study on the Performance of a Ground Source Heat Pump System Assisted by Solar Thermal Storage. Energies 2015, 8, 365. [Google Scholar] [CrossRef]
- Postigo Marcos, E.F.; Mateo Domingo, C.; Gómez San Román, T.; Palmintier, B.; Hodge, B.M.; Krishnan, V.; de Cuadra García, F.; Mather, B. A Review of Power Distribution Test Feeders in the United States and the Need for Synthetic Representative Networks. Energies 2017, 10, 896. [Google Scholar] [CrossRef]
- Armaroli, N.; Balzani, V. Towards an electricity-powered world. Energy Environ. Sci. 2011, 4, 3193–3222. [Google Scholar] [CrossRef]
- Schneider, K.; Phanivong, P.; Lacroix, J. IEEE 342-node low voltage networked test system. In Proceedings of the 2014 IEEE PES General Meeting | Conference & Exposition, National Harbor, MD, USA, 27–31 July 2014; pp. 1–5. [Google Scholar] [CrossRef]
- Heuck, K.; Dettmann, K.D.; Schulz, D. Elektrische Energieversorgung; Springer: Berlin/Heidelberg, Germany, 2010. [Google Scholar] [CrossRef]
- Kenneth, A.P.; Folly, K. Voltage Rise Issue with High Penetration of Grid Connected PV. IFAC Proc. Vol. 2014, 47, 4959–4966. [Google Scholar] [CrossRef]
- Clement-Nyns, K.; Haesen, E.; Driesen, J. The Impact of Charging Plug-In Hybrid Electric Vehicles on a Residential Distribution Grid. IEEE Trans. Power Syst. 2010, 25, 371–380. [Google Scholar] [CrossRef]
- Deconinck, G.; Craemer, K.D.; Claessens, B. Combining Market-Based Control with Distribution Grid Constraints when Coordinating Electric Vehicle Charging. Engineering 2015, 1, 453–465. [Google Scholar] [CrossRef]
- Beaude, O.; He, Y.; Hennebel, M. Introducing decentralized EV charging coordination for the voltage regulation. In Proceedings of the IEEE PES ISGT Europe 2013, Lyngby, Denmark, 6–9 October 2013; pp. 1–5. [Google Scholar] [CrossRef]
- Marszal-Pomianowska, A.; de Cerio Mendaza, I.D.; Bak-Jensen, B.; Heiselberg, P. A performance evaluation of future low voltage grids in presence of prosumers modelled in high temporal resolution. Sustain. Cities Soc. 2019, 44, 702–714. [Google Scholar] [CrossRef]
- Feron, B.; Monti, A. Domestic Battery and Power-to-Heat Storage for Self-Consumption and Provision of Primary Control Reserve. In Proceedings of the 2018 Power Systems Computation Conference (PSCC), Dublin, Ireland, 11–15 June 2018; pp. 1–6. [Google Scholar] [CrossRef]
- Carrasco, J.M.; Franquelo, L.G.; Bialasiewicz, J.T.; Galvan, E.; PortilloGuisado, R.C.; Prats, M.A.M.; Leon, J.I.; Moreno-Alfonso, N. Power-Electronic Systems for the Grid Integration of Renewable Energy Sources: A Survey. IEEE Trans. Ind. Electron. 2006, 53, 1002–1016. [Google Scholar] [CrossRef]
- Faessler, B.; Schuler, M.; Preißinger, M.; Kepplinger, P. Battery Storage Systems as Grid-Balancing Measure in Low-Voltage Distribution Grids with Distributed Generation. Energies 2017, 10, 2161. [Google Scholar] [CrossRef]
- Kosow, H.; Robert, G. Methoden der Zukunfts- und Szenarioanalyse Überblick, Bewertung und Auswahlkriterien; Institute for Futures Studies and Technology Assessment: Berlin, Germany, 2008. [Google Scholar]
- Ritchey, T. Modeling Alternative Futures with General Morphological Analysis. World Futur. Rev. 2011, 3, 83–94. [Google Scholar] [CrossRef]
- Ritchey, T. General Morphological Analysis-A General Method for Non Quantified Modelling. Available online: http://swemorph.com/pdf/gma.pdf (accessed on 30 April 2019).
- Destatis. Entwicklung der Privathaushalte bis 2035-Ergebnisse der Haushaltsvorausberechnung; Statistisches Bundesamt: Wiesbaden, Germany, 2017.
- Destatis. Gebäude und Wohnungen-Bestand an Wohnungen und Wohngebäuden Bauabgang von Wohnungen und Wohngebäuden Lange Reihen ab 1969–2017; Statistisches Bundesamt: Wiesbaden, Germany, 2018.
- Wiginton, L.K.; Nguyen, H.T.; Pearce, J.M. Quantifying rooftop solar photovoltaic potential for regional renewable energy policy. Comput. Environ. Urban Syst. 2010, 34, 345–357. [Google Scholar] [CrossRef]
- Canals Casals, L.; Martinez-Laserna, E.; Amante García, B.; Nieto, N. Sustainability analysis of the electric vehicle use in Europe for CO2 emissions reduction. J. Clean. Prod. 2016, 127, 425–437. [Google Scholar] [CrossRef]


| Factor 1: | Factor 2: | Factor 3: | Factor 4: | Factor 5: | Factor 6: | |
|---|---|---|---|---|---|---|
| Individual Mobility | Mode Shift | Heating | Heating Demand | Electricity | Appliance Demand | |
| hypotheses | M1: | MD1: | H1: | HD1: | E1: | ED1: |
| BEV | Significant | Heat pump | Passive house | High PV-generation | Reduced | |
| M2: | MD2: | H2: | HD2: | E2: | ED2: | |
| Hydrogen (local) | Minor | Immersion heater | Current building code | Medium PV-generation | Steady | |
| M3: | MD3: | H3: | HD3: | E3: | ED3: | |
| Hydrogen (central) | None | CHP | Partial refurbishment | External generation | Increasing | |
| H4: | HD4: | |||||
| No el. heating | Old buildings |
| Variable | Symbol | Value |
|---|---|---|
| Number households | 100 | |
| Persons per household | n | 1.9 [166] |
| Living space per person | m [167] | |
| Optimal PV rooftop area per person | [168] | |
| PV-generation | 180 kWh/(m ) [105] | |
| Device electricity consumption per person | 1135 / [119] | |
| Vehicle ownership per person | 0.5 [45] | |
| Vehicle usage | 11370 km/ [46] | |
| Domestic hot water demand per person | 42 /day [93] | |
| Domestic hot water temperature | 60 [94] | |
| Local hydrogen production efficiency | 0.85 | |
| Cold water supply temperature | 12 | |
| Heat capacity water | /() | |
| Density water | / |
| Factor 1: | Factor 2: | Factor 3: | Factor 4: | Factor 5: | Factor 6: | |
|---|---|---|---|---|---|---|
| Individual Mobility | Mode Shift | Heating | Heating Demand | Electricity | Appliance Demand | |
| Symbol: | ||||||
| hypotheses | /100 | 90 | 4.5 | 15 /( ) | 2 | −30 |
| /100 | 50 | 1 | 50 /( ) | 1 | 0 | |
| 0 | 0 | −0.8 | 125 /( ) | 0 | +30 | |
| 0 | 200 /( ) |
© 2020 by the authors. Licensee MDPI, Basel, Switzerland. This article is an open access article distributed under the terms and conditions of the Creative Commons Attribution (CC BY) license (http://creativecommons.org/licenses/by/4.0/).
Share and Cite
Arens, S.; Schlüters, S.; Hanke, B.; Maydell, K.v.; Agert, C. Sustainable Residential Energy Supply: A Literature Review-Based Morphological Analysis. Energies 2020, 13, 432. https://doi.org/10.3390/en13020432
Arens S, Schlüters S, Hanke B, Maydell Kv, Agert C. Sustainable Residential Energy Supply: A Literature Review-Based Morphological Analysis. Energies. 2020; 13(2):432. https://doi.org/10.3390/en13020432
Chicago/Turabian StyleArens, Stefan, Sunke Schlüters, Benedikt Hanke, Karsten von Maydell, and Carsten Agert. 2020. "Sustainable Residential Energy Supply: A Literature Review-Based Morphological Analysis" Energies 13, no. 2: 432. https://doi.org/10.3390/en13020432
APA StyleArens, S., Schlüters, S., Hanke, B., Maydell, K. v., & Agert, C. (2020). Sustainable Residential Energy Supply: A Literature Review-Based Morphological Analysis. Energies, 13(2), 432. https://doi.org/10.3390/en13020432