1. Introduction
Declining oil reserves and increasingly stringent emissions regulations call for new solutions for internal combustion engine manufacturers. Therefore, manufacturers have produced engines by adopting alternative fuel applications, miniaturization, direct injection, and overcharging for conventional engines. The compacting and overcharging of the engine are expected to improve the overall engine efficiency by about 16%, with effects such as pumping loss, weight loss, and reduced friction loss [
1]. However, overcharging is caused by the problem of increasing pressure and temperature in the cylinder due to abnormal combustion and ignition instability, called knocking. To solve this problem, the spark timing can be adjusted to lower the peak pressure and temperature. However, excessive use of this method is limited because it leads to a significant reduction in combustion stability and fuel economy, which adversely affects engine efficiency and power. Therefore, researchers have tried to solve the problem using a variety of methods, including cooling exhaust gas recirculation (EGR), rich mixture, and fuel with a high octane number [
1,
2,
3,
4,
5].
Among various methods for solving such problem, water injection with high anti-knock characteristics has attracted attention recently. Water injection enables high compression ratios and supercharging. It also reduces engine fuel consumption due to the high specific heat of water. In addition, due to the charge cooling effect, NO
x is significantly reduced by increasing the heat capacity of the mixer and decreasing the adiabatic flame temperature [
6]. When applying water injection, the rate of reduction in flame propagation speed is greater than that of applying EGR. Therefore, water injection is more beneficial to the reduction of NO
x emissions than EGR application [
7]. Many studies confirmed that water injection does not have a direct effect on CO or CO
2 emission, although it is expected to reduce CO
2 due to increased fuel efficiency. However, combustion at low temperatures due to water injection has a disadvantage of increasing hydrocarbons (HC) [
8,
9,
10,
11,
12,
13].
Water injection engines began in the early 1930s and have been studied for a long time in various ways. Water injection engines can be divided according to water injection location [
14,
15]. Water injection can be divided in two main ways: Injection water or water emulsified fuel with an engine. The water emulsified fuel method has the advantage of low water consumption, but it is necessary to replace the fuel system and the high-pressure pump in order to solve the corrosion and freezing problems. Thus, the cost increases due to a completely new pressure system. It can also be a problem for starting the engine, so the water must be removed with pure gasoline. Consequently, a method involving the injection of water into the intake port has been mainly used for charge cooling effect among various water injection positions recently. In a gasoline direct injection (GDI), the engine that directly injects fuel into the cylinder, a port fuel injection (PFI) system, is added to inject water into the intake port. Using the PFI system, water is injected into the intake port at a relatively low pressure of 0.5–0.7 MPa. In addition, intake port water injection has advantages of being a simple and economical injection system with relatively easy handling of water corrosion and freezing problem [
2,
16]. However, it has a disadvantage of increasing water consumption [
17].
For these reasons, experimental and analytical studies of water injection have been conducted around the world. Berni et al. conducted analytical studies on intake port water injection in the GDI engine, confirming an increase in indicated power and 17% reduction in fuel consumption [
7]. Worm et al. examined the injection quantity and efficiency of water through port water injection experiments on spark ignition (SI) engines. It was confirmed that the maximum average effective pressure increased by 5% and that the thermal efficiency increased by 34% [
16]. Younkins et al. found that NO
x emissions are decreased by 87% by adding water injection to direct injection (DI) engines that supply hydrogen [
18]. Hountalas experimentally determined the effect of NO
x reduction through water emulsion in place of EGR, which increases fuel consumption and generates soot in diesel engines. In addition, water emulsion showed higher NO
x reduction than intake port water injection [
19]. Tornatore et al. confirmed the stable possibility of lean combustion due to the improvement of anti-knock and fuel efficiency when water injection is applied [
20]. Many researchers are studying water spray and evaluating the possibilities.
In gasoline engines, the PFI system has been studied for a long time and has reached a mature stage. However, spray characteristics of the PFI system have not been studied in recent years due to changes in GDI engines. Bellato et al. predicted spray mixture formation of PFI systems through analysis and verified it through experiments [
21]. Anand et al. studied the distribution of spray and droplet size using a multi-hole PFI system with gasoline-ethanol mixed fuel [
22]. Despite differences in viscosity, gasoline and ethanol showed similar characteristics in terms of spray progression and droplet size. Zhu et al. compared emission characteristics of exhaust gases using GDI and PFI systems. Although GDI systems have the advantage of low fuel consumption, they have the disadvantage of emitting more total hydrocarbon (THC), particulate matter (PM), and particle number (PN) [
23]. Bhagat et al. investigated the spray characteristics of a multi-hole injector using experimental and analytical methods for natural intake and supercharge engine conditions [
24]. They found that the higher the temperature, the lower the STP due to the collapse of spray plume. In addition, when the water injection timing was 90 before top dead center (BTDC), it reduced the formation of wall wetting on the piston surface, cylinder head, and cylinder wall, and caused vaporization better than 60 BTDC. Although it is optimal to apply water injection to PFI system, there is a lack of research analyzing the spray characteristics of water spray using PFI systems.
As interest in water injection has increased recently, various studies on water injection have been actively conducted in different countries. Many studies on PFI systems have been conducted during recent years. The water injection supplies water to the intake port to form a water–air mixture, which is then subjected to a more difficult and complicated process in which gasoline is directly injected into the combustion chamber and combusted. In addition, water is expected to have significantly different physical properties from gasoline, resulting in different injection and spray characteristics. Accordingly, it is essential to understand not only spray characteristics of fuel, but also spray characteristics of water [
25]. However, most of water injection research studies focused on the combustion process and exhaust gas research, while research on injection and spray characteristics of the water applied to the PFI system was insufficient.
Therefore, the purpose of this study was to propose suitable injection conditions by comparing fuel and water injection and spray characteristics for water injection using a PFI system in a gasoline engine. Fuel was replaced with n-heptane known to have similar physical properties to those of gasoline. Experiments were performed with varying injection pressure and energizing duration. To determine macroscopic spray characteristics, spray tip penetration and spray cone angle were measured by macroscopic spray visualization. The size and velocity characteristics of spray droplets of n-heptane and water in PFI systems were compared using a phase doppler anemometry (PDA) system.
2. Experimental Setup and Procedure
The experimental apparatus for visualizing the macroscopic spray flow of water and n-heptane injected from PFI systems is shown in
Figure 1a. The visualization test apparatus was divided into fuel supply unit, signal control unit, and image acquisition unit. Visualization was performed by installing an injector in a constant volume chamber. The constant volume chamber had a volume of 2.36 L with a 100-mm optical window. The injection pressure of the fuel was adjusted to 0.3–0.9 MPa by pressurizing the pressurized auxiliary tank containing fuel with nitrogen. The injector was controlled using a LabVIEW program, a Compact RIO controller (NI, cRIO-9030), differential digital input (NI, 9411), and an injector controller (NI, 9751) from the National Instruments. In addition, the spray of water and n-heptane was visualized with a Mie -scattering method. A high-speed camera (FASTCAM, Mini AX100), a lens (SIGMA, 105 mm f/1:2.8 DG MACRO HSM) and a 250-W metal halide lamp (Lighterrace, MID-25FC) were used for spray image acquisition. A signal generator (Berkeley Nucleonics Corp. model 575) was used to synchronize and control the signal between the injector and the camera. The experiment was conducted under the condition of fuel temperature and ambient temperature of 20 °C and ambient pressure of 1 atm.
Raw spray images obtained through macroscopic spray visualization experiments were post-processed for quantitative data. The image post-processing process was performed using a program based on MATLAB with the following sequence: Background removal, black and white, binarization, and noise reduction. Using the post-processed image, it was possible to distinguish between areas where sprays were present and those that were not, and to quantify various spray characteristics. Because the PFI system operated at lower injection pressures than the injector with direct injection, the droplets of the spray were relatively large and clearly distinguishable from the background. Therefore, the threshold used for image processing in this study was used as a fixed value. For quantitative analysis of macro spray visualization characteristics of the PFI system, spray tip penetration and injection cone angle were defined, as shown in
Figure 2. The spray tip penetration was defined as the maximum distance from the injector tip to the spray edge. The spray cone angle was defined as the angle between the center of the injector tip and end points of the spray.
Figure 1b is a PDA device for measuring the size and velocity of spray droplets. PDA tester is also composed of a fuel supply unit, a signal control unit, and a measuring unit. The PDA used in this study was a 1D-PDA system that was capable of measuring the droplet size and the vertical velocity. An Ar-ion laser with a wavelength of 514.5 nm was used as the light source. The collection angle was set to 35° and the focal length was 400 mm according to the fuel used in this study. Measured data were converted into data through a signal processor and stored in a computer.
Figure 2 shows a schematic of the measurement area for the PDA experiment. To analyze the size and velocity of spray droplets, the PDA experiment was carried out by selecting a point 30 mm or 60 mm away from the injector tip where the spray was considered to be fully developed downstream. Twelve holes were divided into two groups of six and sprayed. It was assumed that two spray plumes were symmetrical. Therefore, spray droplets sprayed from one spray plume (from six holes) were analyzed by PDA experiment. In addition, the experiment was performed by selecting Y = 8 mm in Z = 30 mm and Y = 14 mm in Z = 60 mm, which was considered to be the spray center because the spray was not widely spread due to the PFI system characteristics.
In this study,
D32 (Sauter mean diameter, SMD) was used to examine the size of spray droplets through PDPA experiment. D10 (arithmetic mean diameter, AMD) was the linear average value of all drops in the spray.
D32 (SMD) was the diameter of the drop whose ratio of volume to surface area was the same as that of the entire spray [
26]. Unlike AMD, which calculates the size of a droplet as an arithmetic mean, SMD can be calculated by the volume/surface of the droplet, as shown in Equation (1). In fluid dynamics,
D32 is commonly used to define the particle size by weighting large droplets in the distribution of
D32 droplets.
In this study, n-heptane was used as a substitute for gasoline fuel to compare injection and spray characteristics of gasoline and water of PFI systems. Although n-heptane had similar physical properties to those of gasoline, it was considered to be more suitable for analyzing injection and spray characteristics because of its relatively uniform spraying as a single component fuel. In addition, n-heptane has been recommended as a fuel for spray experiments in gasoline spray measurement evaluation criteria [
27]. The physical properties of gasoline, n-heptane, and water are shown in
Table 1. It can be seen that physical properties such as density, viscosity, and surface tension of water are all greater than those of n-heptane.
Table 2 shows experimental conditions used in this study. In the present study, 12-hole PFI systems were used. Water, and n-heptane were used to compare the injection and spray characteristics. In the experiment for measuring the injection quantity, the injection pressure was increased to 0.3 MPa, 0.5 MPa, 0.7 MPa, and 0.9 MPa and the energizing duration was increased from 0.5 ms to 4 ms in 0.5-ms increments.
The spray pressure was fixed at 0.5 MPa and the energizing duration was increased from 1 ms to 4 ms in 1-ms increments in order to examine the characteristics according to the change in energizing duration between spray visualization and PDA experiments. In order to see the effect of the injection pressure, the experiment was conducted with the injection pressure changed to 0.3 MPa, 0.5 MPa, 0.7 MPa, 0.9 MPa, while the energization period was fixed at 2.795 ms.
The schematic of the PFI system used in this study and the image of the hole are shown in
Figure 3. A 12-hole gasoline injector for port fuel injection engines was used. The injector holes were divided into two groups of six semicircular shapes, forming two spray plume groups with a spray angle of about 20°. The injector nozzle tip was photographed using SEM. The average diameter of the injector hole was about 138 μm.
3. Results and Discussion
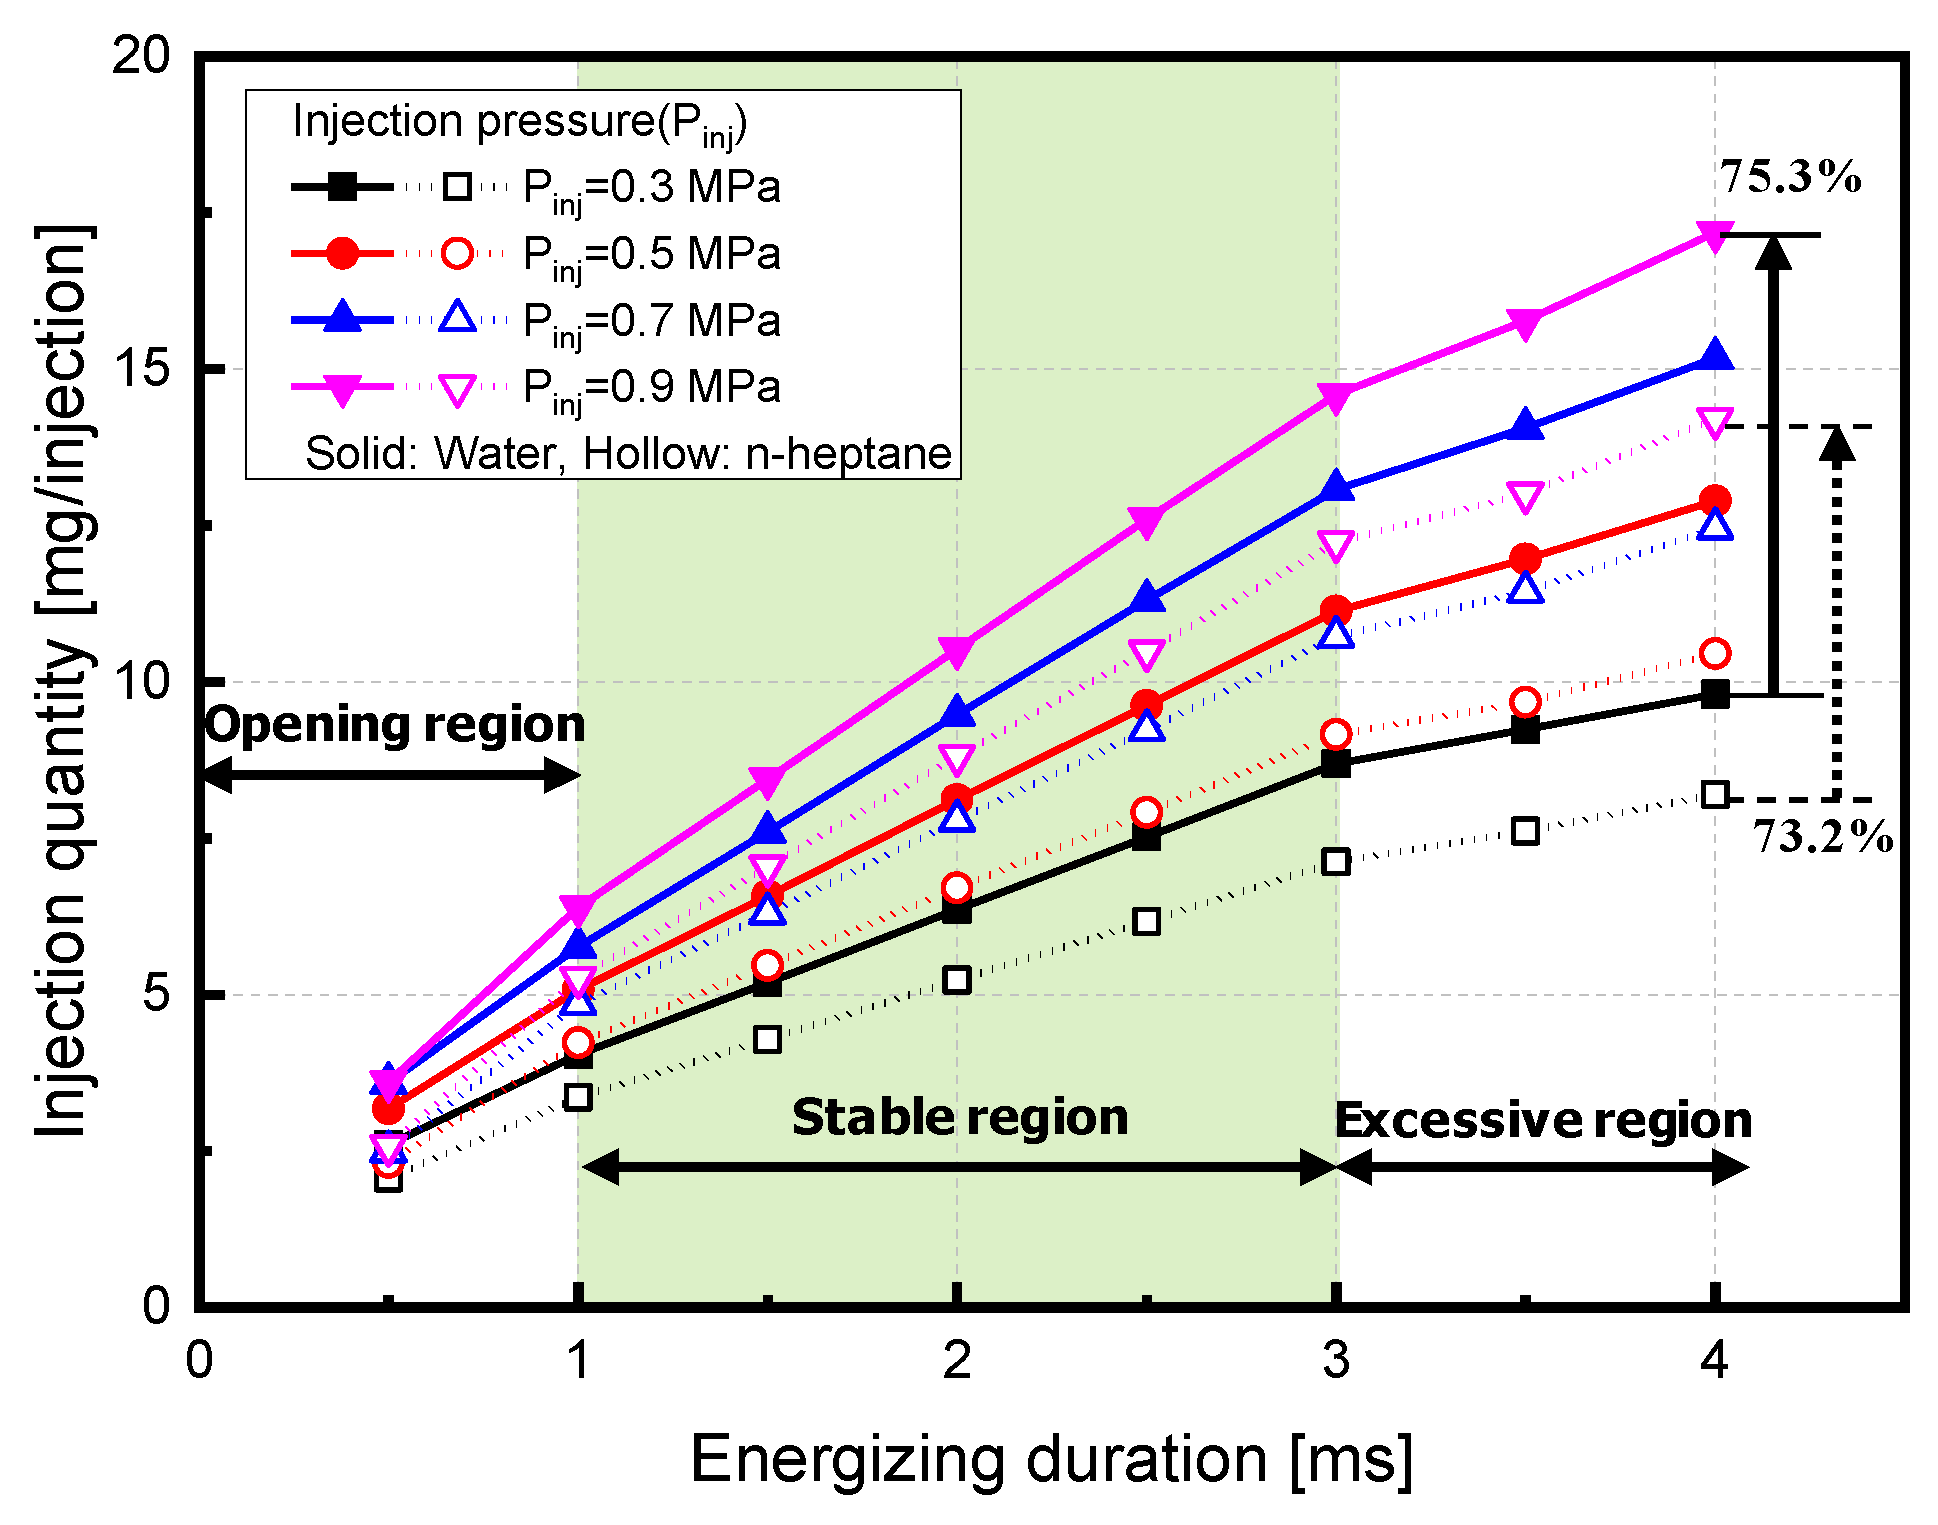
Figure 4 is a graph comparing the injection quantity of water and n-heptane according to the change between injection pressure and energizing duration. The injection pressure was changed to 0.3 MPa, 0.5 MPa, 0.7 MPa, and 0.9 MPa and the energizing duration was changed from 0.5 ms to 4.0 ms in 0.5 ms units. As shown in
Figure 4, the injection quantity of water and n-heptane increased with increasing injection pressure and energizing duration. In addition, the injection quantity of water was about 21% higher than that of n-heptane. This is because the density of water is larger than that of n-heptane. In general, the injection flow rate of the fluid was proportional to the density when the flow cross section and the velocity (or differential pressure) were constant.
The density of water is about 1.47 times higher than that of n-heptane. However, since the surface tension of water is 3.51-times higher than that of n-heptane, the difference in injection quantity (21%) is considered to be smaller than the density difference (47%) due to drag caused by surface tension. When the injection pressure was increased from 0.3 MPa to 0.9 MPa, the injection quantity of water and n-heptane increased to 75.3% and 73.2%, respectively (with a duration of 4.0 ms), regardless of the type of fuel. The injection quantity tended to increase in proportion to the injection pressure (). On the other hand, it can be seen that the increase rate of injection quantity decreases when the energizing duration is 1.0 ms and 3.0 ms at all injection pressures. Based on this, the injection quantity graph can be divided into three regions. Based on this branching point (teng = 1 ms and 3 ms), regions were divided into three sections: The opening region (~1.0 ms), stable region (1.0 ms~3.0 ms), and excessive region (3.0 ms~). In the opening region before 1.0 ms, the injection was terminated before the injector needle was completely lifted due to an insufficient energizing duration, which resulted in unstable flow characteristics such as smaller flow rate than other areas and unclear flow characteristics due to change in injection pressure. In the stable region (1 ms~3.0 ms), the needle was lifted to the highest height and spray was stable. The spray quantity increased linearly with increasing energizing duration at each injection pressure. In the region after 3.0 s (excessive region), the injection quantity increased linearly with energizing duration. The increase rate was slightly lower than the stable region. The injector used in this study was confirmed to be a stable injection area at teng = 1–3 ms. Therefore, 2.795 ms was set as the representative energizing duration in terms of spray behavior and droplet size measurement.
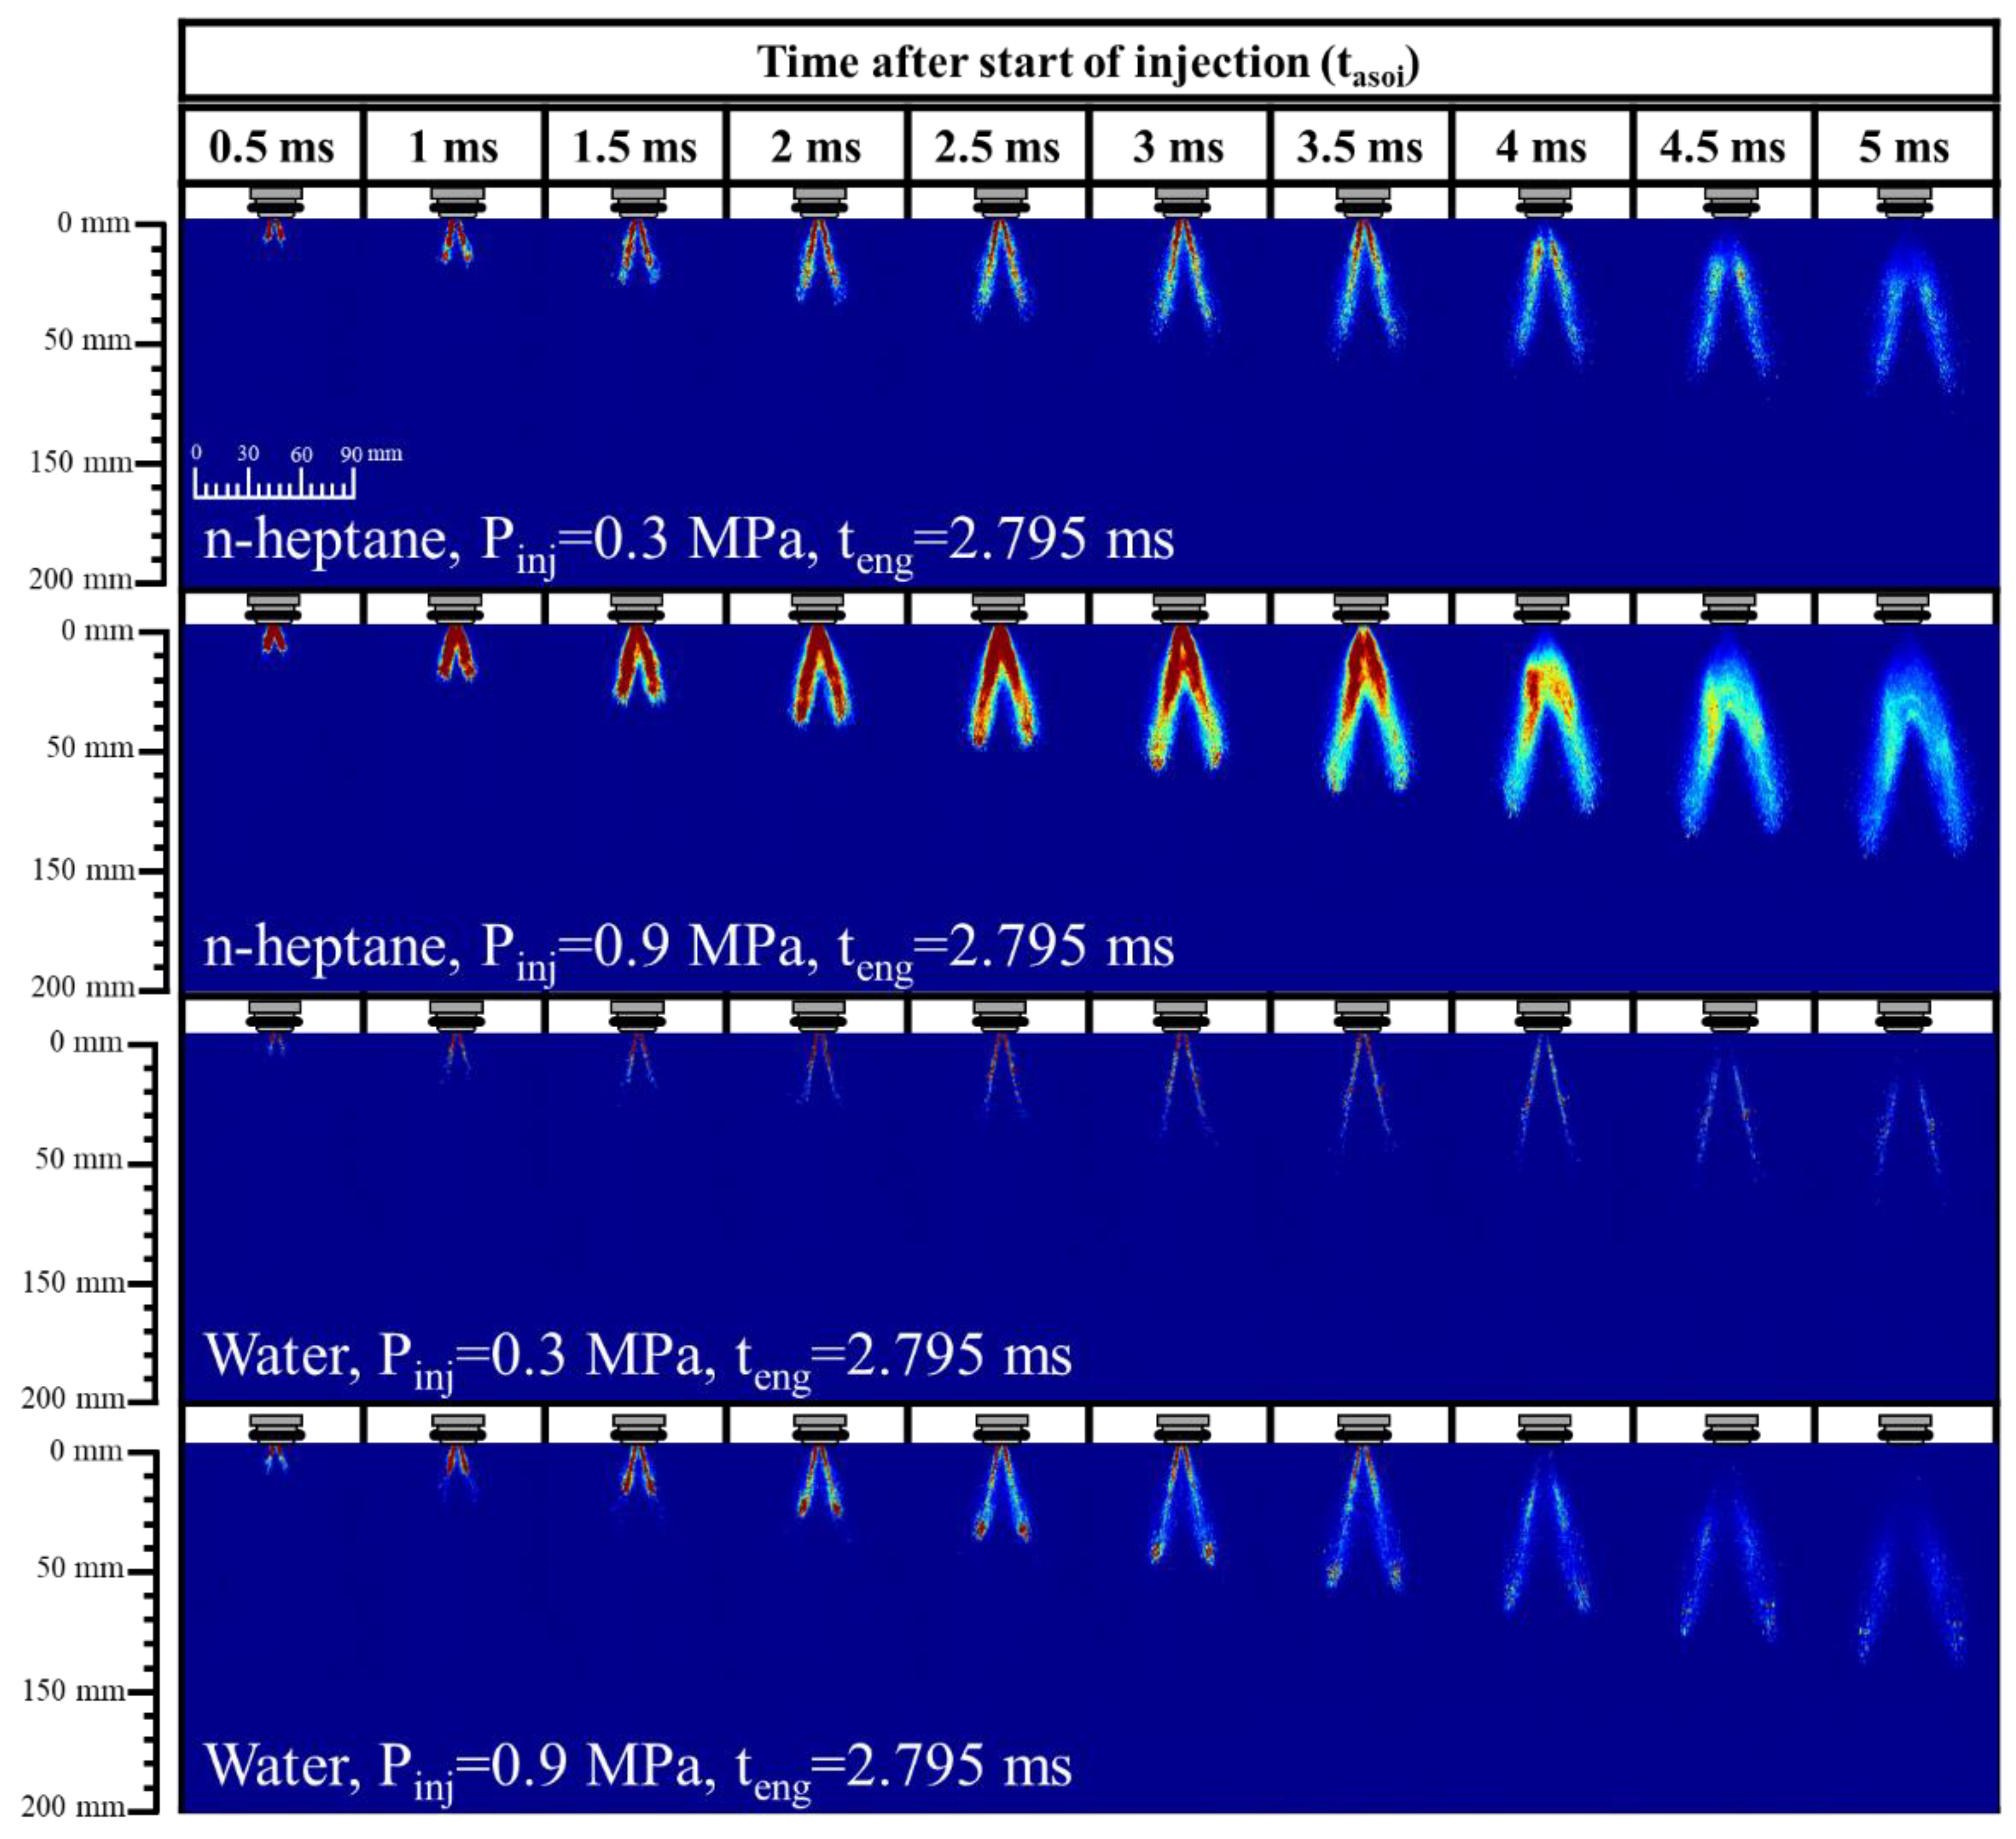
Figure 5 shows spray development of water and n-heptane over time after the start of injection. The raw image of the spray was expressed in color according to light intensity. The closer to red, the more spray droplets existed, which means that the light reflection was large. In particular, the more droplets of fuel and the wider droplets of fuel, the greater the light intensity. Therefore,
Figure 5 can be used as an indicator to relatively determine the degree of spray dispersion and atomization. As shown in
Figure 5, n-heptane had excellent atomization characteristics with lower surface tension and viscosity than water. The brightness of the image was high due to the spread of spray and the scattering of light. On the other hand, since water is not easily atomized (especially at low injection pressure conditions), light scattering did not occur well. Thus, the form of spray appeared faint. When the injection pressure was increased, the breakup and atomization of both fuels proceeded well and the light intensity increased due to the increased number of droplets. This result showed that when water is injected at a low pressure, the atomization of the sprayed water is not smooth [
28]. It is sprayed in the form of a liquid column to reach the intake port wall surface. Thus, the wall-wetting phenomenon is likely to occur. To prevent the wall-wetting phenomenon, water requires a higher injection pressure than n-heptane. In addition, n-heptane had a high light intensity throughout the whole spray plume, whereas water had a high light intensity at the end of the spray plume. The results of quantitative analysis of the spray development of water and n-heptane are shown in
Figure 6 and
Figure 7.
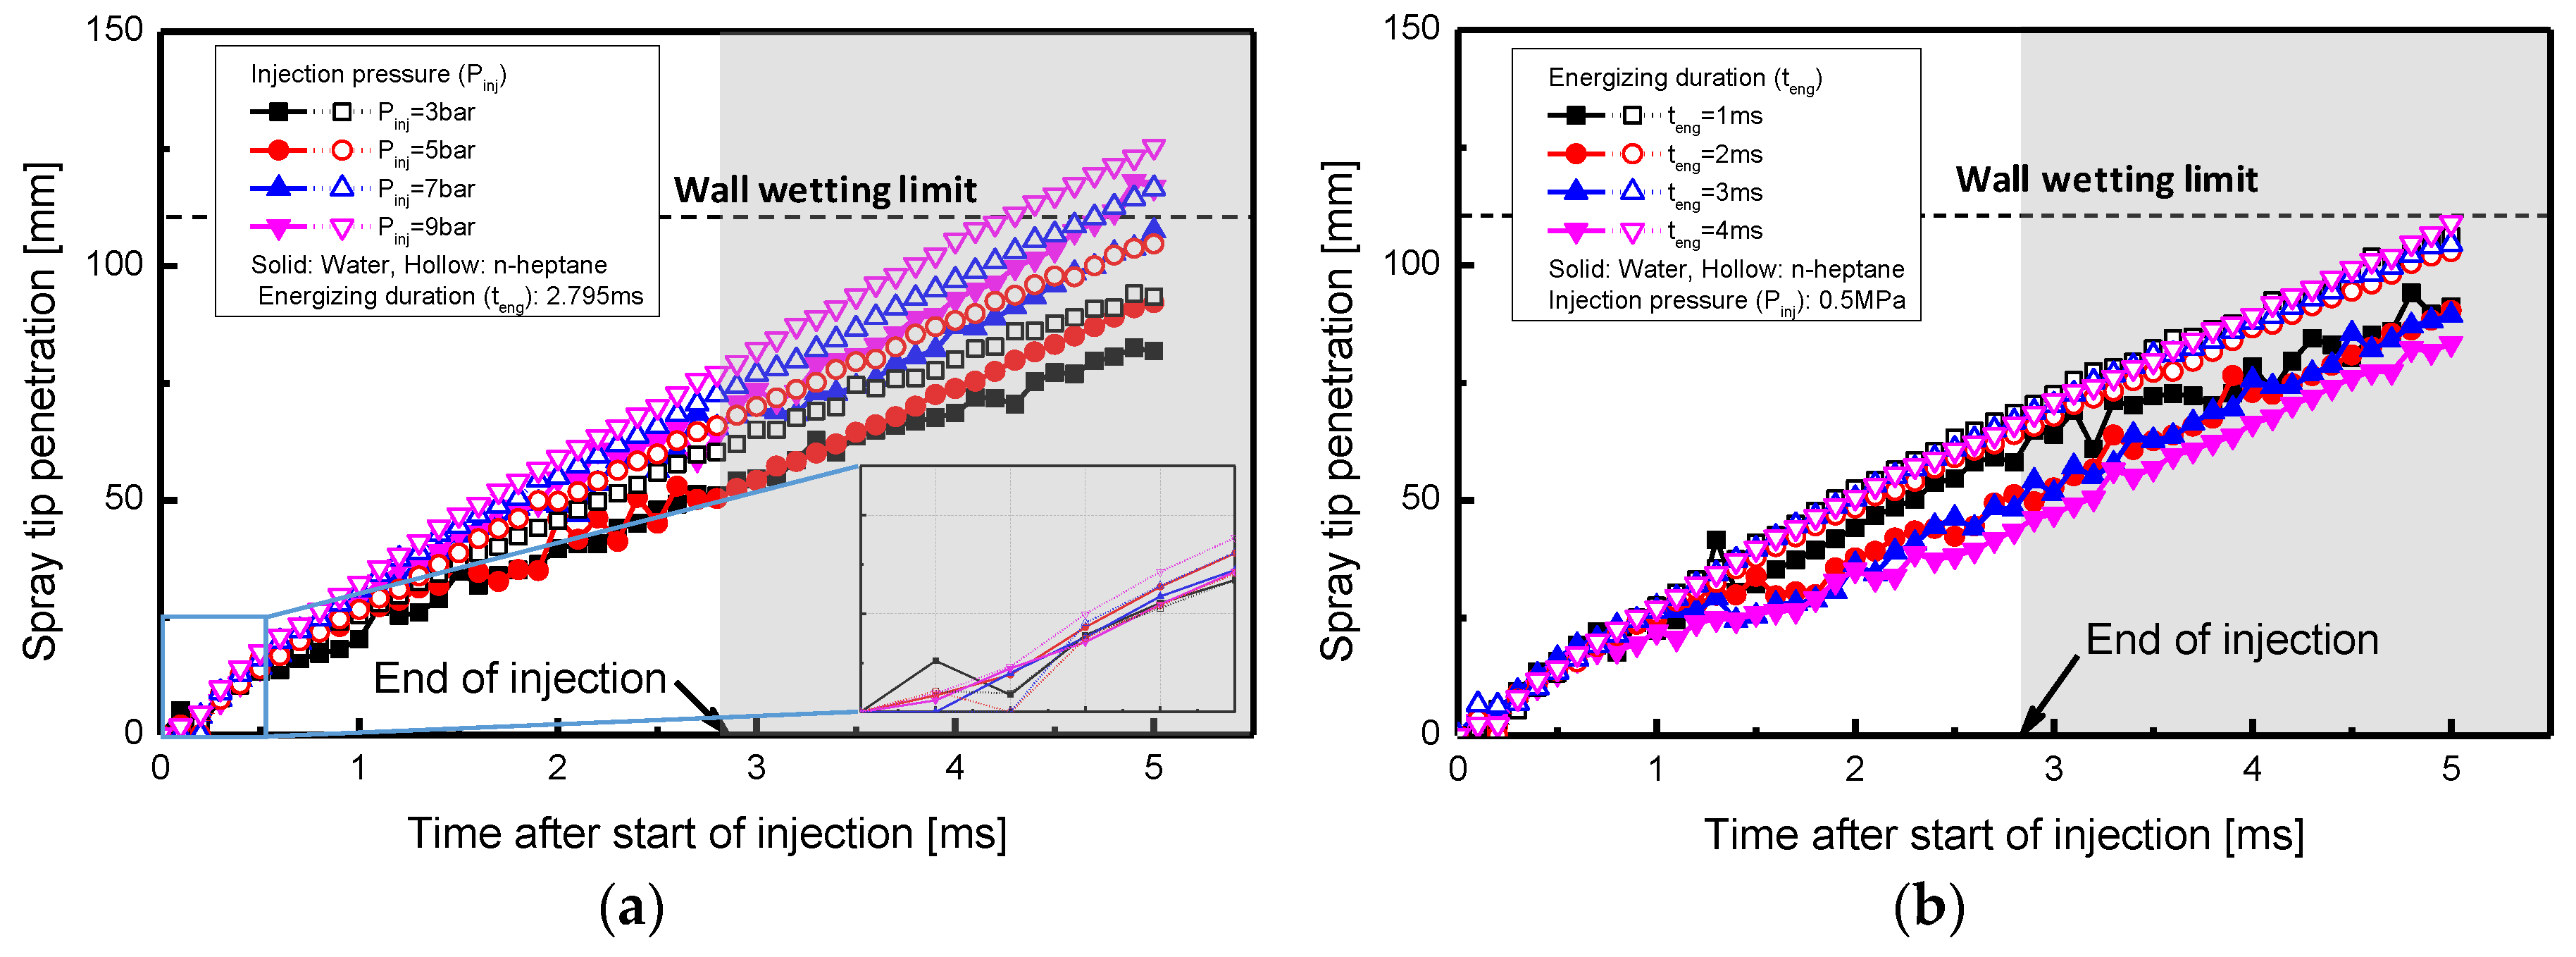
Figure 6 shows spray tip penetration characteristics of water and n-heptane according to the change of injection pressure and current. Under the same spray conditions, spray tip penetration of n-heptane was 11.2–17.6% longer than that of water. Despite the high density of water, the spray tip penetration of water was shorter than that of n-heptane due to the high surface tension and viscosity. As shown in ‘Region A’ of
Figure 6a, the development of spray was unstable at the initial stage of spray (about 0.5 ms after spraying). Therefore, it was difficult to confirm the clear difference in spray tip penetration according to injection pressure and test fuel. Under all test conditions, the spray tip penetration increased linearly with time after start of injection. The increase in injection pressure affected the initial velocity increase of the spray, leading to an increase in spray tip penetration (according to Bernoulli’s equation, the velocity was proportional to
). As the injection pressure increased from 0.3 MPa to 0.9 MPa, water increased up to 31.7% and n-heptane increased up to 22.5%. In
Figure 6b, however, the change of the energizing duration did not significantly affect the spray tip penetration of n-heptane or water. This is because the change of energizing duration under the same injection pressure (differential pressure) condition does not affect the velocity of initial droplets.
Figure 8 shows a schematic diagram of installing PFI systems used in this study on the design engine. The distance from the nozzle tip to the intake valve wall of the design engine was about 120 mm. For this reason, it can be seen that when installing the injector in the intake port for water injection, the STP should not exceed 120 mm more than needed. This is defined as a wall wetting limit and is shown in the graph. When water was injected, the STP increased. However, it was confirmed that the wall wetting limit was not reached under most conditions. Therefore, it is expected that water will not generate a direct wall wetting phenomenon, even at higher injection pressure. From these results, it can be seen that spray tip penetration control of water injection to the design distance of each engine is essential for water injection.
Spray cone angles of water and n-heptane according to spray pressure are shown in
Figure 7. As shown in the figure, both fuels showed a high initial injection cone angle which decreased over time. Although the injection cone angle of the injector used in this study was designed to be 20°, the initial injection cone angle was determined to be high because the distance from the injector tip to the spray edge was too close. Over time, the spray cone angle gradually decreased to approximate 20° and the rate of decrease of the spray cone angle decreased. At high injection pressures, the injection cone angle was low and the injection cone angle decreased up to 10.7% for water and 7.2% for n-heptane with increasing injection pressure from 0.3 MPa to 0.9 MPa. This was because the linearity of the injected fluid increased with increasing injection pressure, while the radial velocity decreased. On the other hand, the injection cone angle of water was 12.07% larger than that of n-heptane. This was because the viscosity and surface tension of the water were relatively large, making it difficult for water to be atomized (see
Figure 5). The spray tip penetration was short and developed in the radial direction. In addition, a large injection quantity of water sprayed under the same spray conditions also caused an increase in the spray angle.
Figure 9,
Figure 10 and
Figure 11 compare atomization properties of water and n-heptane. These atomization characteristics were explained using spray droplet size, distribution, and droplet velocity. The size of spray droplets can serve as a measure of atomization degree of the spray. The finer the atomization, the better the mixture.
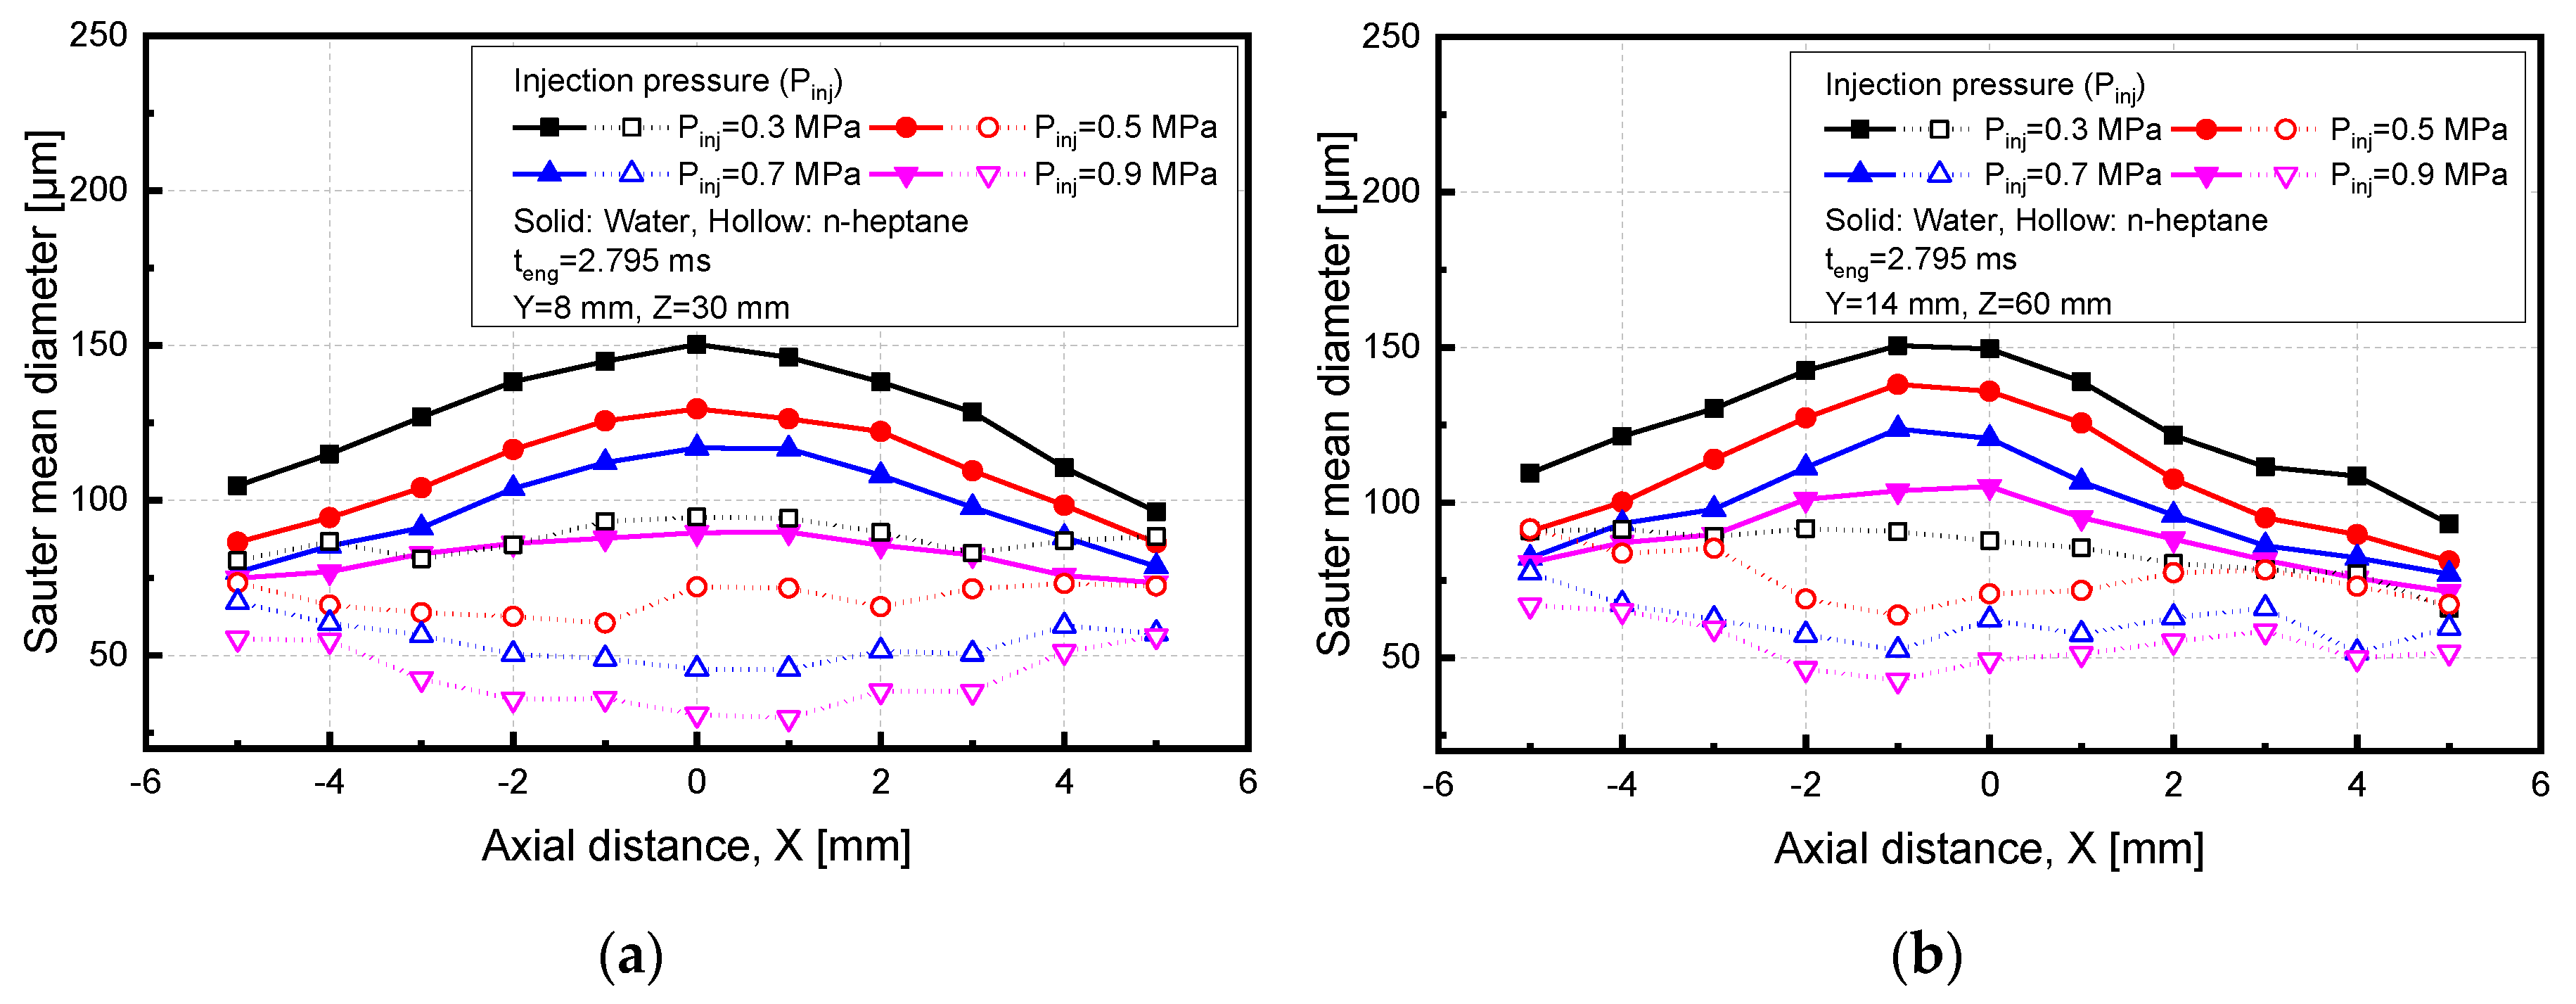
Figure 10 compares the SMDs of n-heptane and water according to the change of injection pressure at the point where the distance from the nozzle tip to the measurement section was 30 mm and 60 mm, respectively. As shown in
Figure 9a,b, SMDs of water and n-heptane decreased as injection pressure increased. This was because aerodynamic splitting actively progressed with increasing relative velocity between the fluid and ambient air due to an increase in injection pressure. When the injection pressure increased from 0.3 MPa to 0.9 MPa, the SMD decreased 87.8% in water and 47.1% in n-heptane. The SMD of water was measured greater than that of n-heptane at an average of 74.5% at 30 mm from the nozzle tip and 56.5% at 60 mm. It has been confirmed that SMD is a dominant function of We (weber number), that is, the surface tension of water is twice as high as n-heptane and the droplet size at the center of the injector is up to about two times greater. In addition, the difference of SMD between water and n-heptane increased as the injection pressure increased. Water increased SMD toward the center of the injector, whereas n-heptane decreased SMD at the center of the injector. It can be seen that droplets of water with high surface tension were coalesced, while the droplets of n-heptane with low surface tension were broken up in the process of droplets injected from six holes collided with each other.
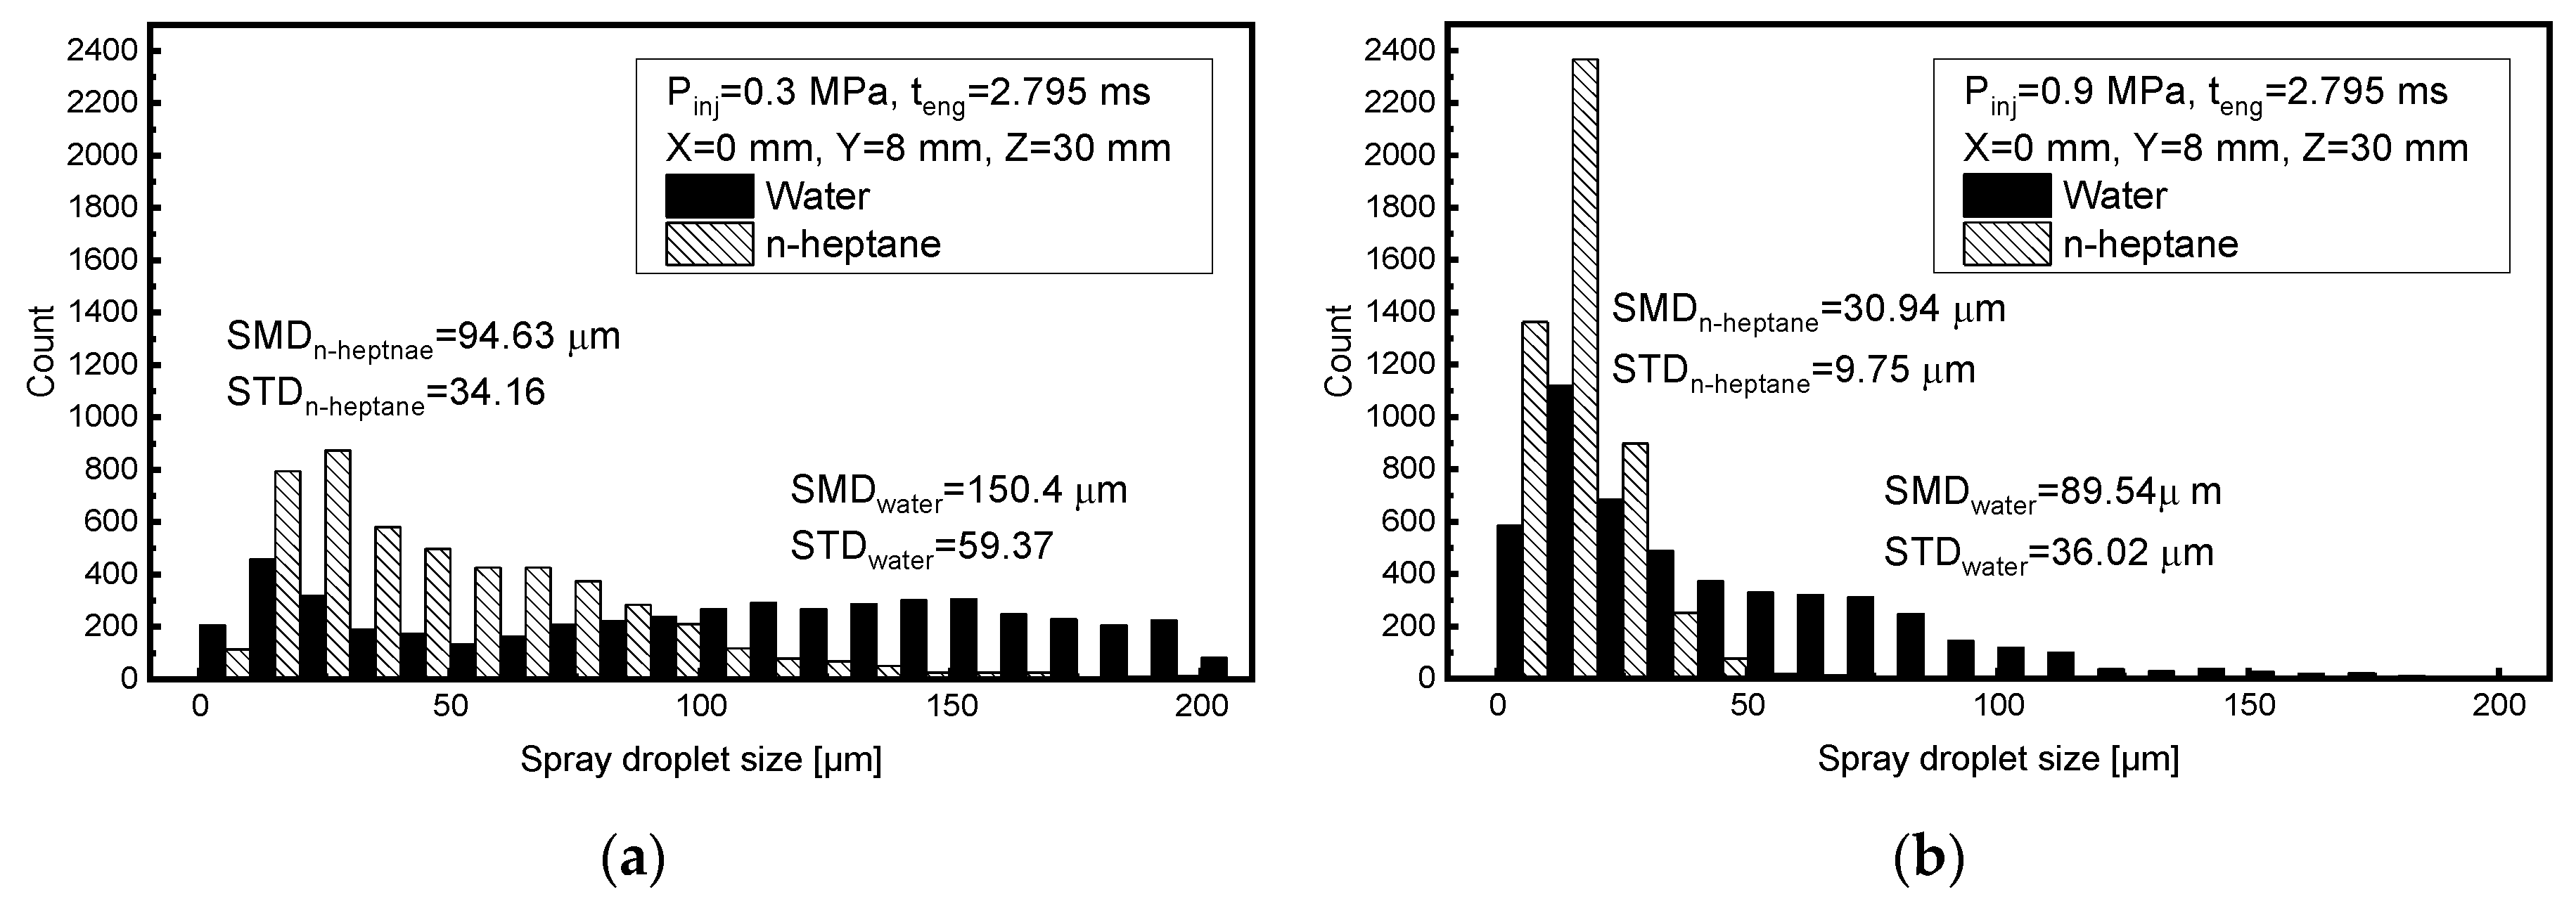
Figure 10 compares droplet size distribution of water and n-heptane. For each experimental condition, data for a total of 5000 droplets were obtained. Comparison of the droplet size distribution was performed at points X = 0 mm, Y = 8 mm, and 30 mm away from the nozzle tip (Z = 30 mm). It could be seen that the shape of distribution of water and n-heptane was significantly different at injection pressure of 0.3 MPa. As shown in
Figure 10a, when n-heptane was injected, there were many small droplets. The larger the size, the smaller the number. On the other hand, water droplets were relatively even distributed in size. The number of large droplets for water was larger than that for n-heptane. This caused the SMD of water to appear larger than that of n-heptane. In addition, the standard deviation was 34.16 μm for n-heptane and 59.371 μm for water. In the process of water droplets continuously colliding with each other, it is judged that the distribution of droplet size was relatively even because the collision and coalescence of droplets were repeated due to the high surface tension of water.
However, as shown in
Figure 10b, droplets developed with high momentum due to the high injection pressure, overcoming the surface tension of water and breaking up actively. Therefore, like n-heptane, water was observed to have relatively small size distribution at a low injection pressure. However, at high injection pressure (0.9 MPa), n-heptane also exhibited a smaller SMD than water, as its breakup was more active, and the number of smaller droplets was increased. That is, water always had a larger SMD than n-heptane due to its high viscosity and surface tension. In the results shown in
Figure 10a,b, when water was injected at a pressure of 0.9 MPa, it had similar atomization characteristics to those of n-heptane injected at 0.3 MPa. Therefore, when water is injected into the intake port, the injection pressure should be increased for smooth mixing with the intake air through the active breakup activity. As the injection pressure increased from 0.3 MPa to 0.9 MPa, the SMD of n-heptane decreased by 67.3% and, while the SMD of water decreased by 40.47%.
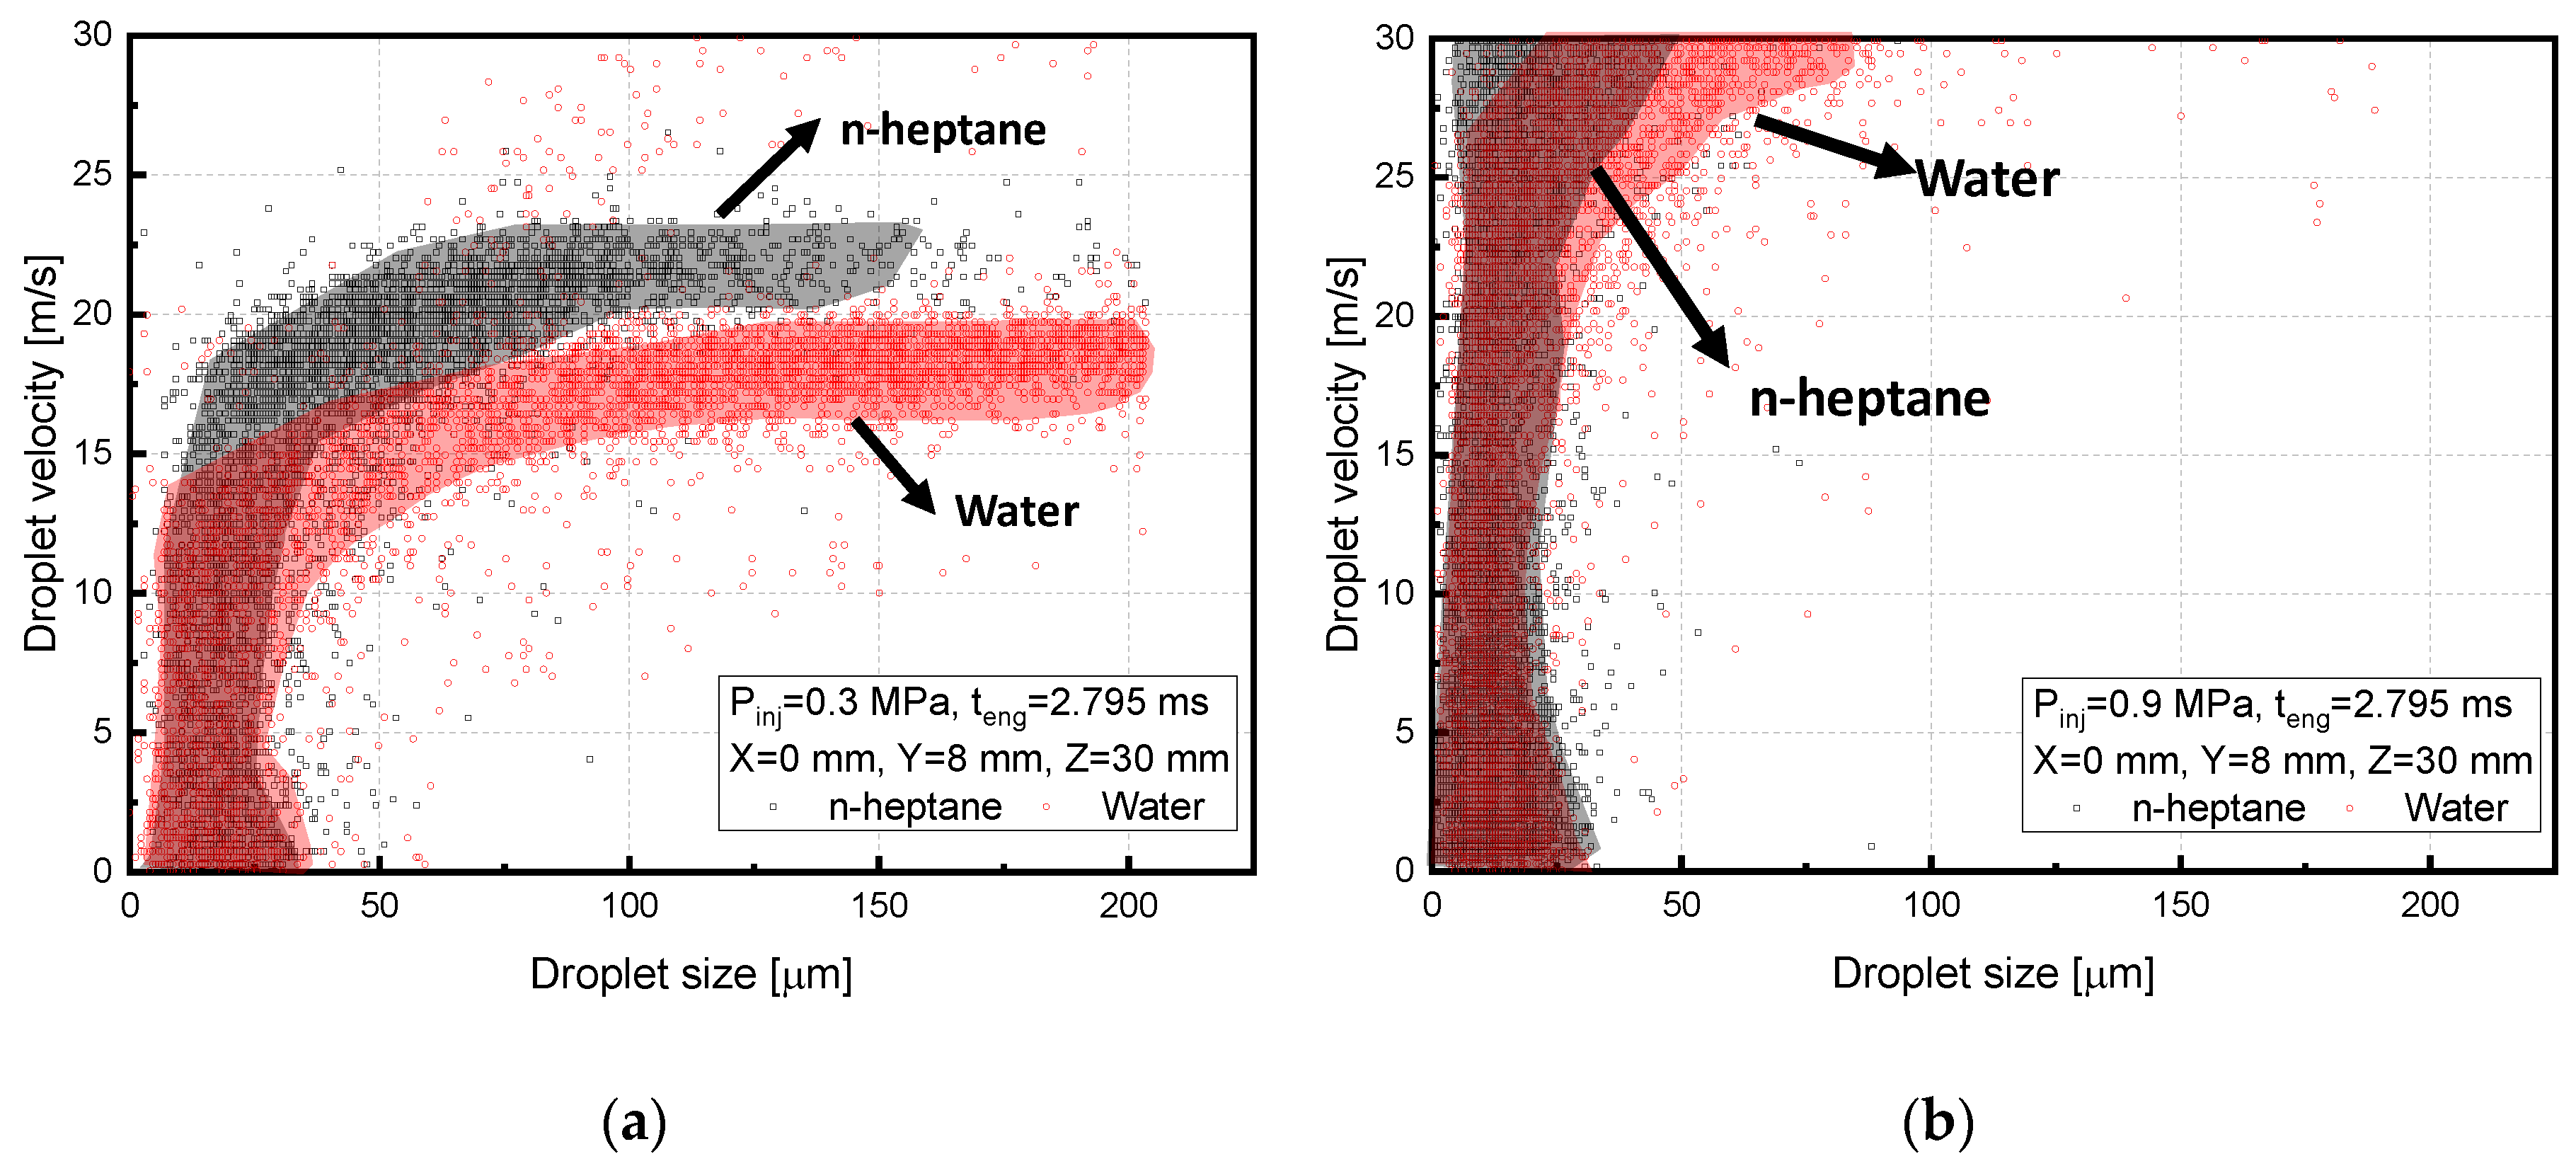
Figure 11 shows the distribution of SMD-Velocity with variation of injection pressure at t
eng = 2.795 ms of n-heptane and water using PFI systems. The velocity and size of each of 5000 droplets are shown in the distribution graph.
Figure 11a shows the SMD-Velocity distribution at an injection pressure of 0.3 MPa. It can be seen that droplets of n-heptane were distributed in a smaller size area than those of water. When the injection pressure was increased, most droplets were concentrated in the small size area of spray droplets. When the injection pressure increased, the injection speed also increased. In addition, when the injection pressure increased, the initial spray momentum increased, as well as the injection velocity.
Figure 11b shows SMD-Velocity distribution at an injection pressure of 0.9 MPa. At the same pressure, water was spread evenly to the region of larger droplet size distribution than n-heptane. Thus, the velocity of water droplets was lower than that of n-heptane. As with n-heptane, water was found to decrease the spray droplet size, concentrate the distribution of droplets size, and increase the spray droplet velocity as injection pressure increased.


