Comparison of Power Output Forecasting on the Photovoltaic System Using Adaptive Neuro-Fuzzy Inference Systems and Particle Swarm Optimization-Artificial Neural Network Model


Abstract
:1. Introduction
2. Energy Efficiency Analysis in Thailand
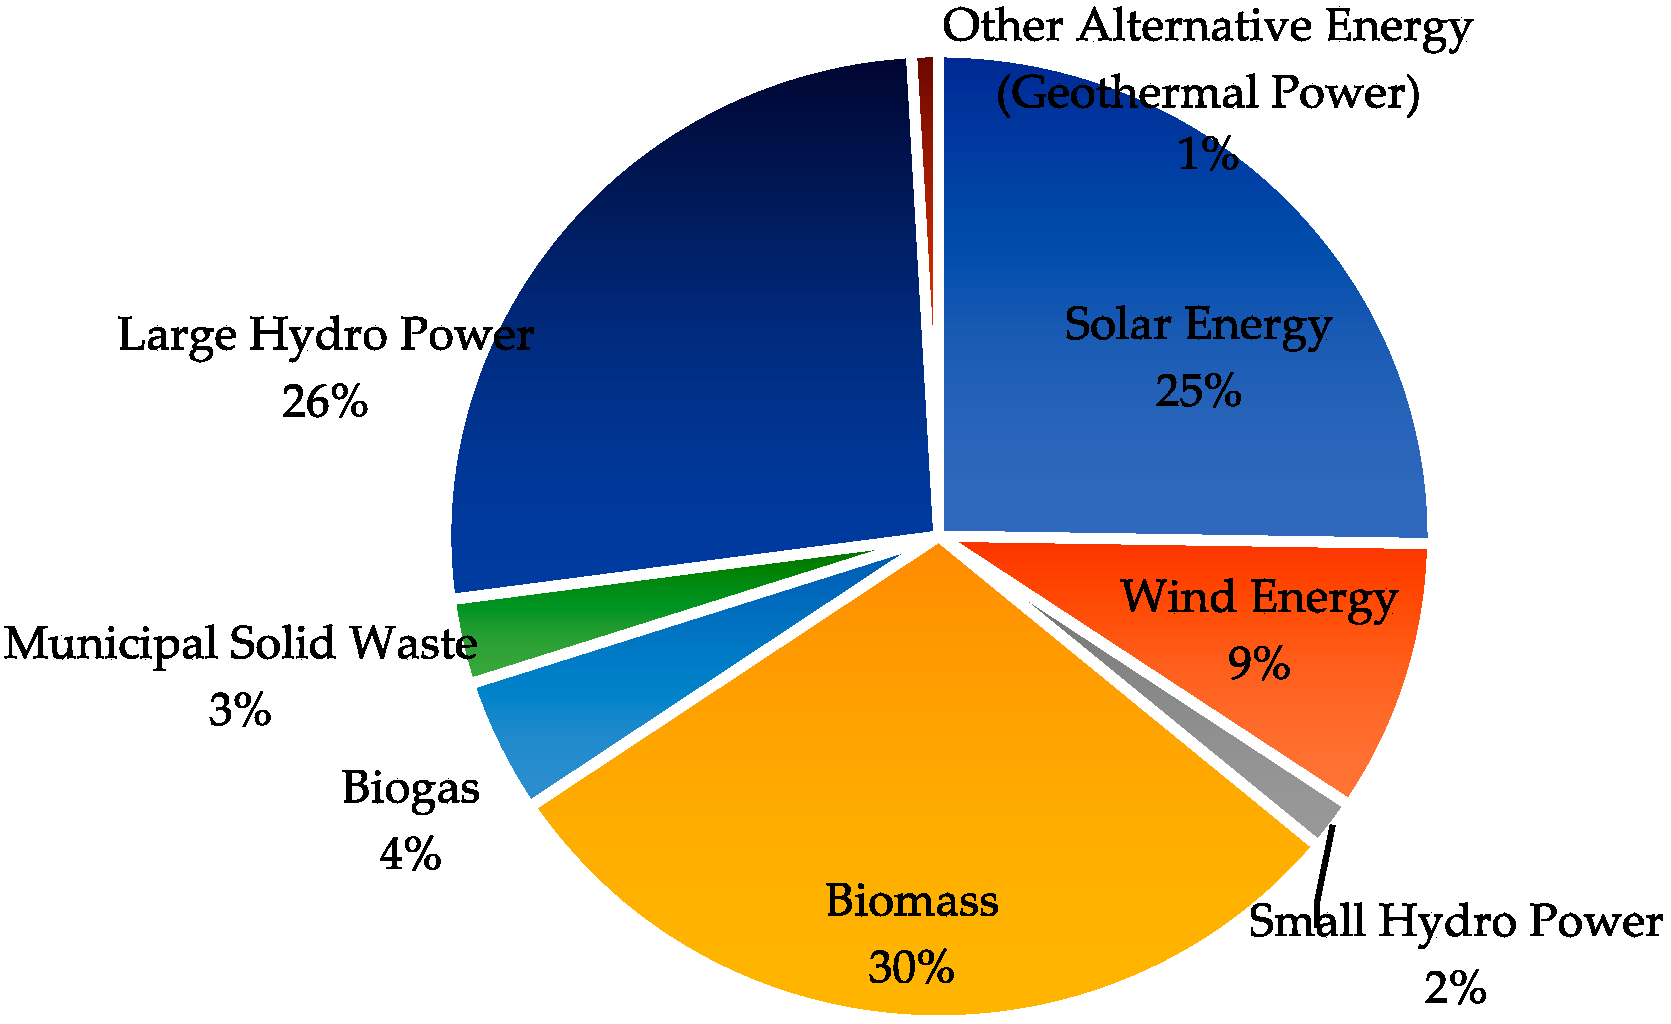
2.1. Energy Sources in Thailand
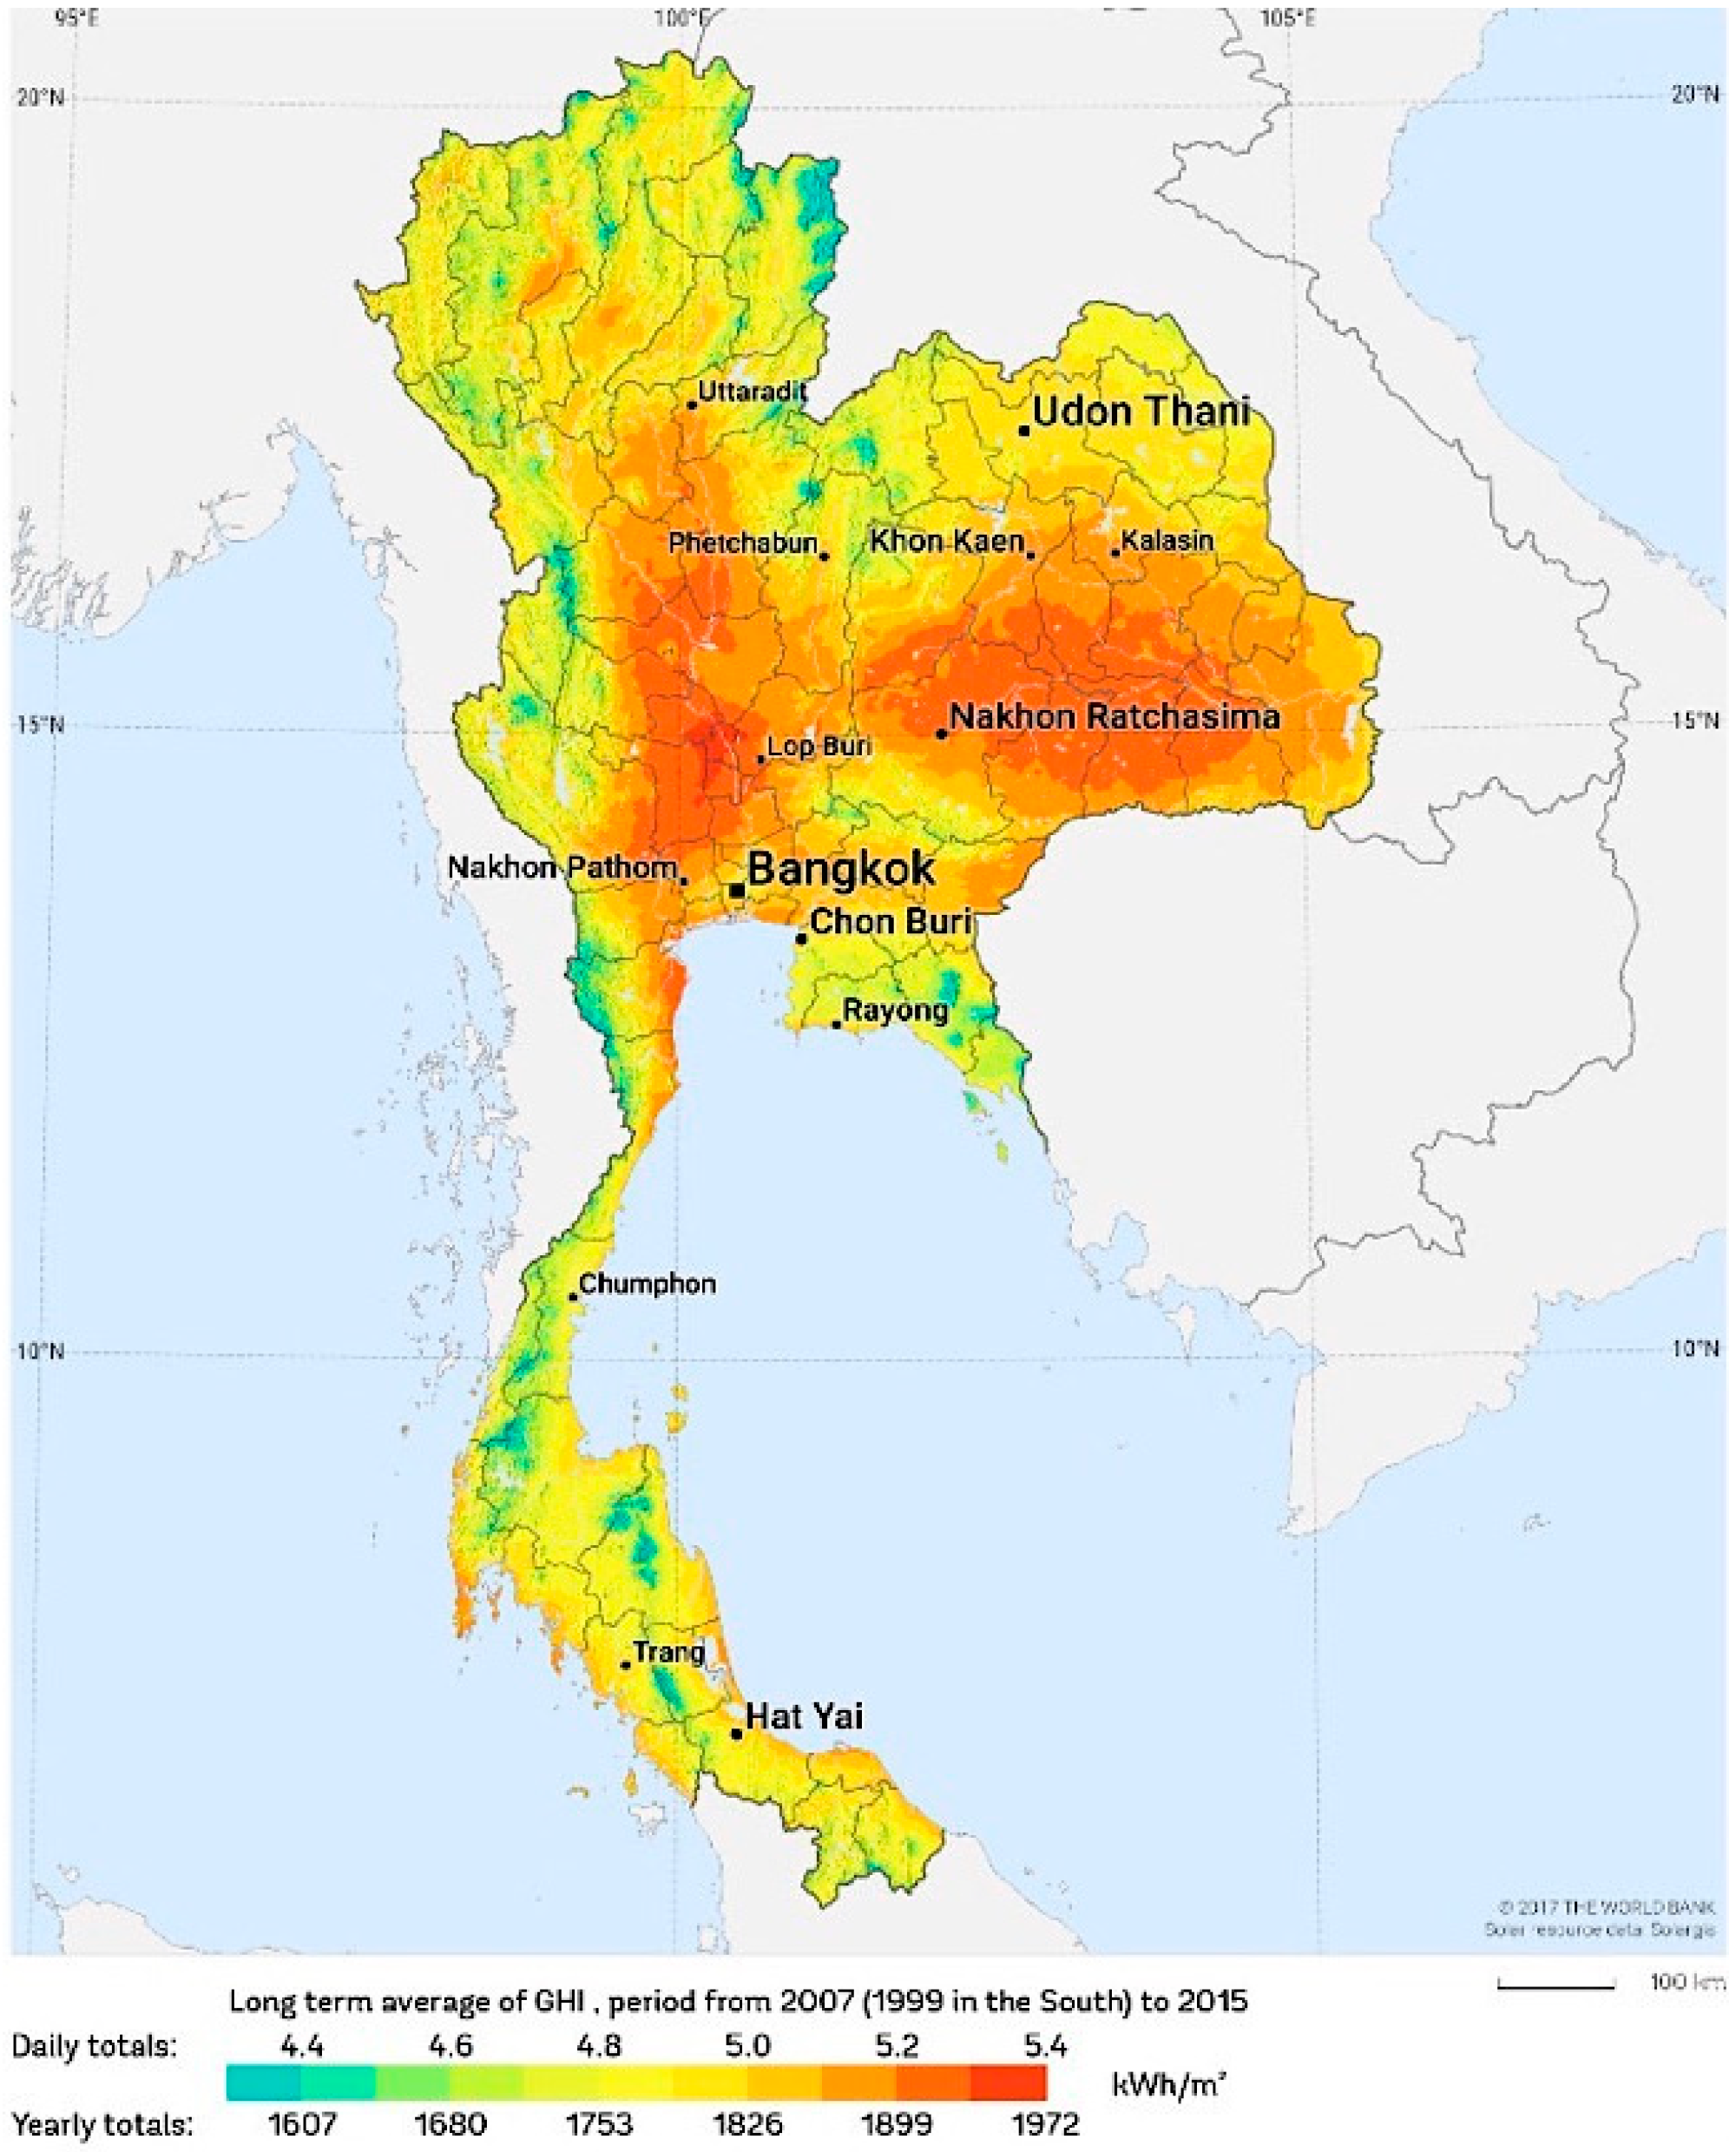
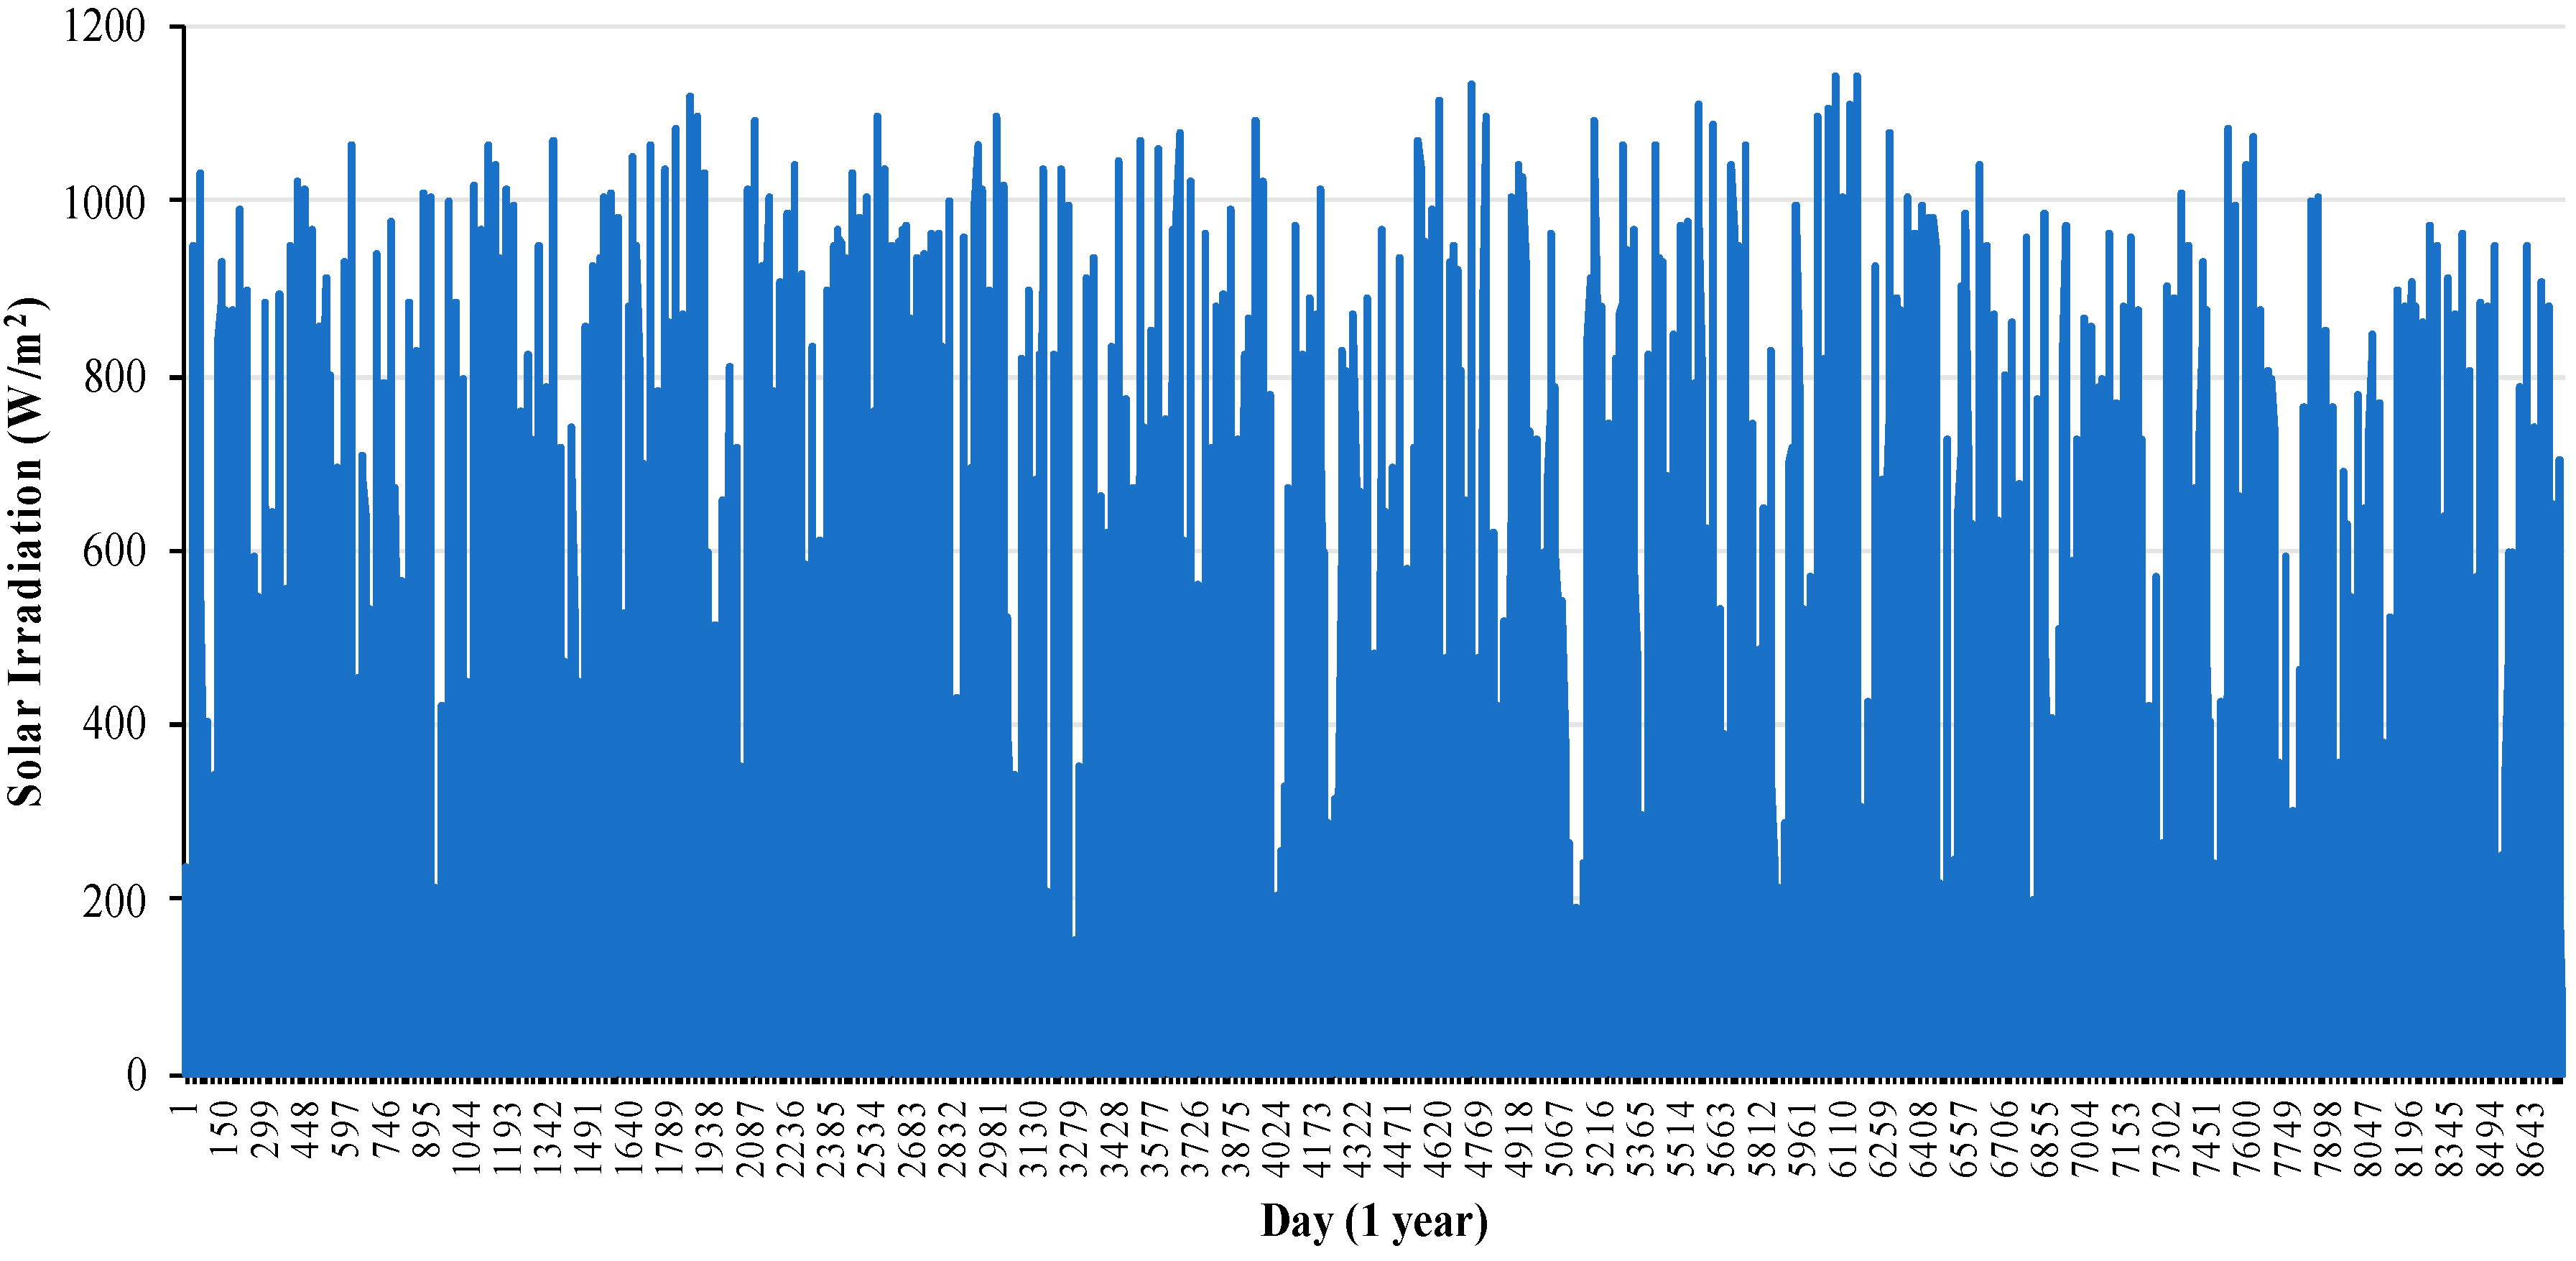
2.2. Solar Radiation
3. PV Power Output Forecasting Model
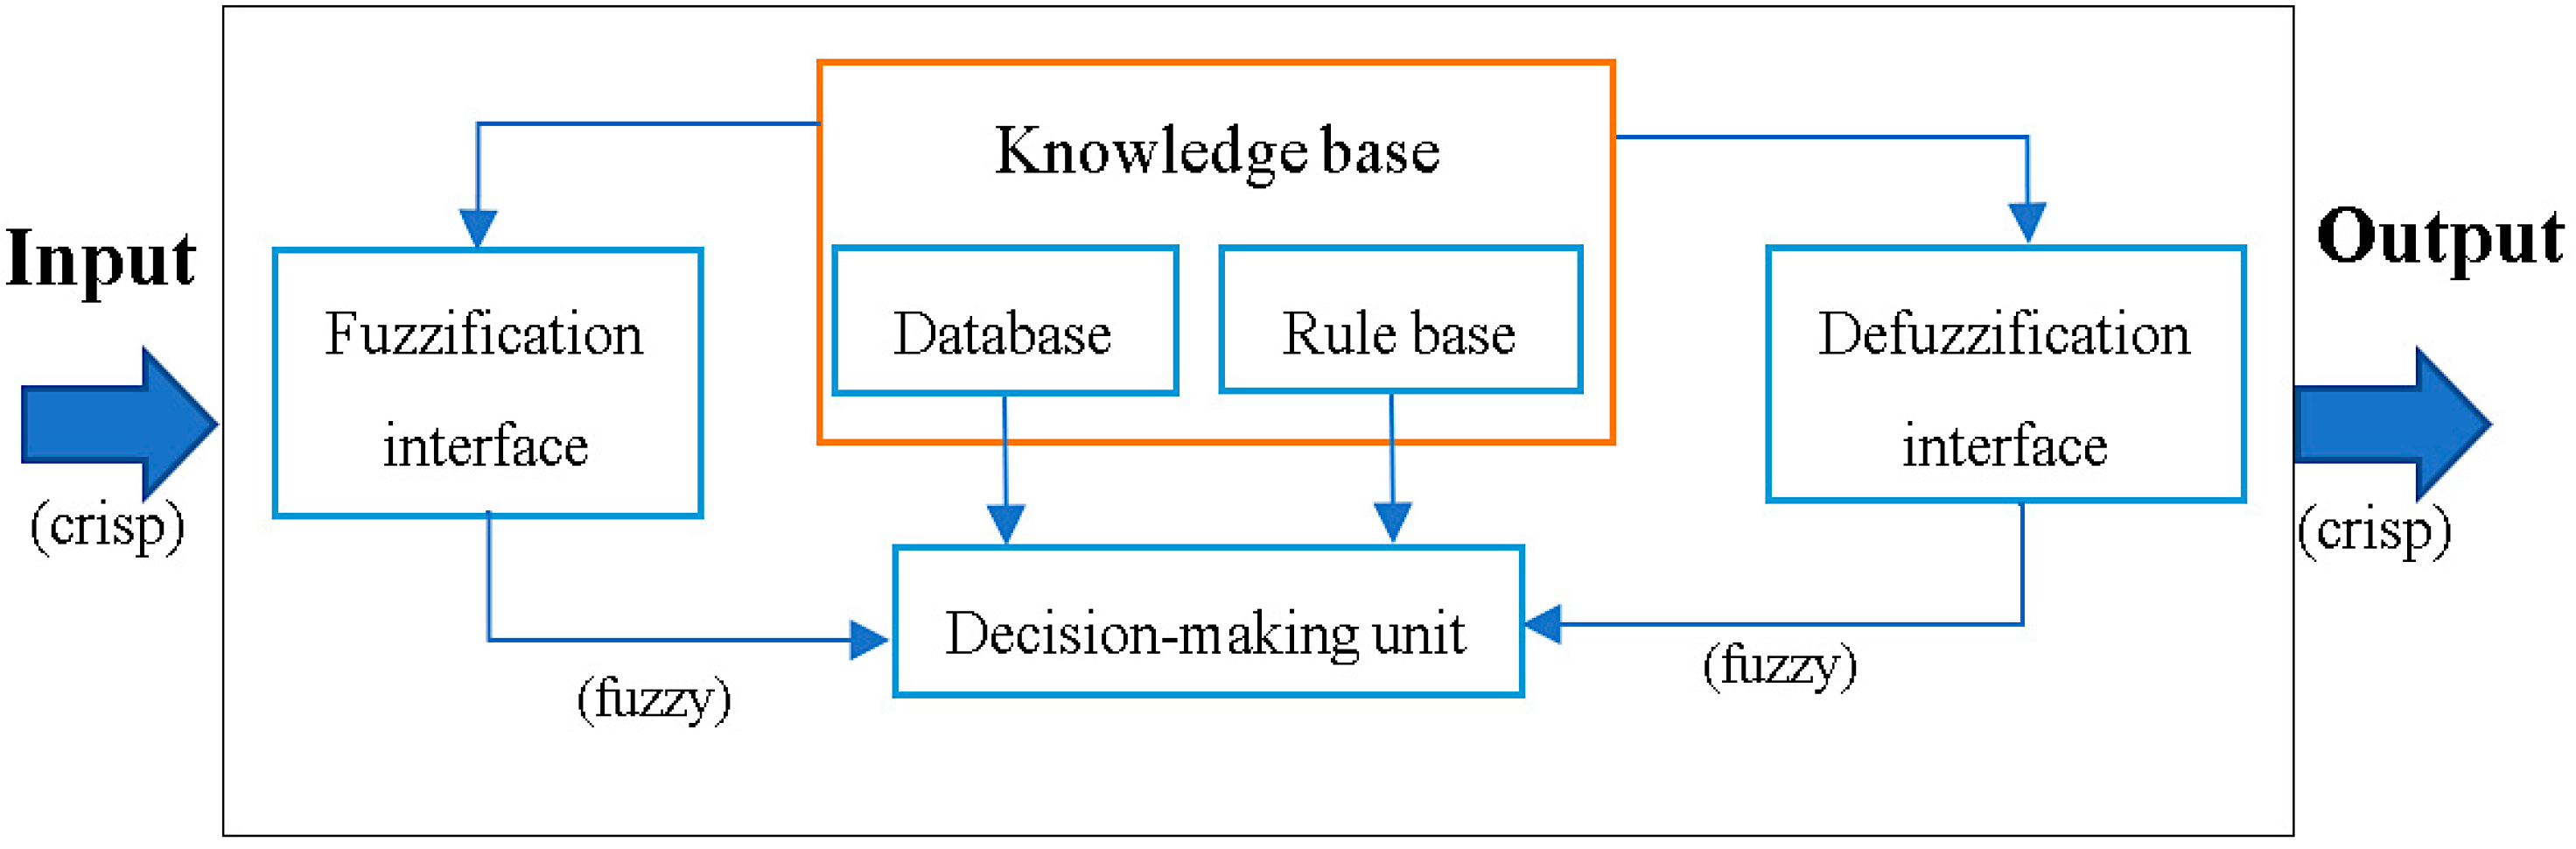
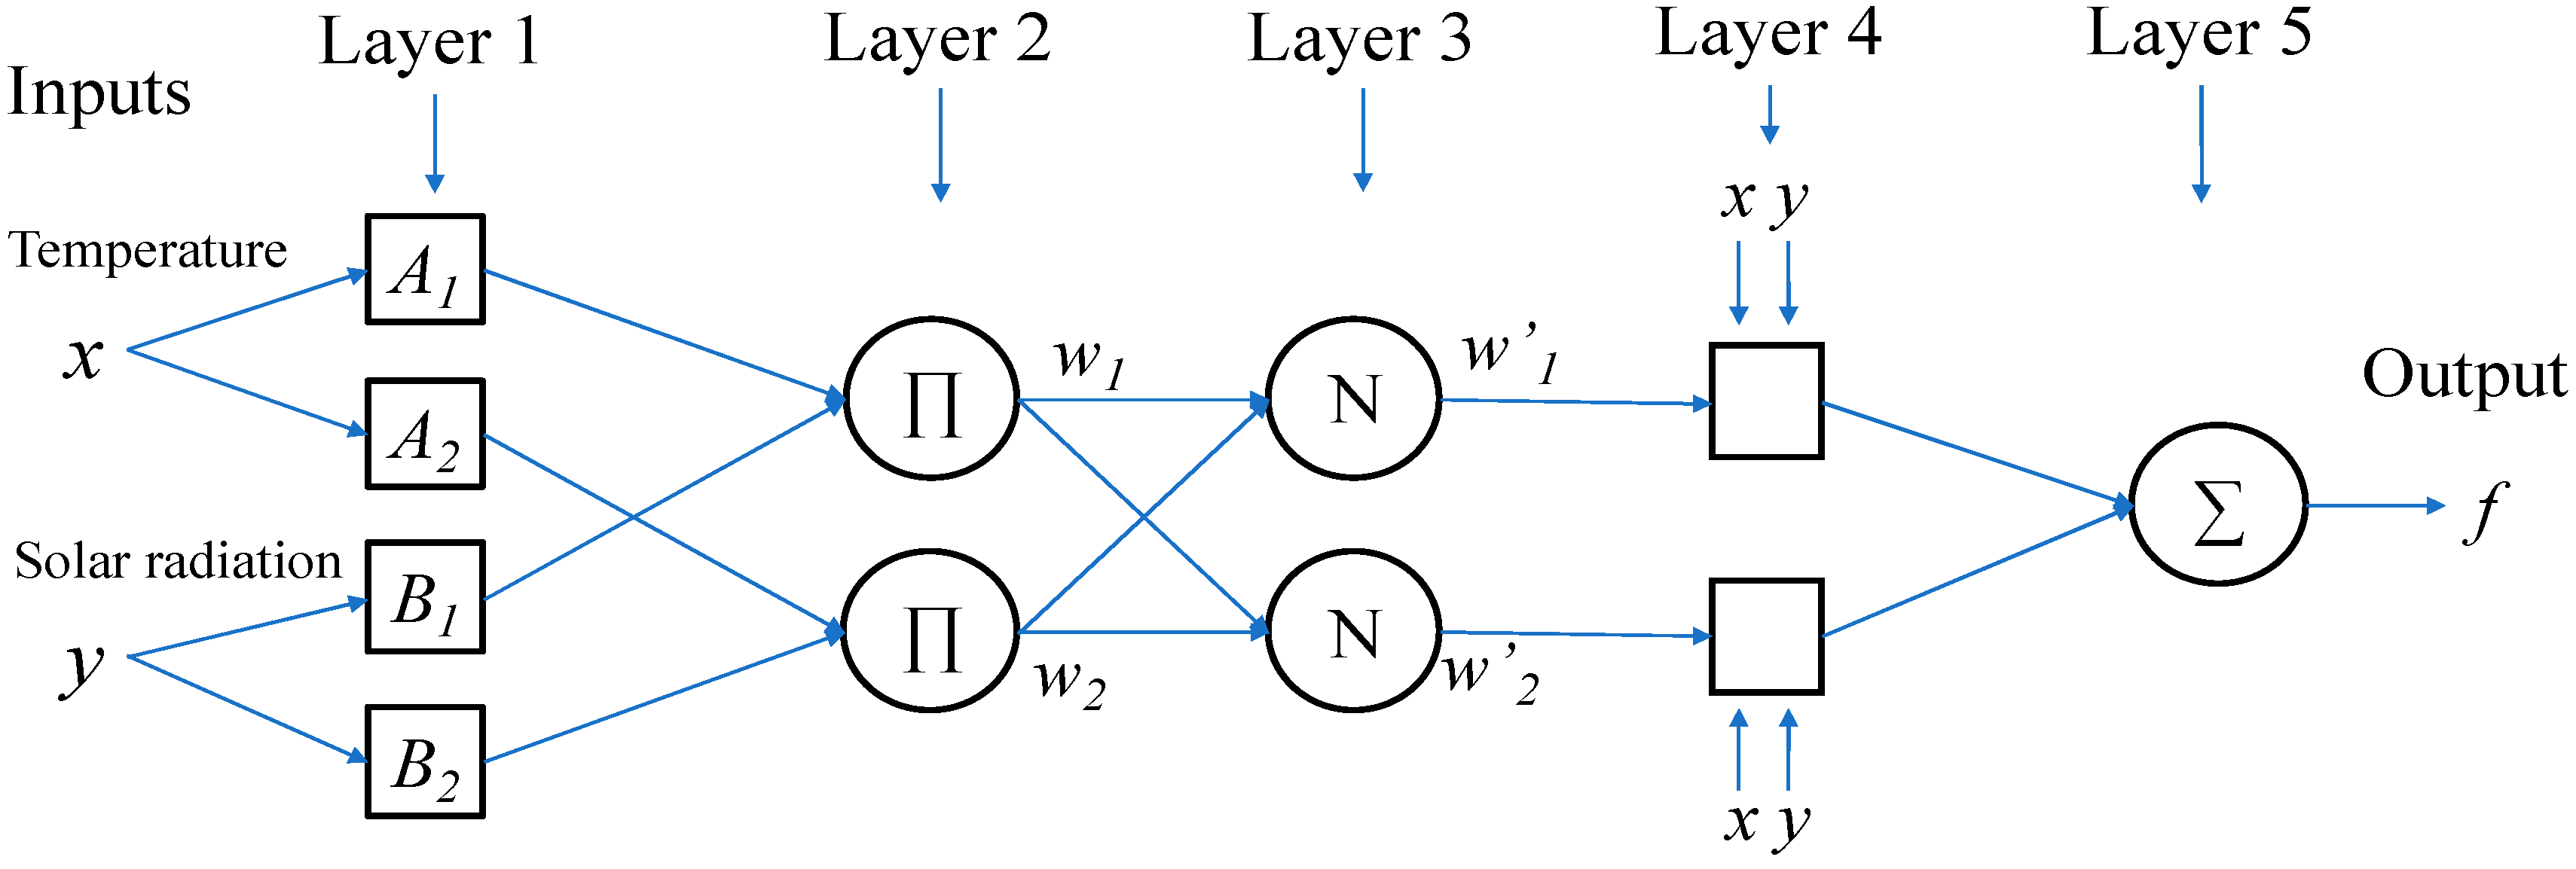
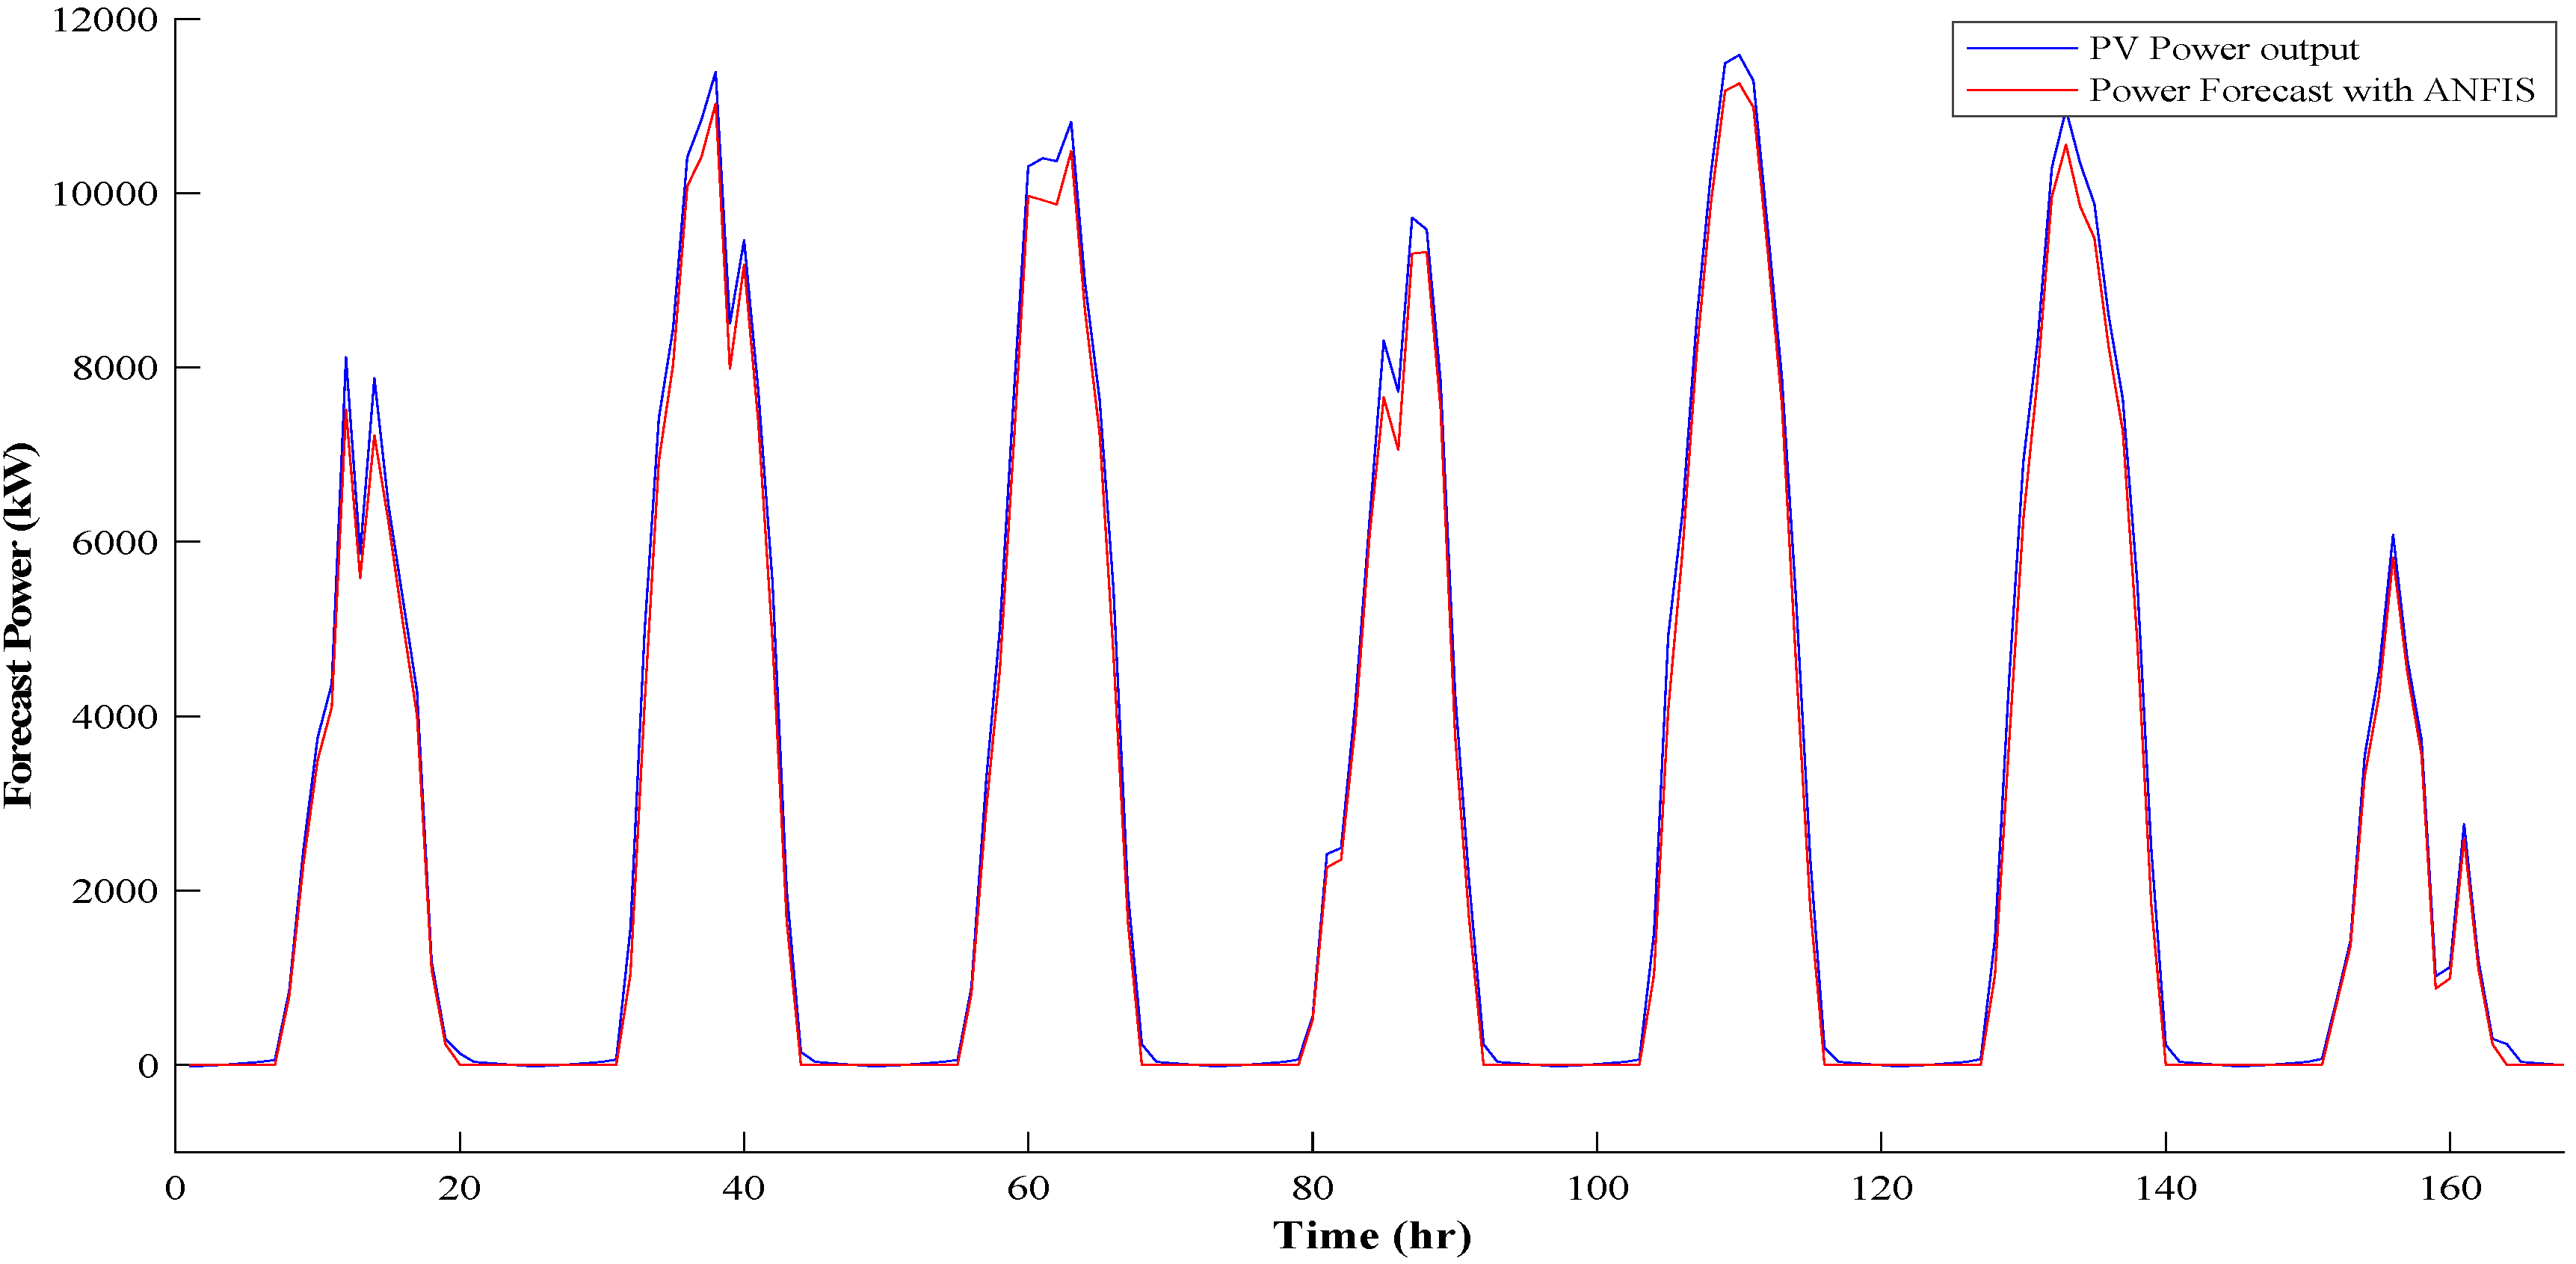
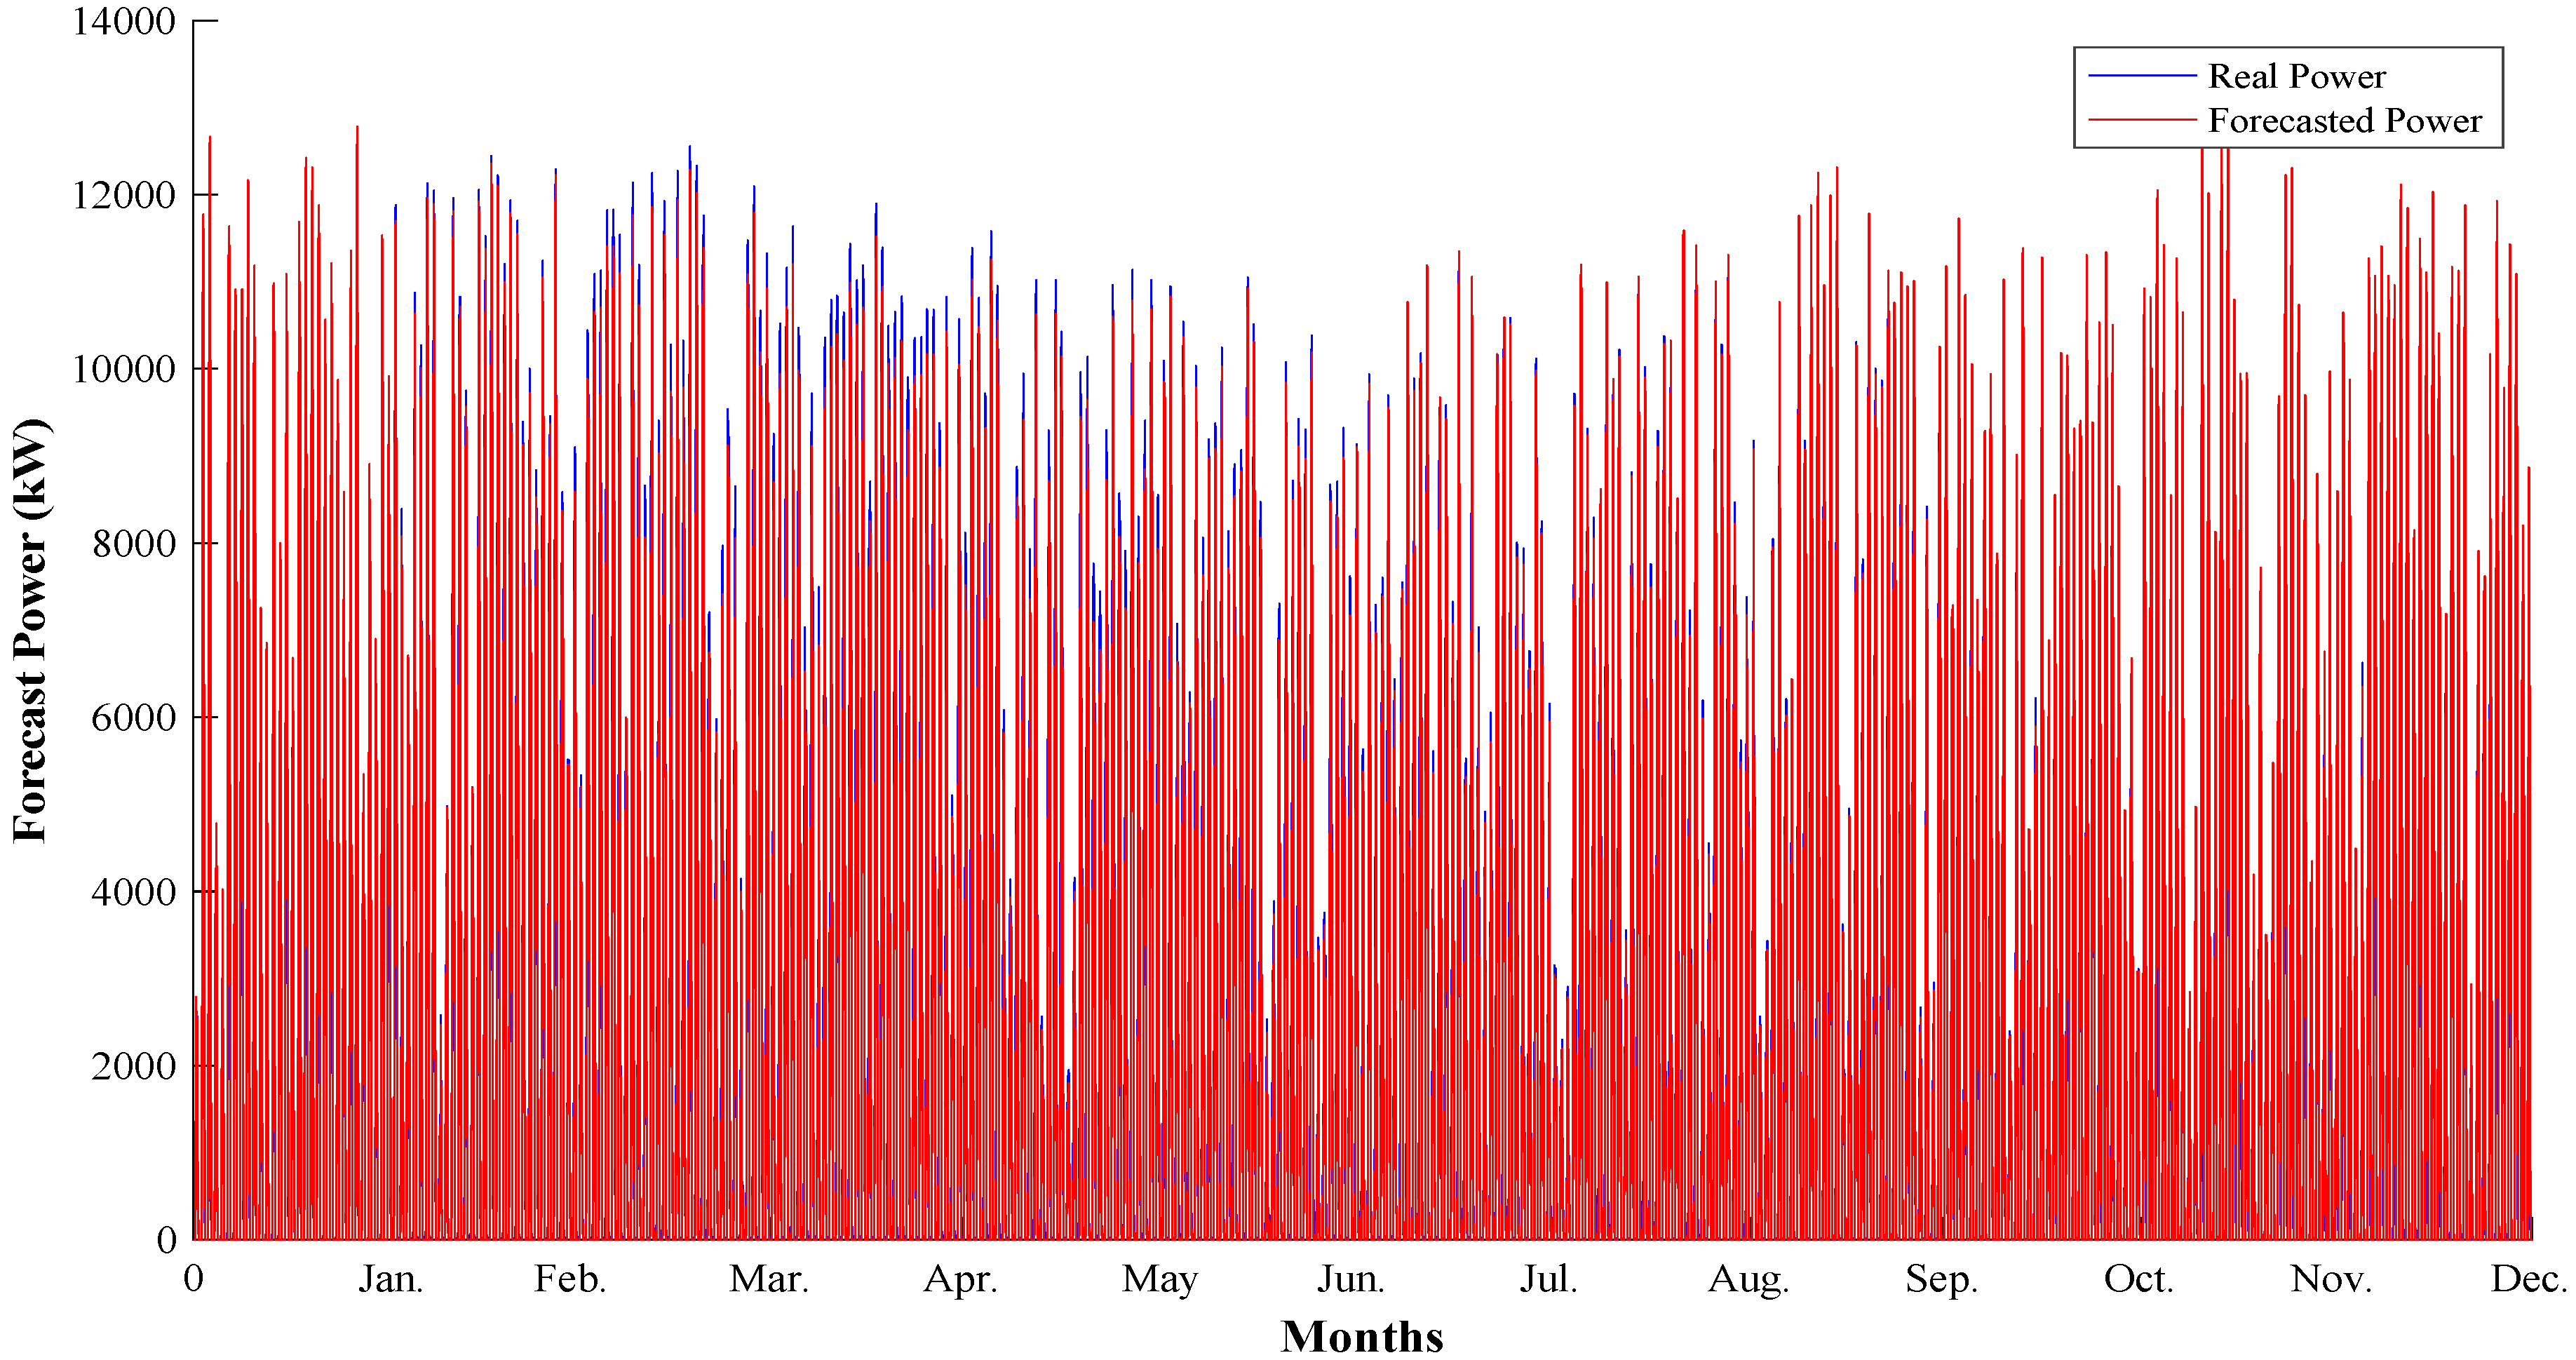
3.1. ANFIS Model
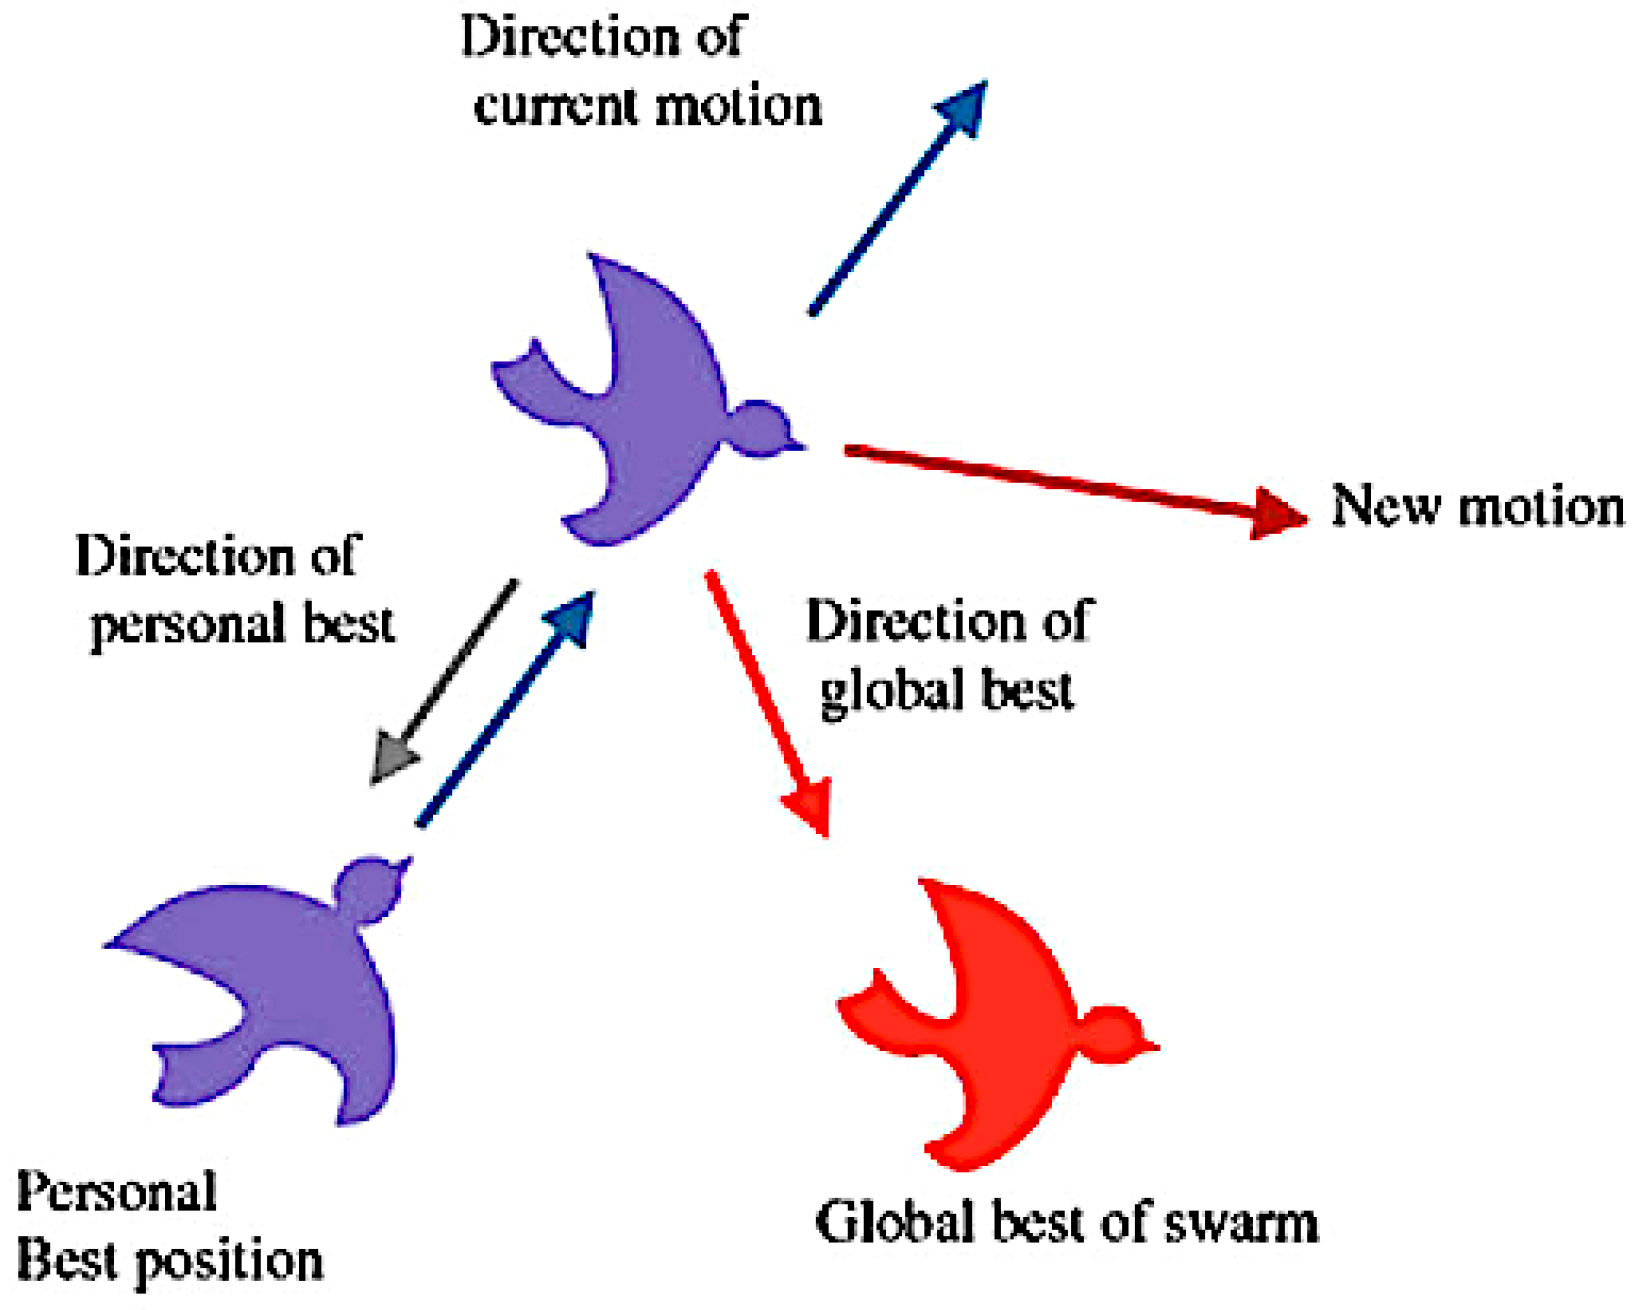
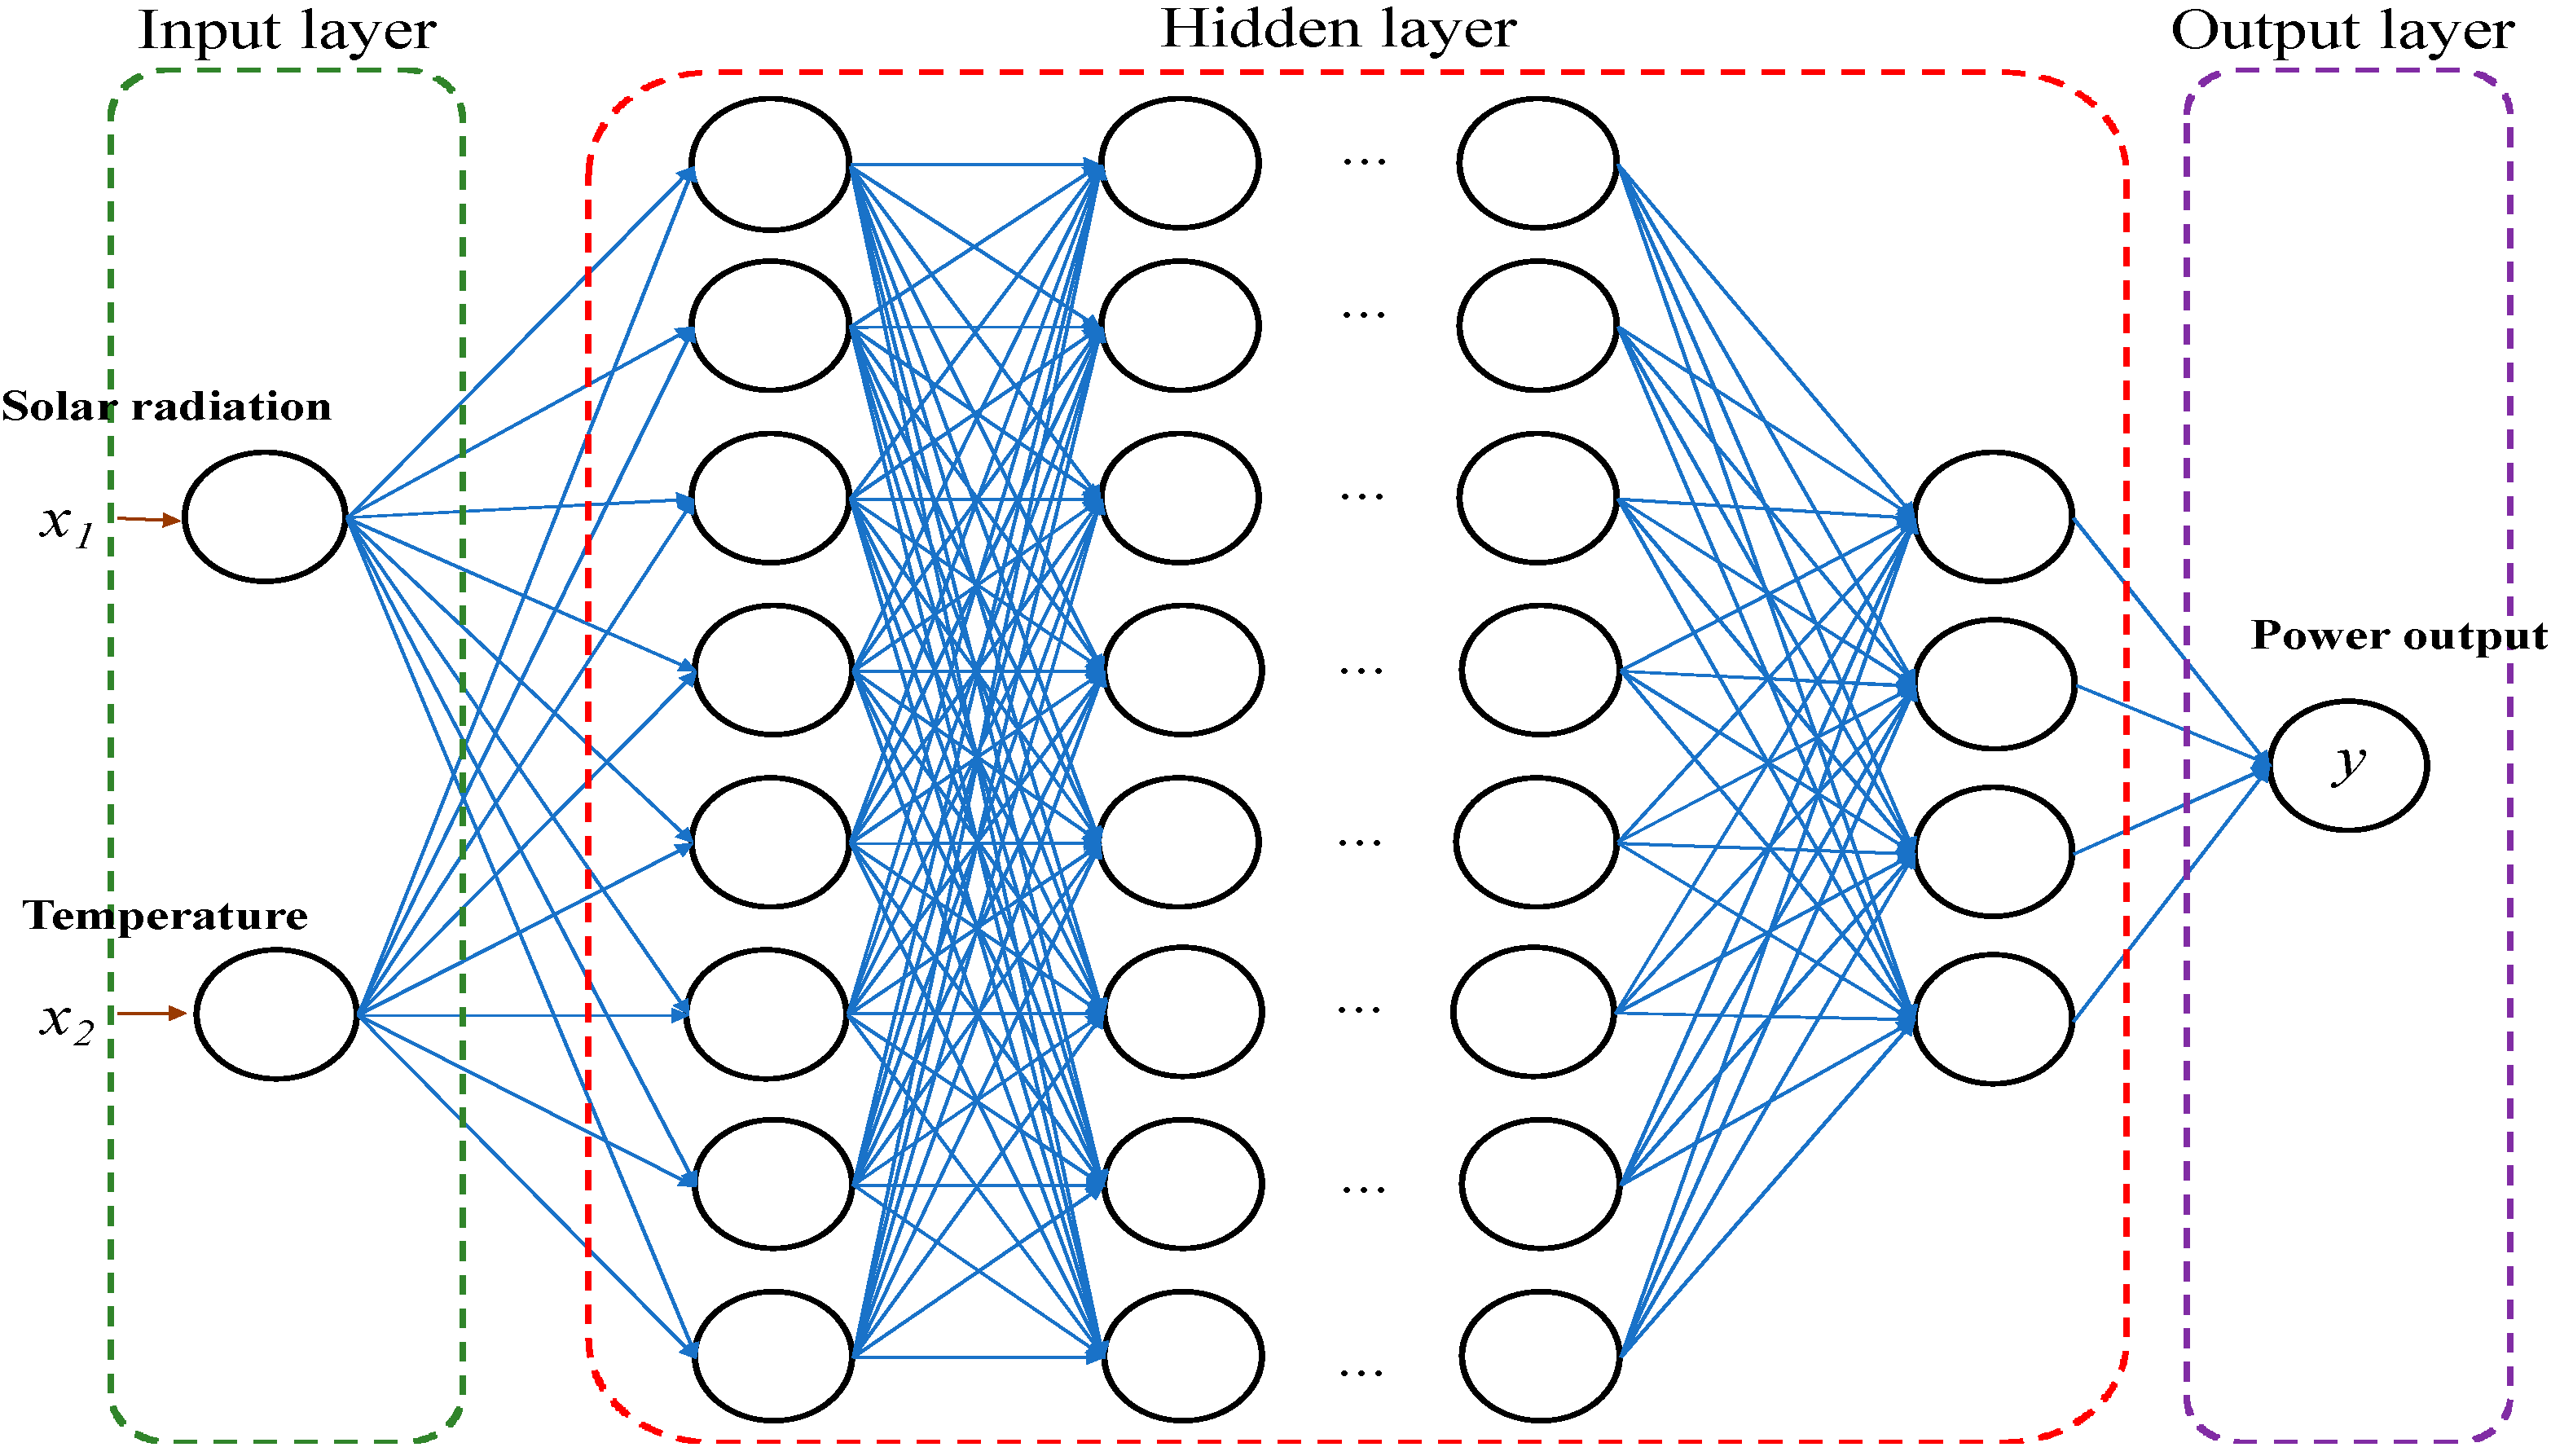
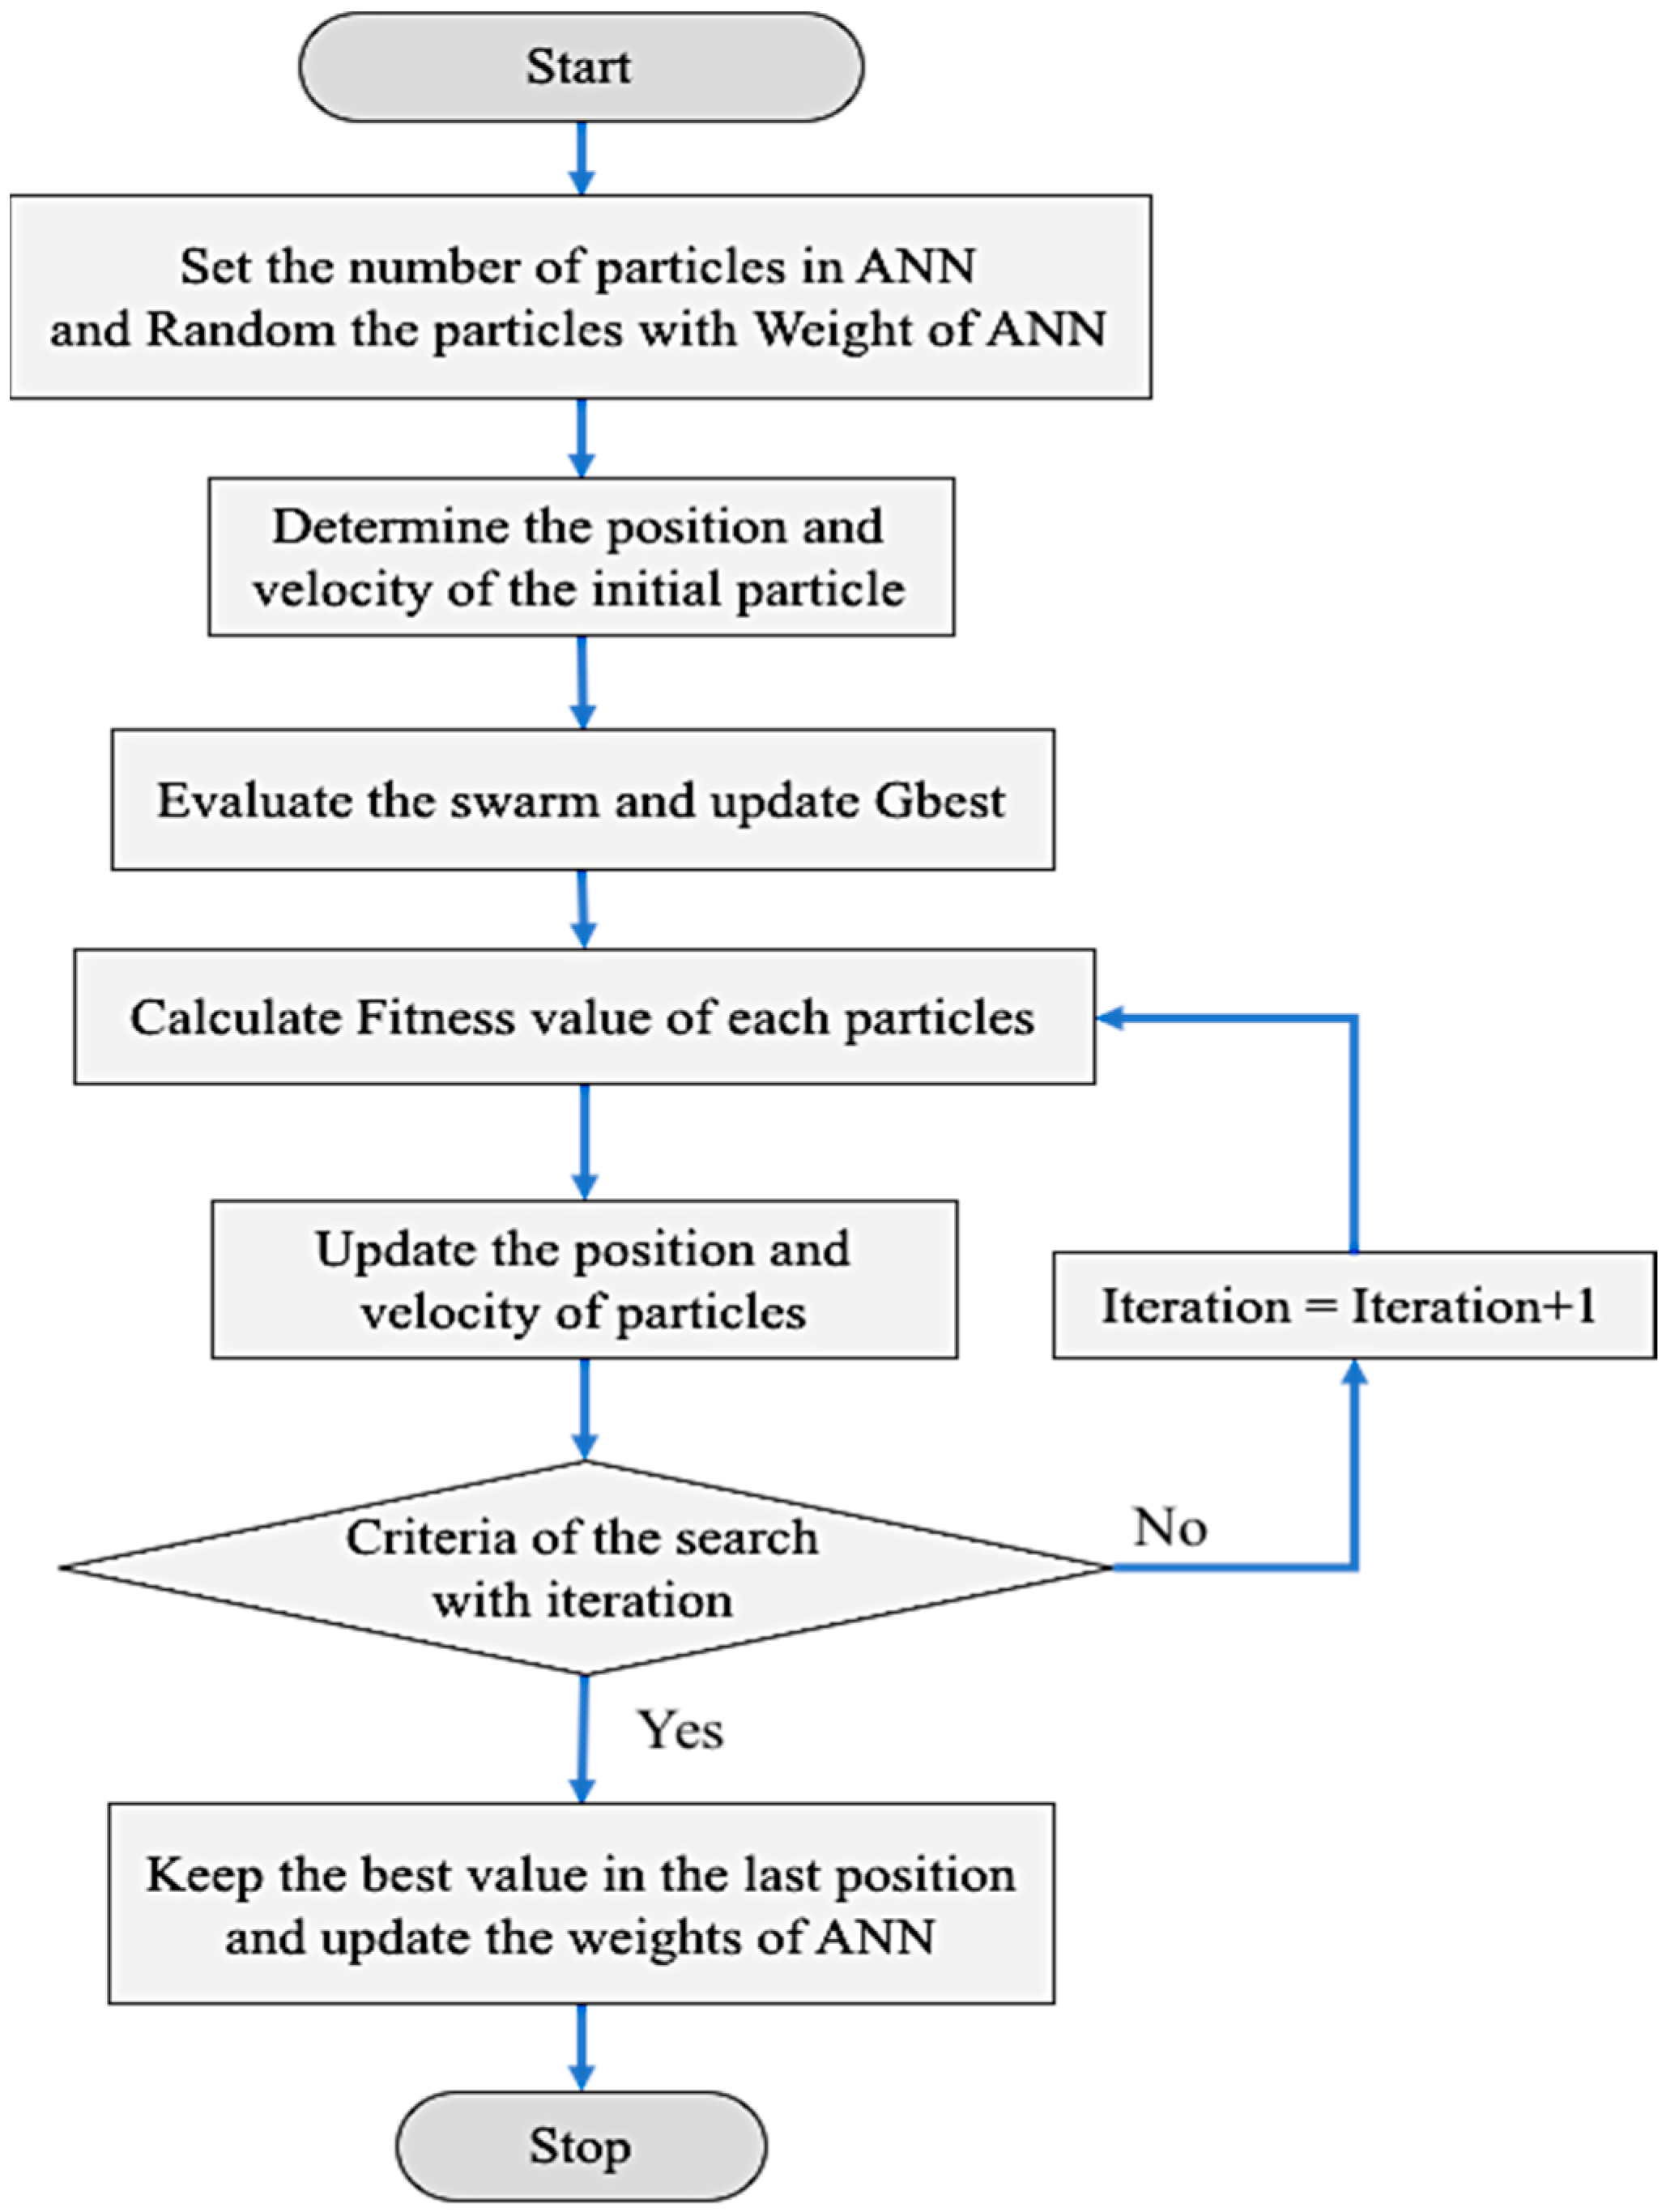
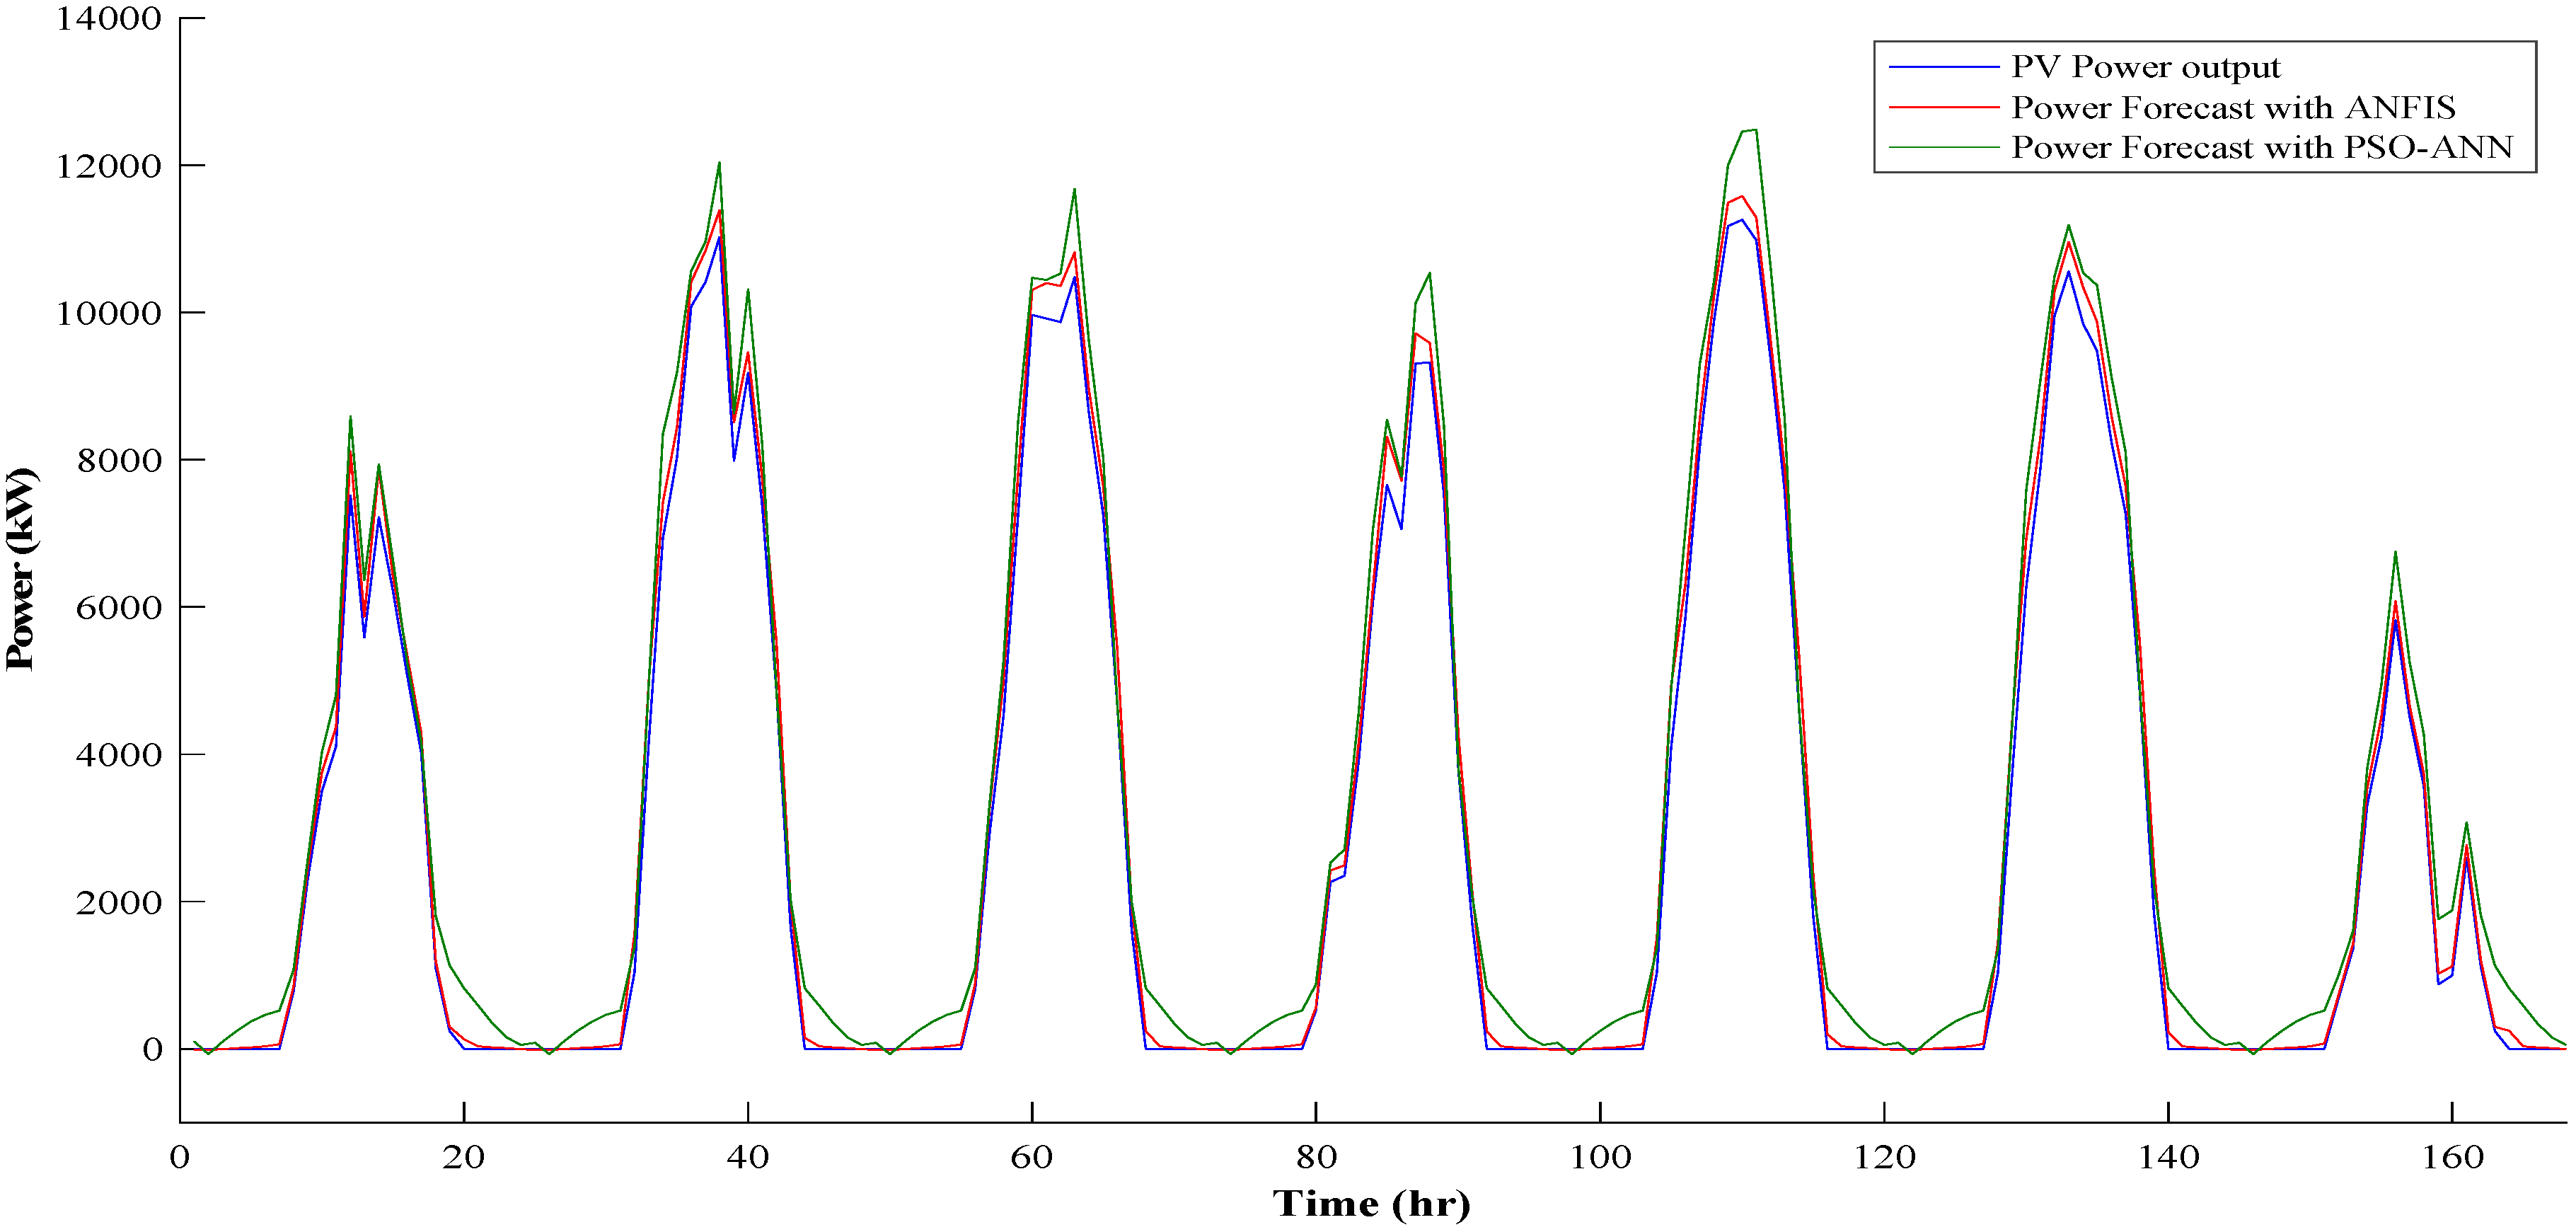
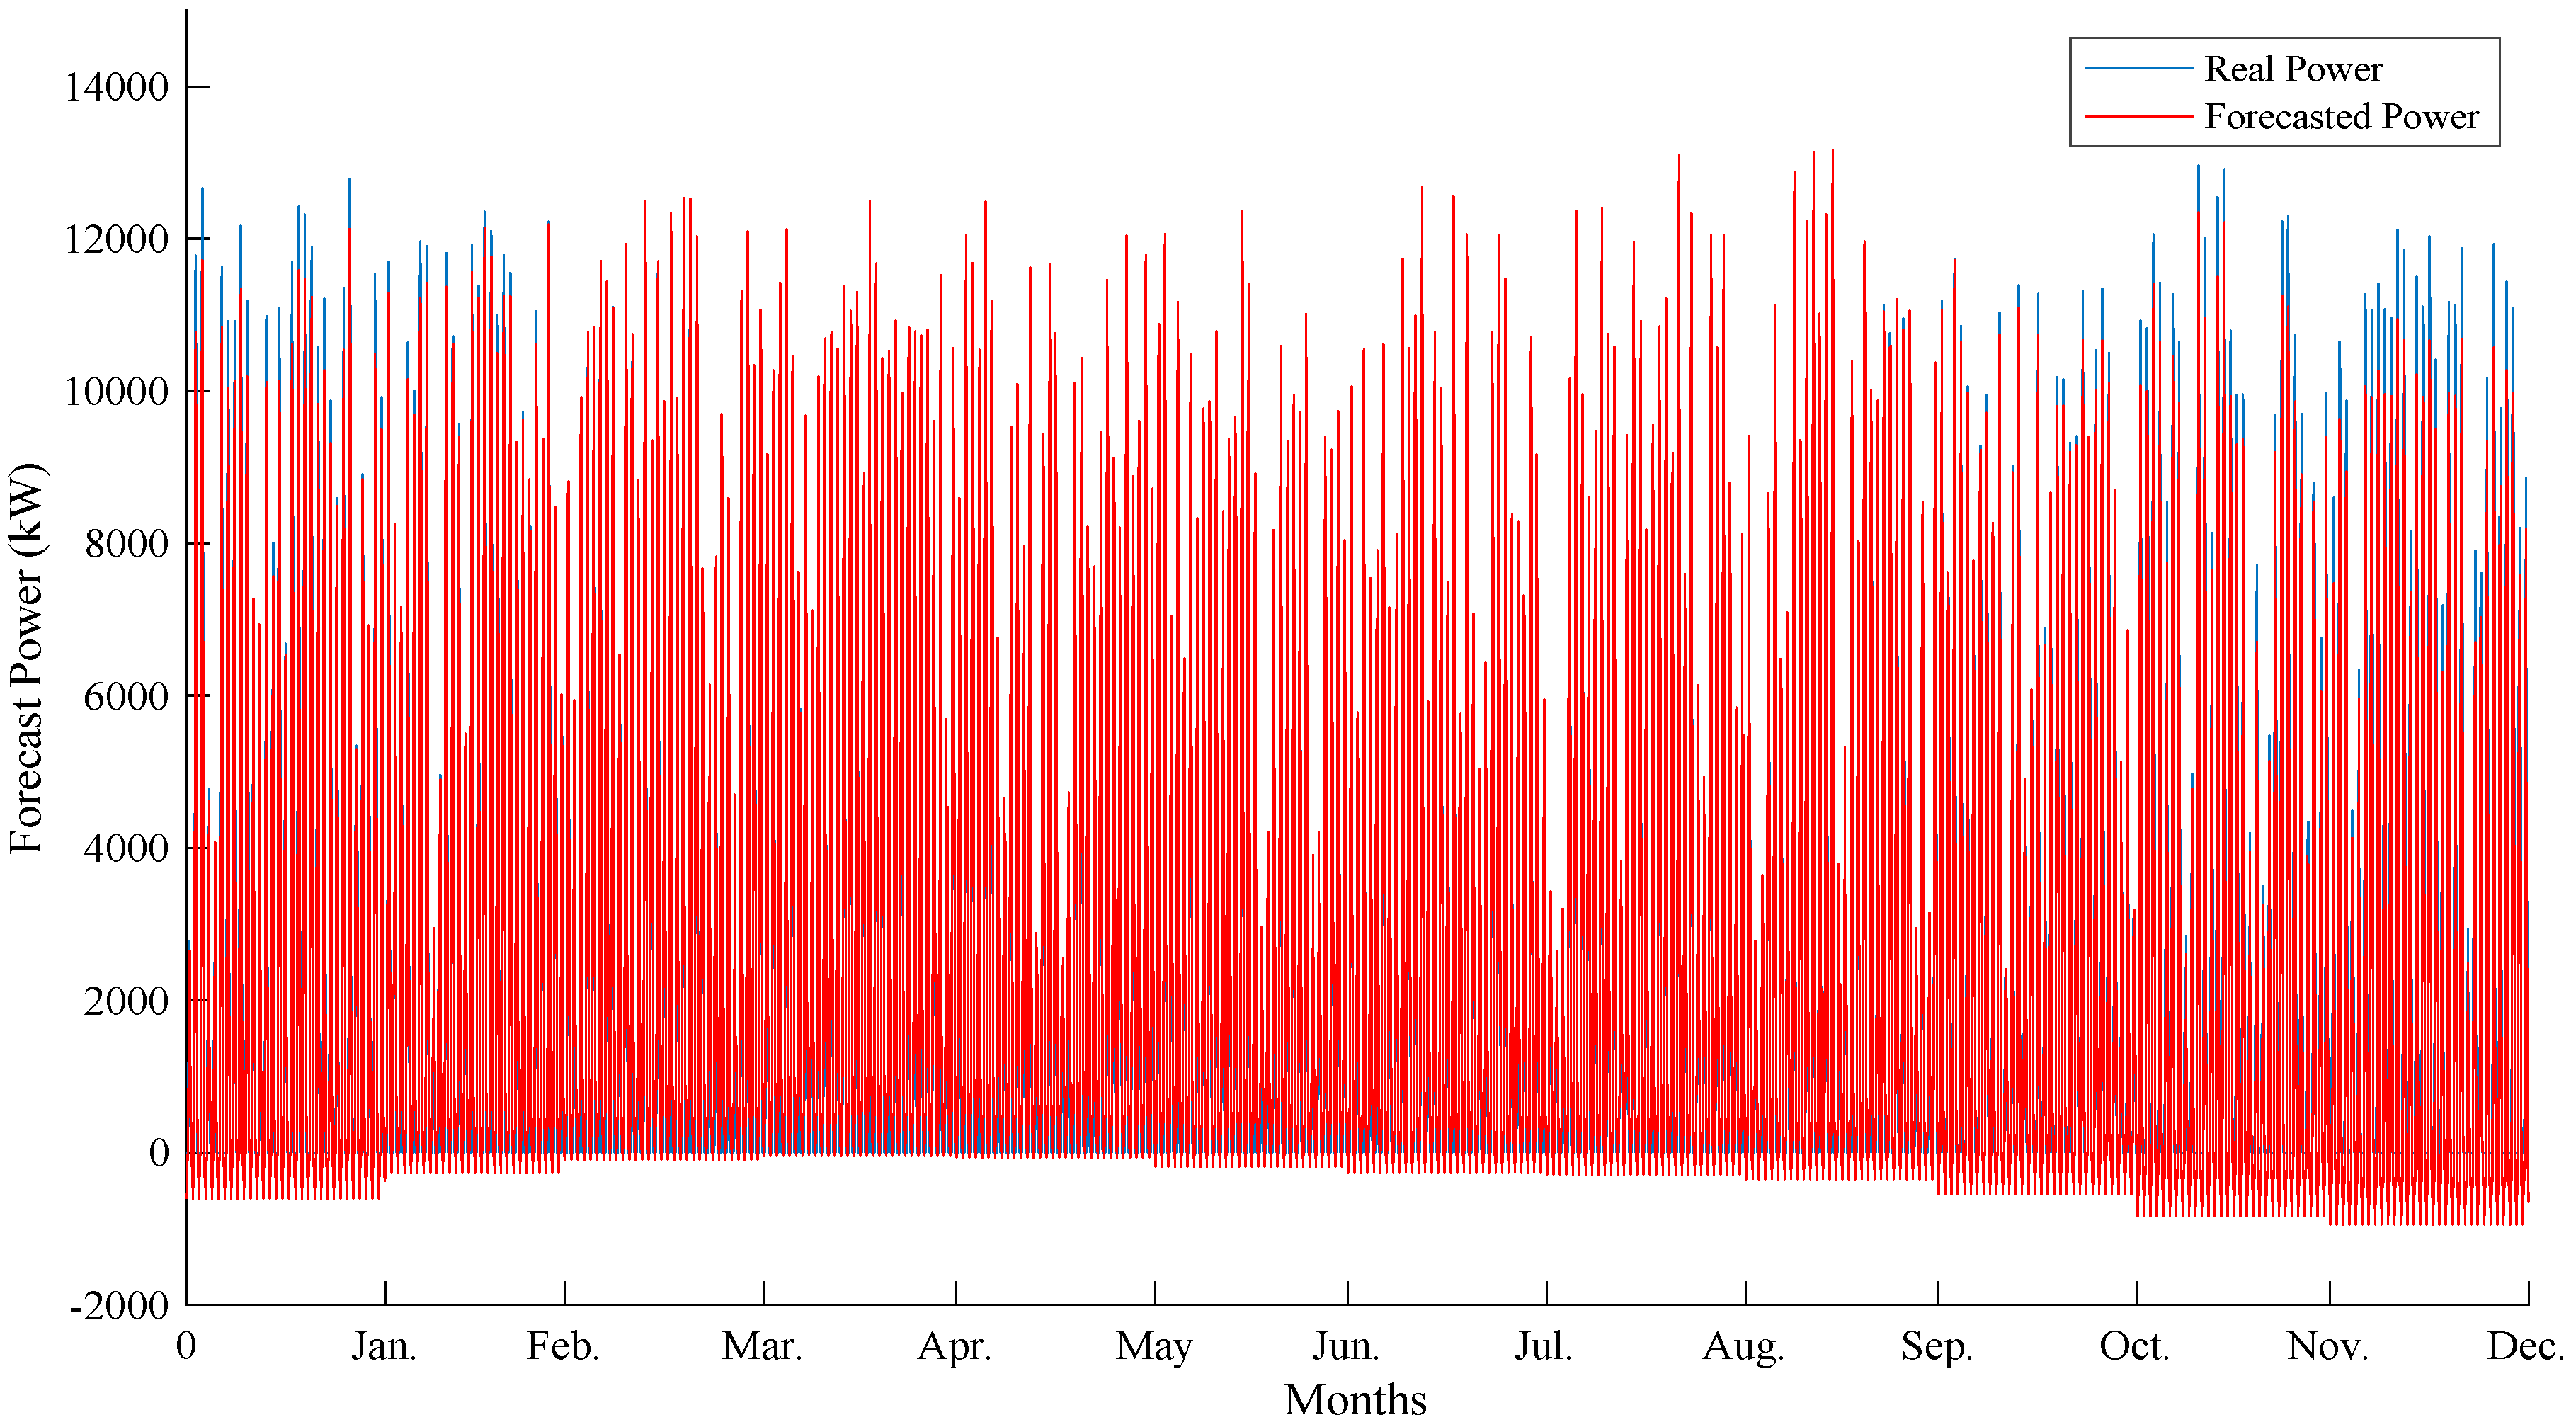
3.2. PSO-ANN Model
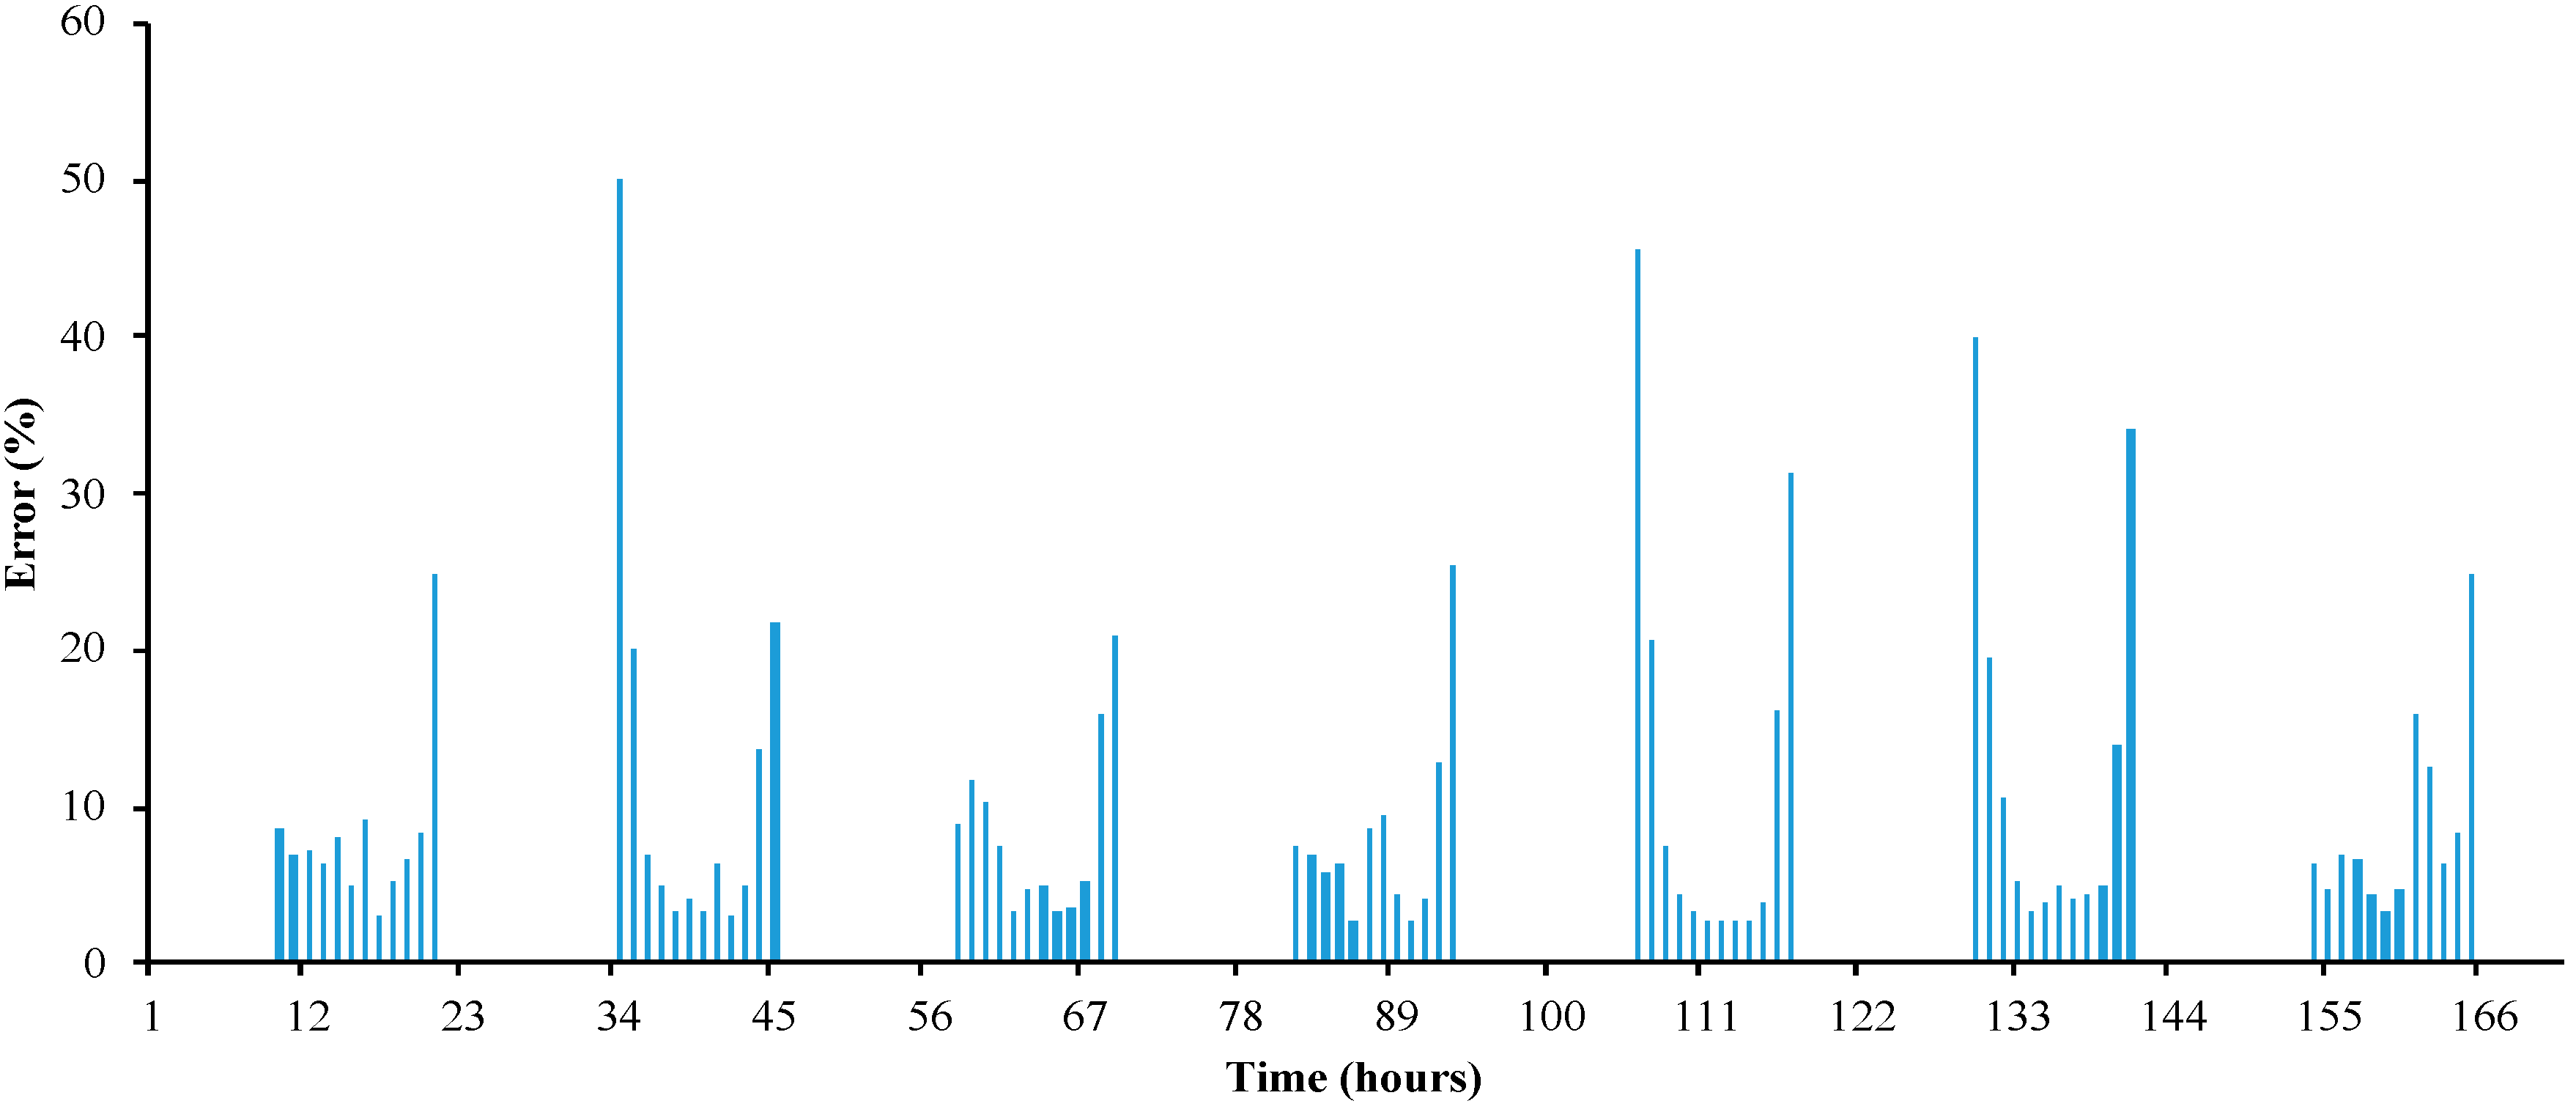
3.3. Accuracy of the Simulation Results
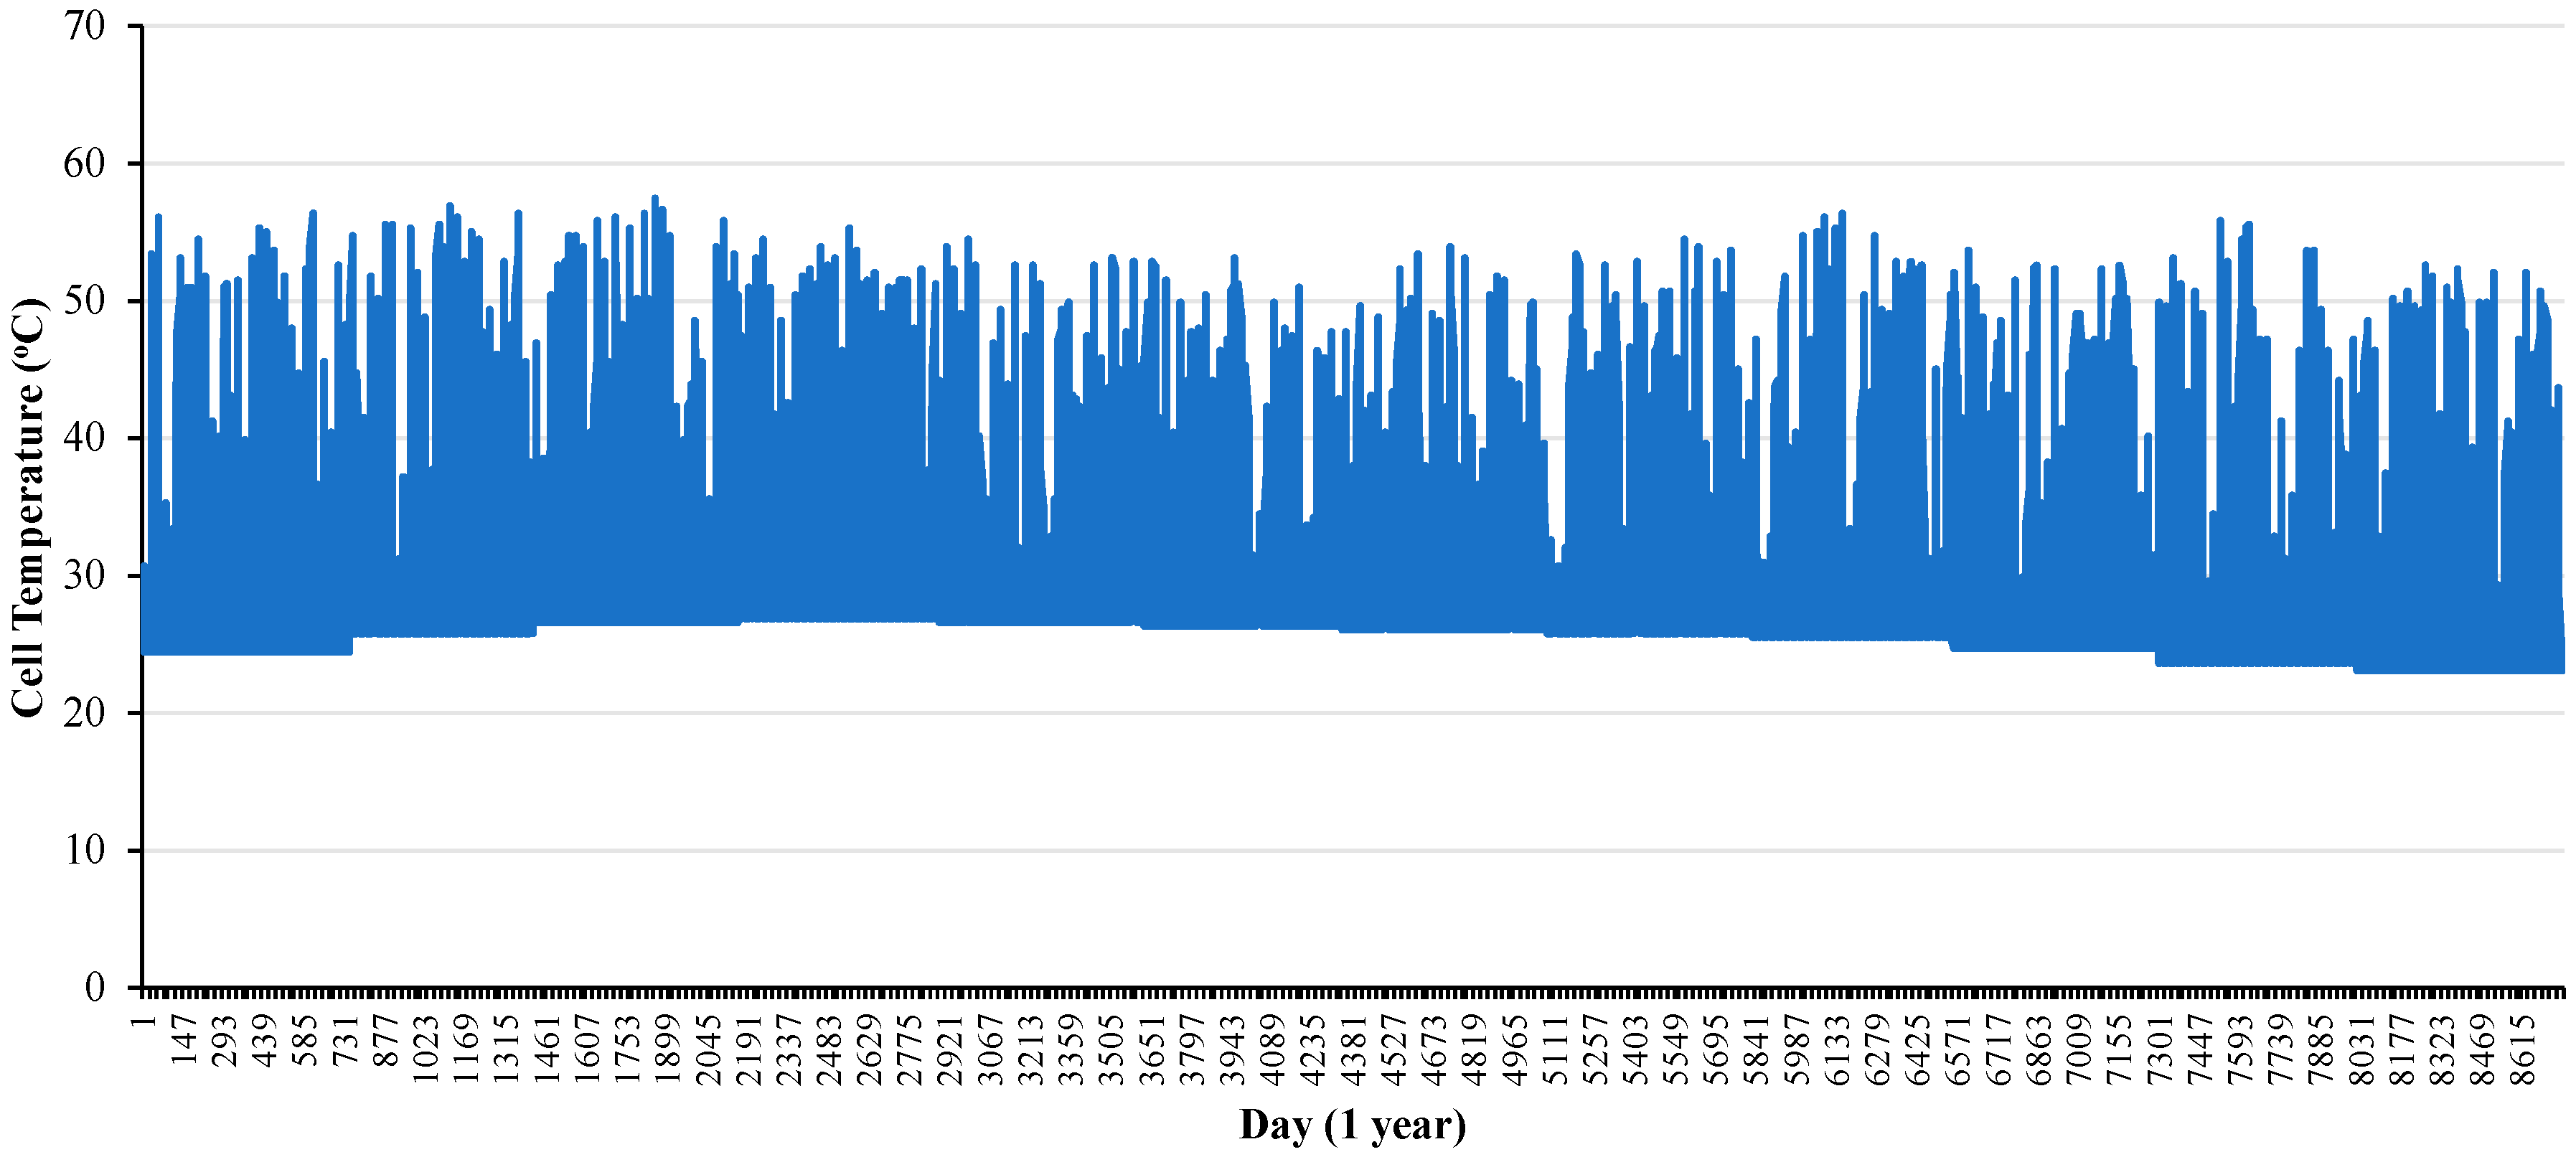
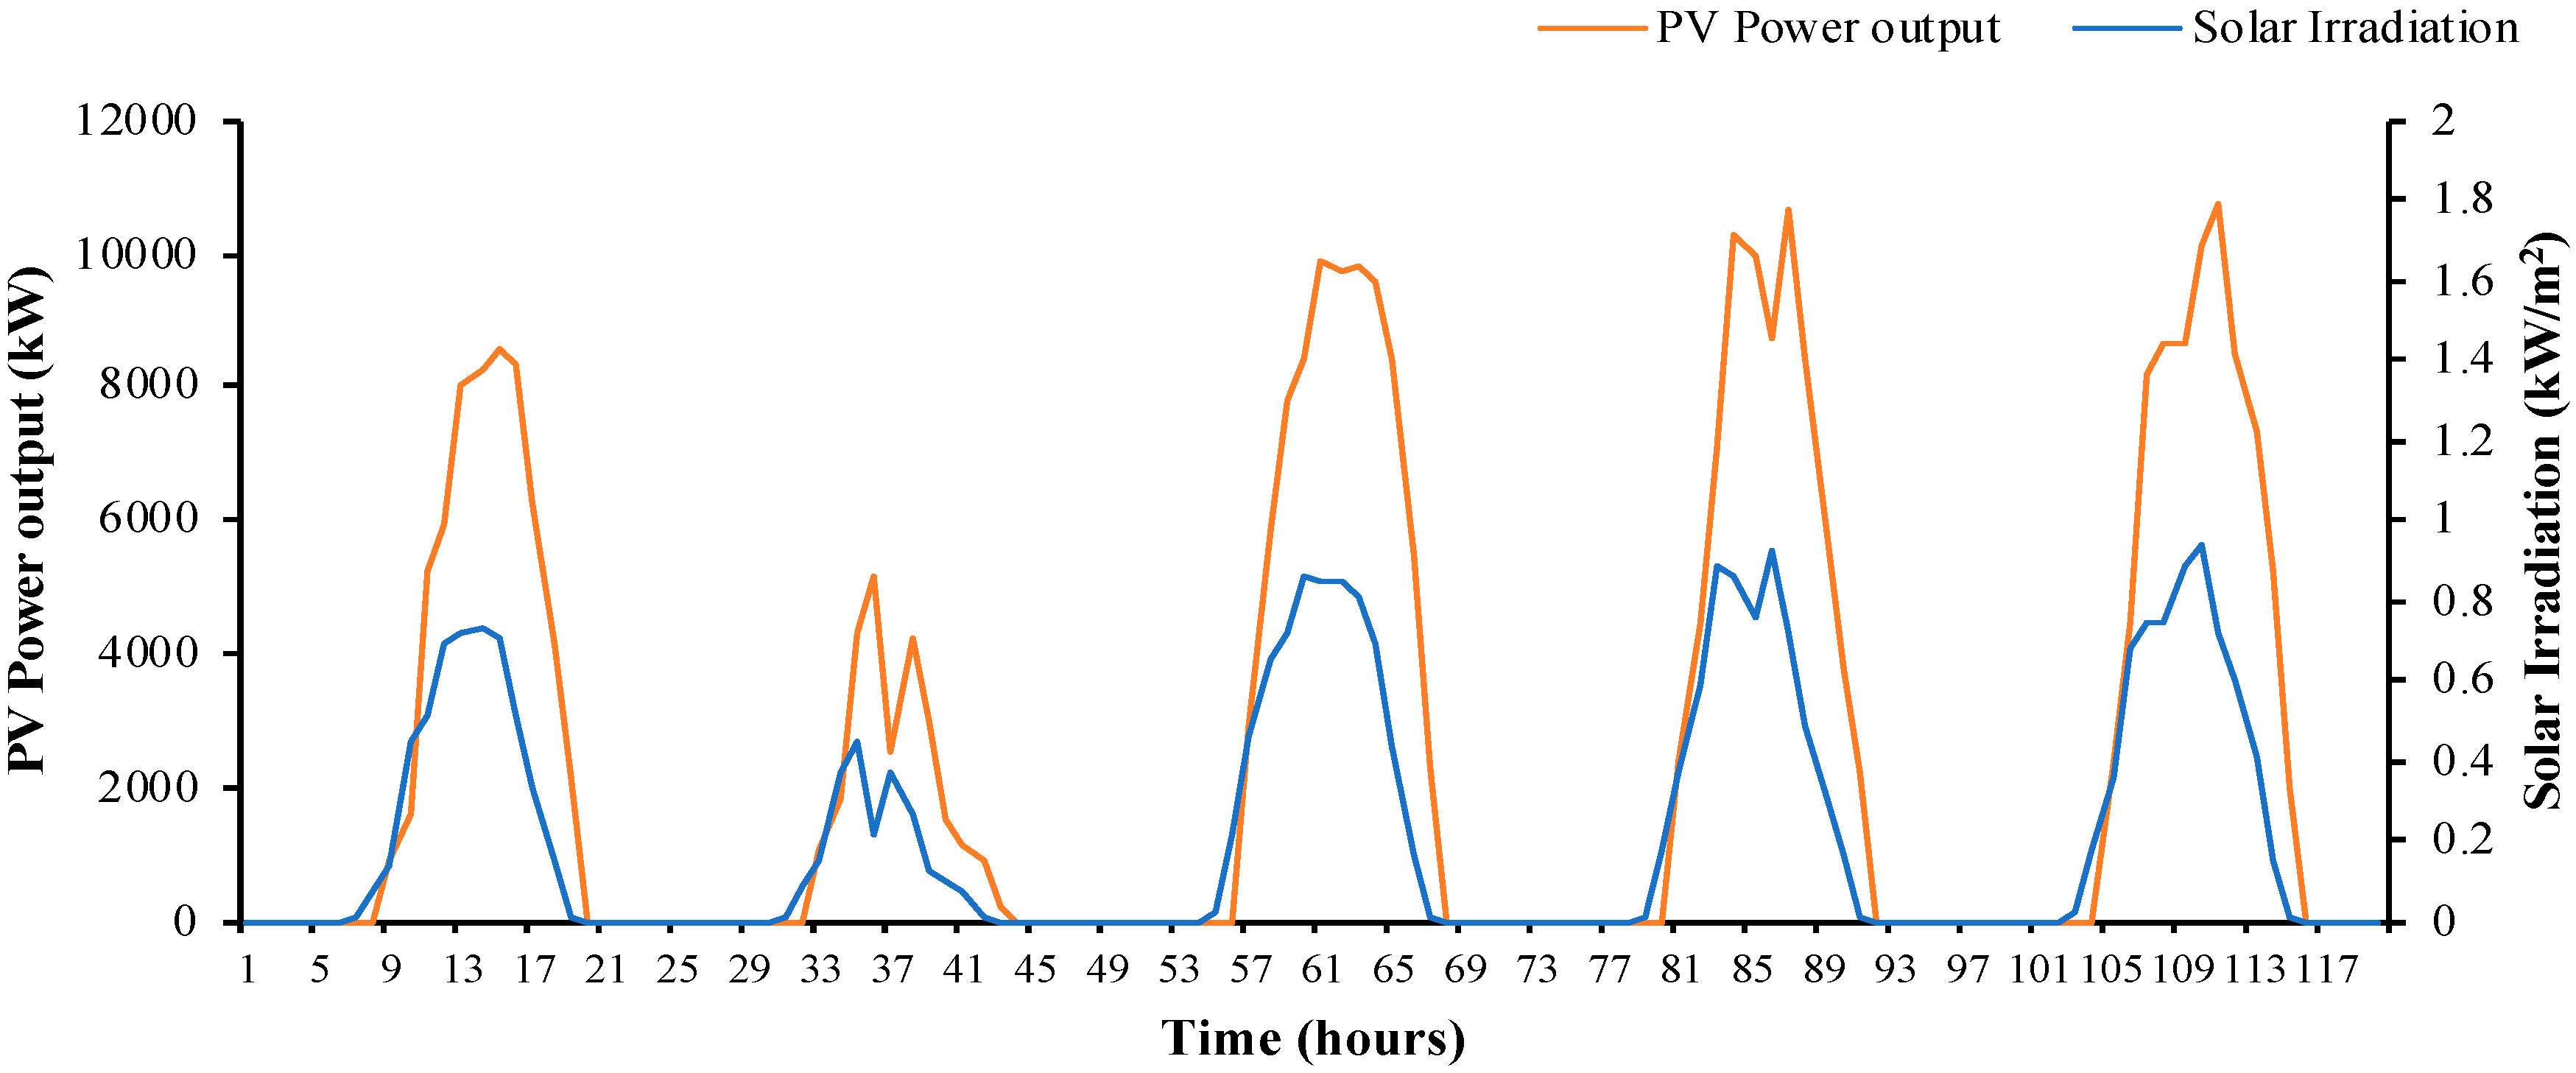
4. PV Power Output Data Analysis
5. Simulation Results and Discussion
6. Conclusions
Author Contributions
Funding
Acknowledgments
Conflicts of Interest
References
- Alternative Energy. Available online: https://en.wikipedia.org/wiki/Alternative_energy (accessed on 10 July 2019).
- Zehner, O. Green Illusions; University of Nebraska Press: Lincoln, NE, USA; London, UK, 2012; pp. 1–169; 331–342. [Google Scholar]
- Jacobson, M.Z.; Delucchi, M.A. A path to sustainable energy by 2030. Sci. Am. 2009, 301, 58–65. [Google Scholar] [CrossRef] [PubMed]
- Jacobson, M.Z.; Delucchi, M.A. Providing all global energy with wind, water, and solar power, Part I: Technologies, energy resources, quantities and areas of infrastructure, and materials. Energy Policy 2011, 39, 1154–1169. [Google Scholar] [CrossRef]
- Inthacha, S. The Climatology of Thailand and Future Climate Change Projections Using the Regional Climate Model Precis. Ph.D. Thesis, University of East Anglia, Norwich, UK, May 2011. [Google Scholar]
- Prospect of Limiting the Global Increase in Temperature to 2·°C is Getting Bleaker. Available online: https://www.iea.org/newsroom/news/2011/may/2011-05-30-.html (accessed on 10 July 2019).
- Papaioannou, G.; Nikolidakis, G.; Asimakopoulos, D.; Retalis, D. Photosynthetically active radiation in Athens. Agric. For. Meteorol. 1996, 81, 287–298. [Google Scholar] [CrossRef]
- Codato, G.; Oliveira, A.P.; Soares, J.; Escobedo, J.F.; Gomes, E.N.; Pai, A.D. Global and diffuse solar irradiances in urban and rural areas in southeast Brazil. Theor. Appl. Climatol. 2017, 93, 57–73. [Google Scholar] [CrossRef]
- Janjai, S. Solar Radiation; Department of Physics, Faculty of Science, Silpakorn University Campus: Nakhon Pathom, Thailand, 2014. [Google Scholar]
- The Industrial Internet of Things Volume T3: Analytics Framework. Available online: https://www.iiconsortium.org/pdf/IIC_Industrial_Analytics_Framework_Oct_2017.pdf (accessed on 1 December 2019).
- Kittisontirak, S.; Dawan, P.; Atiwongsangthong, N.; Titiroongruang, W.; Chinnavornrungsee, P.; Hongsingthong, A.; Manosukritkul, P. A novel power output model for photovoltaic system. In Proceedings of the International Electrical Engineering Congress (iEECON), Pattaya, Thailand, 8–10 March 2017; pp. 209–212. [Google Scholar]
- Monteiro, C.; Santos, T.; Fernandez-Jimenez, L.; Ramirez-Rosado, I.; Terreros-Olarte, M. Short-term power forecasting model for photovoltaic plants based on historical similarity. Energies 2013, 6, 2624–2643. [Google Scholar] [CrossRef]
- Mohammed, A.A.; Aung, Z. Ensemble learning approach for probabilistic forecasting of solar power generation. Energies 2016, 9, 1017. [Google Scholar] [CrossRef]
- Agoua, X.G.; Girard, R.; Kariniotakis, G. Probabilistic models for spatio-temporal photovoltaic power forecasting. IEEE Trans. Sustain. Energy 2019, 10, 780–789. [Google Scholar] [CrossRef] [Green Version]
- Piorno, J.R.; Bergonzini, C.; Atienza, D.; Rosing, T.S. Prediction and management in energy harvested wireless sensor nodes. In Proceedings of the 1st International Conference on Wireless Communication, Vehicular Technology, Information Theory and Aerospace & Electronic Systems Technology, Aalborg, Denmark, 17–20 May 2009. [Google Scholar]
- Pano-Azucena, A.; Tlelo-Cuautle, E.; Tan, S.; Ovilla-Martinez, B.; Fraga, L.D.L. FPGA-based implementation of a multilayer perceptron suitable for chaotic time series prediction. Technologies 2018, 6, 90. [Google Scholar] [CrossRef] [Green Version]
- Abuella, M.; Chowdhury, B. Solar power forecasting using artificial neural networks. In Proceedings of the North American Power Symposium (NAPS), Charlotte, NC, USA, 4–6 October 2015. [Google Scholar]
- Omid, M.; Ramedani, Z.; Keyhani, A.R. Forecasting of daily solar radiation using neuro-fuzzy approach. In Proceedings of the 5th International Mechanical Engineering Forum, Prague, Czech Republic, 20–22 June 2012; pp. 728–742. [Google Scholar]
- Hoballah, A.; Erlich, I. PSO-ANN approach for transient stability constrained economic power generation. In Proceedings of the IEEE Bucharest Power Tech Conference, Bucharest, Romania, 28 June–2 July 2009; pp. 1–6. [Google Scholar]
- Department of Alternative Energy Development and Efficiency. Ministry of Energy in Thailand. Energy Situation. Available online: https://www.dede.go.th/download/stat62/sit_2_61_dec.pdf (accessed on 10 July 2019).
- Solar Energy Distribution at the Top of the Atmosphere and at the Surface of the Earth. Available online: http://www.physics.usyd.edu.au/teach_res/hsp/sp/mod7/m7emrSpectra.pdf (accessed on 20 October 2019).
- Ministry of Energy. Promotion of Using Hot Water from Solar Energy, Power Point Presentation. Available online: https://www.slideserve.com/pete/outline (accessed on 10 July 2019).
- Solar Resource Maps of Thailand. Available online: https://solargis.com/maps-and-gis-data/download/Thailand (accessed on 10 July 2019).
- Jang, J.-S.R. ANFIS: Adaptive network-based fuzzy inference system. IEEE Trans. Syst. Cybern. 1993, 23, 665–685. [Google Scholar] [CrossRef]
- Aghbashlo, M.; Hosseinpour, S.; Mujumdar, A.S. Artificial neural network-based modeling and controlling of drying systems. Intell. Control Dry. 2018, 1, 155–172. [Google Scholar]
- Brahim, K.; Zell, A. ANFIS-SNNS: Adaptive network fuzzy inference system in the stuttgart neural network simulator. Fuzzy Syst. Comput. Sci. 1994, 1, 117–127. [Google Scholar]
- Kennedy, J.; Eberhart, R. Particle swarm optimization. In Proceedings of the IEEE International Conference on Neural Networks, Perth, Australia, 27 November–1 December 1995; pp. 1942–1948. [Google Scholar]
- Jumpasri, N.; Pinsuntia, K.; Woranetsuttikul, K.; Nilsakorn, T.; Khan-Ngern, W. Improved particle swarm optimization algorithm using average model on MPPT for partial shading in PV array. In Proceedings of the International Electrical Engineering Congress (IEECON), Chonburi, Thailand, 19–21 March 2014. [Google Scholar]
- Esmin, A.A.A.; Coelho, R.A.; Matwin, S. A review on particle swarm optimization algorithm and its variants to clustering high-dimensional data. Artif. Intell. Rev. 2013, 44, 23–45. [Google Scholar] [CrossRef]
- Abdullah, A.G.; Suranegara, G.M.; Hakim, D.L. Hybrid PSO-ANN application for improved accuracy of short-term load forecasting. IEEE Trans. Power Syst. 2014, 9, 446–451. [Google Scholar]
- Nespoli, A.; Ogliari, E.; Leva, S.; Pavan, A.M.; Mellit, A.; Lughi, V.; Dolara, A. Day-ahead photovoltaic forecasting: A comparison of the most effective techniques. Energies 2019, 12, 1621. [Google Scholar] [CrossRef] [Green Version]
- Martins, R.P.; Ferreira, V.H.; Lopes, T.T. Artificial neural network for probabilistic forecasting of the output power of photovoltaic systems. In Proceedings of the Simposio Brasileiro De Sistemas Eletricos (SBSE), Niteroi, Brazil, 12–16 May 2018. [Google Scholar]
- Le, L.T.; Nguyen, H.; Dou, J.; Zhou, J. A comparative study of PSO-ANN, GA-ANN, ICA-ANN, and ABC-ANN in estimating the heating load of buildings’ energy efficiency for smart city planning. Appl. Sci. 2019, 9, 2630. [Google Scholar] [CrossRef] [Green Version]
- Houria, B.; Mahdi, K.; Zohra, T.F. PSO-ANN’s based suspended sediment concentration in Ksob basin, Algeria. J. Eng. Technol. Res. 2014, 6, 129–136. [Google Scholar]
- Said, S.Z.; Thiaw, L. Performance of artificial neural network and particle swarm optimization technique based maximum power point tracking for photovoltaic systems under different environmental conditions. J. Phys. Conf. Ser. 2018, 1049, 012047. [Google Scholar] [CrossRef] [Green Version]
- Yousif, J.H.; Kazem, H.A.; Alattar, N.N.; Elhassan, I.I. A comparison study based on artificial neural network for assessing PV/T solar energy production. Case Stud. Therm. Eng. 2019, 13, 100407. [Google Scholar] [CrossRef]
- Lee, D.; Kim, K. Recurrent neural network-based hourly prediction of photovoltaic power output using meteorological information. Energies 2019, 12, 215. [Google Scholar] [CrossRef] [Green Version]


| Particle Swarm | Iterations | Lower-Upper Bound | Inertia Weight | Damping Ratio | Personal Learning Coefficient | Global Learning Coefficient | Number of Neurons |
|---|---|---|---|---|---|---|---|
| 100 | 100 | −5 to 5 | 1 | 0.99 | 1.5 | 2.0 | 4 |
| Models | MSE | RMSE | MAE | MAPE (%) | Accuracy (%) | Calculation Efficiency (s) |
|---|---|---|---|---|---|---|
| PSO-ANN | 0.3234 | 0.5687 | 8.8233 | 1.0842 | 98.9157 | 429.522 |
| ANFIS | 0.0140 | 0.1184 | 1.1952 | 0.1468 | 99.8532 | 3.5675 |
© 2020 by the authors. Licensee MDPI, Basel, Switzerland. This article is an open access article distributed under the terms and conditions of the Creative Commons Attribution (CC BY) license (http://creativecommons.org/licenses/by/4.0/).
Share and Cite
Dawan, P.; Sriprapha, K.; Kittisontirak, S.; Boonraksa, T.; Junhuathon, N.; Titiroongruang, W.; Niemcharoen, S. Comparison of Power Output Forecasting on the Photovoltaic System Using Adaptive Neuro-Fuzzy Inference Systems and Particle Swarm Optimization-Artificial Neural Network Model. Energies 2020, 13, 351. https://doi.org/10.3390/en13020351
Dawan P, Sriprapha K, Kittisontirak S, Boonraksa T, Junhuathon N, Titiroongruang W, Niemcharoen S. Comparison of Power Output Forecasting on the Photovoltaic System Using Adaptive Neuro-Fuzzy Inference Systems and Particle Swarm Optimization-Artificial Neural Network Model. Energies. 2020; 13(2):351. https://doi.org/10.3390/en13020351
Chicago/Turabian StyleDawan, Promphak, Kobsak Sriprapha, Songkiate Kittisontirak, Terapong Boonraksa, Nitikorn Junhuathon, Wisut Titiroongruang, and Surasak Niemcharoen. 2020. "Comparison of Power Output Forecasting on the Photovoltaic System Using Adaptive Neuro-Fuzzy Inference Systems and Particle Swarm Optimization-Artificial Neural Network Model" Energies 13, no. 2: 351. https://doi.org/10.3390/en13020351
APA StyleDawan, P., Sriprapha, K., Kittisontirak, S., Boonraksa, T., Junhuathon, N., Titiroongruang, W., & Niemcharoen, S. (2020). Comparison of Power Output Forecasting on the Photovoltaic System Using Adaptive Neuro-Fuzzy Inference Systems and Particle Swarm Optimization-Artificial Neural Network Model. Energies, 13(2), 351. https://doi.org/10.3390/en13020351