Optimization and Application for Hydraulic Electric Hybrid Vehicle

Abstract
1. Introduction
2. Modeling
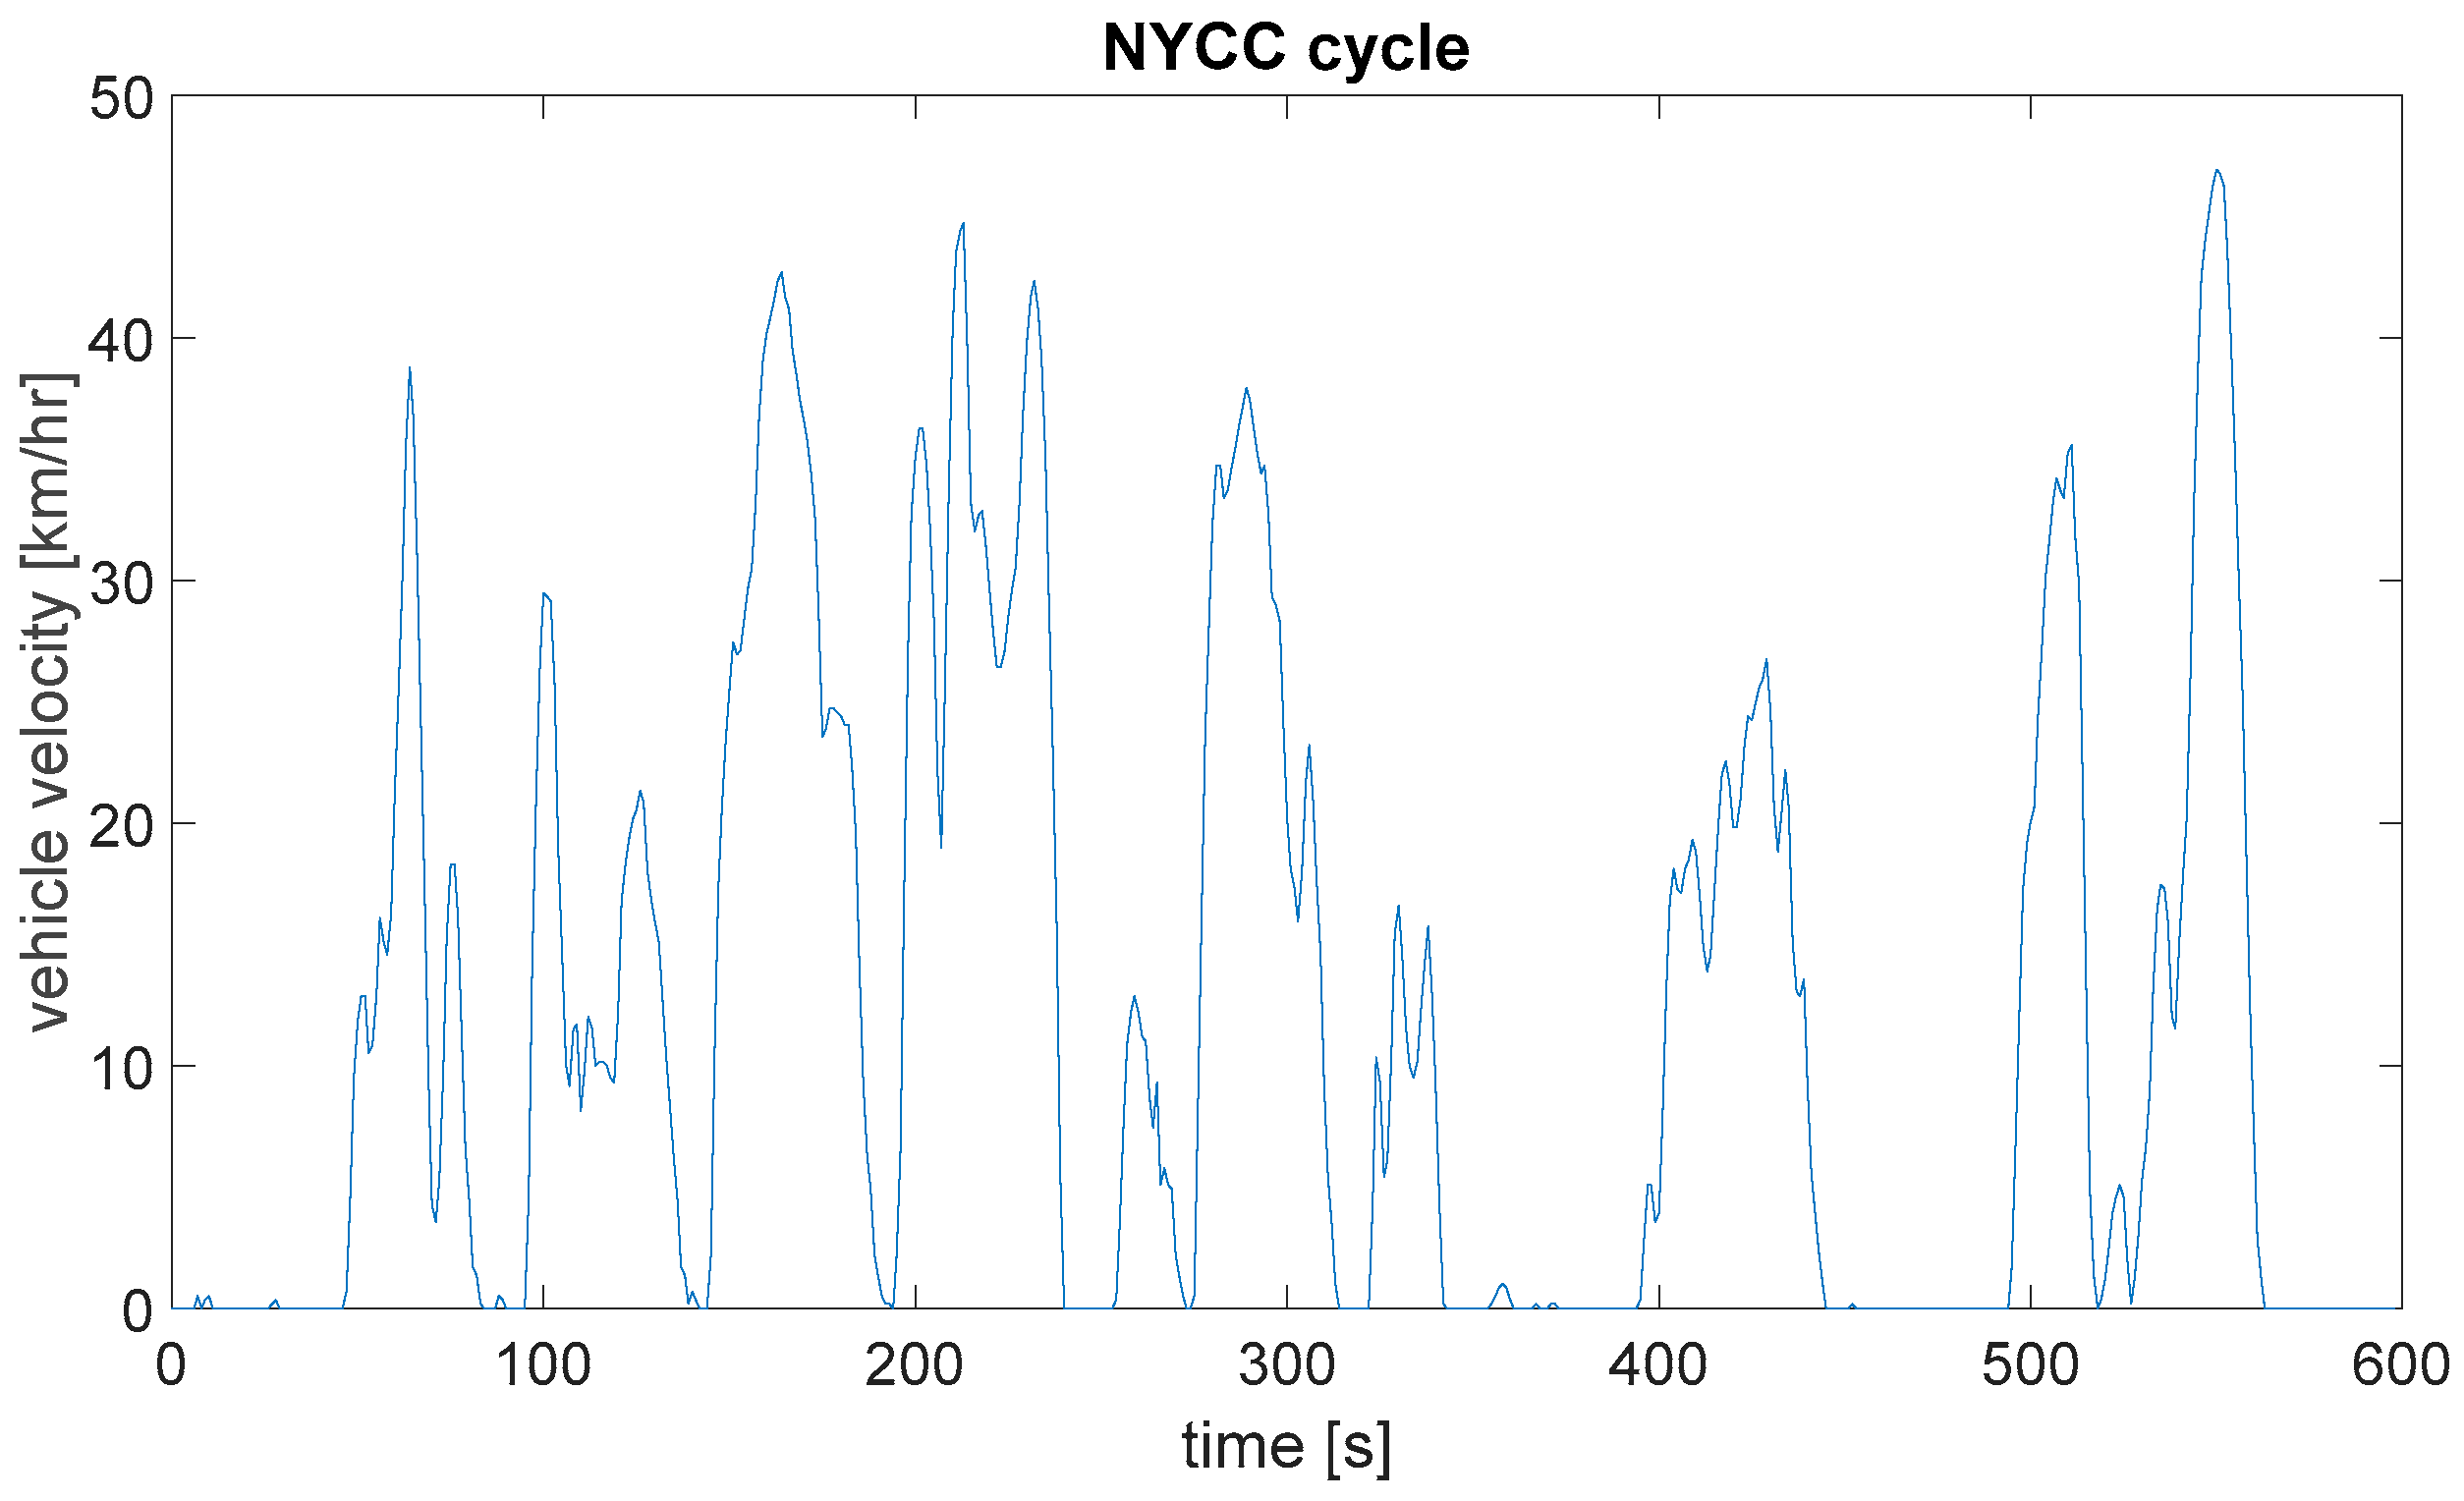
2.1. Driver Model
2.2. Vehicle Dynamic Model
2.2.1. Rolling Resistance
2.2.2. Aerodynamic Resistance
2.2.3. Grading Resistance
2.2.4. Acceleration Resistance
2.3. Tyre and Drive Model
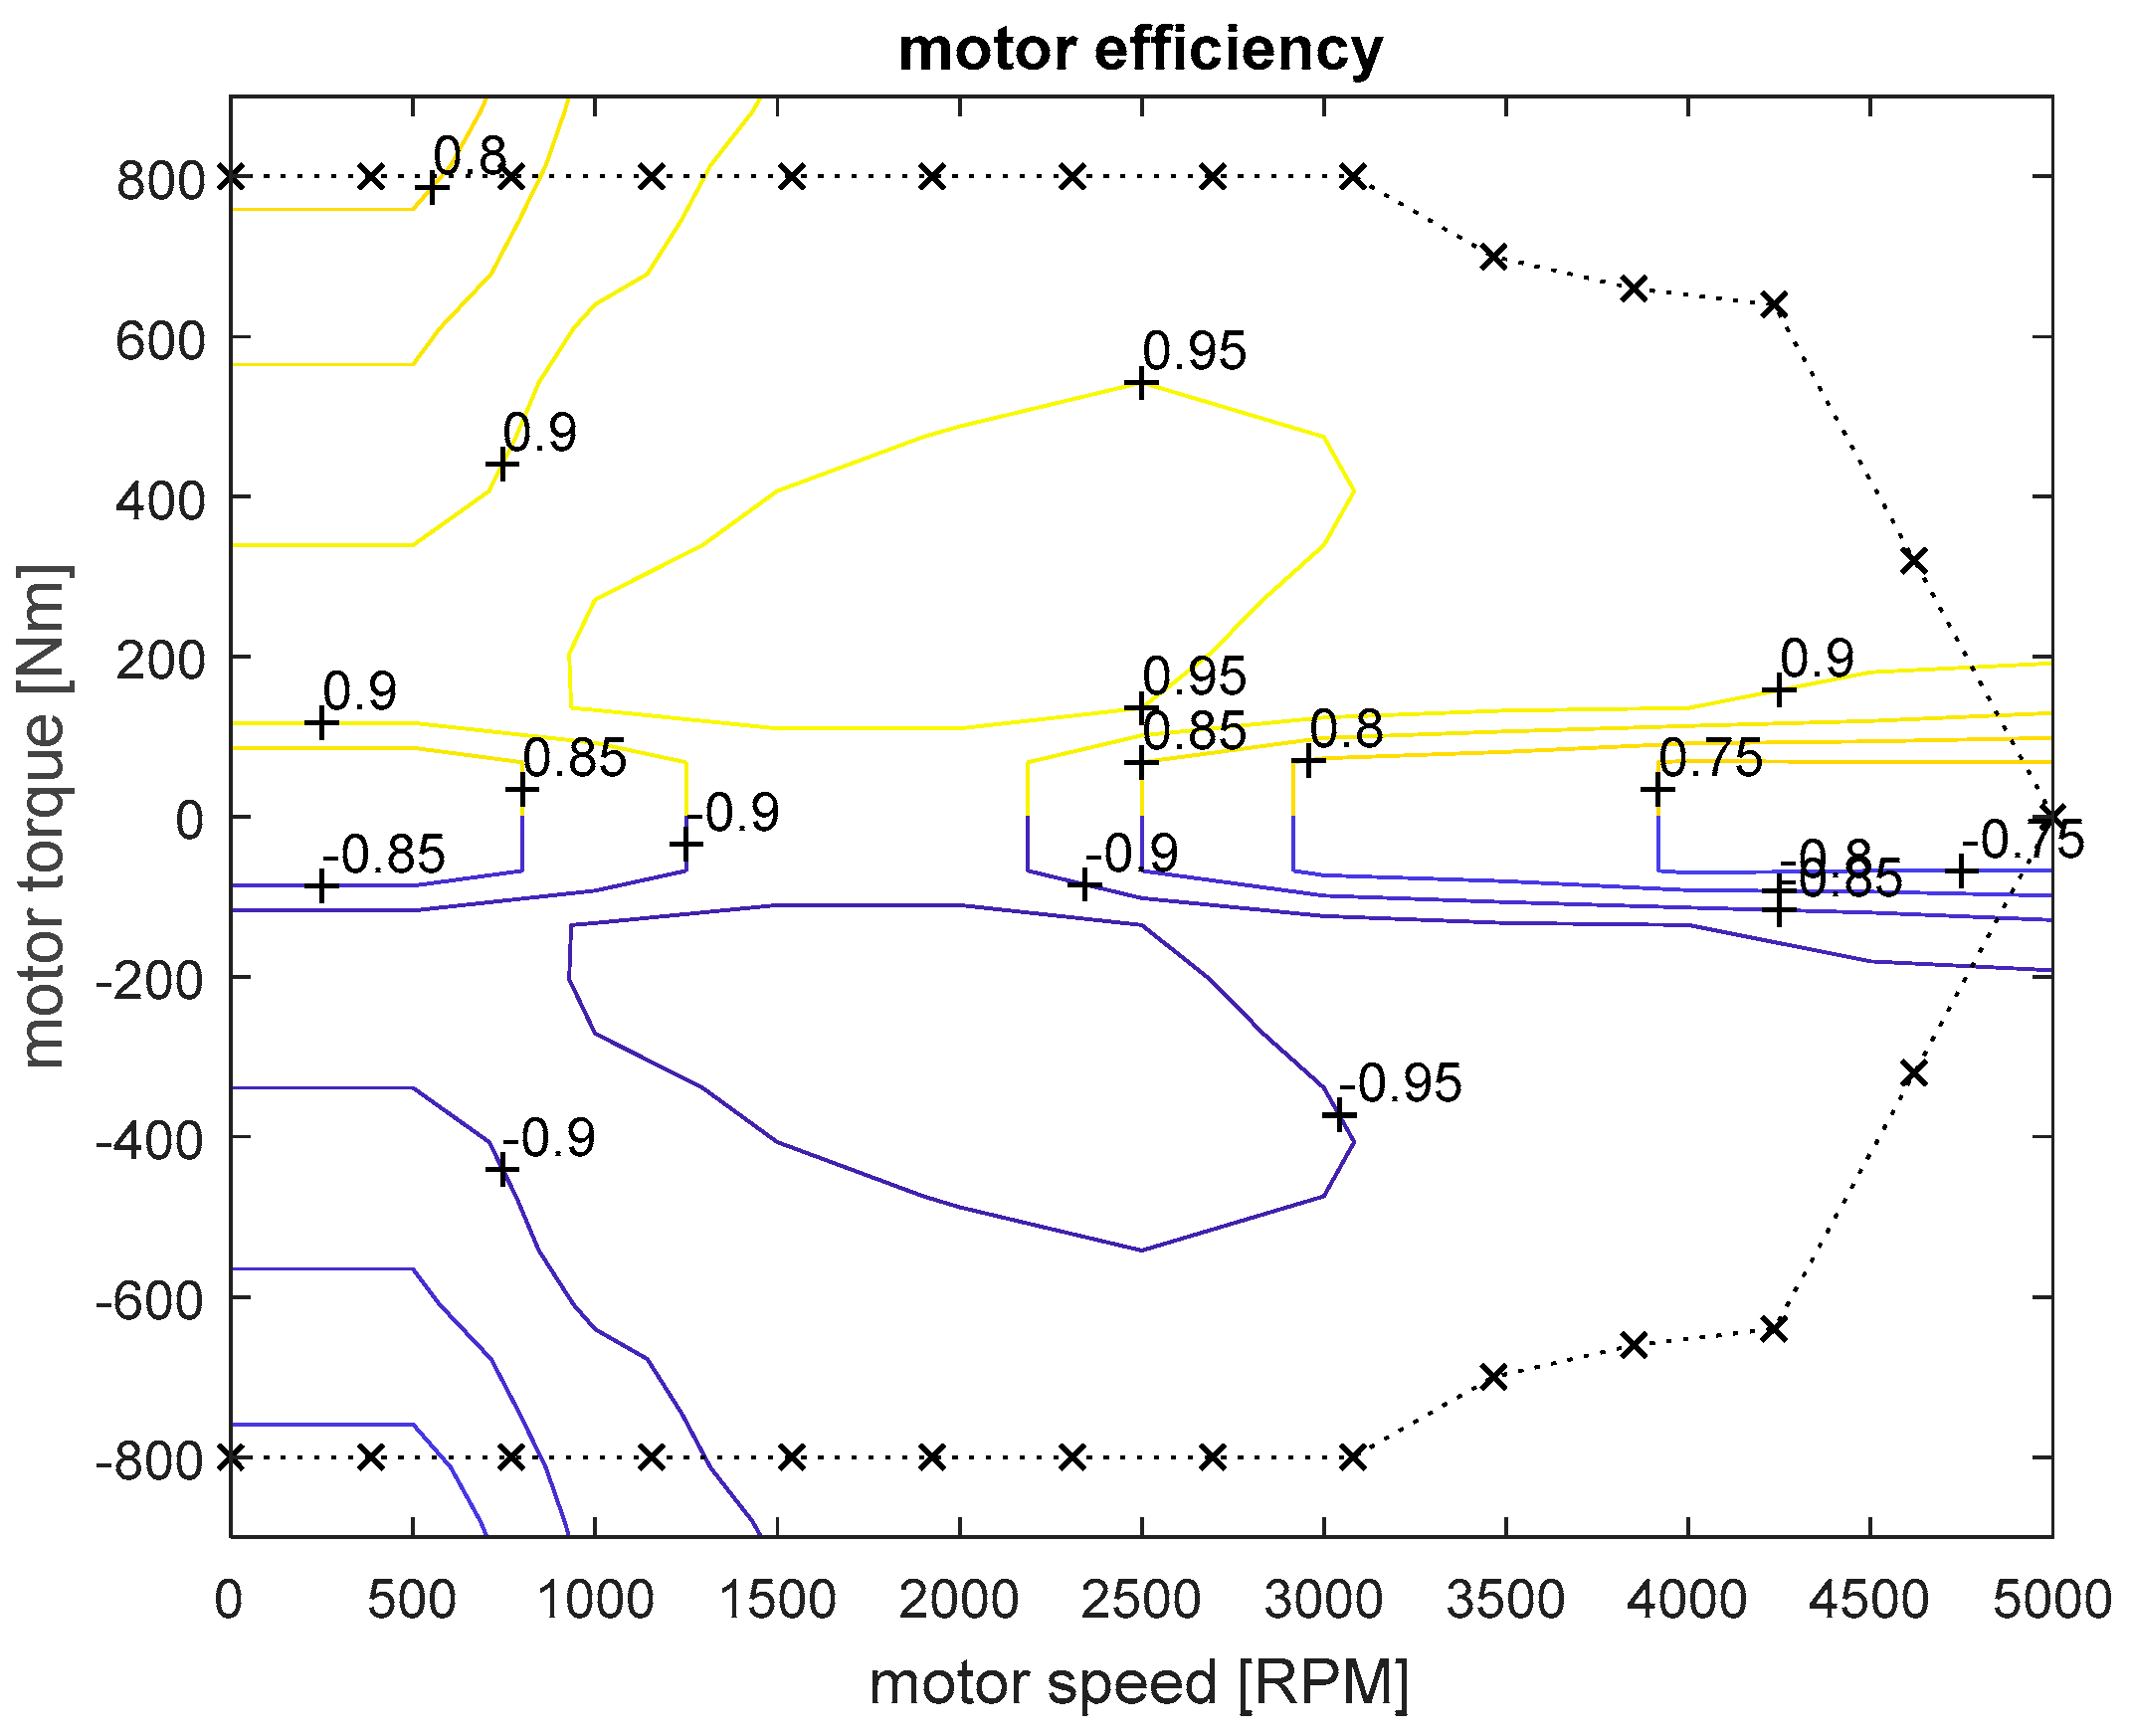
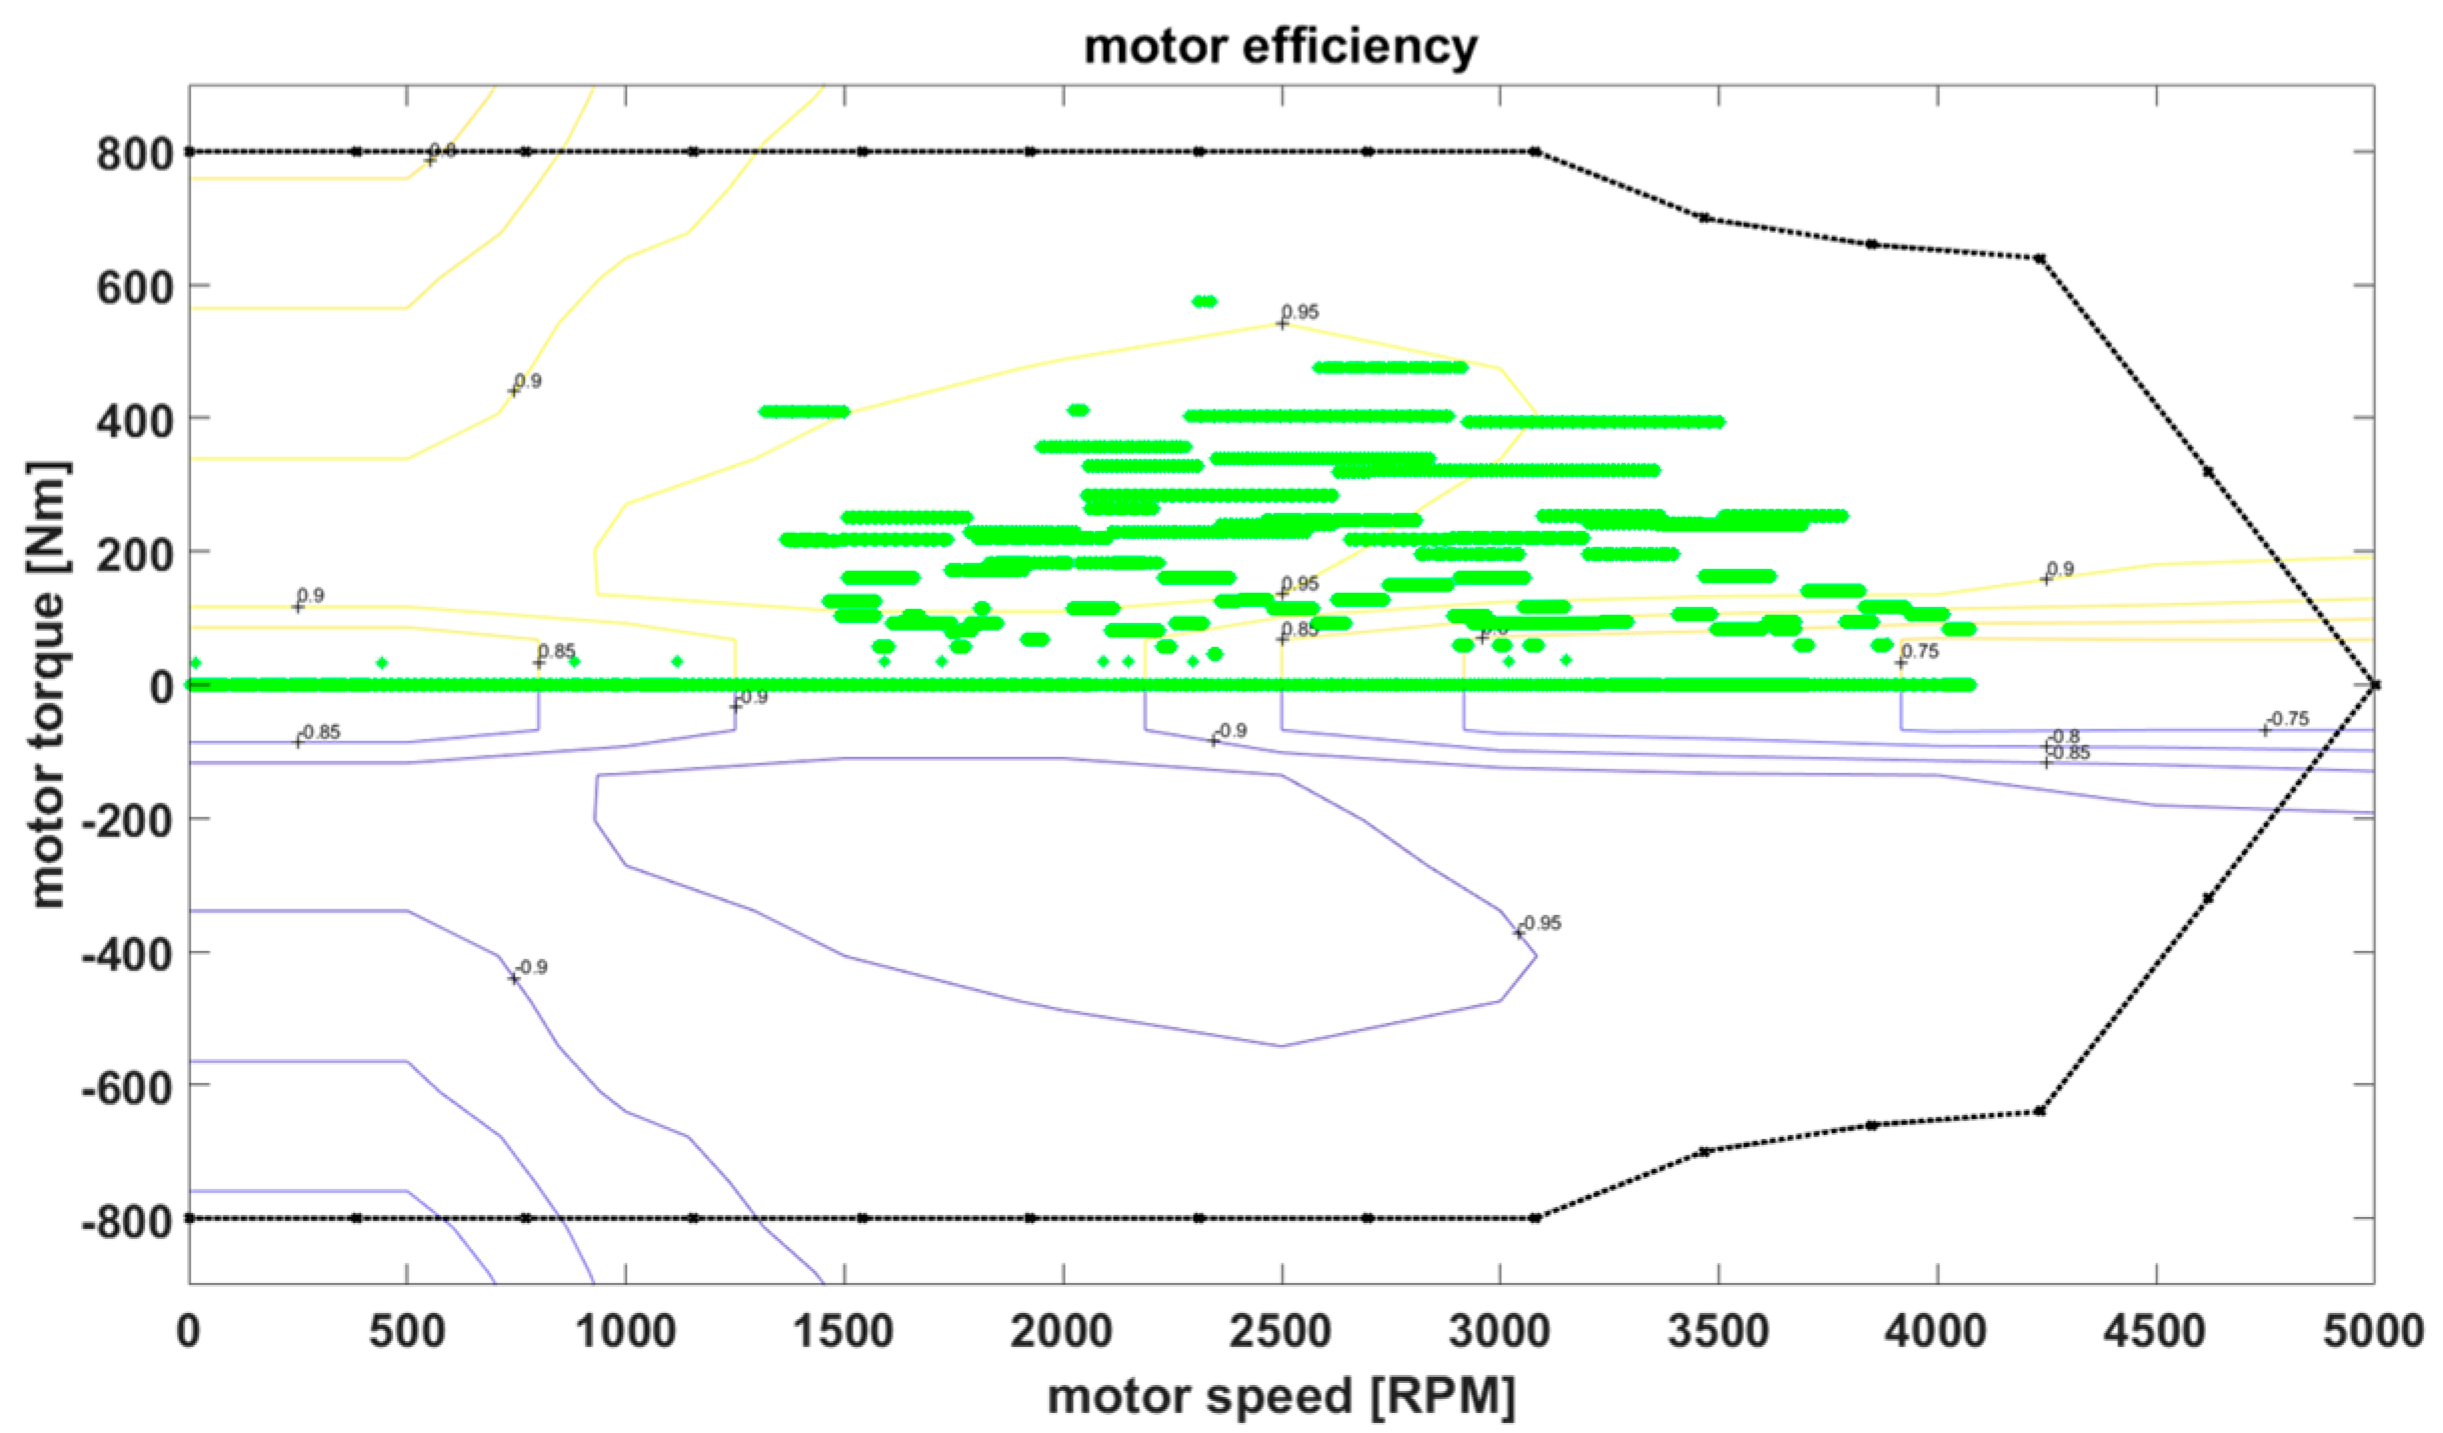
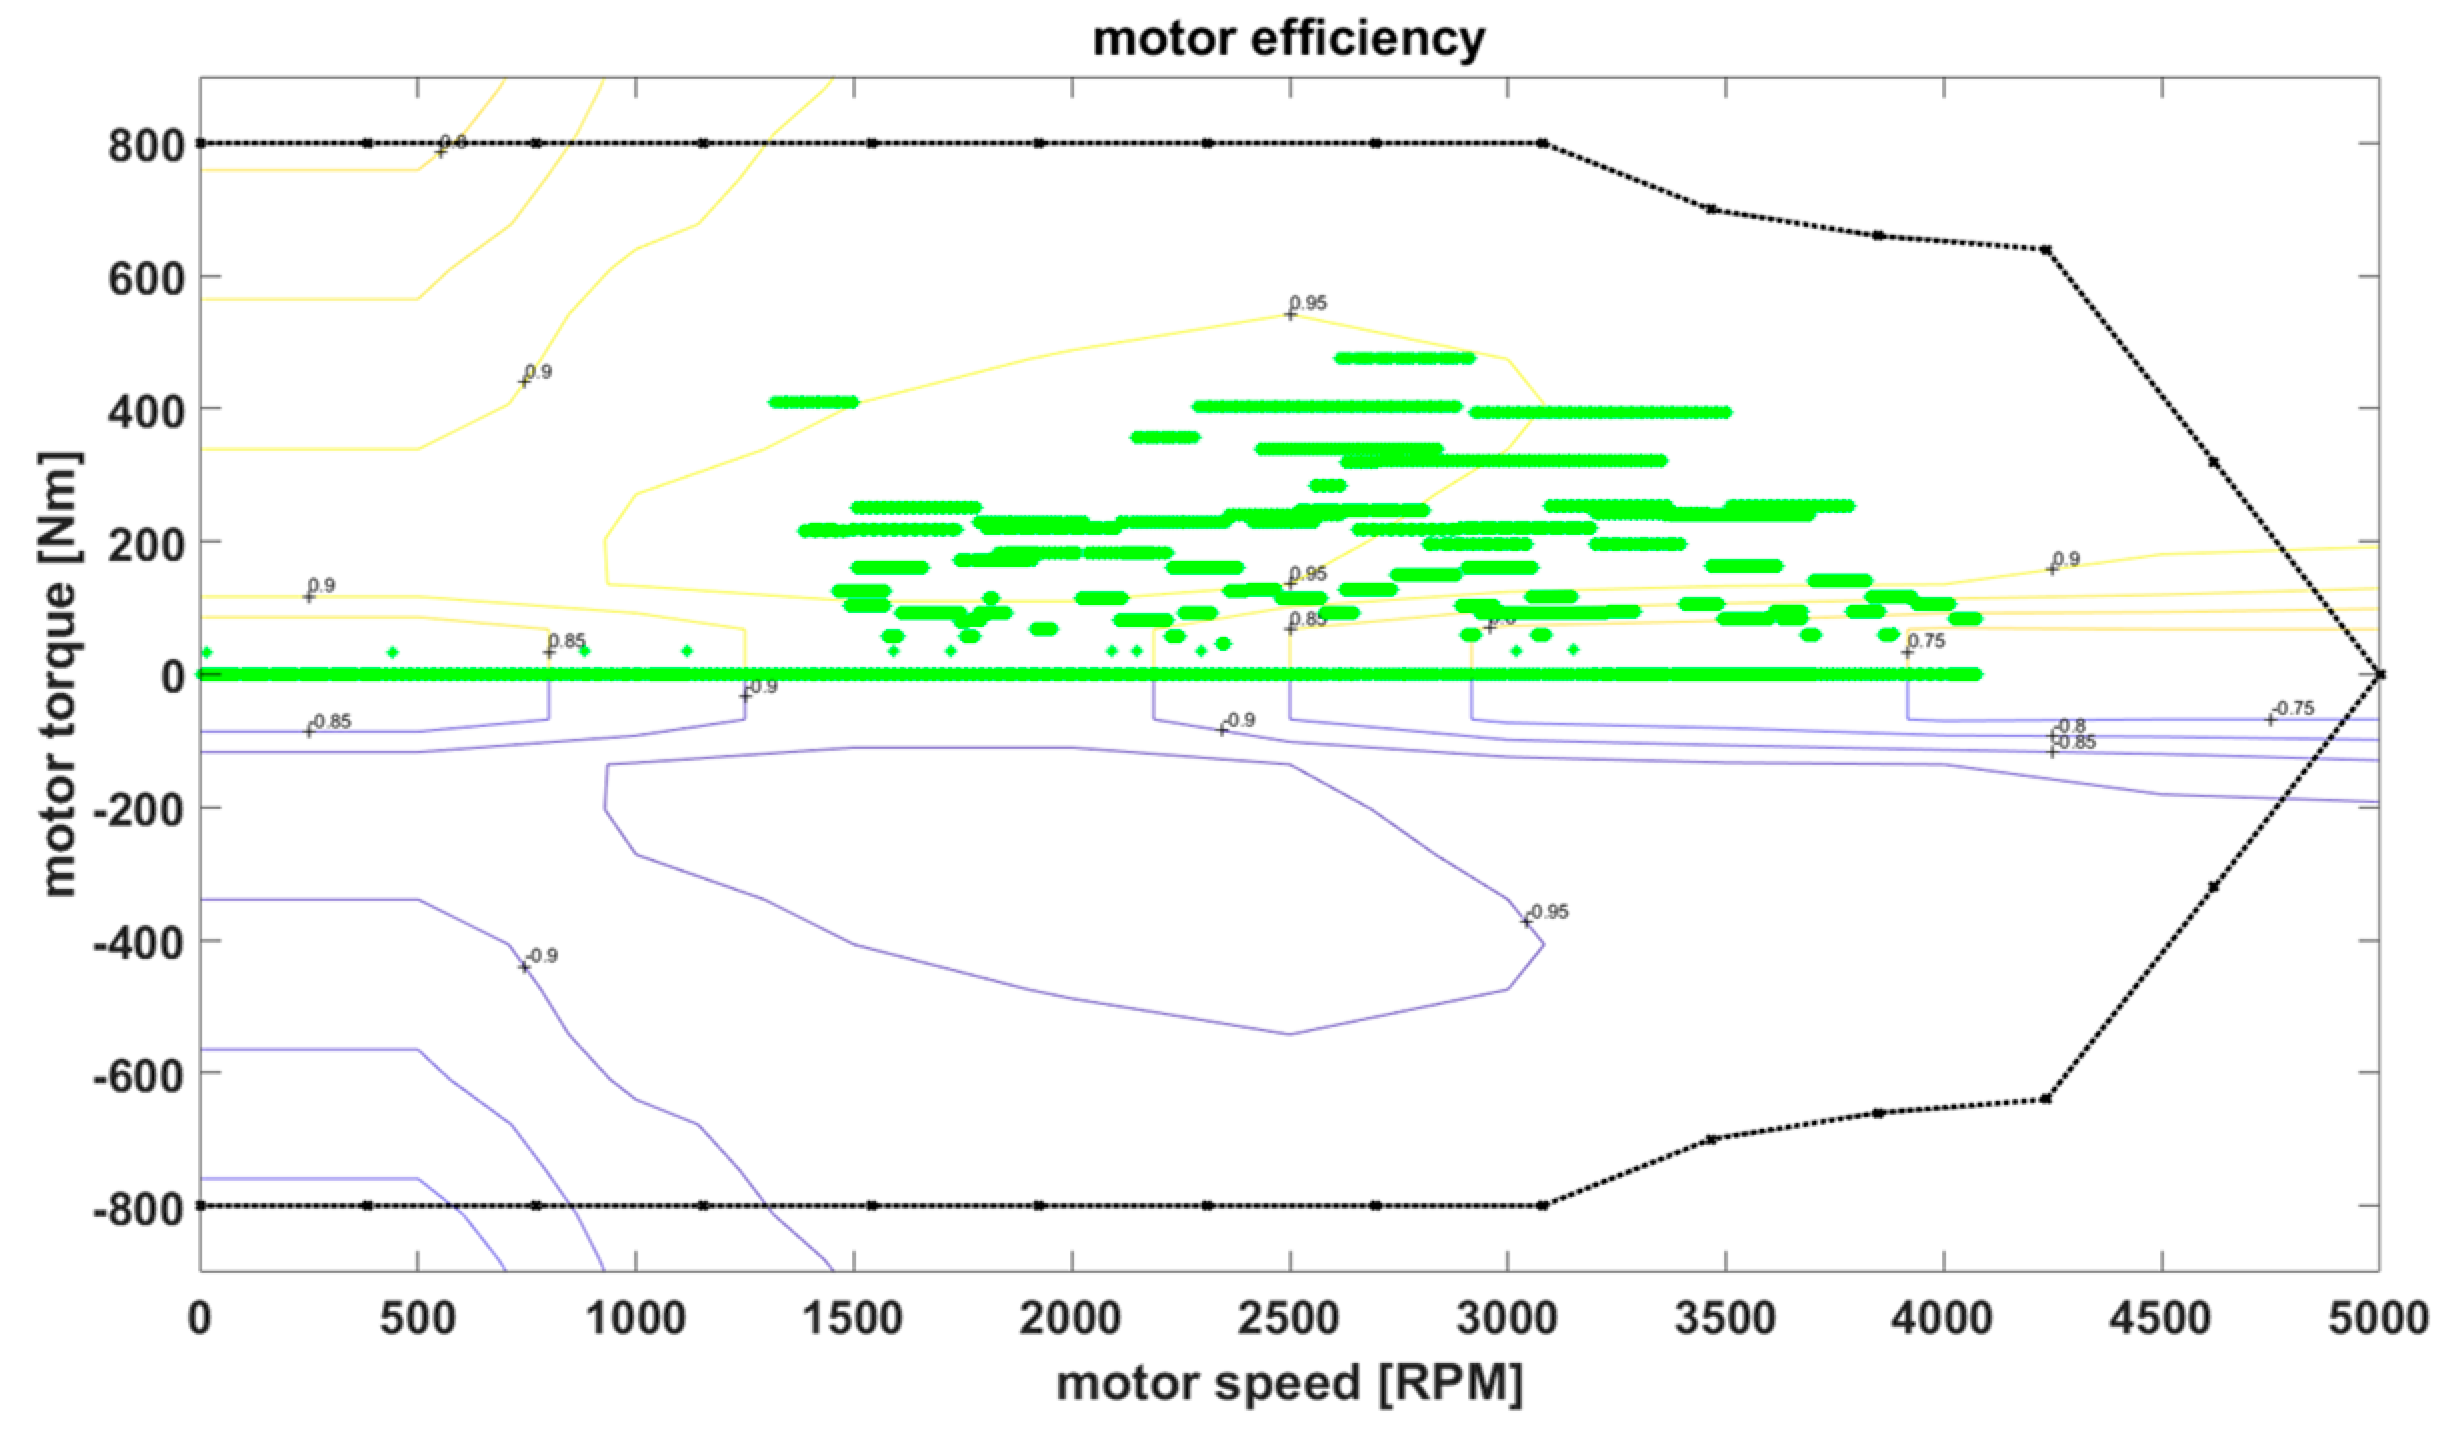
2.4. Electric Motor Model
2.5. Variable Hydraulic Motor/Pump Model
2.6. Battery Model
2.7. Accumulator Model
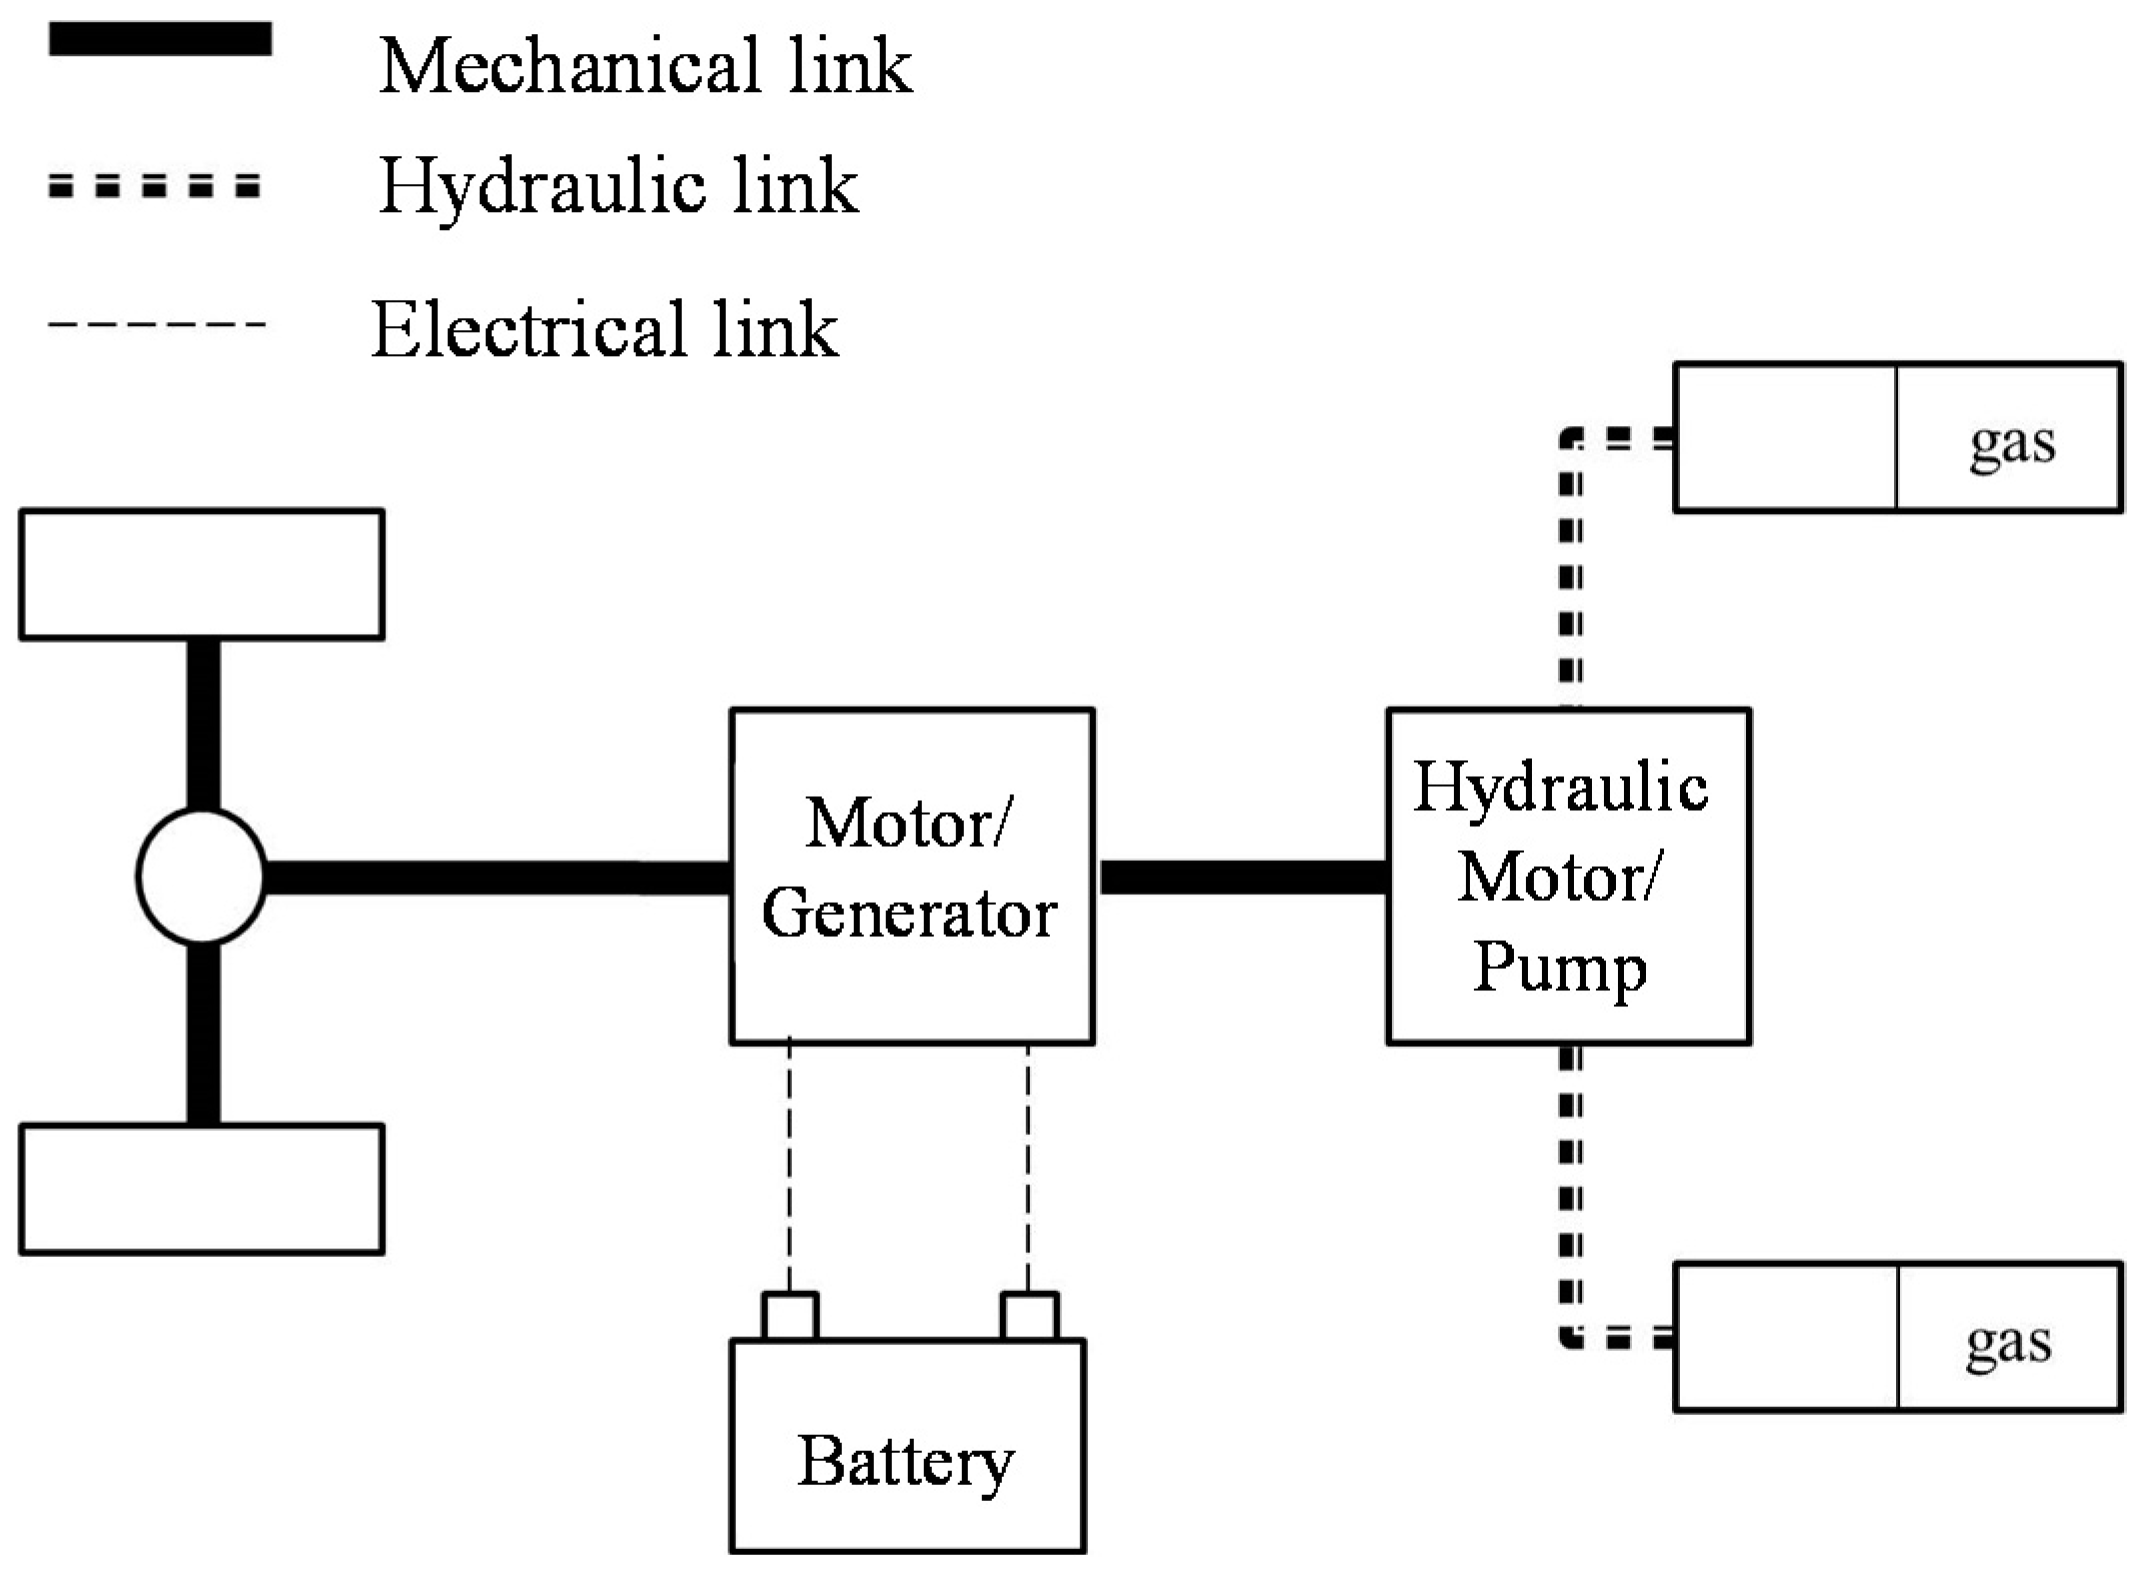
2.8. Vehicle Configurations
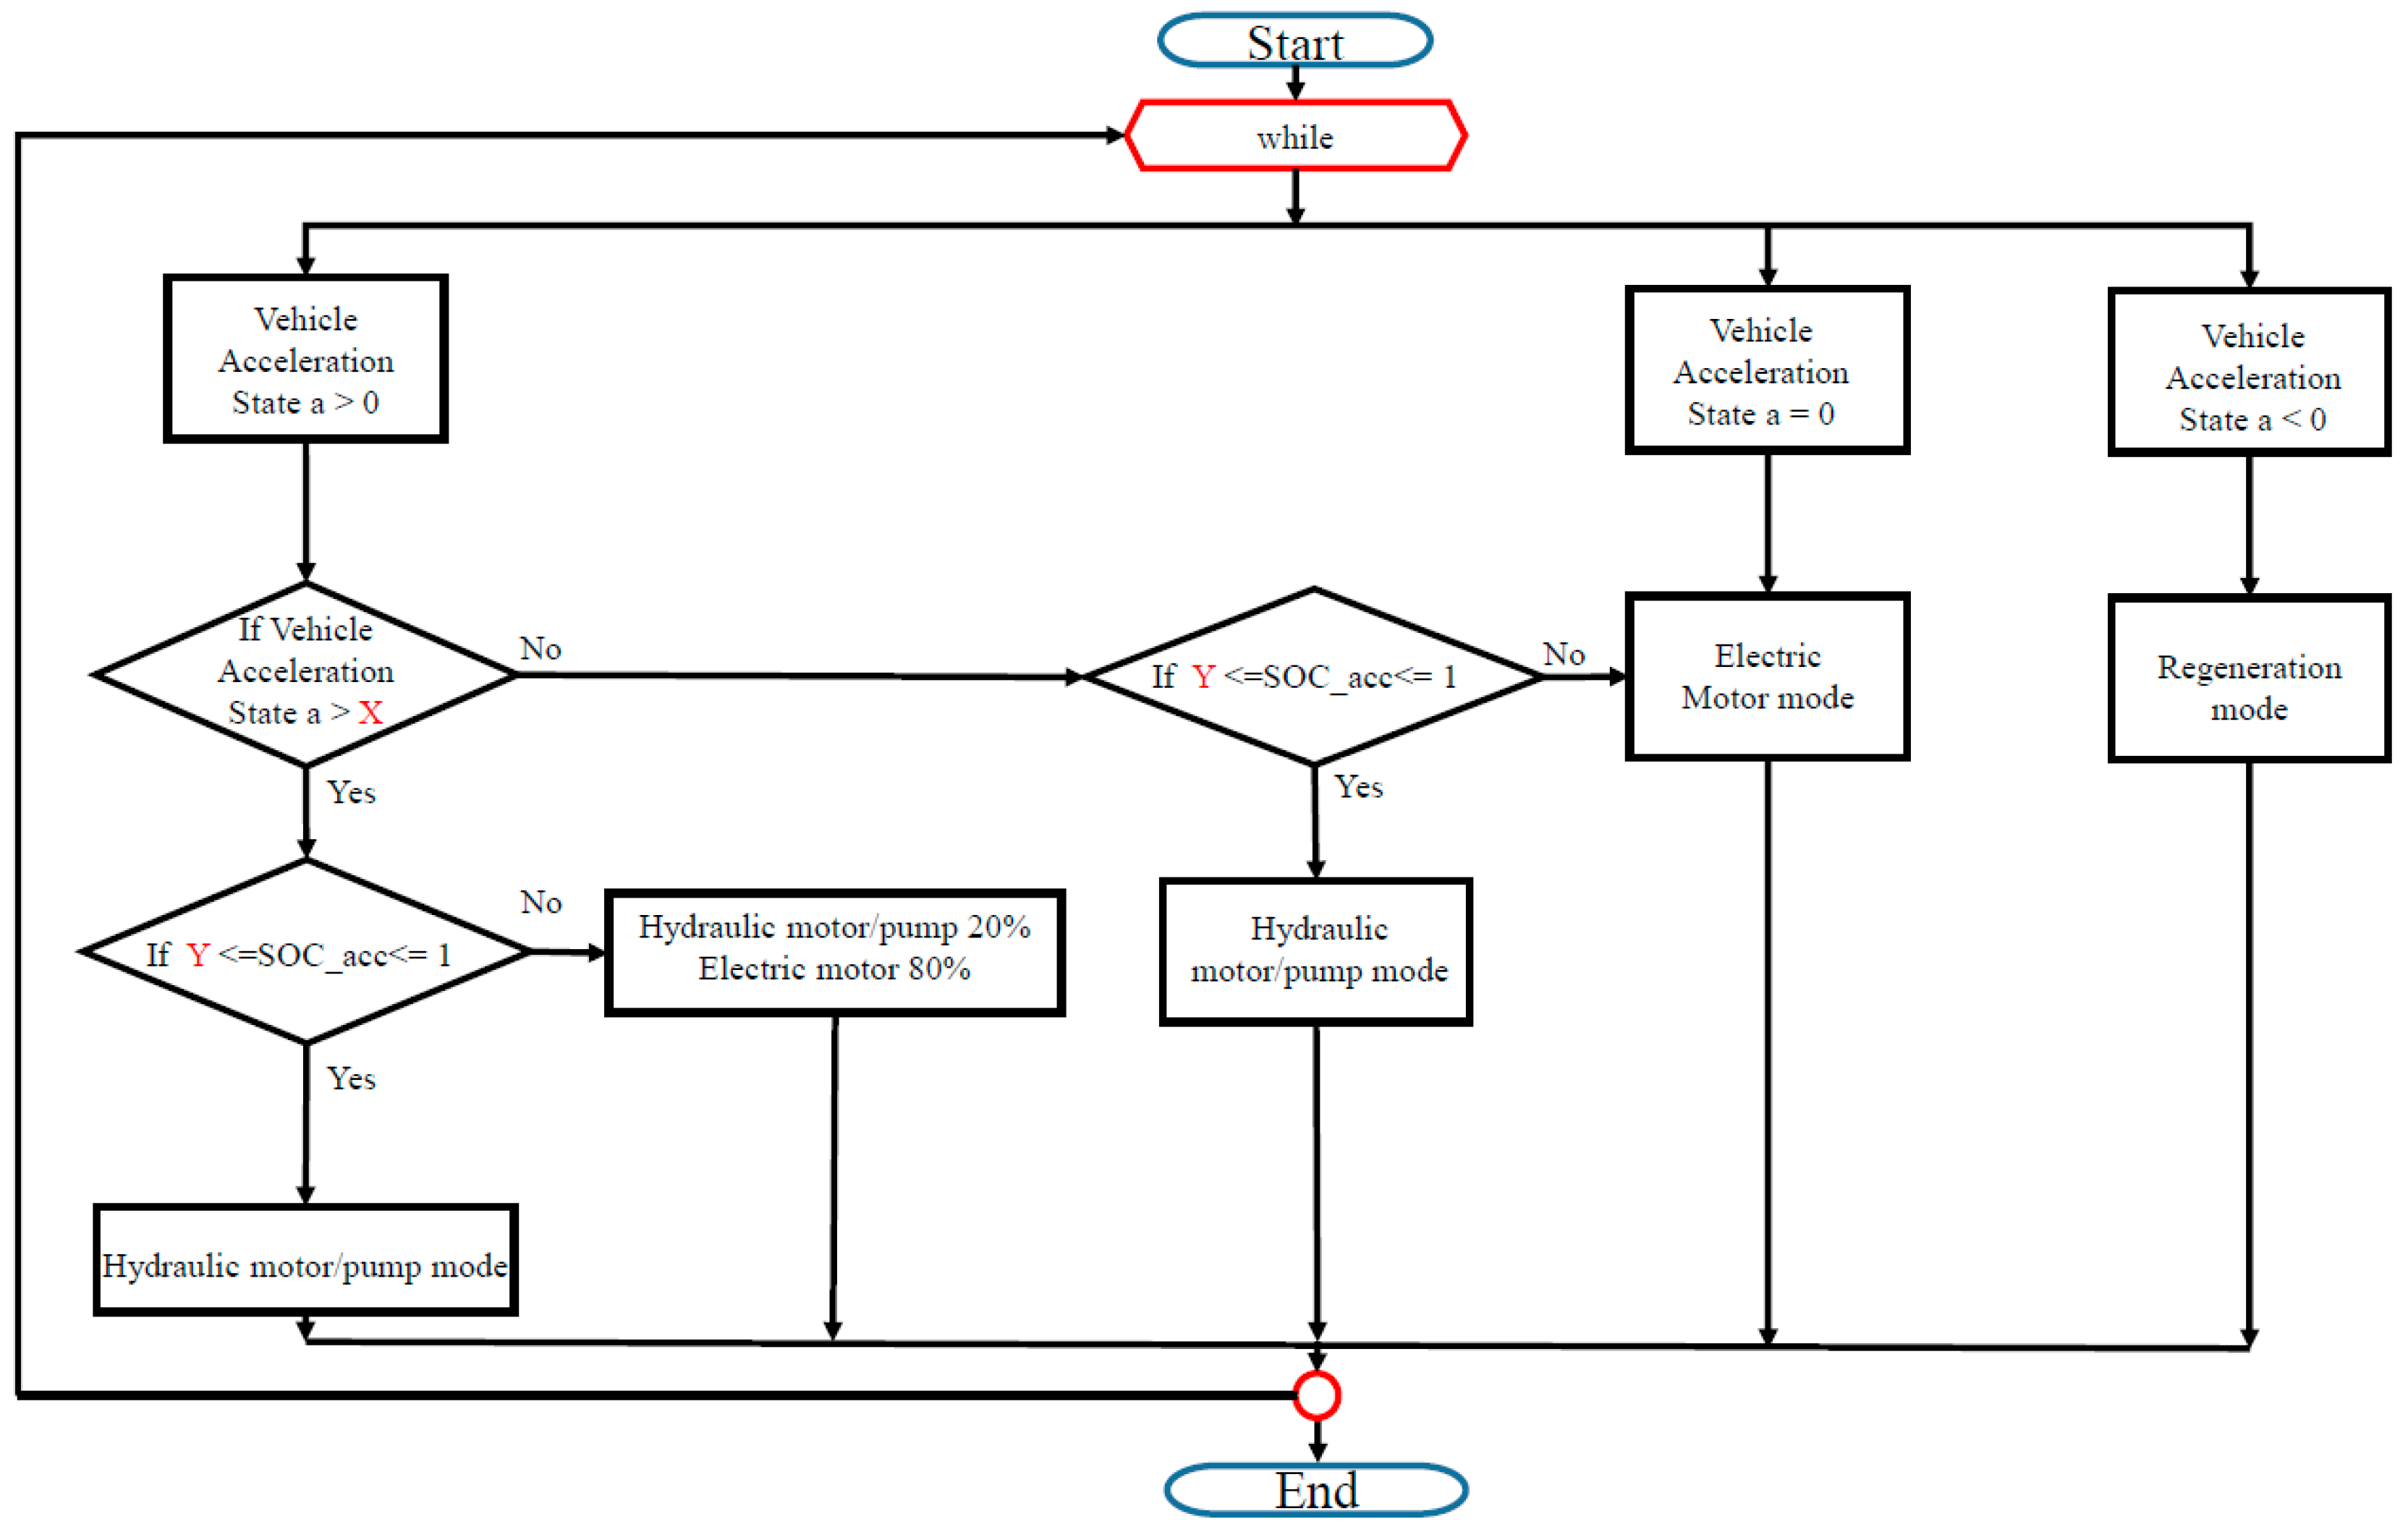
3. Optimization Control Strategy
4. Results
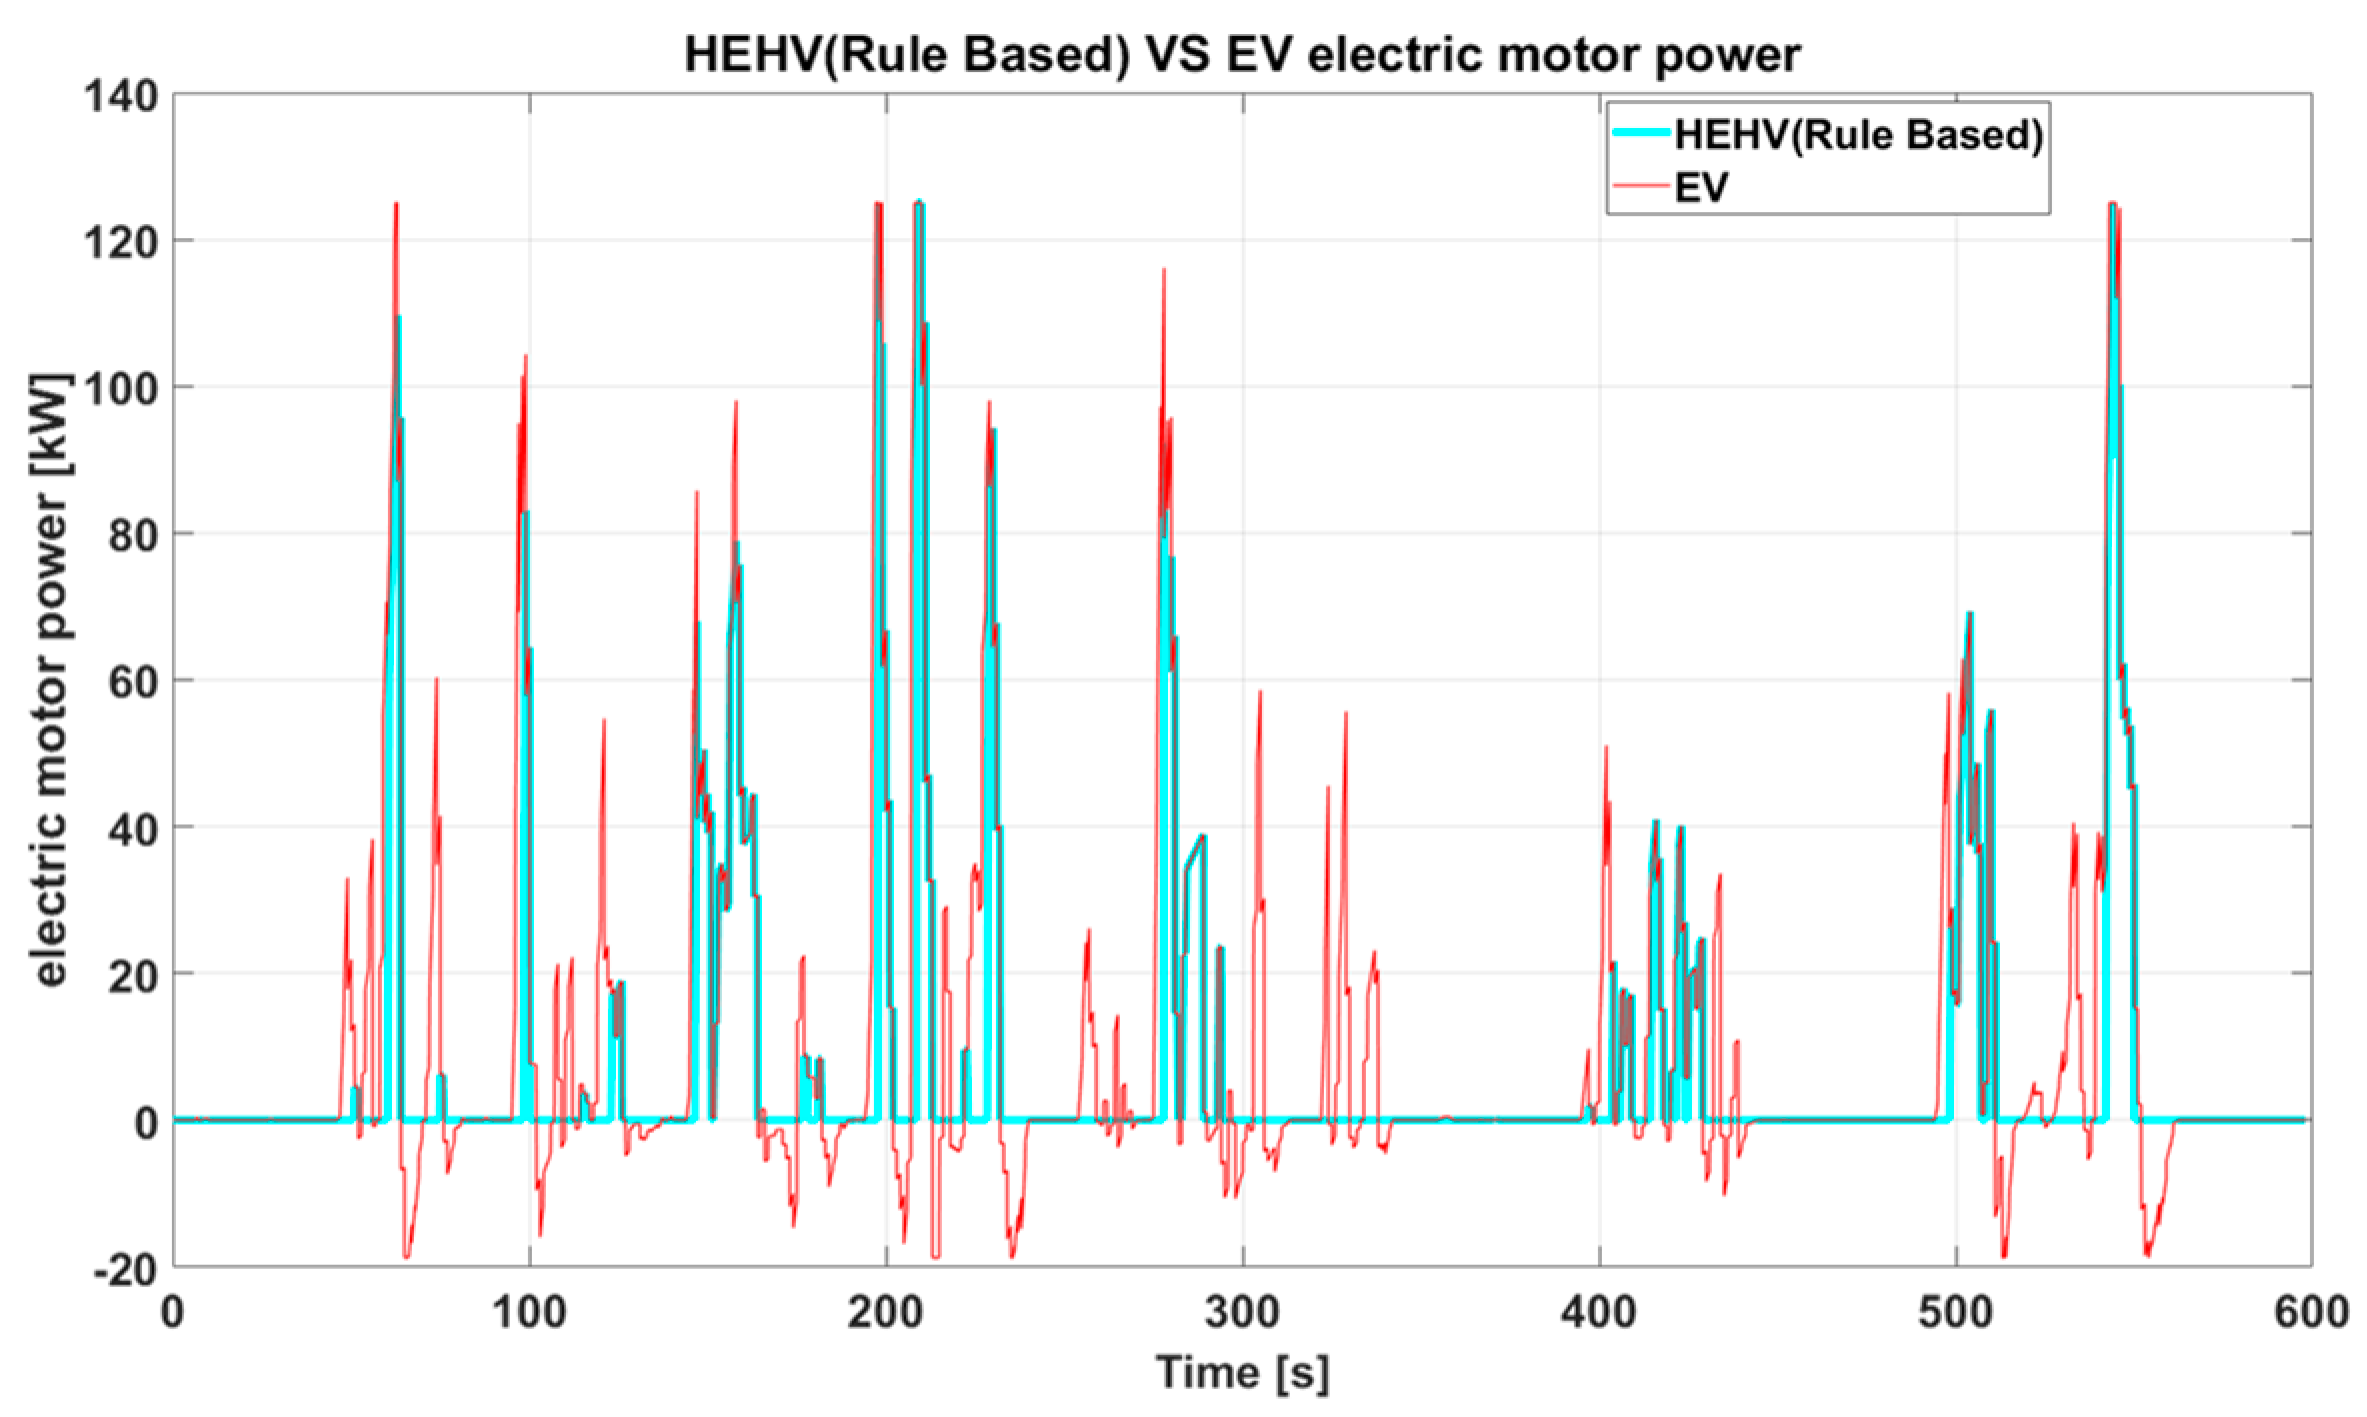
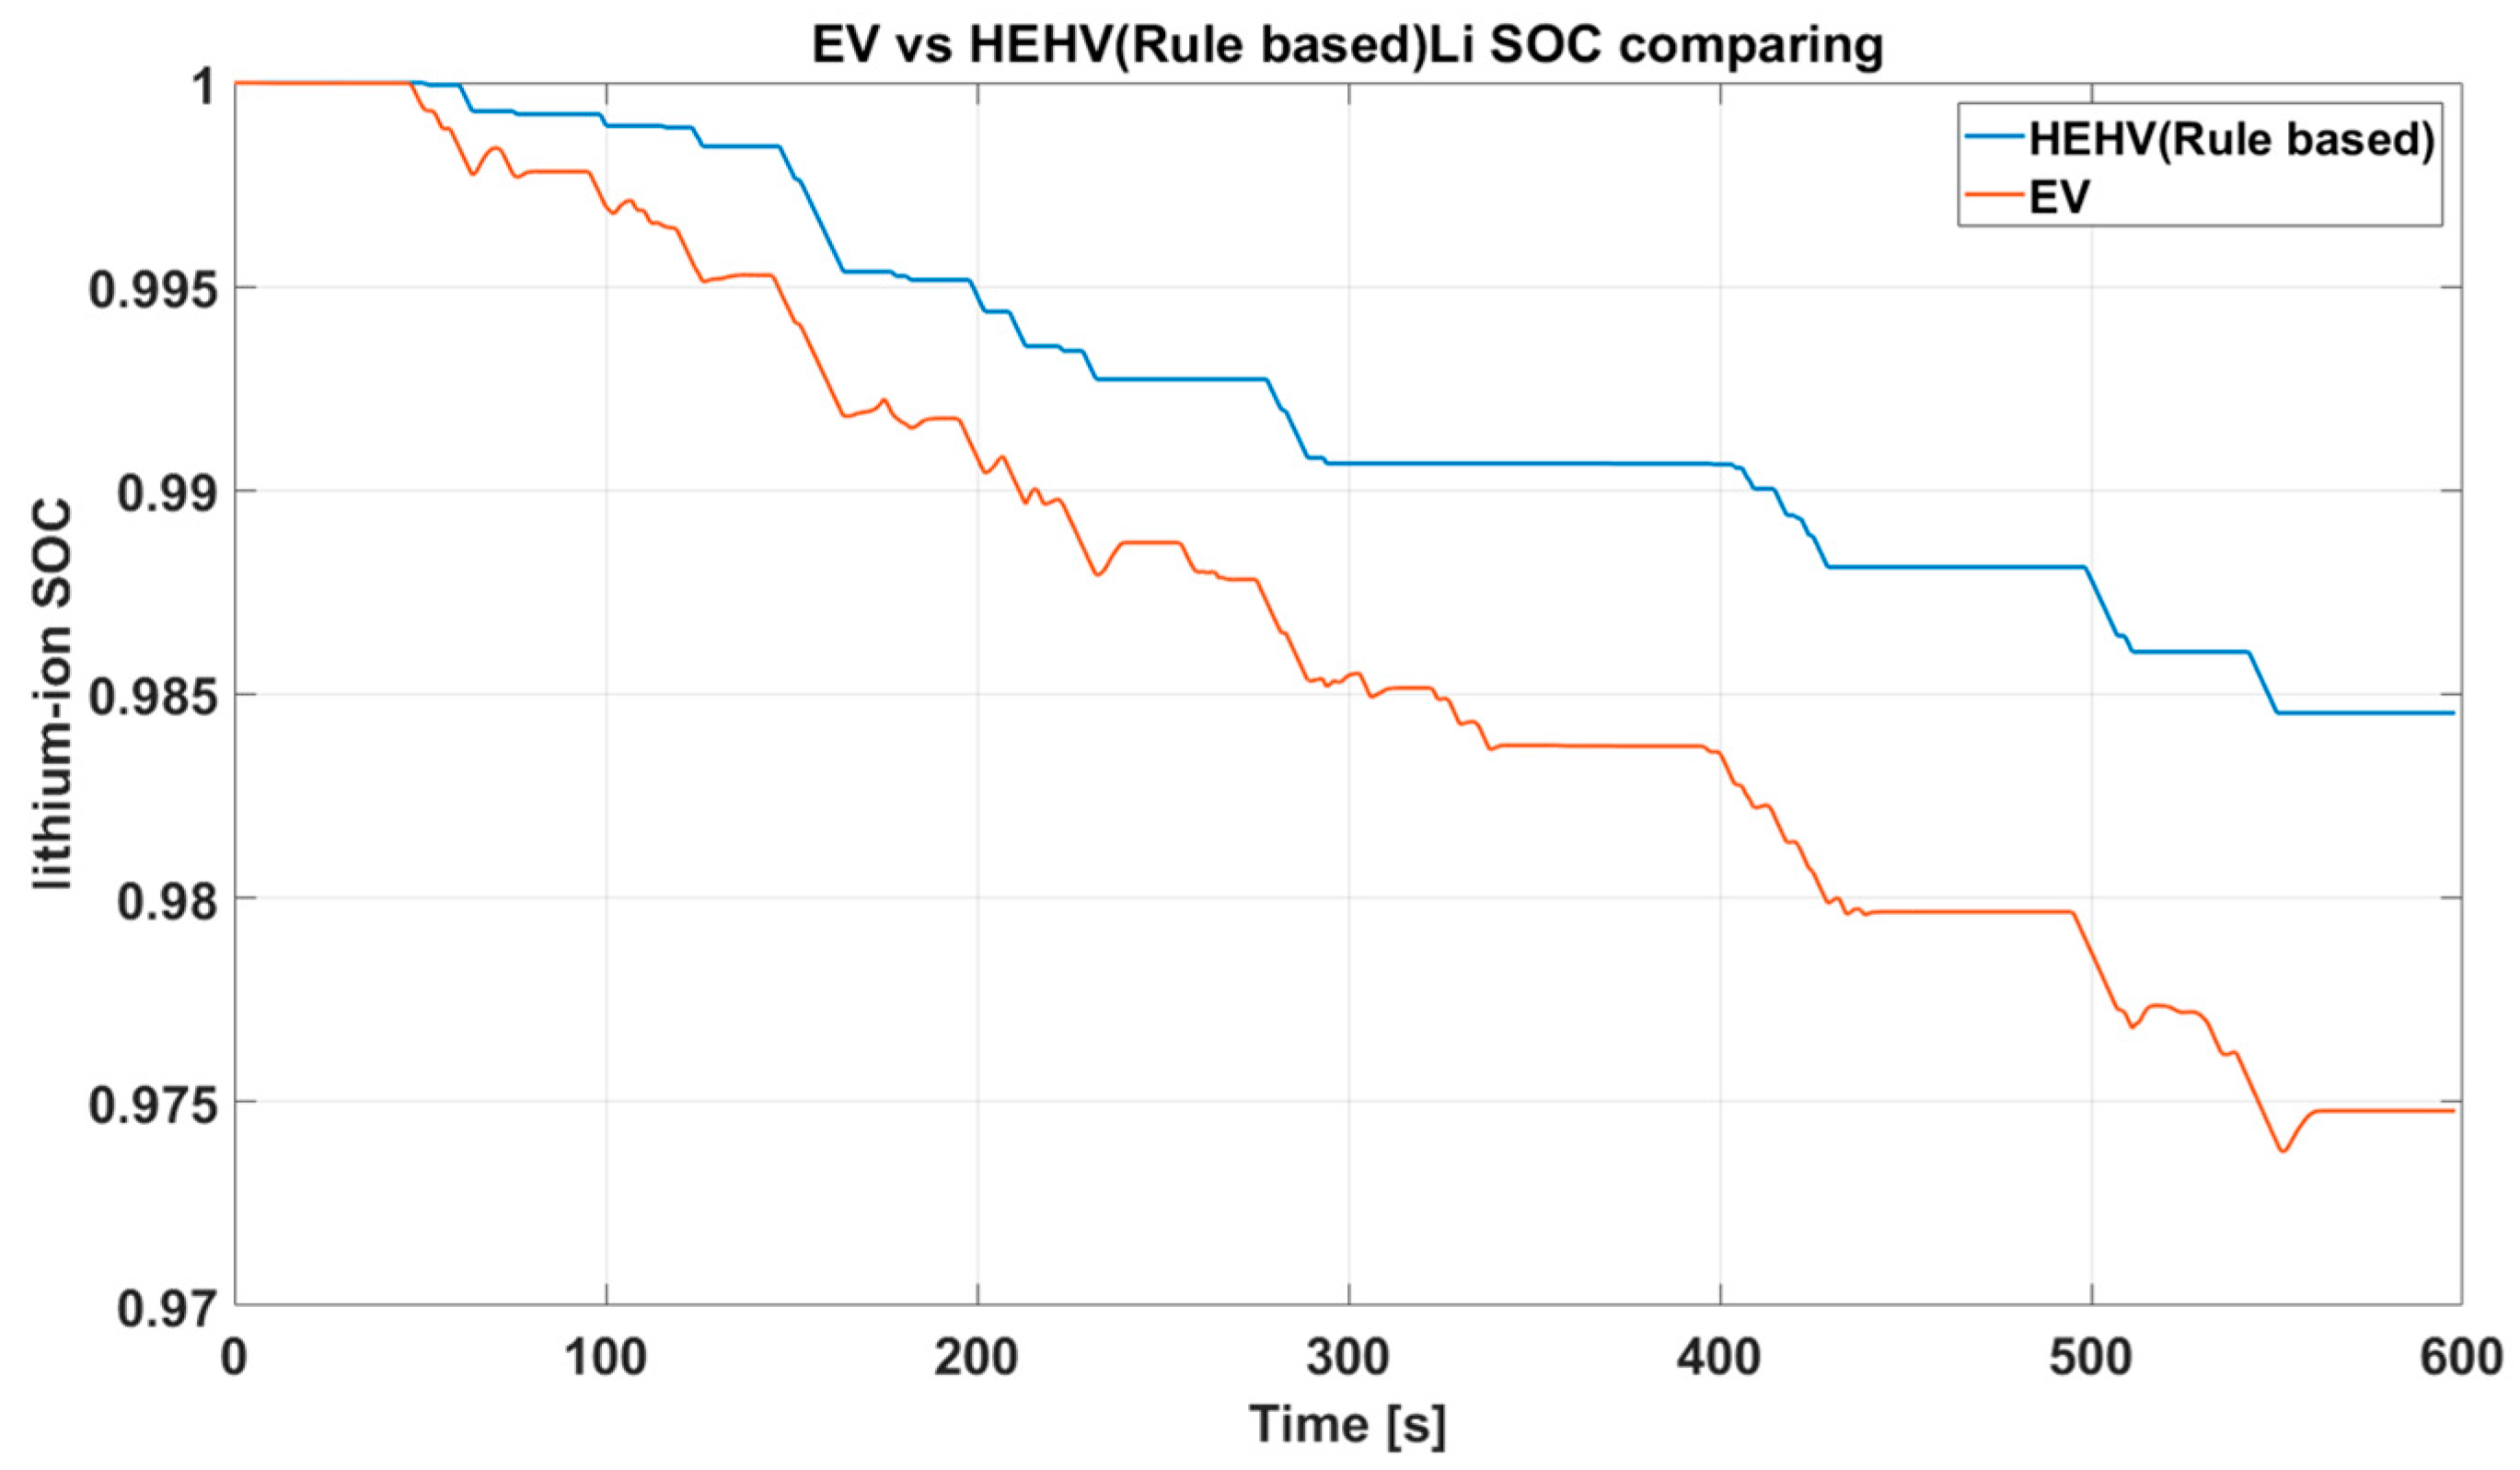
4.1. EV vs. HEHV (Rule-Based)
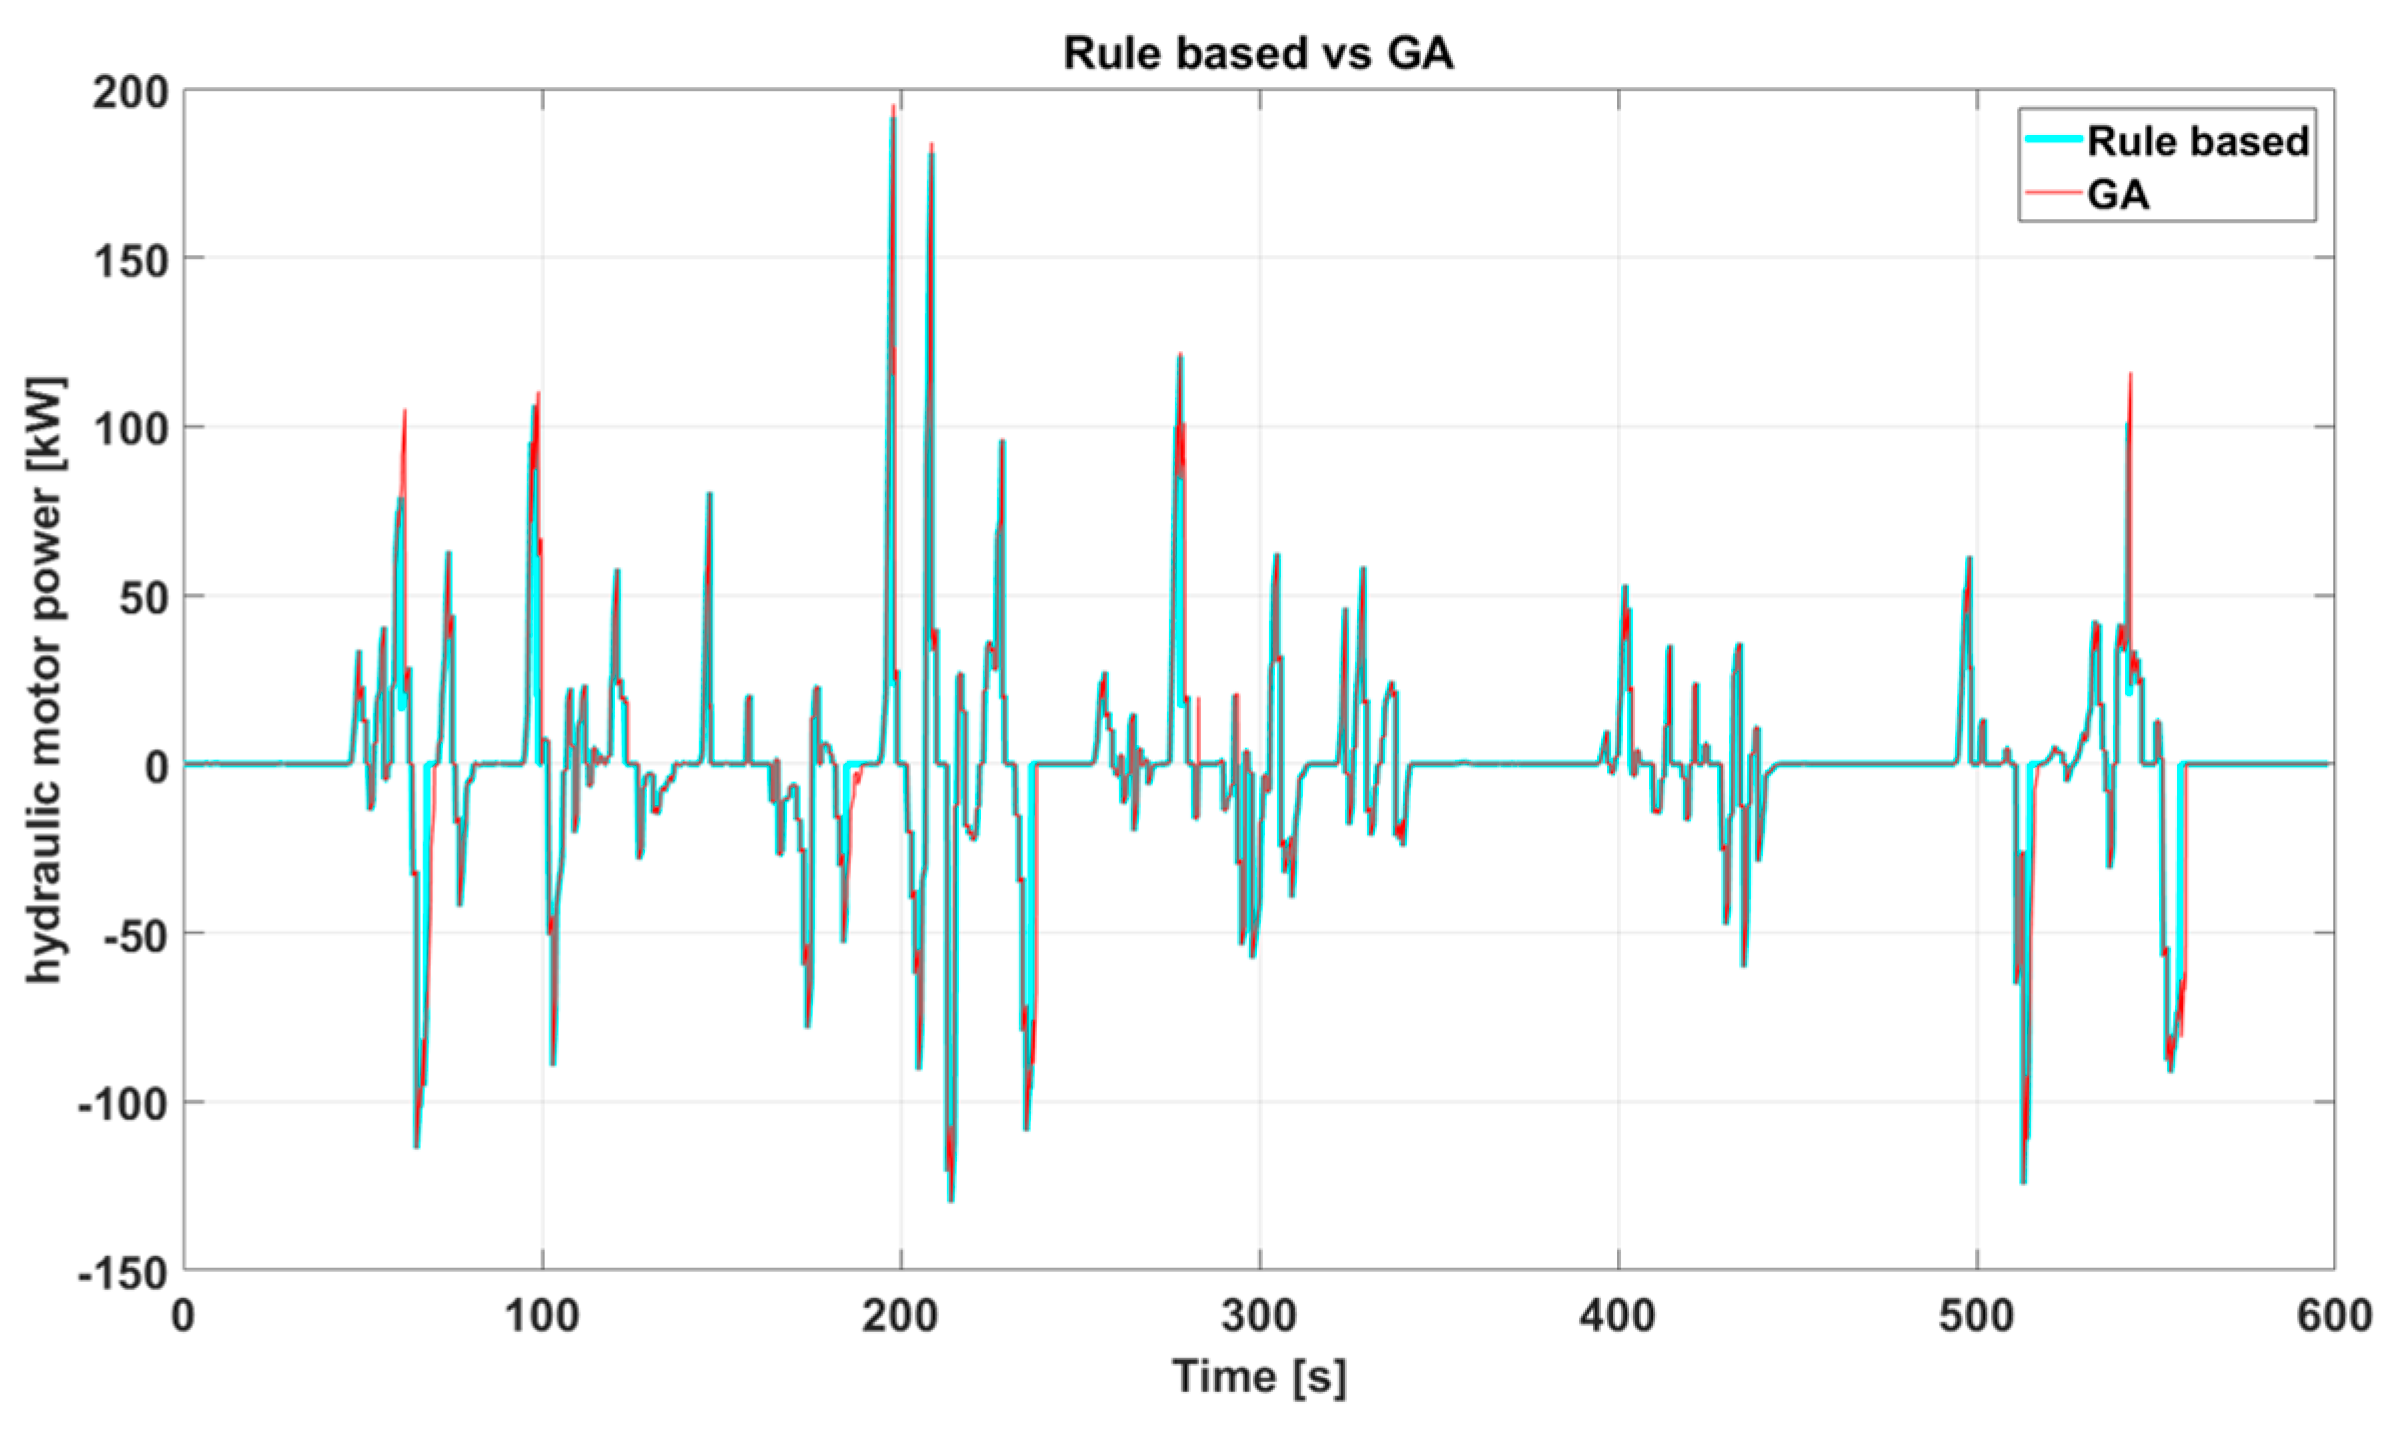
4.2. HEHV (Rule-Based) vs. HEHV (GA)
5. Discussion
6. Conclusions
- In the performance analysis of the pure electric vehicle, the electricity consumption of the set driving cycle is 0.334 kWh/km, and this is taken as the basic model for future comparison.
- In HEHV analysis (rule-based control), the electricity economic performance after simulation of the set driving cycle is 0.212 kWh/km, which is greatly improved than 0.334 kWh/km of pure electric vehicle, saving 36.5% of electricity. This is mainly because the hydraulic motor/pump in the pumping mode (energy recovery state) is more able to absorb, recover, and store the vehicle kinetic energy than electric motor, and the hydraulic motor/pump also avoids the application of electric motor at low speed.
- In the HEHV optimization analysis (genetic algorithm), 11.3% and 43.7% of electricity can be saved as compared with the HEHV (rule-based control) and pure electric vehicle, respectively.
- Through the HHEV simulation, the genetic algorithm was able to improve the energy efficiency of the HHEV by adjusting the chosen design variables of control strategy.
Author Contributions
Funding
Conflicts of Interest
Nomenclature
| Af | front area of the vehicle |
| Ah | battery capacity (ampere hour) |
| CD | aerodynamic resistance coefficient |
| DP/M | maximum hydraulic motor displacement |
| Ft | vehicle tractive effort |
| Ftire | tyre force |
| GR | final transmission gear ratio |
| Ibat | battery output current |
| N | hydraulic motor speed |
| P | accumulator pressure |
| Pbat | battery power |
| QP/M | hydraulic pump fluid flow rate |
| Ra | aerodynamic resistance |
| Rc | grading resistance |
| Rint | battery internal resistance |
| Rr | rolling resistance |
| Rr,A | front wheel rolling resistance |
| Rr,B | rear wheel rolling resistance |
| Rs | acceleration resistance |
| Sp | hydraulic pump plate angular position |
| SOC | state of charge |
| SOCint | initial value battery state of charge |
| SOL Li | lithium ion battery SOC |
| Tdrive | tyre torque |
| TP/M | hydraulic pump torque |
| V | volume of accumulator container area |
| Vf | accumulator inlet/outlet fluid |
| Voc | battery open circuit voltage |
| Vt | battery terminal voltage |
| W | vehicle weight |
| Wb | accumulator boundary movement work |
| a | vehicle acceleration |
| g | gravity acceleration |
| r | tyre radius |
| vw | wind speed |
| ηfd | transmission efficiency |
| ηtP/M | hydraulic pump mechanical efficiency |
| ηvP/M | hydraulic pump volumetric efficiency |
| θ | road slope angle |
| μr | rolling resistance coefficient |
| ρ | air density |
| ωdrive | tyre angular speed |
| ΔPP/M | hydraulic pump pressure difference at the entry and exit |
References
- Sokar, M. Investigation of Hydraulic Transmissions for Passenger Cars. Ph.D. Dissertation, Aachen University, Aachen, Germany, February 2011. [Google Scholar]
- Chen, J.S. Energy efficiency comparison between hydraulic hybrid and hybrid electric vehicles. Energies 2015, 8, 4697–4723. [Google Scholar] [CrossRef]
- Ramakrishnan, R.; Hiremath, S.S.; Singaperumal, M. Theoretical investigations on the effect of system parameters in series hydraulic hybrid system with hydrostatic regenerative braking. J. Mech. Sci. Technol. 2012, 26, 1321–1331. [Google Scholar] [CrossRef]
- Salmasi, F.R. Control strategies for hybrid electric vehicles: Evolution, classification, comparison, and future trends. IEEE Trans. Veh. Technol. 2007, 56, 2393–2404. [Google Scholar] [CrossRef]
- Lu, X.; Chen, Y.; Wang, H. Multi-objective optimization based real-time control for PEV hybrid energy management systems. In Proceedings of the IEEE Applied Power Electronics Conference and Exposition (APEC), San Antonio, TX, USA, 4–8 March 2018; pp. 969–975. [Google Scholar]
- Zeng, Y.; Cai, Y.; Kou, G.; Gao, W.; Qin, D. Energy management for plug-in hybrid electric vehicle based on adaptive simplified-ECMS. Sustainability 2018, 10, 2060. [Google Scholar] [CrossRef]
- Wang, X.; He, H.; Sun, F.; Zhang, J. Application study on the dynamic programming algorithm for energy management of plug-in hybrid electric vehicles. Energies 2015, 8, 3225–3244. [Google Scholar] [CrossRef]
- Yu, J.; Liu, N.; Zhang, Y.; Wang, B. Modeling and control strategy simulation of extended-range electric vehicle. In Proceedings of the 2011 International Conference on Transportation, Mechanical, and Electrical Engineering (TMEE), Changchun, China, 16–18 December 2011; pp. 829–832. [Google Scholar]
- Gao, J.P.; Zhu, G.M.G.; Strangas, E.G.; Sun, F.C. Equivalent fuel consumption optimal control of a series hybrid electric vehicle. Proc. Inst. Mech. Eng. Part D J. Automob. Eng. 2009, 223, 1003–1018. [Google Scholar] [CrossRef]
- Konev, A.; Lezhnev, L.; Kolmanovsky, I. Control Strategy Optimization for a Series Hybrid Vehicle; SAE Paper No. 2006-01-0663; SAE World Congress: Detroit, MI, USA, 2006. [Google Scholar]
- Liu, X.; Fan, Q.; Zheng, K.; Duan, J.; Wang, Y. Constant SOC control of a series hybrid electric vehicle with long driving range. In Proceedings of the IEEE International Conference on Information and Automation, Harbin, China, 11–13 August 2010; pp. 1603–1608. [Google Scholar]
- Li, S.G.; Sharkh, S.M.; Walsh, F.C.; Zhang, C.N. Energy and battery management of a plug-in series hybrid electric vehicle using fuzzy logic. ieee trans. Veh. Technol. 2011, 60, 3571–3585. [Google Scholar] [CrossRef]
- Ho, P.; Klong, E. Intelligent Energy Distribution for Series HEVs Using Determined Optimal Driving Patterns via a Genetic Algorithm; SAE Paper No. 2013-01-0572; Graduate Faculty of North Carolina State University: Raleigh, NC, USA, 2013. [Google Scholar]
- Xu, Q.; Luo, X.; Jiang, X.; Zhao, M. Research on double fuzzy control strategy for parallel hybrid electric vehicle based on GA and DP optimization. IET Electr. Syst. Transp. 2018, 8, 144–151. [Google Scholar] [CrossRef]
- Kaur, J.; Saxena, P.; Gaur, P. Genetic algorithm based speed control of hybrid electric vehicle. In Proceedings of the 2013 Sixth International Conference on Contemporary Computing, Noida, India, 8 August 2013; pp. 65–69. [Google Scholar]
- Hu, F.; Zhao, Z. Optimization of control parameters in parallel hybrid electric vehicles using a hybrid genetic algorithm. In Proceedings of the 2010 IEEE Vehicle Power and Propulsion Conference, Lille, France, 1–3 September 2010; pp. 1–6. [Google Scholar]


| Gene Length | 20 Bits (10 Bits for Both Acceleration and Accumulator SOC) |
|---|---|
| Group number | 50 |
| Algebra | 40 |
| Mating rate | 0.9 |
| Mutation probability | 0.01 |
| Parameter | Symbol | Unit | Value |
|---|---|---|---|
| Vehicle mass | W | kg | 8800 |
| Wheelbase | cm | 378 | |
| Wheel track | cm | 168 | |
| Front area | 5.4 | ||
| Aerodynamic drag coefficient | 0.28 | ||
| Rolling resistance coefficient | 0.008 | ||
| Tire radius | r | m | 0.334 |
| Air density | ρ | 1.225 | |
| Gravitational acceleration | g | m/ | 9.81 |
| Final reduction gear ratio | GR | 11.5 | |
| Hydraulic system weight | kg | 200 |
| Energy Consumption (kWh) | Electricity Economy (kWh /km) | |
|---|---|---|
| Electric Vehicle (EV) | 0.63 | 0.334 |
| Hydraulic Electric Hybrid Vehicle, HEHV (Rule-Based) | 0.40 | 0.212 |
| Percent difference | +36.5% | +36.5% |
| Power Consumption (kWh) | Electricity Economy (kWh/km) | |
|---|---|---|
| Hydraulic Electric Hybrid Vehicle, HEHV (Rule-Based) | 0.40 | 0.212 |
| Hydraulic Electric Hybrid Vehicle, HEHV (GA) | 0.355 | 0.188 |
| Percent difference | +11.3% | +11.4% |
| Percent of Improvement | |
|---|---|
| Electric Vehicle (EV) | − |
| Hydraulic Electric Hybrid Vehicle, HEHV (Rule-Based) | 36.5% |
| Hydraulic Electric Hybrid Vehicle, HEHV (GA) | 43.7% |
© 2020 by the authors. Licensee MDPI, Basel, Switzerland. This article is an open access article distributed under the terms and conditions of the Creative Commons Attribution (CC BY) license (http://creativecommons.org/licenses/by/4.0/).
Share and Cite
Hwang, H.-Y.; Lan, T.-S.; Chen, J.-S. Optimization and Application for Hydraulic Electric Hybrid Vehicle. Energies 2020, 13, 322. https://doi.org/10.3390/en13020322
Hwang H-Y, Lan T-S, Chen J-S. Optimization and Application for Hydraulic Electric Hybrid Vehicle. Energies. 2020; 13(2):322. https://doi.org/10.3390/en13020322
Chicago/Turabian StyleHwang, Hsiu-Ying, Tian-Syung Lan, and Jia-Shiun Chen. 2020. "Optimization and Application for Hydraulic Electric Hybrid Vehicle" Energies 13, no. 2: 322. https://doi.org/10.3390/en13020322
APA StyleHwang, H.-Y., Lan, T.-S., & Chen, J.-S. (2020). Optimization and Application for Hydraulic Electric Hybrid Vehicle. Energies, 13(2), 322. https://doi.org/10.3390/en13020322