1. Introduction
As the depletion of petroleum resources continues and environmental pollution becomes more serious, fuel economy and exhaust regulations of internal combustion engines are rapidly strengthening around the world. Various techniques are being developed to increase the efficiency of gasoline engines to satisfy the emission regulations, such as fuel and knock characteristics [
1], engine turbulence [
2], exhaust gas recirculation strategies [
3] and valve timing strategies [
4].
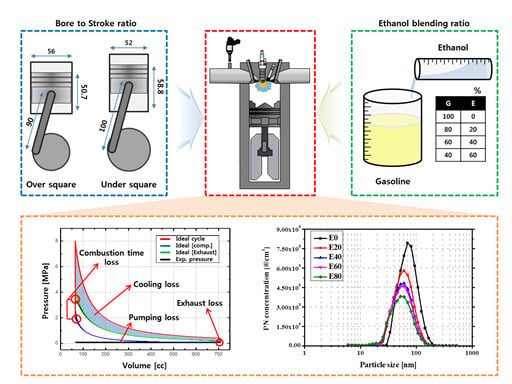
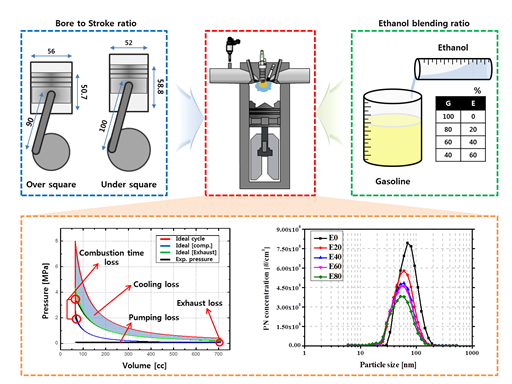
The bore to stroke (B/S) ratio is a factor that should be considered early in the design stage of the engine. As the bore/stroke ratio decreases under the same displacement conditions, the cylinder surface/volume ratio at top dead center (TDC) also decreases, which increases engine efficiency due to the cooling reduction effect [
5]. Like this, the B/S ratio is an important factor that directly affects engine efficiency. For this reason, various studies based on the B/S ratio have been previously conducted [
6,
7]. Most of the studies have been interpreted to compare the turbulence intensity, flame surface and thermal efficiency in the cylinder according to the B/S ratio. Experimental studies based on B/S ratios were often conducted. [
8,
9]. However, in the case of engine research based on most B/S ratios, the torque and engine power comparison is a study. On the other hand, in this study, the combustion pressure was measured to calculate the combustion rate in the combustion chamber and the engine loss compared to the abnormal cycle. In addition, gas and particle emission were also analyzed. In addition, gasoline engines utilizing increased compression ratio and output along with increasing the fuel octane number to overcome the disadvantages of fuel economy have been applied. In this respect, many studies are being conducted using ethanol, an oxygen fuel, which is harmless to the human body and is less burdened by environmental pollution. By lowering the fuel temperature, the volumetric efficiency can be improved, and as result, a mixture of gasoline and ethanol improves the engine performance [
10,
11,
12].
Recently, gasoline engines have been studied while focusing on the development of a gasoline direct injection (GDI) engine in which fuel is injected directly into a cylinder. The combustion chamber cooling effect upon using a high compression ratio and latent heat of evaporation of the fuel is shown. Due to this cooling effect, knocking inhibition and volumetric efficiency are increased, thereby improving engine efficiency [
13,
14,
15]. However, due to the lack of a homogenous air and fuel mixture, locally rich combustion occurs, and particle emission due to fuel wetting of the cylinder wall and the piston becomes a problem. As a result, the regulation of particle emission in gasoline vehicles has gradually strengthened to the same level as that of diesel vehicles [
16,
17,
18,
19]. Recently, due to the difficulty of satisfying stringent particle emission regulations, interest in port fuel injection (PFI) engines has been increasing since fuel is injected into existing ports to form relatively homogeneous mixtures. Catapano et al. [
20] compared the combustion process and emissions from ethanol mixing in GDI and PFI engines. Particular emissions, in particular, also showed dramatic emission reductions from the PFI engine. B. Wahono et al. [
21] showed the results of swirl and tumble ratio in the cylinder of PFI engine and studied the internal flow with increasing RPM. As such, research on the PFI engine is steadily progressing.
In addition to restrictions on light duty vehicles, enhanced restrictions have recently been levied on motorcycles. In particular, low-emission motorcycles, such as scooters, are used in a high proportion in urban areas, so the emission restrictions have been tightened from EURO 4, which is a European motorcycle emission regulation, to EURO 5. Therefore, it is necessary to study engine efficiency and exhaust gas reduction methods for motorcycles, including particle emission under high rpm and wide open throttle (WOT) conditions.
In this study, combustion and exhaust characteristics were analyzed for the bore/stroke ratio in a small single-cylinder PFI engine with 125 cc displacement. Furthermore, combustion and exhaust gas analysis studies were performed using a mixture of gasoline and ethanol. In addition, the particle emission under each experimental condition was measured to analyze the number and size distribution of particles emitted from the PFI engine.
2. Experimental Apparatus and Test Conditions
2.1. Experimental Apparatus
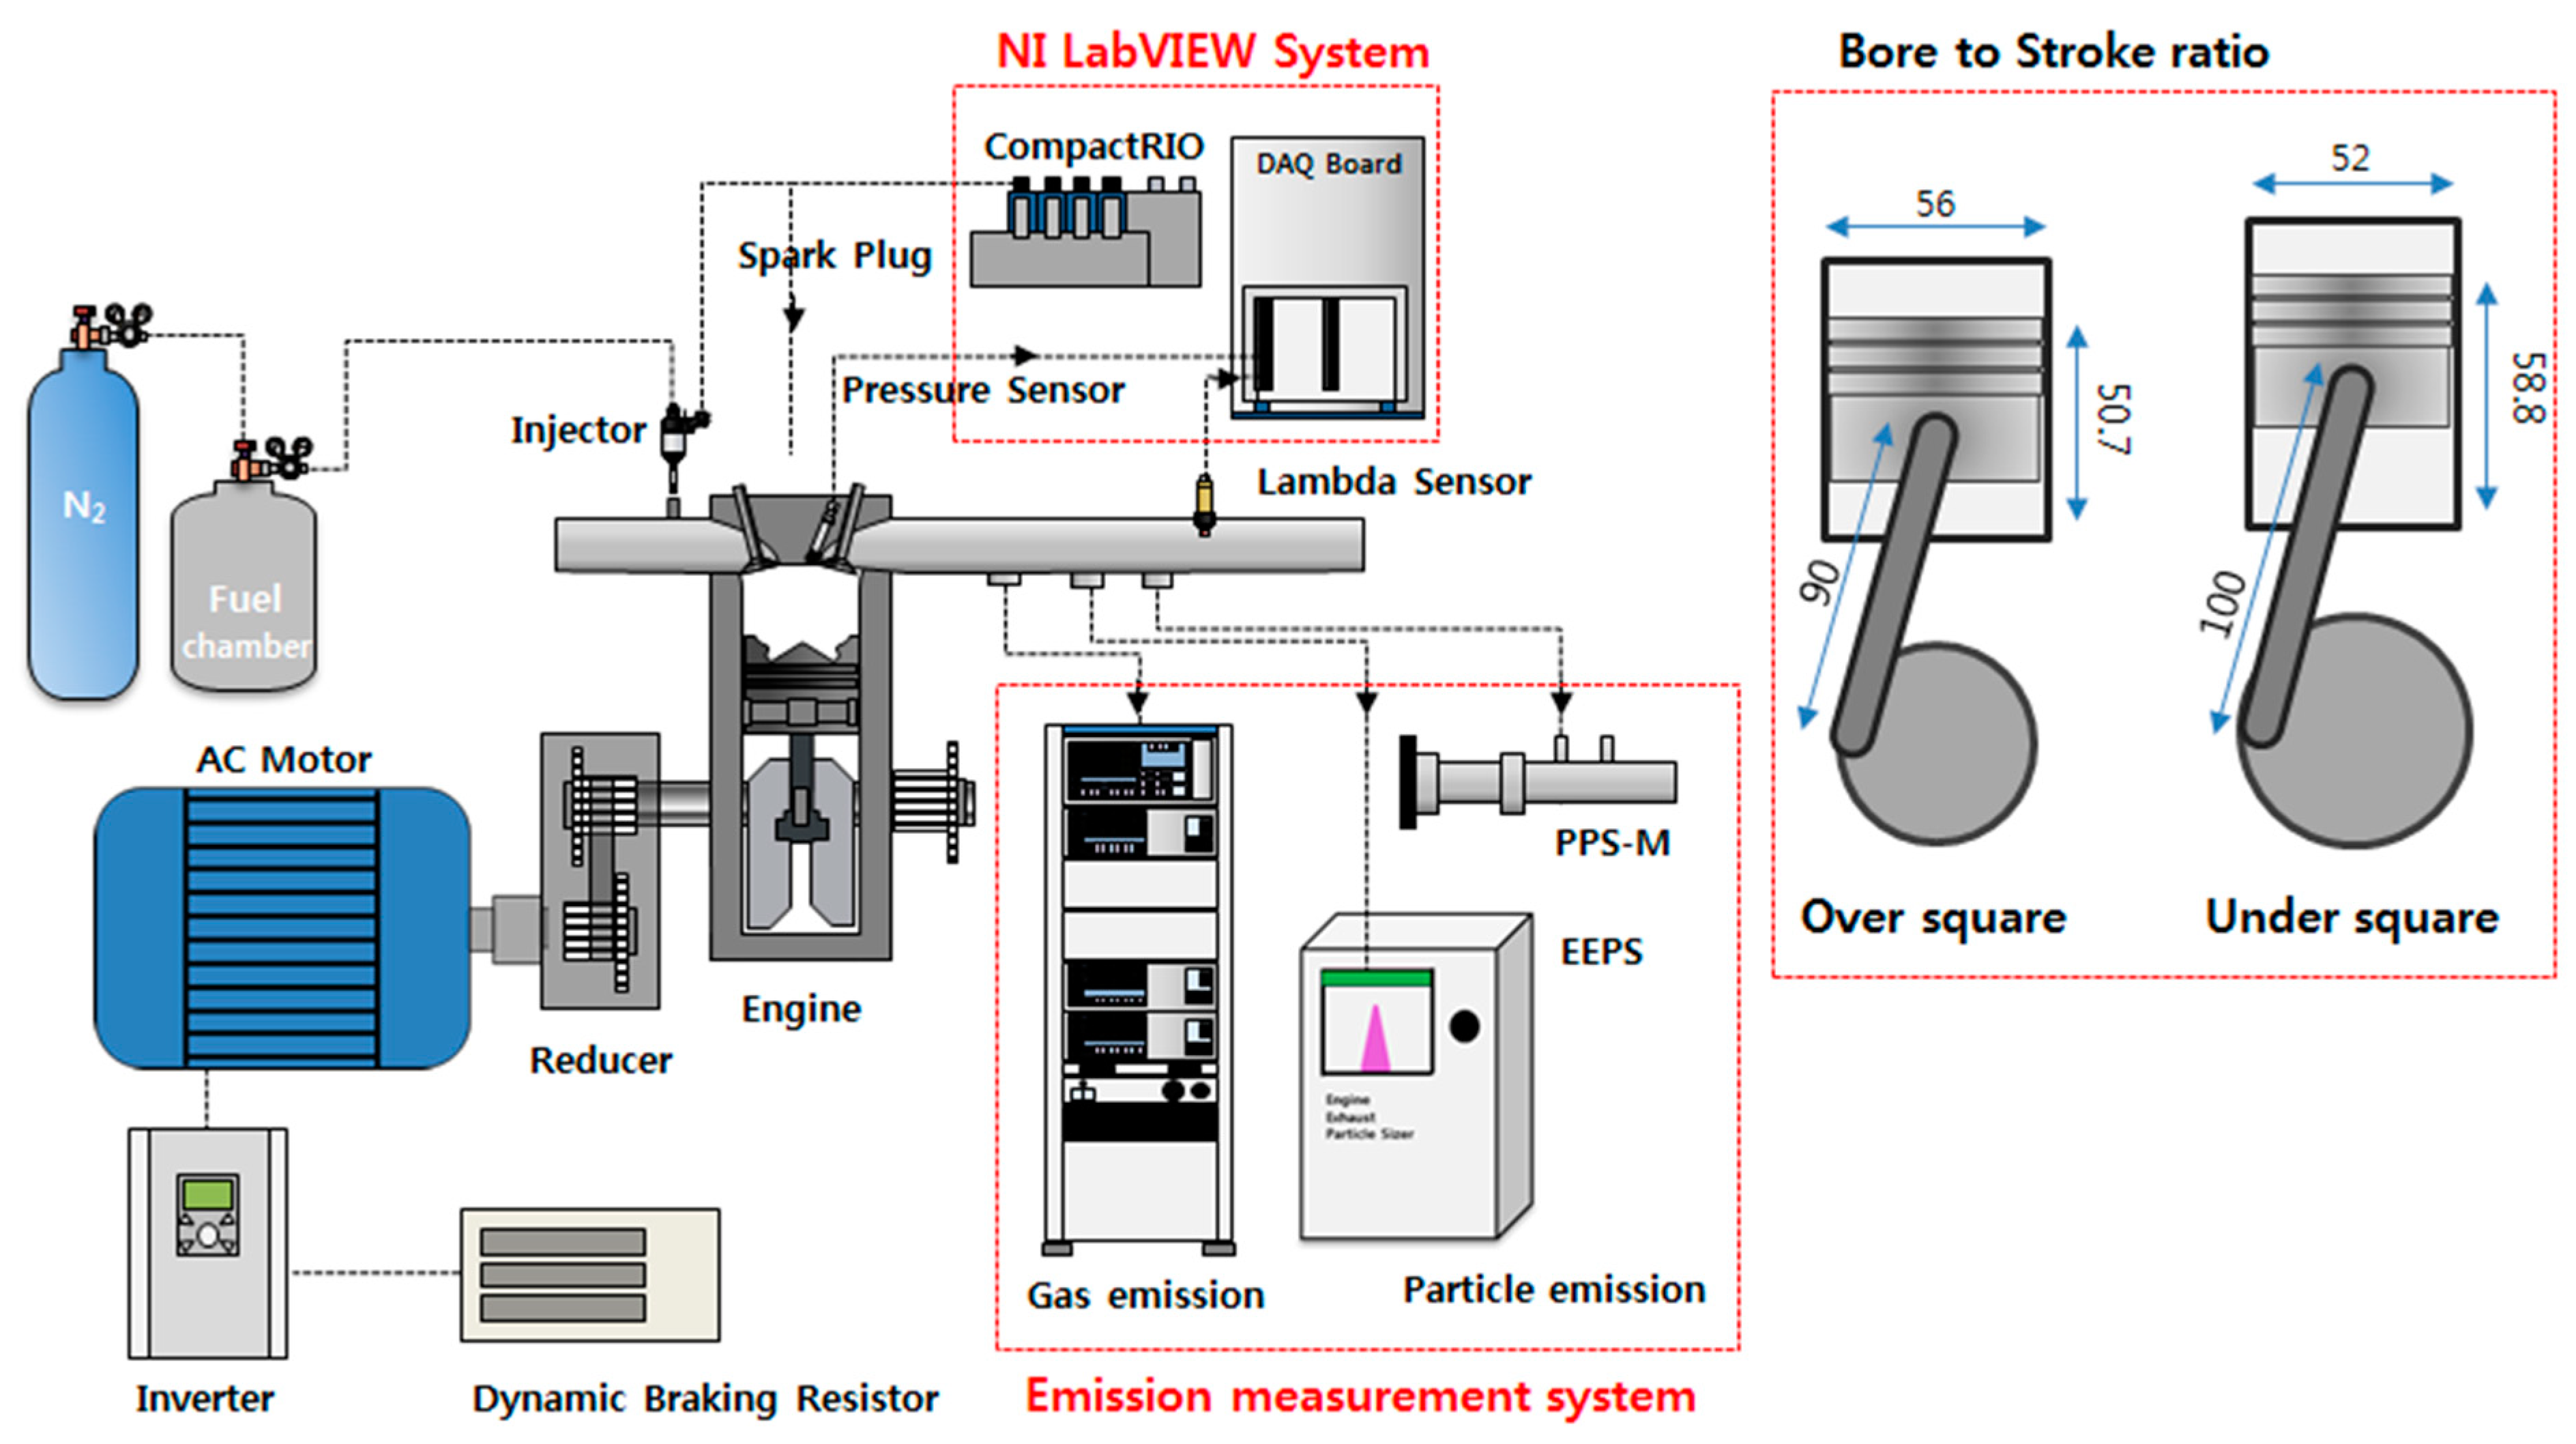
The experimental equipment setup and engine information are given in
Figure 1. In this study, a PFI motorcycle engine was used and two engines with B/S ratios of 0.88 and 1.1, respectively, were analyzed to compare combustion and exhaust characteristics.
Table 1 shows the information for the two engines. The intake flow rate is the natural flow rate under WOT conditions, and the lambda value was feedback to 1 using a lambda sensor and the NI labview system. Therefore, the AFR was the theoretical air-fuel ratio (14.7). Control factors such as the engine ignition timing and injection timing were controlled in real time using the Labview program, and the combustion characteristics were also analyzed using the Labview program. In the case of pressure data of the engine, the final combustion pressure data was used by performing three repeated experiments for 100 cycles of total combustion, and the heat release rate, combustion duration and engine efficiency were calculated based on the pressure data.
The main physical properties of gasoline and ethanol used in this study are shown in
Table 2. Ethanol has the advantages of a higher octane number, latent heat of evaporation, and oxygen-rich fuel compared to gasoline, but it requires more fuel for similar power production than conventional gasoline because of lower heating value.
Exhaust gas and particle measurement equipment are shown in
Table 3. The measurement of NOx and THC, which are gaseous substances, was carried out using a MEXA-9100 exhaust gas measuring instrument. In the case of particle number (PN), which is particulate matter, PN was measured by Pegasor Particle Sensor-Monitoring (PPS-M) and the particle size distribution of PN was measured through the engine exhaust particle sizer (EEPS) instrument. The measuring range of the PPS-M was 2.5 micrometers, and EEPS instruments can measure PN distributions with a size from 5.6 to 560 nm. Detailed equipment information is summarized in
Table 3.
2.2. Experimental Conditions
The engine was operated at 5000 rpm and the ignition timing was fixed at BTDC 33.5 degrees, at an MBT of 5000 rpm. Fuel injection was carried out at an injection pressure of 4 bar. The fuel used in the test was a mixture of gasoline and ethanol, and the experiment was conducted at 20% v/v intervals from 100% gasoline (E0) to 60% ethanol (E60). For 80% ethanol, combustion stability decreased and misfire occurred. Since ethanol produces less heat than gasoline, more fuel must be injected to maintain a lambda 1 condition. Therefore, the experiment was carried out while advancing start of injection (SOI) based on the fixed EOI (aTDC 330), and the H/C ratio was changed by changing the ethanol blend ratio (
Table 4).
3. Results
In this session, the experimental results using two engines with different bore to stroke values are shown. The bore and stroke values were 56 mm and 50.7 mm in the over-square engine, yielding a B/S ratio of 1.1. The under-square engine had a bore and stroke of 52 mm and 58.8 mm, respectively, yielding a B/S ratio of 0.88. The fuel injection timing was bTDC 60 degrees and the ignition timing was fixed at bTDC 33 degrees. In addition, the engine load was maintained in the high load section of the WOT curve and the experiment was performed in Lambda 1.
The motoring pressure results of two engines with different compression ratios are shown in
Figure 2 as follows. The over square engine with a high compression ratio of 11.4 shows higher pressure than the under square engine with a compression ratio of 11.0, and the maximum cylinder pressure was also about 1.7 bar higher. It is believed that this is a general result where high pressures at high compression ratios were measured. However, the combustion results show the opposite of motoring pressure.
3.1. Effects of Bore to Stroke Ratio on Combustion Characteristics
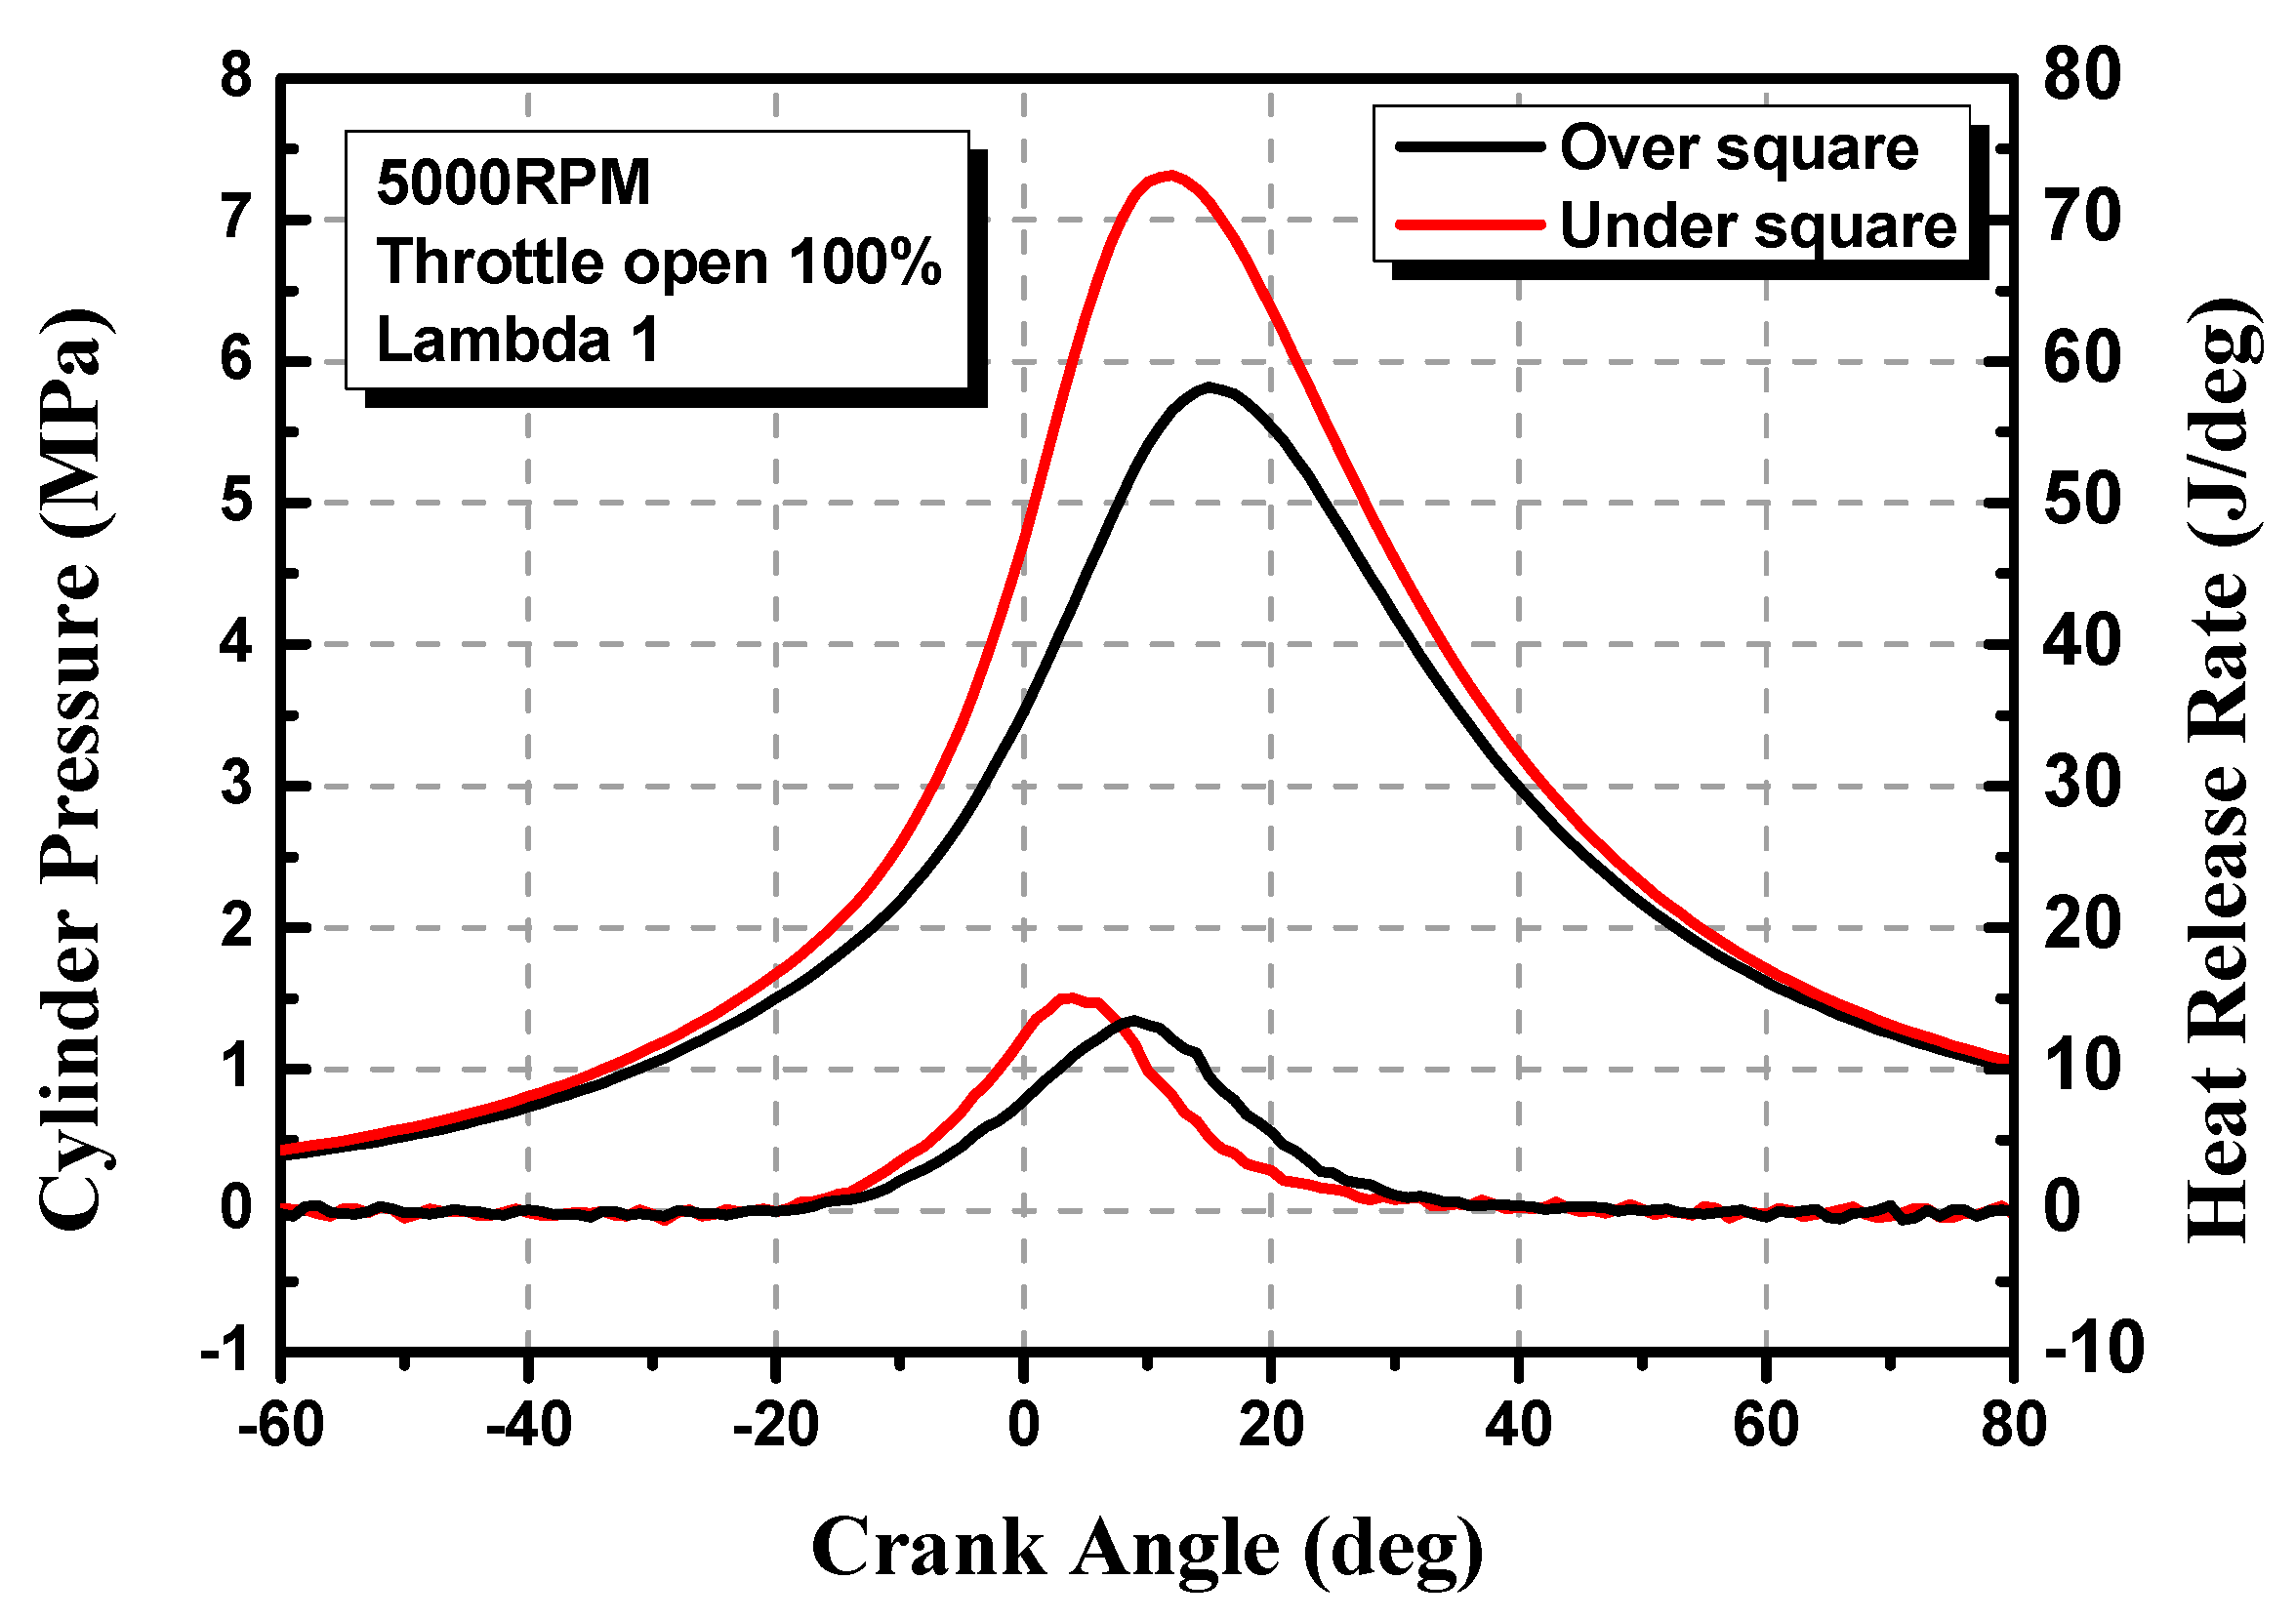
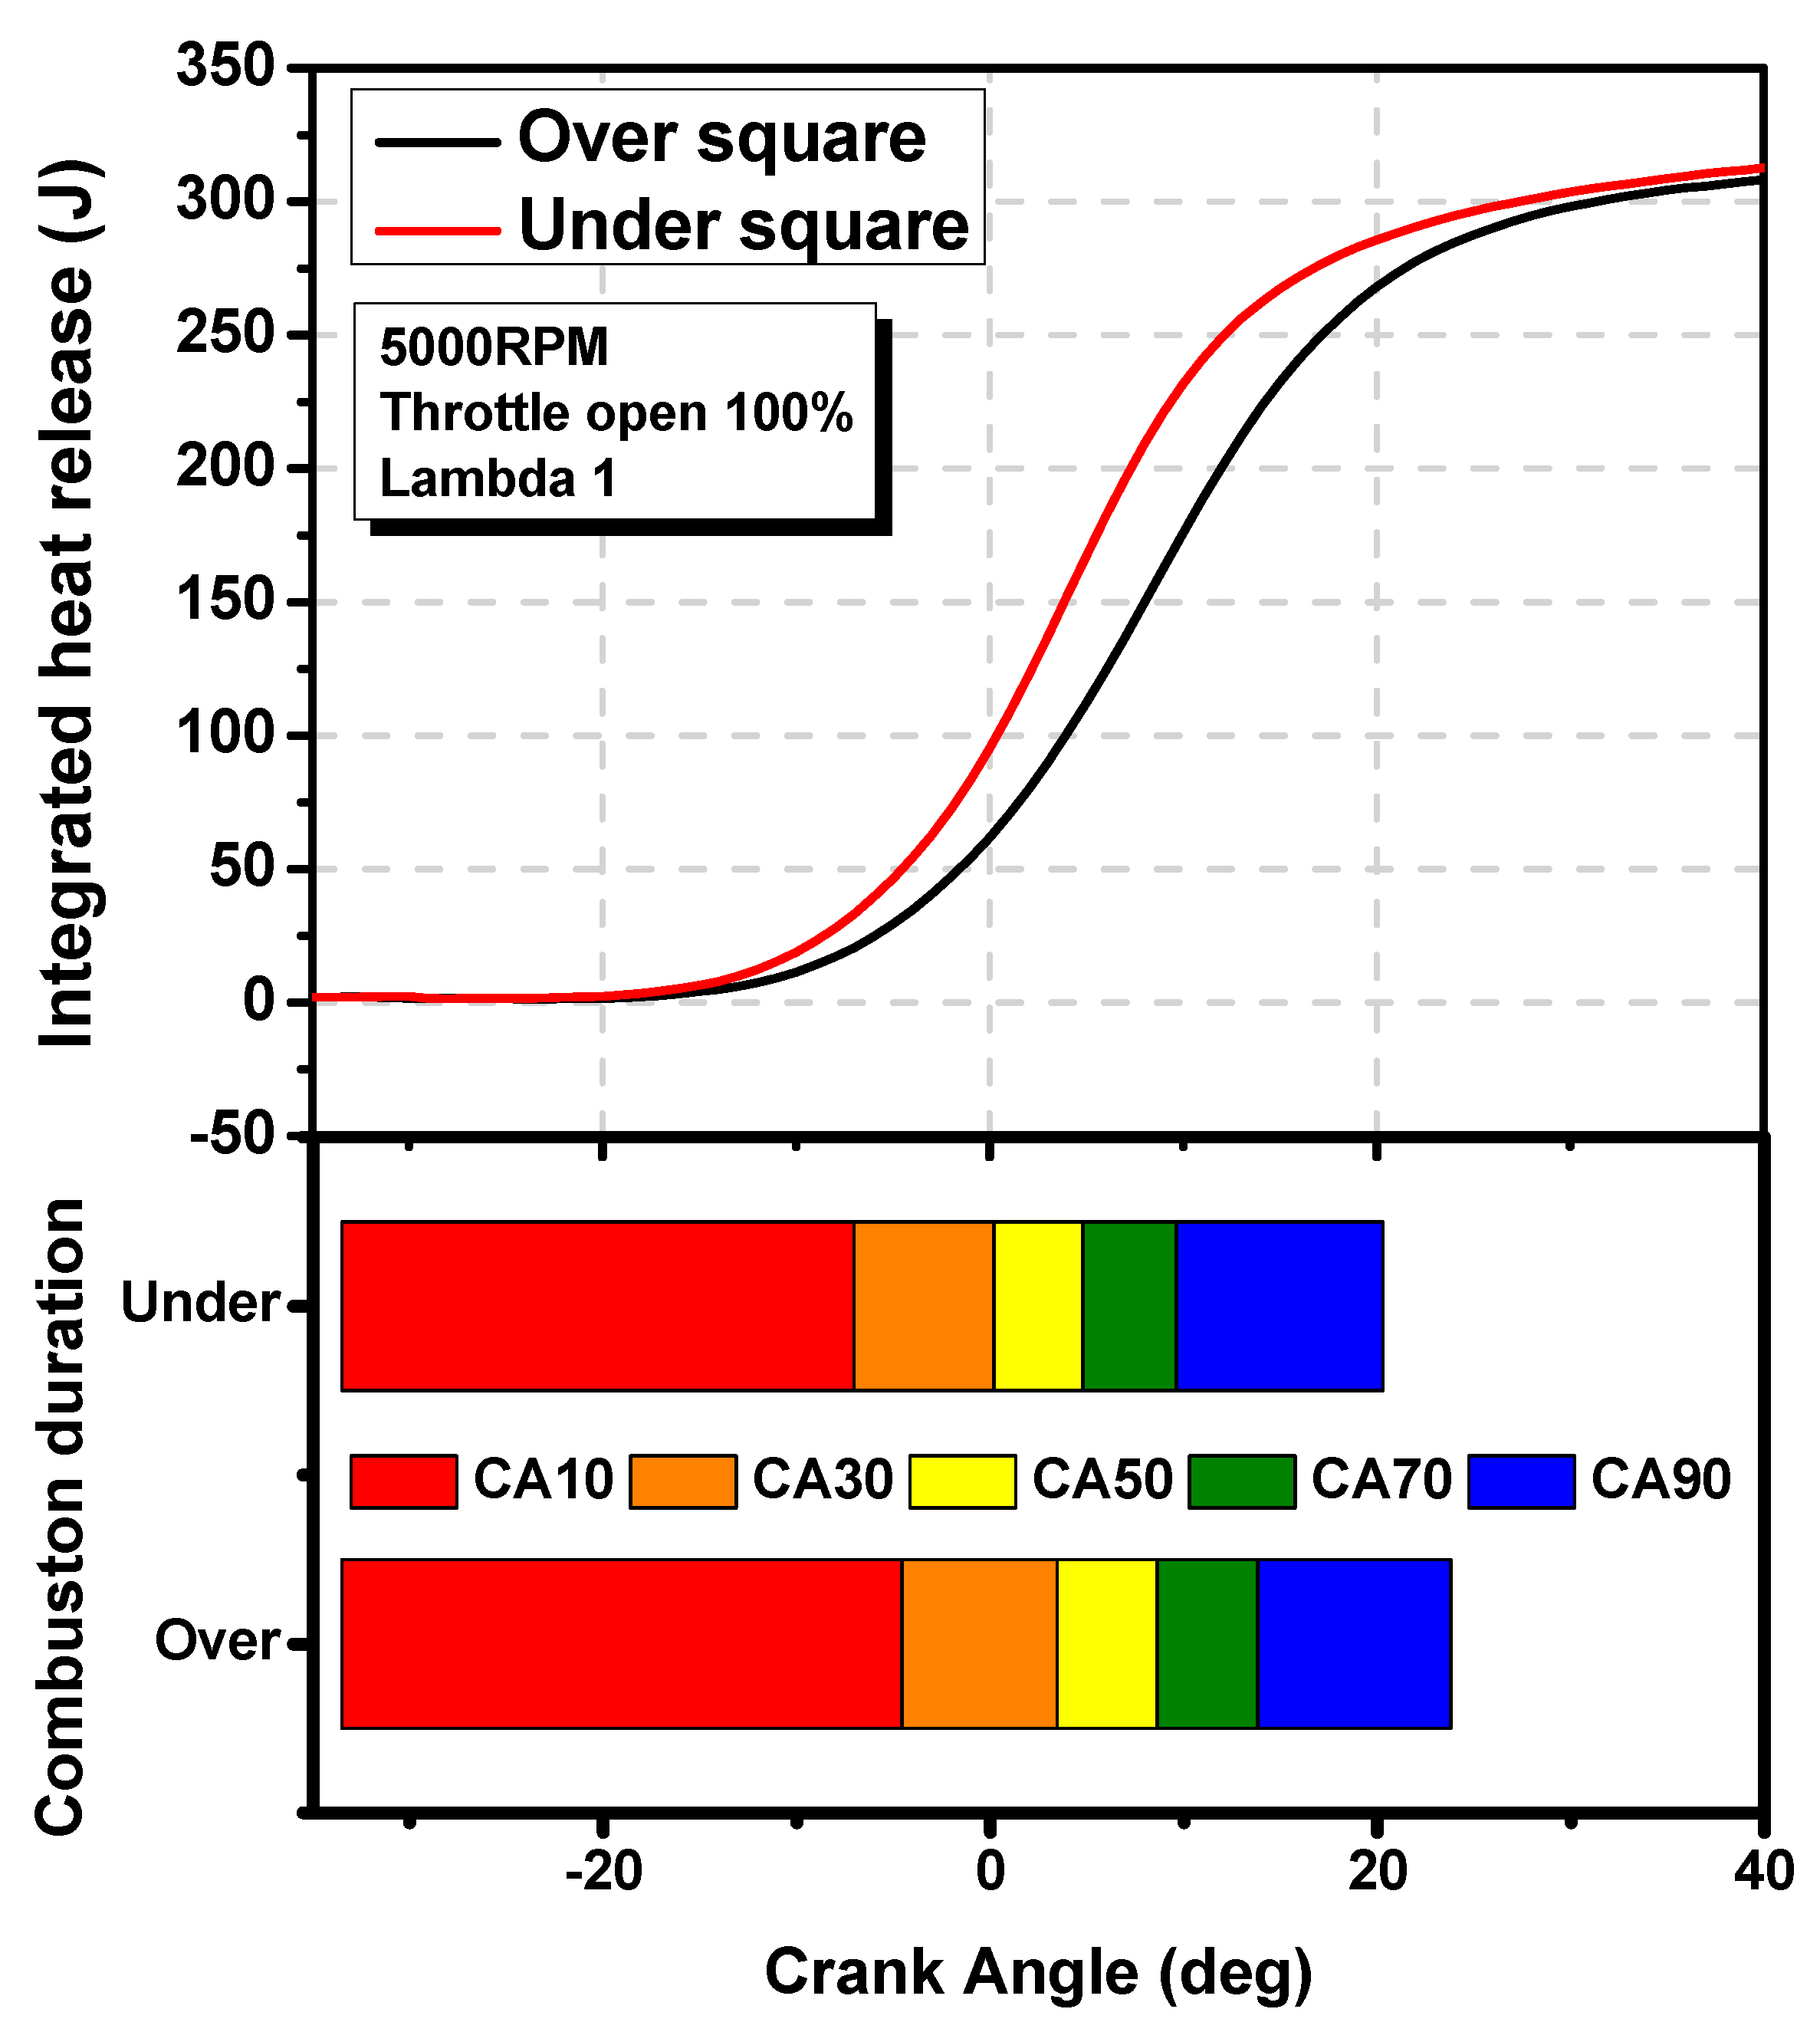
Figure 3 shows the pressure and heat generation rate inside the cylinder according to the engine’s bore to stroke ratio. In general, high combustion pressures are measured in engines with high compression ratios, but this study shows higher combustion pressures at lower compression ratios. This resulted in high cylinder pressure in high compression ratio engines before the start of combustion, but high pressure in under square engines with low compression ratio due to differences in combustion process after ignition. The maximum pressure in the combustion chamber was also higher in the under-square engine than in the over-square engine, with 73 bar and 60 bar, respectively. In the case of the maximum pressure position, the under-square engine had a TDC maximum pressure at 12 degrees and the over-square engine had a TDC maximum pressure at 15 degrees. In the heat generation results, even under the same ignition timing, faster heat generation results could be seen in the under-square engine. As a result, it was judged that combustion occurs faster in the under-square engine than in the over-square engine. Further, the combustion speed was confirmed by the cumulative heat generation as shown in
Figure 4. In this study, the combustion speed of each engine was defined by the combustion duration. The shorter the combustion duration calculated based on the cumulative heat release, the faster the combustion speed, and the longer the combustion duration, the slower the combustion speed. As can be seen from the results in
Figure 4, the combustion duration in the under-square engine was short, which was determined that combustion speed was faster than the over-square engine.
In particular, the combustion speed of initial combustion was faster because the difference in CA10 was apparent. The cause of the difference in combustion speed could be largely divided into flame propagation and turbulence intensity according to the combustion chamber shape. In the case of flame propagation, differences could be seen in the result of the area occupied by the flame surface at the instantaneous volume of the combustion chamber. In fact, in a previous study, the flame surface was compared according to the B/S ratio. In short stroke engines, the flame surface area vs. momentary volume results were high only up to about 20% of the total volume of the combustion chamber, whereas in long stroke engines, the area occupied by the flame surface in the instantaneous volume of the combustion chamber approaches 60%; this reduces the combustion duration. As a result, the flame propagation speed was faster because the flame surface area was larger in the long stroke engine. Therefore, the results of this study also show that the long stroke, under-square engine produced a shorter combustion time than an over-square engine [
5]. Next, when the turbulent intensity in the combustion chamber increased, flame propagation proceeded rapidly, resulting in a shorter combustion duration. Turbulence intensity in gasoline engines had a great influence on combustion. As the turbulence intensity increased, the flame propagation speed increased. The turbulence intensity inside the combustion chamber changed according to the B/S ratio, and as the B/S ratio decreased, the turbulence intensity increased near the initial stage of the intake planet and TDC. This results in shorter combustion duration for under-square engines with a B/S ratio of 0.88.
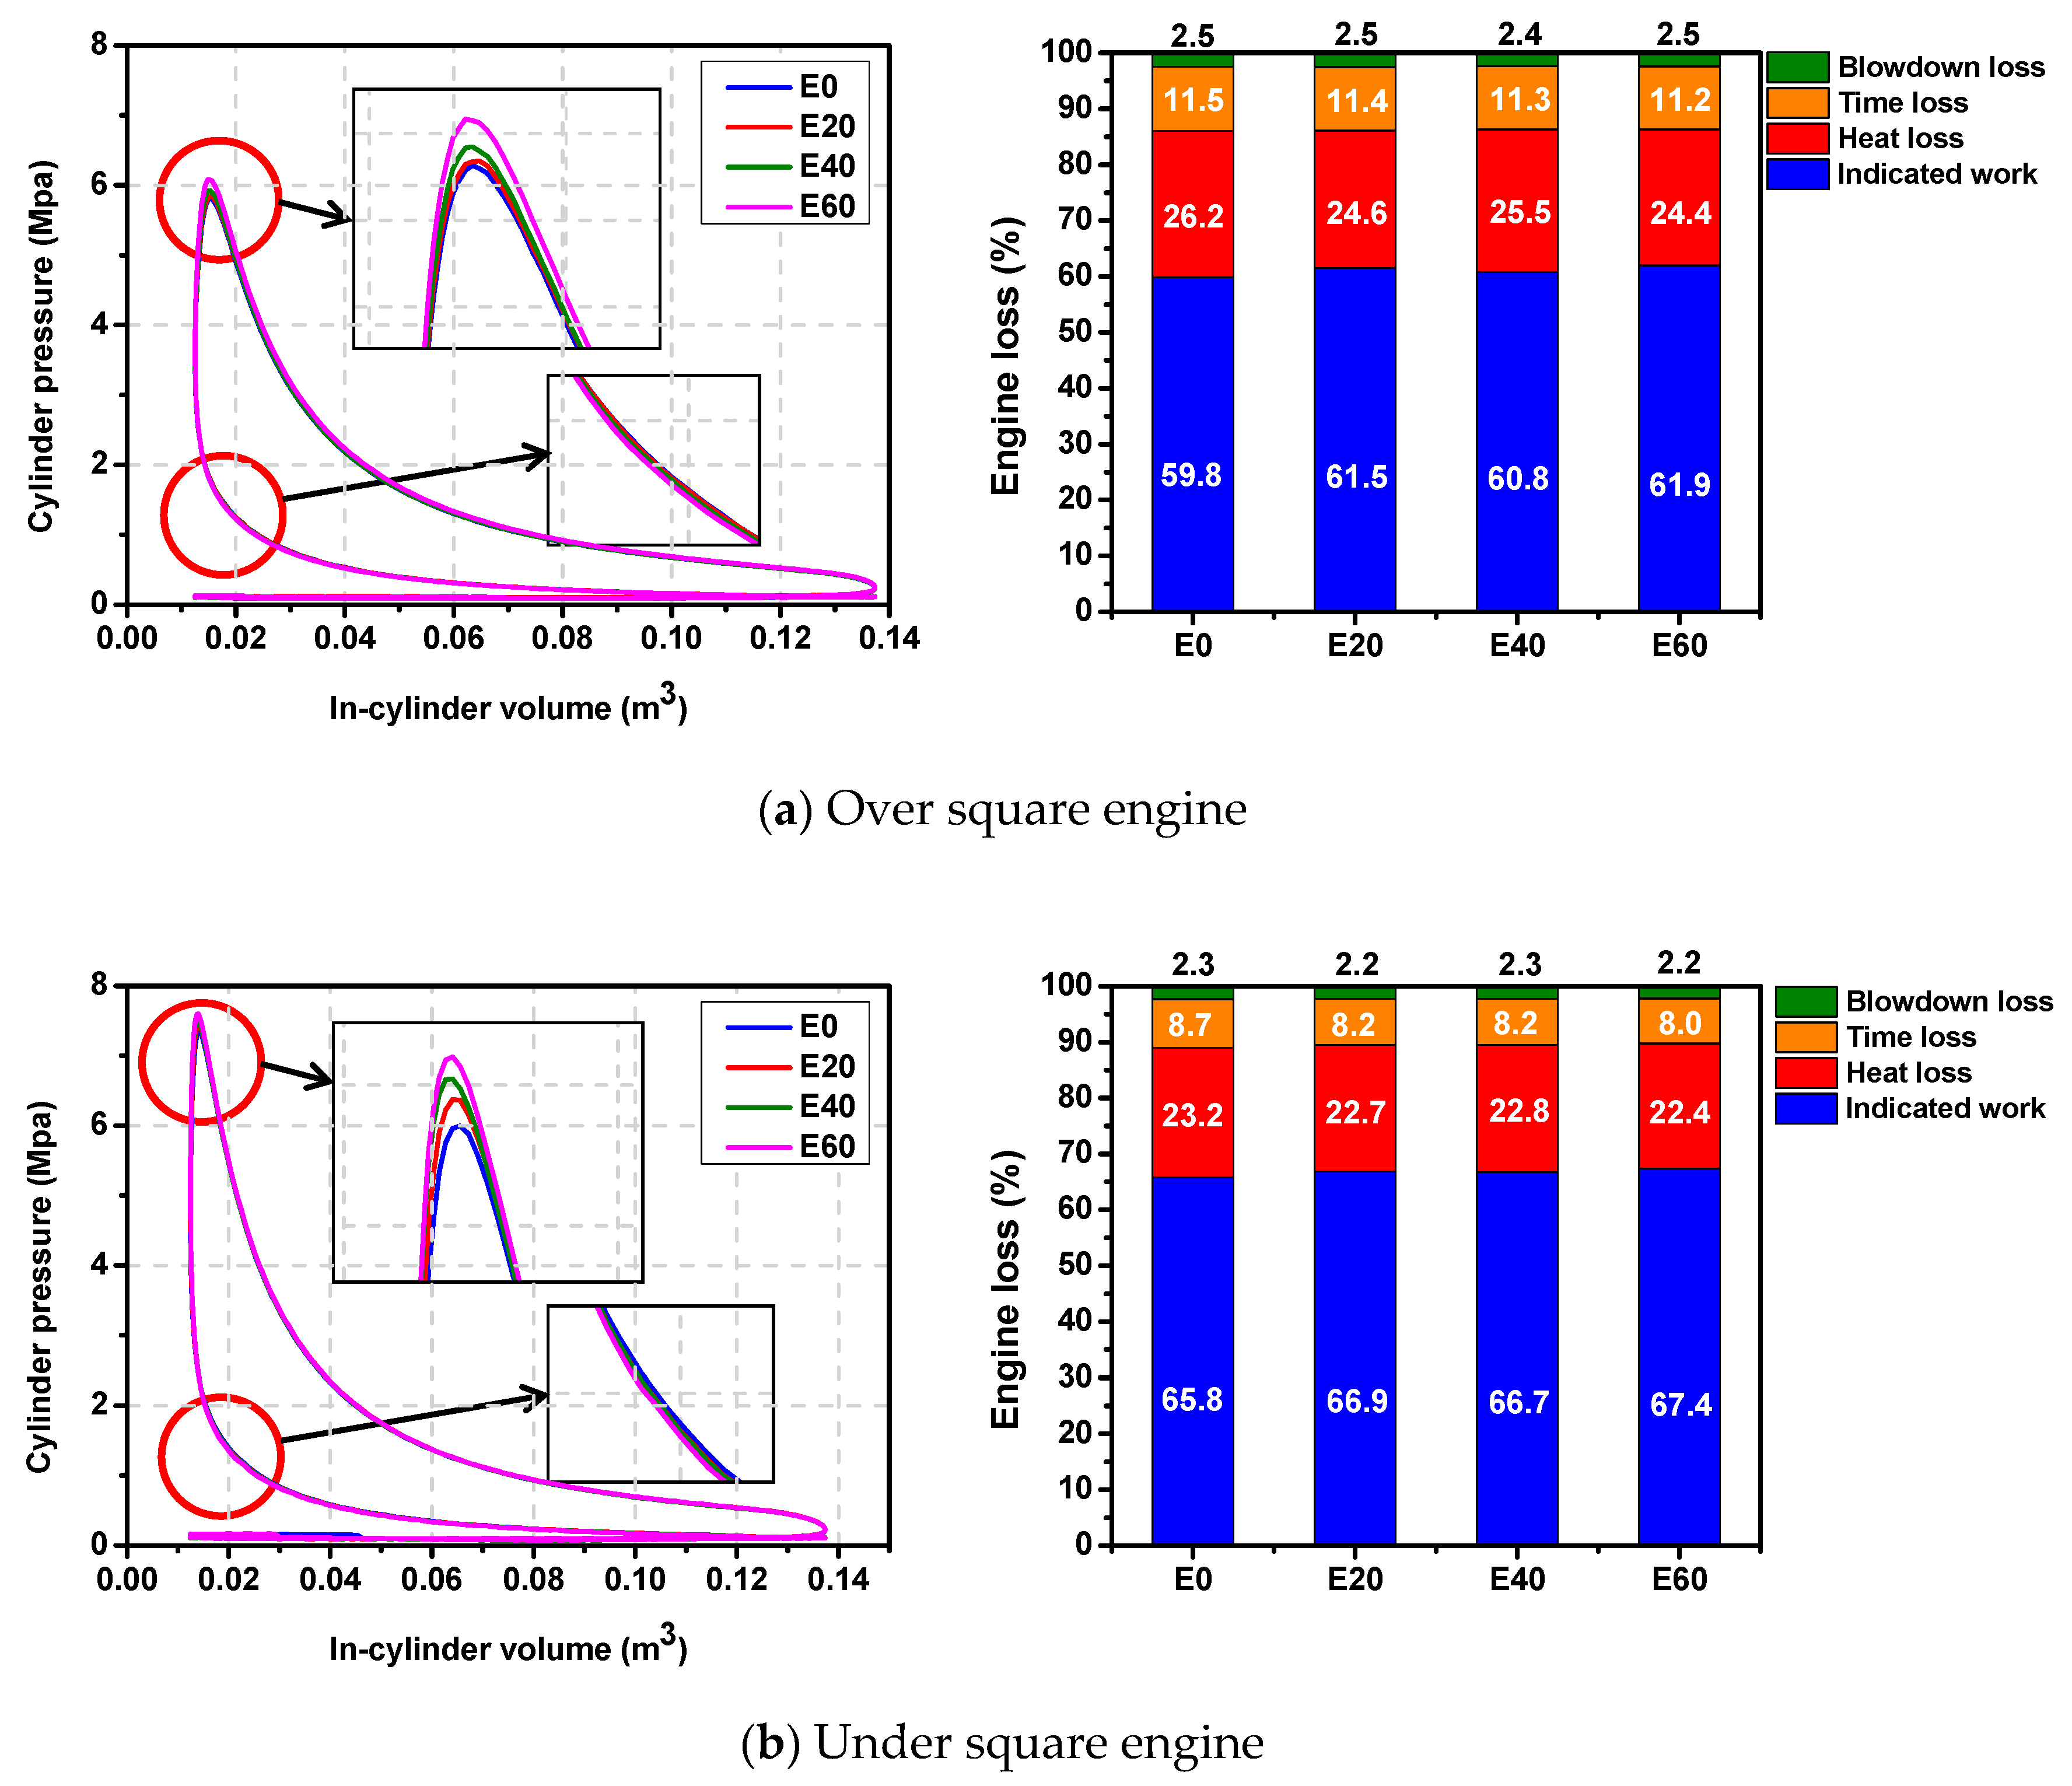
Figure 5 shows the pressure and volume (P–V) diagram for the B/S ratio and three different losses and indicated mean effective pressure (IMEP) compared to the ideal cycle. In general, it is judged that the loss of the engine is consumed in the range (energy conversation efficiency). In the case of IMEP, the result was about 50% including the pump loss. In addition, other studies have shown that the IMEP results are around 35–40% [
7]. The IMEP results of this study show a result between 60% and 70%, which was considered to have a high result because it did not include exhaust heat loss. In addition, the result of heat loss might be somewhat inaccurate because it was measured based on the pressure data, but the tendency of the loss result was reasonable and judged. From the minimal heat loss to combustion time loss and exhaust blowdown loss, the relative values for each loss are shown in
Figure 6. Heat losses via the cylinder wall during the second half of the compression stroke (during the combustion duration) and during the expansion stroke were 26.6% and 23.2%, followed by combustion losses of 11.6% and 8.7%, and finally, blowdown losses of 2.5% and 2.3%, respectively. The most significant factors in the heat losses observed were the flame propagation and combustion time mentioned above. Differences in flame propagation due to engine shape also affect heat transfer. In particular, when the bore and stroke size were changed, the timing and the contact area of the flame and the contact between the piston and the cylinder wall change—both of which affect heat transfer. In the case of long stroke engines, they have a relatively narrow bore and the piston is far from the spark plug, so that the flame surface first contacts the cylinder wall before contacting the piston. In short stroke engines, on the other hand, the flame first contacts the piston before the cylinder wall. This causes greater heat transfer to the piston tower. In the case of the cylinder wall, constant temperature control is possible through the coolant, but in the case of the piston tower, since no additional temperature control is performed, more heat transfer occurs and a large heat loss occurs. Next, in the case of the loss of combustion time, the burning time due to the flame propagation and turbulence intensity in the long stroke, under-square engine was reduced and the loss corresponding to this duration was reduced. Finally, the 2.5% blowdown losses were similar between models.
3.2. Effects of Ethanol Blend on Combustion Characteristics
Figure 7 shows the results of cylinder pressure and heat release according to ethanol content. According to the B/S ratio, combustion characteristics of 20% intervals from 0% to 60% of ethanol were compared. As can be seen from the results, as the ethanol blending ratio increased, the combustion pressure increased and the combustion duration shortened. This is because ethanol had higher oxygen content than gasoline, which results in more active combustion. Therefore, the combustion pressure was gradually increased and the initial combustion speed was fast.
Figure 8 and
Table 5 show the combustion duration results from CA10 to CA90 for over-square and under-square engines. As can be seen in
Table 5, the difference between the combustion speeds of the over and under square engines was largely about 4 degrees in CA 50, and the difference in combustion speed was about 2 degrees on average. This result seems to be due to the difference in the flame surface mentioned above. Both engines also have shorter combustion duration as ethanol blending rate increases. This is because the laminar flame propagation speed of ethanol is faster than that of gasoline. Noteworthy is that the flame propagation speed in the combustion chamber was not significantly affected by the turbulent flame propagation speed, but more so by the laminar flame propagation speed.
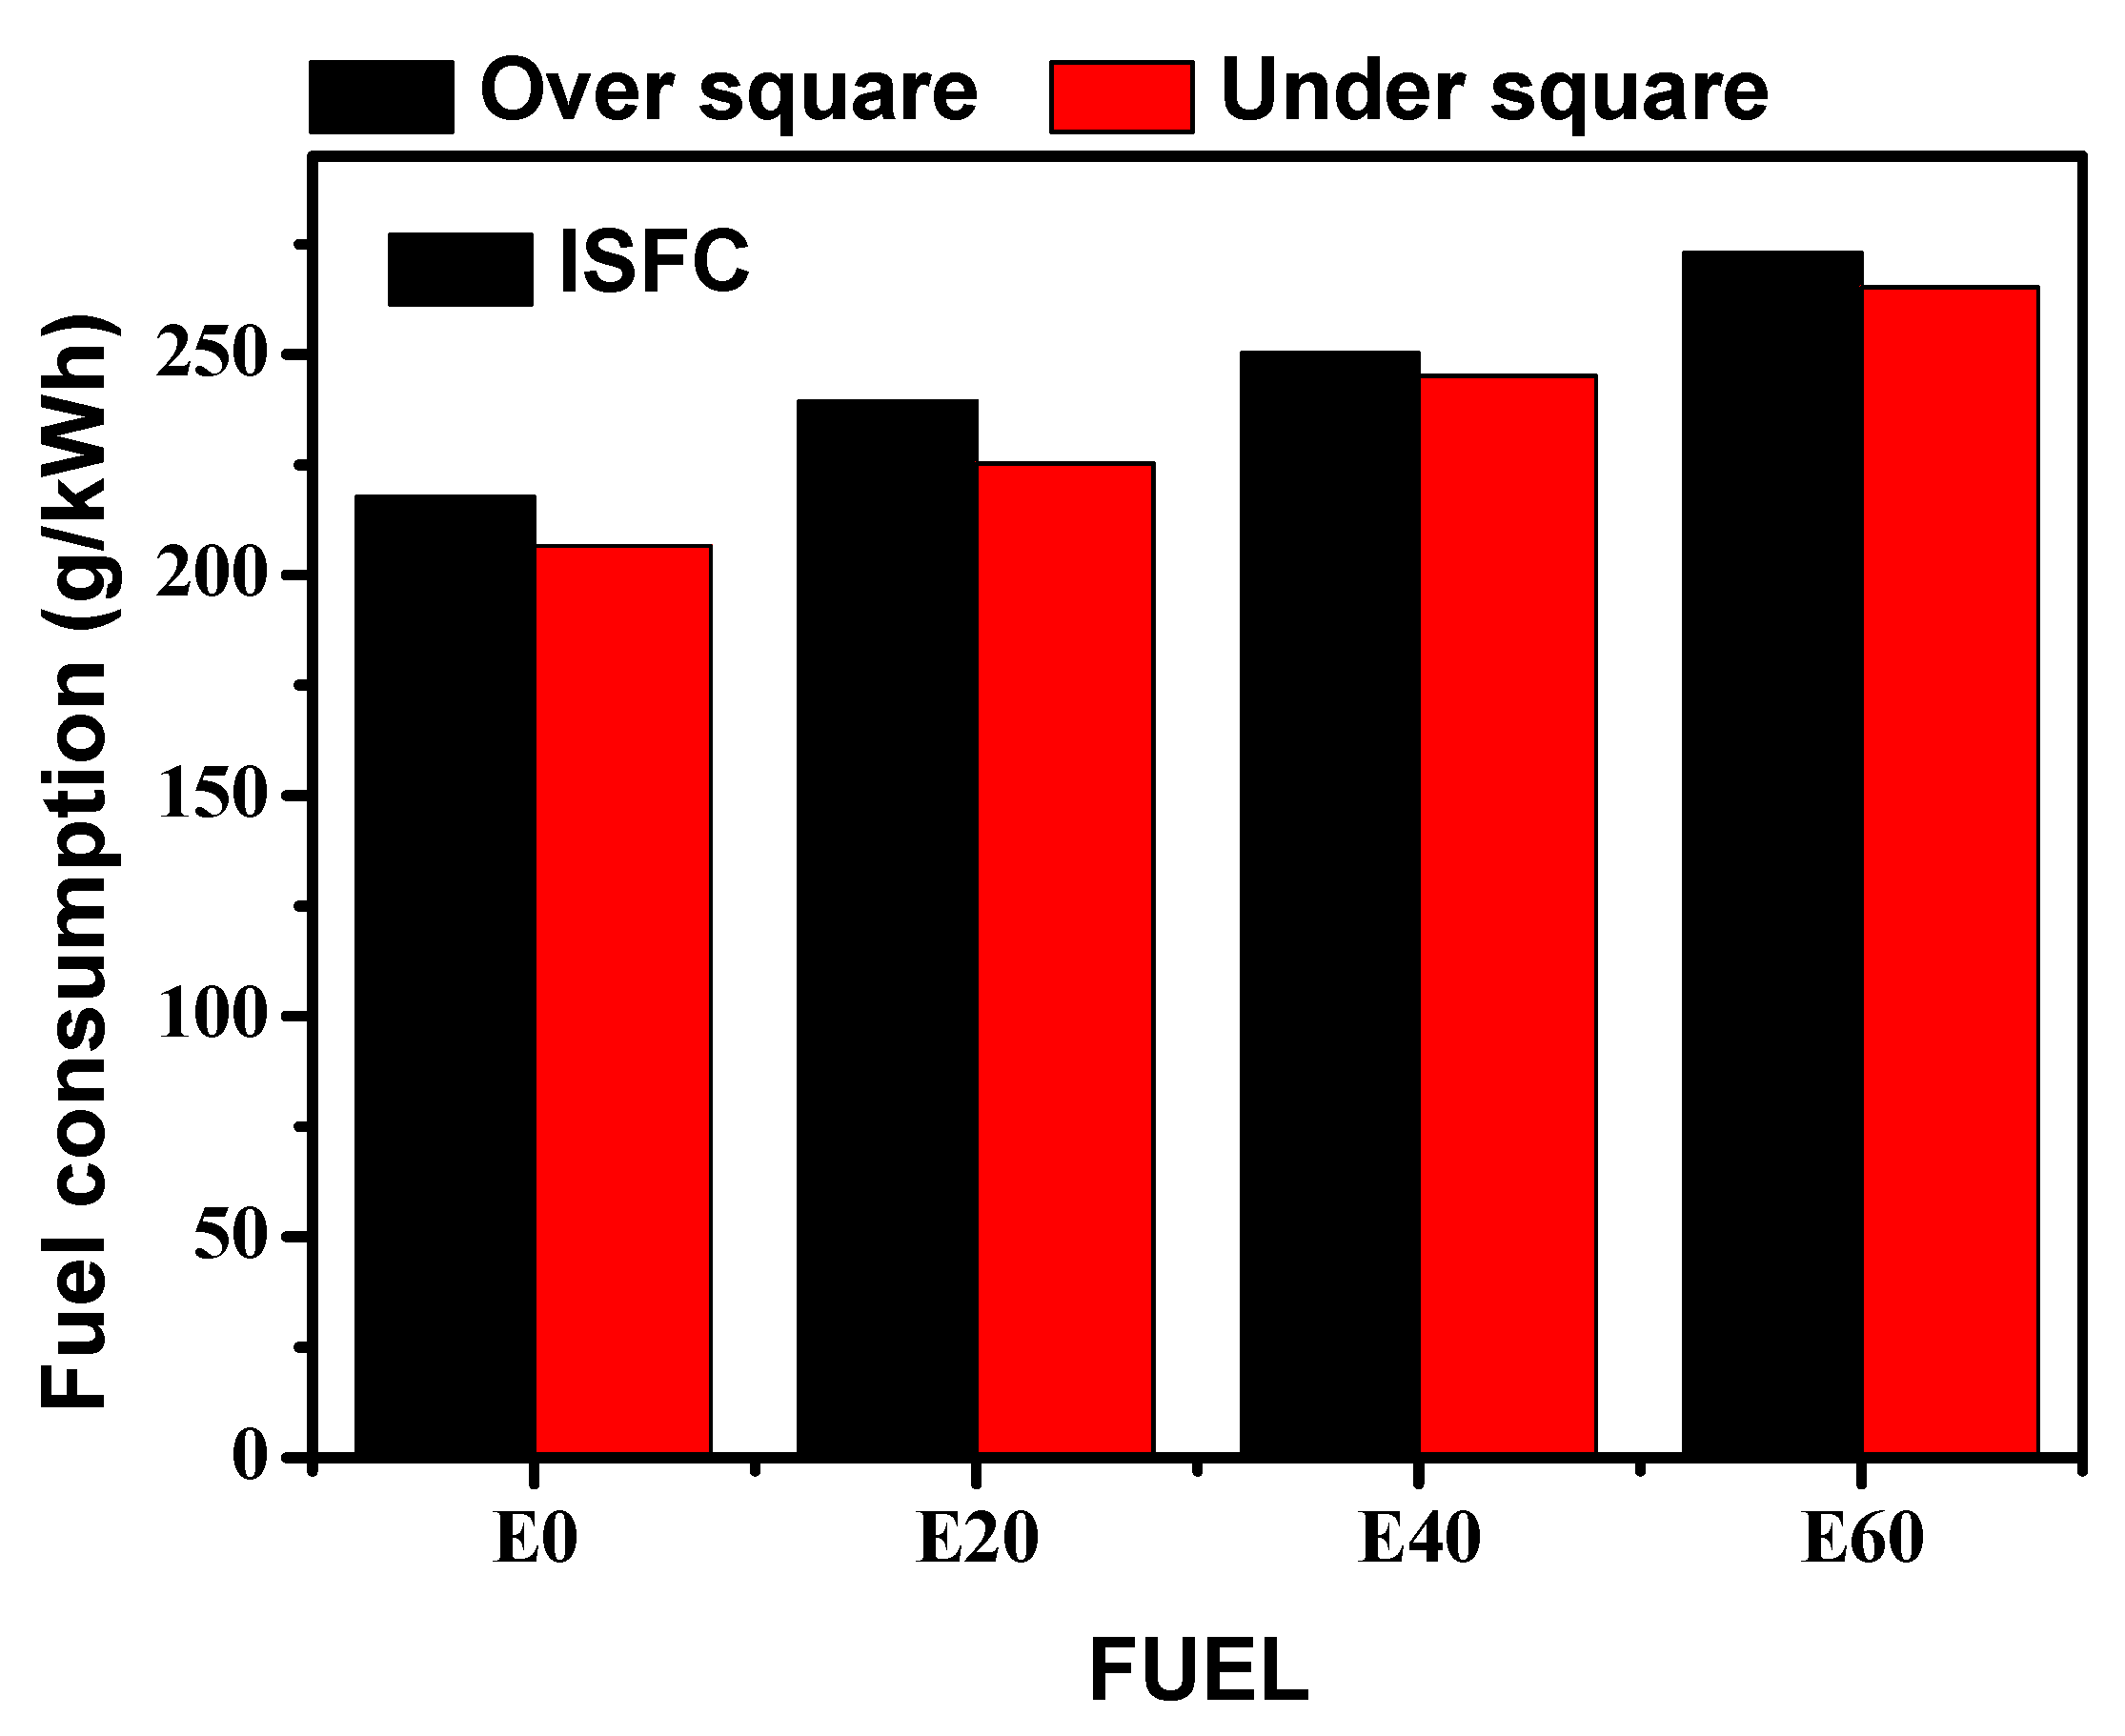
Figure 9 shows the P–V diagram according to ethanol content and shows the calculated losses under each condition. As the content of ethanol increased, the net loss of time indicated by the change of combustion time increased, and the net indicated work could be relatively increased. However, the results upon varying the ethanol content did not show much difference. As can be seen from these results, when ethanol was mixed with gasoline, the combustion characteristics of the engine were not significantly affected. However, ethanol fuel had a lower low calorific value than gasoline, so the difference in fuel consumption was large.
Figure 10 shows the results of fuel consumption compared to the same output according to B/S ratio and ethanol content.
Figure 11 shows the results of IMEP under each condition. First, the fuel consumption and IMEP results according to the B/S ratio could be confirmed by the high IMEP resulting in the relatively low-loss in under-square engines. As a result of increasing ethanol content, the IMEP also increased in both over-square and under-square engines. As shown in the combustion chamber internal pressure results and loss results, it was determined that the combustion speed was also increased. In the case of fuel consumption, the amount of fuel injected was increased due to the low heat value of ethanol.
3.3. Emissions of B/S Ratio and Ethanol Blend
In this session, we measured and compared the exhaust gas NOx and THC emissions from the two engines used in the experiment, and then analyzed the emission trends and concentrations by particle size via additionally measuring the particle number. For particulate matter, PPS-M and EEPS equipment were measured at the same time to compare the emission trends. In addition, analysis of gaseous and particulate matters released with increasing ethanol content was also conducted.
3.3.1. Gas Emissions
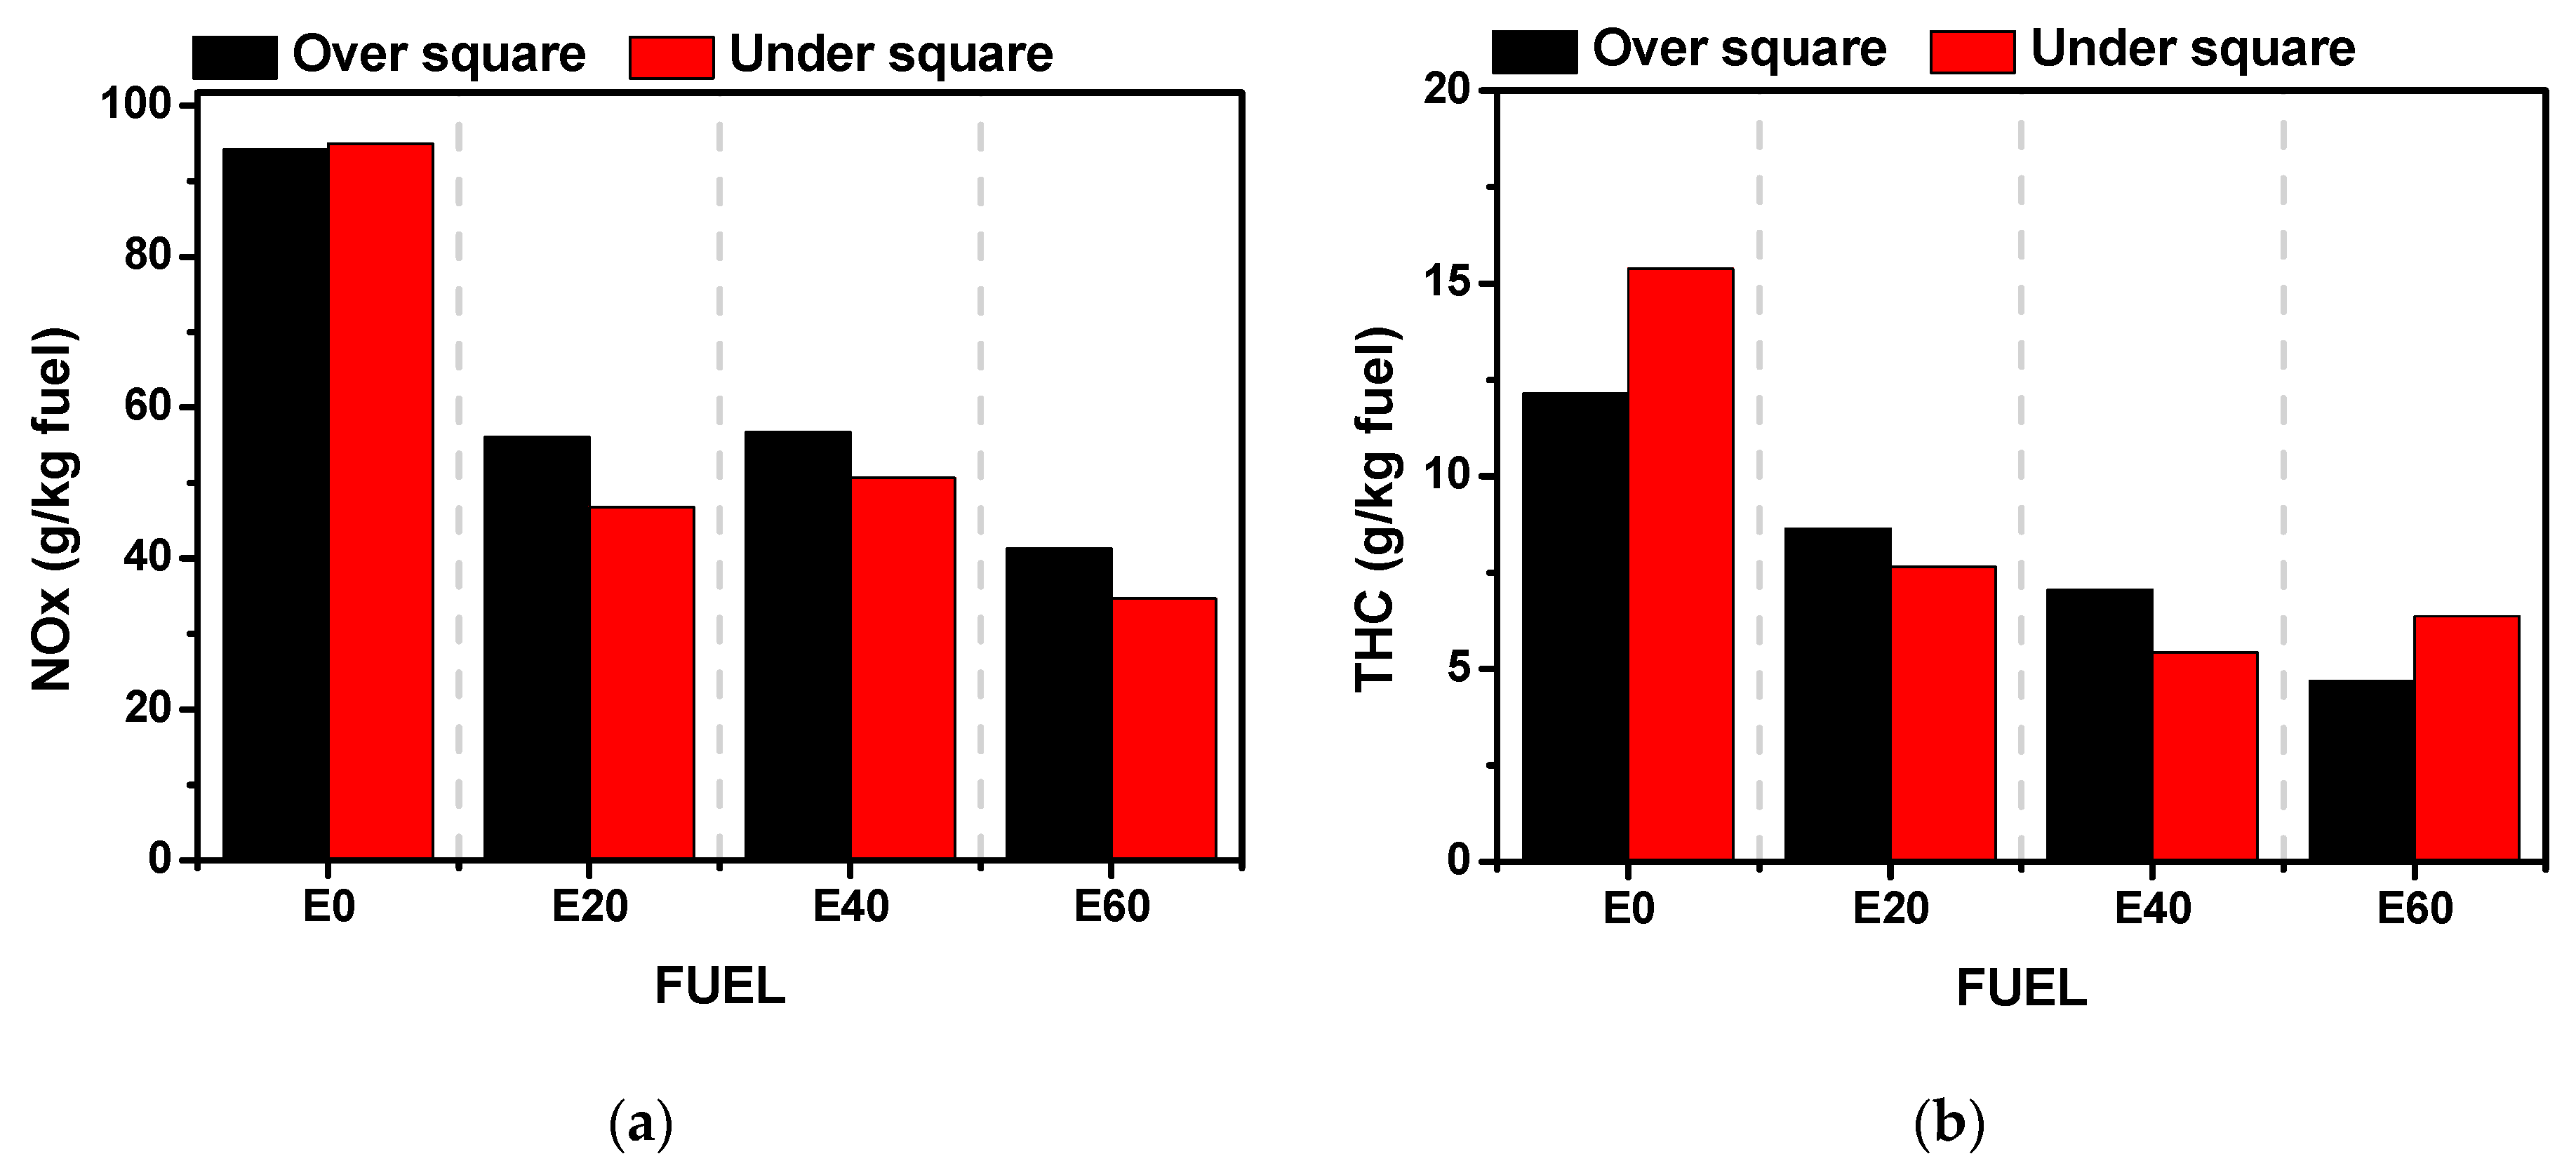
Figure 12 shows the results for NOx and THC emissions for each experimental condition. In the case of NOx, when only gasoline fuel was used, the emission from the over-square and under-square engines was similar. As the ethanol content was increased, NOx was reduced. Since the latent heat of evaporation of ethanol was higher than that of gasoline, this results in a cooling effect by lowering the ambient temperature at the time of combustion. It was found that the NOx emission results decreased as the ethanol content increased in both the over-square and under-square engines. In the case of under-square engine, as the intake valve seat was smaller than that of the over-square, the fuel injected into the port decreased and the amount of droplets flowing into the combustion chamber increased, thus increasing the latent heat of vaporization in the combustion chamber. This result was due to the effect of reducing the internal temperature, however, the difference was not significant. In the case of THC, another gaseous substance, its emission was reduced with increasing ethanol content. In the case of gasoline, which was basically a hydrocarbon paraffinic, and since ethanol contains oxygen, HC emission was estimated to be lower than 100% gasoline condition. On the other hand, THC emission results according to the B/S ratio did not show a big difference and appear to show similar levels of emission.
3.3.2. Particle Emissions
Finally,
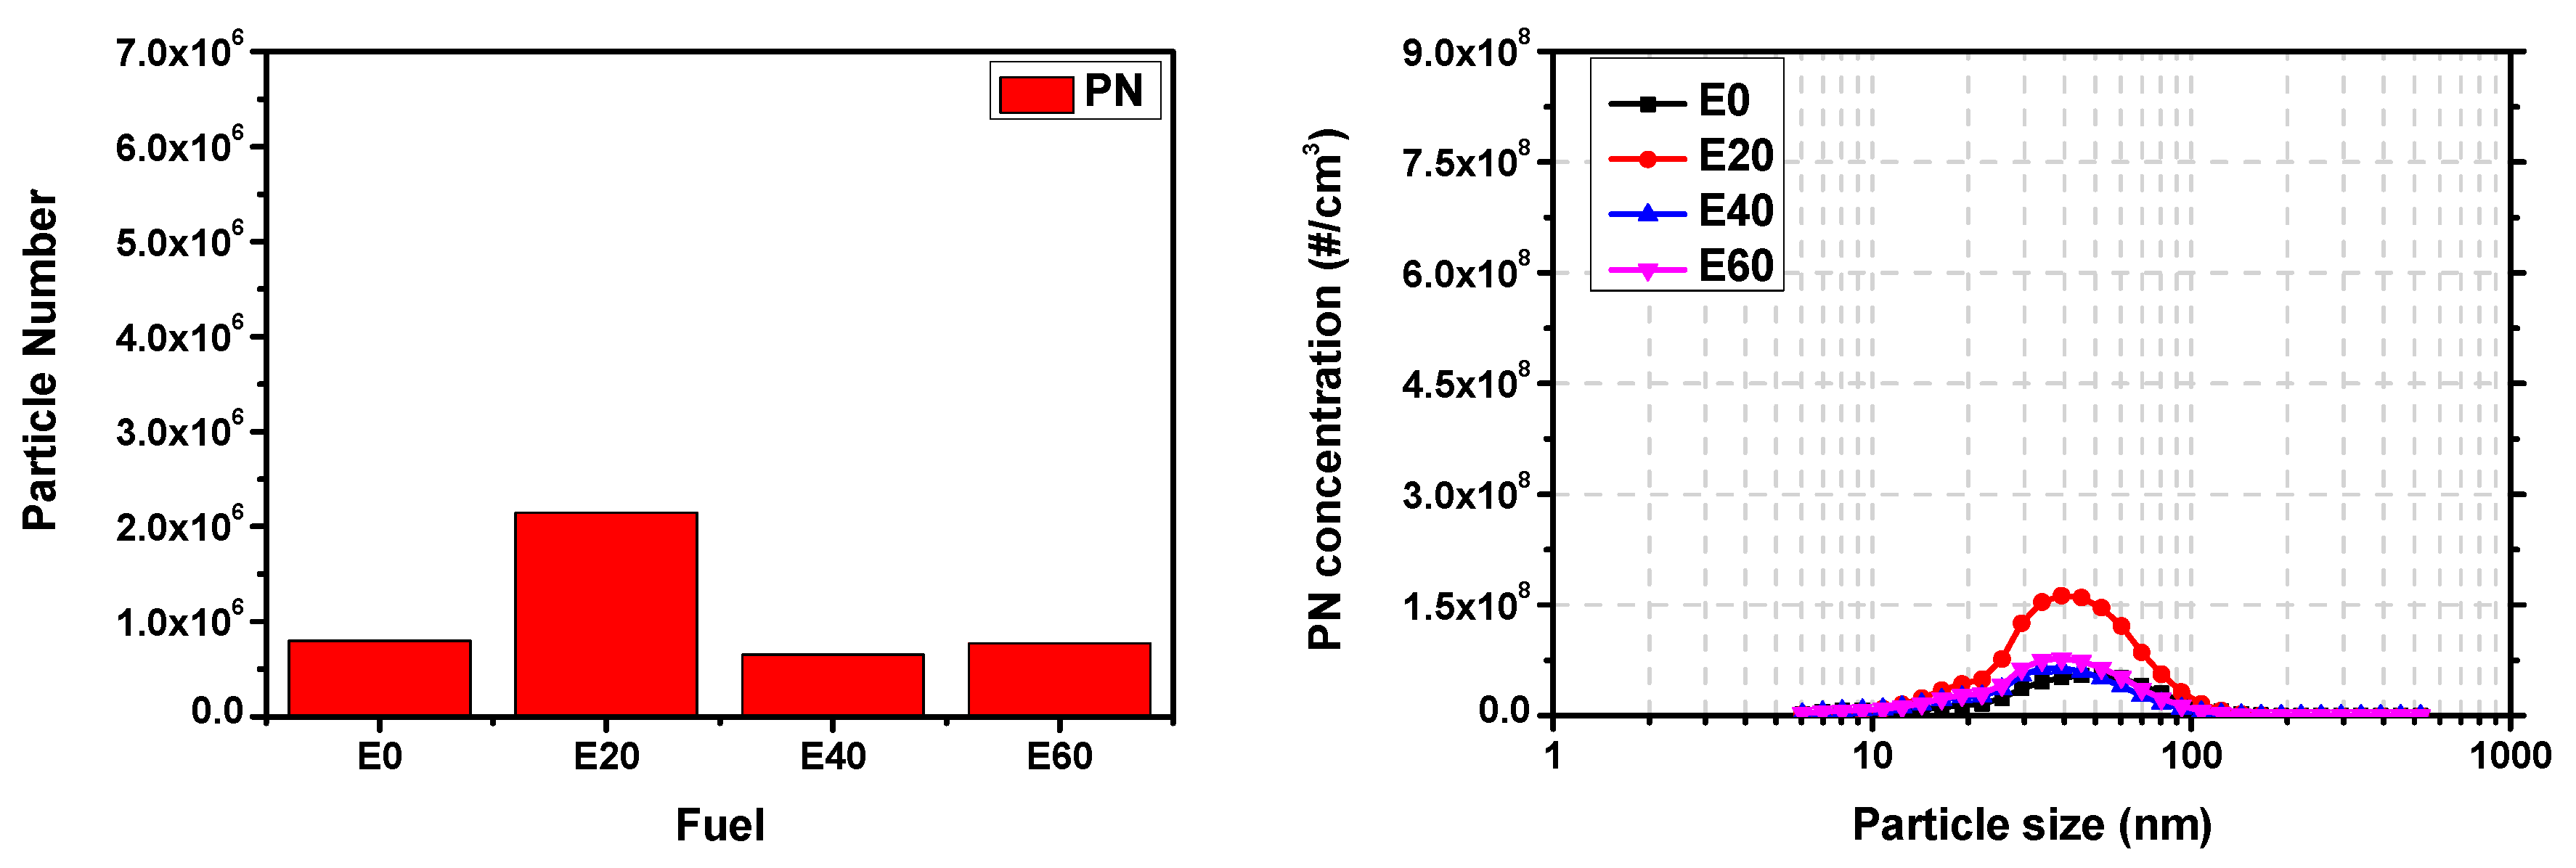
Figure 13 and
Figure 14 compare the particle numbers (PN) with increasing ethanol blending ratio in over- and under-square engines. In the case of PN measured in PPS-M, the average value of PN measured for certain duration of time was shown, and in the case of emission concentration by particle size, the cumulative result was shown at the same time.
First of all, the difference in results between the over-square and under-square engines was evident. Compared with the over-square engine, the PN emission was higher in the under-square engine, and the particle size of the emitted PN was larger in the under-square engine. In the case of the under-square, 100% gasoline yielded 80.58 nm and then decreased by about 60.43 nm upon increasing ethanol ratio. On the other hand, in the case of PN discharged from an over-square engine, 52.33 nm at 100% gasoline injection was observed and then decreased by about 33.98 nm upon increasing ethanol ratio. As such, there is a difference in PN emission results depending on the B/S ratio. This might be due to the fuel injection method of the PFI engine. Fuel was injected into the port due to the characteristics of the PFI engine. However, if the intake port and valve seat do not have enough heat to vaporize all the fuel, or if there is not enough time for the fuel to evaporate, droplets of fuel are introduced into the combustion chamber. The inflow of droplets causes incomplete combustion, which causes PN emissions [
20]. Particularly, the under-square engine emits more PN than the over-square engine, because the size of the intake valve must decrease as the bore size decreases. It is judged that the heat for vaporizing fuel decreases in the interior of the combustion chamber. In addition, as the droplet size is larger than that of the conventional engine, the particle size of the PN appeared to be larger than that of the PN emitted from the over-square engine.
The PN results with the ethanol blending ratio indicate that the PN emission was reduced as the ethanol blending ratio increased. Over square engine shows low PN results except for the E20 condition. Ethanol is a fuel having a high latent heat of vaporization and oxygen content, and the latent heat of evaporation adversely affected PN emission because it relatively cooled the ambient temperature. On the contrary, the oxygen content had a great effect on reducing the PN emission since the combustion reaction was actively progressed. Under the E20 condition, the effect of high latent heat of evaporation of ethanol was expressed more, and the atomization was lowered due to the cooling effect in the port, resulting in increased PN emission. However, after the E20 condition, the oxygen content was greatly increased, which was considered to decrease the PN again. Under square engines, on the other hand, tended to decrease with increasing ethanol content. This was because the oxygen content of the fuel increased as the ethanol content increased, so that combustion inside the cylinder was more active and incomplete combustion decreased [
22,
23]. The particle also had a close relation to the polycyclic aromatic hydrocarbons (PAHs), and the addition of alcohol to gasoline decreases the aromatic content in blend fuels [
24,
25]. Finally, in the case of the under square engine, PN increased by the small heat capacity of the intake valve and the fuel wetting on the wall of the cylinder due to and the bore size was reduced. Since these have a direct effect on PN emissions, it is believed that PN emissions are the main cause of decrease as the ethanol blending ratio increases.
4. Conclusions
In this study, the main focus was placed on improving the combustion characteristics and particulate matter emission characteristics of PFI system small gasoline engines. To analyze combustion and exhaust characteristics for engine combustion chamber shape, two engines with the same volume but different bore and stroke ratios (1.1 and 0.88) were compared and analyzed. Additionally, we analyzed the efficiency on engine performance by mixing with ethanol and gasoline, which are alternative fuels for reducing engine exhaust gas. In addition, emission analyses were conducted for particle emissions not regulated in the PFI engine. The following are the summary and conclusions of this study:
The combustion pressure in the combustion chamber was measured as higher in the long stroke (0.88 B/S ratio) engine compared to the short stoke (1.15 B/S ratio) engine. This was influenced by flame propagation and turbulent flow in the combustion chamber. Due to this combustion speed difference, the time loss in the long stroke engine was reduced and the engine indicated a greater mean effective pressure.
Increasing the mixing ratio of ethanol to gasoline fuel increased the combustion pressure and combustion speed of the engine, which was considered to be the result of the laminar flame propagation speed of ethanol being faster than that of gasoline. As a result, engine performance was improved, but fuel consumption was increased due to the low heating value of ethanol.
In the case of NOx emission, the effect of B/S ratio was not large, but when ethanol was present, NOx was reduced. This is because ethanol, which had a higher latent heat of vaporization than gasoline, increased the cooling effect in the combustion chamber. This results in lower combustion temperatures and lower NOx emissions. In the case of THC, since ethanol contained less hydrocarbons and more oxygen than gasoline, the THC decreased as the ethanol mixing ratio increases.
Finally, PN emissions were greatly affected by engine geometry. For engines with a B/S ratio of 1.1, the heat from the intake port was greater than that of the 0.88 B/S ratio engine, because the engine head and intake valve were larger in the former. This caused an evaporation difference of the injected fuel due to the characteristics of the PFI engine injecting the fuel into the intake port, causing a difference in the liquid film generated in the port and the valve. Subsequently, more PN emissions were observed from the 0.88 B/S ratio engine. In addition, depending on the ethanol mixing ratio, the PN content and sizes were reduced.
Author Contributions
Conceptualization, J.J. and S.P.; Data measurement J.J. and H.Y.; Experimental setup, H.Y.; Analyze data, J.J. and J.C.; Investigation, J.C. and H.Y.; Writing—original draft prepration, J.J.; Writing—review and editing, J.J. and H.Y.; Data post-processing programming, J.C. and J.J.; Supervision, S.P.; Project administration, S.P.; Funding acquisition, S.P.; All authors have read and agreed to the published version of the manuscript.
Funding
This research was supported by the CEFV (Center for Environmentally Friendly Vehicle) as Global-Top Project of KMOE (Ministry of Environment, Korea) (No. 2016002070010).
Acknowledgments
This research was supported by the CEFV (Center for Environmentally Friendly Vehicle) as Global-Top Project of KMOE (Ministry of Environment, Korea) (No. 2016002070010) and the research fund of Hanyang University (HY-2019).
Conflicts of Interest
The authors declare no conflict of interest.
Abbreviations
| PFI | Port Fuel Injection |
| GDI | Gasoline Direct Injection |
| HRR | Heat Release Rate |
| SOI | Start of Injection |
| EOI | End of Injection |
| IMEP | Indicated Mean Efficiency Pressure |
| PN | Particle Number |
| WOT | Wide Open Throttle |
| EEPS | Engine Exhaust Particle Sizer |
| TDC | Top Dead Center |
References
- Vuilleumier, D.; Sjöberg, M. Significance of RON, MON, and LTHR for Knock Limits of Compositionally Dissimilar Gasoline Fuels in a DISI Engine. SAE Int. J. Engines 2017, 10, 938–950. [Google Scholar] [CrossRef]
- Kim, N.; Kim, J.; Ko, I.; Choi, H.; Min, K. A Study on the Refinement of Turbulence Intensity Prediction for the Estimation of In-Cylinder Pressure in a Spark-Ignited Engine; 2017-01-0525; SAE Technical Paper: Warrendale, PA, USA, 2017. [Google Scholar] [CrossRef]
- Kolodziej, C.P.; Pamminger, M.; Sevik, J.; Wallner, T.; Wagnon, S.W.; Pitz, W.J. Effects of Fuel Laminar Flame Speed Compared to Engine Tumble Ratio, Ignition Energy, and Injection Strategy on Lean and EGR Dilute Spark Ignition Combustion. SAE Int. J. Fuels Lubr. 2017, 10, 82–94. [Google Scholar] [CrossRef]
- Anderson, M.K.; Assanis, D.N.; Filipi, Z. First and Second Law Analyses of a Naturally-Aspirated, Miller Cycle. SI Engine with Late Intake Valve Closure; 980889; SAE Technical Paper: Warrendale, PA, USA, 1998. [Google Scholar] [CrossRef]
- Filipi, Z.S.; Assanis, D.N. The effect of the stroke-to-bore ratio on combustion, heat transfer and efficiency of a homogeneous charge spark ignition engine of given displacement. Int. J. Engine Res. 2000, 1, 191. [Google Scholar] [CrossRef]
- Bianchi, G.M.; Cantore, G.; Mattarelli, E.; Guerrini, G.; Papetti, F. The Influence of Stroke-to-Bore Ratio and Combustion Chamber Design on Formula One Engines Performance; 980126; SAE Technical Paper: Warrendale, PA, USA, 1998. [Google Scholar] [CrossRef]
- Cho, S.; Oh, S.; Song, C.; Shin, W.; Song, S.; Song, H.H.; Min, K.; Lee, B.; Jung, D.; Woo, S.H. Effects of Bore-to-Stroke Ratio on the Efficiency and Knock Characteristics in a Single-Cylinder GDI Engine; 2019-01-1138; SAE Technical Paper: Warrendale, PA, USA, 2019. [Google Scholar] [CrossRef]
- Ikeya, K.; Takazawa, M.; Yamada, T.; Park, S.; Tagishi, R. Thermal Efficiency Enhancement of a Gasoline Engine. SAE Int. J. Engines 2015, 8, 1579–1586. [Google Scholar] [CrossRef]
- Hoag, K.L.; Mangold, B.; Alger, T.; Abidin, Z.; Wray, C.; Walls, M.; Chadwell, C. A Study Isolating the Effect of Bore-to-Stroke Ratio on Gasoline Engine Combustion Chamber Development. SAE Int. J. Engines 2016, 9, 2022–2029. [Google Scholar] [CrossRef]
- Thangavelu, S.K.; Ahmed, A.S.; Ani, F.N. Review on Bioethanol as Alternative Fuel for Spark Ignition Engines. Renew. Sustain. Energy Rev. 2016, 56, 820–835. [Google Scholar] [CrossRef]
- Wanga, C.; Zeraati-Rezaei, S.; Xiang, L.; Xu, H. Ethanol blends in spark ignition engines: RON, octaneadded value, cooling effect, compression ratio, and potential engine efficiency gain. Appl. Energy 2017, 191, 603–619. [Google Scholar] [CrossRef]
- Chan, T.W.; Meloche, E.; Kubsh, J.; Brezny, R. Black carbon emissions in gasoline exhaust and a reduction alternative with a gasoline particulate filter. Environ. Sci. Technol. 2014, 48, 6027–6034. [Google Scholar] [CrossRef] [PubMed]
- Bonatesta, F.; Chiappetta, E.; La Rocca, A. Part-load particulate matter froma GDI engine and the connection with combustion characteristics. Appl. Energy 2014, 124, 366–376. [Google Scholar] [CrossRef]
- Brehob, D.D.; Fleming, J.E.; Haghgooie, M.; Stein, R.A. Stratified-Charge Engine Fuel Economy and Emission Characteristics; SAE International: Warrendale, PA, USA, 1988. [Google Scholar]
- Zhao, F.; Lai, M.C.; Harrington, D.L. Automotive spark-ignited direct-injection gasoline engines. Prog. Energy Combust. Sci. 1999, 25, 437–562. [Google Scholar] [CrossRef]
- Brugge, D.; Durant, J.L.; Rioux, C. Near-highway pollutants inmotor vehicle exhaust: A review of epidemiologic evidence of cardiac and pulmonary health risks. Environ. Health 2007, 6, 23. [Google Scholar] [CrossRef]
- Künzli, N.; Kaiser, R.; Medina, S.; Studnicka, M.; Chanel, O.; Filliger, P.; Herry, M.; Horak, F., Jr.; Puybonnieux-Texier, V.; Quénel, P.; et al. Public-health impact of outdoor and traffic-related air pollution: A European assessment. Lancet 2000, 356, 795–801. [Google Scholar] [CrossRef]
- He, X.; Ratcliff, M.A.; Zigler, B.T. Effects of gasoline direct injection engine operating parameters on particle number emissions. Energy Fuel 2012, 26, 2014–2027. [Google Scholar] [CrossRef]
- Barone, T.L.; Storey, J.M.E.; Youngquist, A.D.; Szybist, J.P. An analysis of directinjection spark-ignition (DISI) soot morphology. Atmos. Environ. 2012, 49, 268–274. [Google Scholar] [CrossRef]
- Catapano, F.; Di Iorio, S.; Sementa, P.; Vaglieco, B. Characterization of Ethanol-Gasoline Blends Combustion processes and Particle Emissions in a GDI/PFI Small Engine; 2014-01-1382; SAE Technical Paper: Warrendale, PA, USA, 2014. [Google Scholar] [CrossRef]
- Wahono, B.; Putrasari, Y.; Lim, O. A study on in-cylinder flow field of a 125cc motorcycle engine at low engine speeds. J. Mech. Sci. Technol. 2019, 33, 4477–4494. [Google Scholar] [CrossRef]
- Di Iorio, S.; Lazzaro, M.; Sementa, P.; Vaglieco, B.; Catapano, F. Particle Size Distributions from a DI High Performance SI Engine Fuelled with Gasoline-Ethanol Blended Fuels; 2011-24-0211; SAE Technical Paper: Warrendale, PA, USA, 2011. [Google Scholar] [CrossRef]
- Chen, L.; Stone, R.; Richardson, D. Effect of the valve timing and the coolant temperature on particulate emissions from a gasoline diect-injection engine fueled with gasoline and with a gasoline-ethanol blend. Proc. Inst. Mech. Eng. Part D J. Automob. Eng. 2012, 226, 1419. [Google Scholar] [CrossRef]
- Esarte, C.; Abián, M.; Millera, Á.; Bilbao, R.; Alzueta, M.U. Gas and soot products formed in the pyrolysis of acetylene mixed with methanol, ethanol, isopropanol or n-butanol. Energy 2012, 43, 37–46. [Google Scholar] [CrossRef]
- Zhang, Z.; Wang, T.; Jia, M.; Wei, Q.; Meng, X.; Shu, G. Combustion and particle number emissions of a direct injection spark ignition engine operating on ethanol/gasoline and n-butanol/gasoline blends with exhaust gas recirculation. Fuel 2014, 130, 177–188. [Google Scholar] [CrossRef]
Figure 1.
Schematic diagram of the engine test system.
Figure 1.
Schematic diagram of the engine test system.
Figure 2.
Motoring pressure for over- and under-square engines.
Figure 2.
Motoring pressure for over- and under-square engines.
Figure 3.
In-cylinder pressure and heat release rates for over- and under-square engines.
Figure 3.
In-cylinder pressure and heat release rates for over- and under-square engines.
Figure 4.
Integrated heat release and combustion duration for over- and under-square engines.
Figure 4.
Integrated heat release and combustion duration for over- and under-square engines.
Figure 5.
The P–V diagram for over- and under-square engines compared to the ideal cycle.
Figure 5.
The P–V diagram for over- and under-square engines compared to the ideal cycle.
Figure 6.
Three difference engine losses and indicated work for over- and under-square engines.
Figure 6.
Three difference engine losses and indicated work for over- and under-square engines.
Figure 7.
In-cylinder pressure and heat release rate for over- and under-square engine vs. ethanol blending ratio.
Figure 7.
In-cylinder pressure and heat release rate for over- and under-square engine vs. ethanol blending ratio.
Figure 8.
Combustion duration for over- and under-square engine as ethanol blending ratio.
Figure 8.
Combustion duration for over- and under-square engine as ethanol blending ratio.
Figure 9.
The P–V diagram and three engine losses for over and under square engines and ethanol blending ratio.
Figure 9.
The P–V diagram and three engine losses for over and under square engines and ethanol blending ratio.
Figure 10.
Fuel consumption for over- and under-square engine and ethanol blending ratio.
Figure 10.
Fuel consumption for over- and under-square engine and ethanol blending ratio.
Figure 11.
Indicated mean effective pressure (IMEP) and coefficient of variation (COV) for over- and under-square engine and ethanol blending ratio.
Figure 11.
Indicated mean effective pressure (IMEP) and coefficient of variation (COV) for over- and under-square engine and ethanol blending ratio.
Figure 12.
(a) NOx and (b) THC emissions for over- and under-square engine vs. ethanol blending ratio.
Figure 12.
(a) NOx and (b) THC emissions for over- and under-square engine vs. ethanol blending ratio.
Figure 13.
Particle number and size distribution for ethanol blending ratio in over-square engine.
Figure 13.
Particle number and size distribution for ethanol blending ratio in over-square engine.
Figure 14.
Particle number and size distribution for ethanol blending ratio in under-square engine.
Figure 14.
Particle number and size distribution for ethanol blending ratio in under-square engine.
Table 1.
Specifications of the test engines.
Table 1.
Specifications of the test engines.
| Specifications | Over Square | Under Square |
|---|
| Engine displacement (cc) | 125 |
| B/S ratio | 1.15 | 0.88 |
| Bore (mm) | 56 | 52 |
| Stroke (mm) | 50.7 | 58.8 |
| Connecting rod length (mm) | 90 | 100 |
| Compression ratio | 11.4 | 11 |
| Intake valve opens | CAD | BTDC 362 | BTDC 367 |
| Intake valve closes | BTDC 143 | BTDC 148 |
| Exhaust valve opens | ATDC 148 | ATDC 142 |
| Exhaust valve closes | ATDC 354 | ATDC 351 |
Table 2.
Test fuel properties.
Table 2.
Test fuel properties.
| Main Properties of Gasoline and Ethanol |
|---|
| Properties | Gasoline | Ethanol |
|---|
| Chemical Formula | C5–C11 | C2H5OH |
| Density @ 15 °C (kg/m3) | 46.3 | 131.3 |
| Research Octane Number | 95 | 108 |
| Lower Heating Value (MJ/kg) | 42.5 | 26.9 |
| Latent Heat of Vaporization (kJ/kg) | 305 | 840 |
| Stoichiometric Air to Fuel Ratio | 14.7 | 8.95 |
| O2 Content (%) | - | 34 |
Table 3.
Specifications of the gas and particle emissions measurement devices.
Table 3.
Specifications of the gas and particle emissions measurement devices.
| Emission Measurement Device | Item | Description |
|---|
| MEXA-9100 (THC) | Measurement principle | Flame Ionization Detector (FID) |
| Measuring range | 10–50,000 ppm |
| Linearity | ±1.0% of full scale |
| Response | ±1.0% of full scale |
| MEXA-9100 (NOx) | Measurement principle | Chemiluminescence method |
| Measuring range | 0.00–10,000 ppm |
| Linearity | ±1.0% of full scale |
| Response | ±1.0% of full scale |
| PPS-M (PN) | Measurement principle | Measurement of electrical charge |
| Measuring range | 1 μg/m3–250 mg/m3 |
| Detectable particle size | Min: 23 nm |
| Max: 2.5 μm |
| Response time | 0.2s (10Hz data acquisition) |
| EEPS (PN distribution) | Measurement principle | Measurement of electrical charge |
| Measuring range | 5.6–560 nm |
| Concentration range | 104–109 #/cm3 |
| Inlet cyclone 50% cut point | 1 μm |
| Response | 0.1–60 s |
Table 4.
Fuel properties and start of injection (SOI) for ethanol blending ratio.
Table 4.
Fuel properties and start of injection (SOI) for ethanol blending ratio.
| Fuel Properties | E0 (G100) | E20 (G80) | E40 (G60) | E60 (G40) |
|---|
| Ethanol (%) | 0 | 20 | 40 | 60 |
| H/C ratio | 1.99 | 2.13 | 2.29 | 2.48 |
| LHV_mixture (MJ/kg) | 43.4 | 39.9 | 36.6 | 33.3 |
| Heat of vaporization (kJ/kg) | 305 | 414 | 523 | 630 |
| SOI (bTDC deg.) | 60 | 78 | 93 | 117 |
Table 5.
Crank angle of combustion duration for over- and under-square engine as ethanol blending ratio.
Table 5.
Crank angle of combustion duration for over- and under-square engine as ethanol blending ratio.
| Over Square | CA10 | CA30 | CA50 | CA90 |
| E0 (G100) | −4.58 | 3.45 | 8.61 | 23.78 |
| E20 (G80) | −4.59 | 3.39 | 8.54 | 23.16 |
| E40 (G60) | −5.22 | 2.89 | 8.12 | 23.09 |
| E60 (G40) | −5.45 | 2.56 | 7.69 | 22.59 |
| Under Square | CA10 | CA30 | CA50 | CA90 |
| E0 (G100) | −7.19 | −0.07 | 4.43 | 21.78 |
| E20 (G80) | −7.83 | −0.49 | 4.07 | 21.06 |
| E40 (G60) | −8.29 | −1.18 | 3.26 | 21.24 |
| E60 (G40) | −8.25 | −1.06 | 3.35 | 20.35 |
© 2020 by the authors. Licensee MDPI, Basel, Switzerland. This article is an open access article distributed under the terms and conditions of the Creative Commons Attribution (CC BY) license (http://creativecommons.org/licenses/by/4.0/).


