Article

Detailed Energy Accounting of Electrical Submersible Pumping Systems

Program in Systems Engineering, Walter Scott Jr. College of Engineering, Colorado State University, Fort Collins, CO 80523-1301, USA
*
Author to whom correspondence should be addressed.
Energies 2020, 13(2), 302; https://doi.org/10.3390/en13020302
Submission received: 7 June 2019 / Revised: 27 December 2019 / Accepted: 3 January 2020 / Published: 7 January 2020

Abstract

:
The concept of energy return on investment (EROI) is applied to a set of electrical submersible pumps (ESPs) installed on a small offshore platform by conducting a detailed energy accounting of each ESP. This information is used to quantify the energy losses and efficiencies of each ESP system as well as the EROI of the lifting process (EROILifting), which is derived by dividing the energy out of each well, which is the chemical energy of the crude oil produced, by the energy consumed by each ESP system and by the surface equipment used to dispose of the well’s produced water. The resulting EROILifting values range from 93 to 565, with a corresponding energy intensity range of 18.3 to 3.0 kWh/barrel of crude. The energy consumed by each well is also is used to calculate the lifting costs, which is the incremental cost of producing an additional barrel of crude oil, which range from 0.64 to 3.90 USD/barrel of crude. The lifting costs are entirely comprised of procured diesel fuel, since there is no natural gas available on the platform to be used as fuel. Electrical efficiencies range from 0.60 to 0.80, while Hydraulic efficiencies range from 0.12 to 0.56. The overall ESP efficiencies range from 0.09 to 0.39, with the largest losses occurring in the hydraulic system, particularly within the ESP pump itself. Improvement of pump efficiencies is the only practical option to improve the overall ESP system efficiencies. Other losses within the electrical and hydraulic systems present few opportunities for improvement.

1. Introduction

The search for new oil fields has led oil and gas companies to develop less favorable, geographically challenged fields such as offshore. The development and exploitation of offshore oil fields are generally energy intensive, due to the remote marine environment in which they operate. Large steel structures are often required to support extraction facilities, such as with respect to drilling rigs and offshore processing platforms. Logistically, energy is required to transport resources to the facilities to support drilling, operations, and maintenance activities. Energy is also necessary to store and transport the crude oil to market. Finally, from a life cycle perspective, a significant amount of energy is required to raise reservoir fluids to the surface facilities and to inject separated water back into the formation. The focus of this research is to provide insight into the last category by developing and analyzing appropriate energy performance indicators, such as the energy return on investment (EROI) and the energy intensity (EI), as well as to understand how the derived energy performance indicators relate to the operating costs. The introductory section of this paper describes the EROI and EI indicators, as well as the related lifting costs. This is followed by a brief literature review of the application of EROI at different levels of focus, and the rational for extending the EROI concept to the individual well level. The concept of artificial lift is introduced and one prominent artificial lifting method, electrical submersible pumps (ESPs) is explained with regards to its main subsystems and components, and a high level description of the flow of electrical and hydraulic energy through the ESP system. The introductory section is followed by a detailed Materials and Method section, which rigorously describes the computations necessary to calculate energy losses and consumption for each component of the ESP system and culminates in the derivation of energy performance indicators at the well level. This is followed by a Results and Discussion section, which presents the results of the aforementioned computations such that comparisons can be made and potential correlations can be explored.

1.1. Energy Performance Indicators

EROI is the energy return (output) divided by the energy invested (input) of a system [1]. Equation (1) provides the definition of EROI. The first law of thermodynamics states that energy is conserved, but if the purpose of the analysis is to better understand the energy return of a process, then a comprehensive first law balance, which takes into account all inputs and outputs, is not required, and only the “invested” energy into the system and the “useful” energy returns out of the system are included. For example, invested energy can take the form of electricity used to run extraction equipment, while the energy returns are typically described by the chemical energy embodied in the crude oil and natural gas products, which is normally described by the heating value.
E R O I =   E n e r g y   R e t u r n   ( O u t p u t ) E n e r g y   I n v e s t e d   ( I n p u t )
The EROI methodology intentionally excludes a wide range of energy outputs, such as the energy contained in produced non-hydrocarbon fluids, such as formation water, co-produced gases, and solids. The outputs related to emissions, heat, vibration, noise, etc., which would normally be accounted for in full energy balance, are also intentionally excluded from the EROI numerator. Furthermore, the calculation of useful energy return excludes any thermomechanical energies related to thermal- and pressure-related energies contained in the produced hydrocarbons. There are a number of reasons for this:
  • The intention is to only account for the beneficial, useful, energy out, and all non-hydrocarbon outputs are considered as waste products.
  • The thermal-mechanical energies of the produced fluids are considered negligible compared to the embodied chemical energy of the hydrocarbons produced.
Researchers have developed EROIs for a number of systems with different degrees of focus. Initially, researchers focused on quite large systems such as the global oil and gas industry, or the oil and gas industry within a country [2,3,4]. These large-scale oil and gas systems were typically modeled using a top down approach, which converts monetary investments to energy investments, while energy out was derived by converting published production rates to energy rates, by means of the heating values of the hydrocarbon produced [5]. Subsequently, researchers began using the EROI concept to better understand the energetic behavior of specific oil and gas fields by employing a bottom-up approach, which delved into the details of the extraction and initial processing systems [6,7]. For example, a bottom-up approach would isolate and take into account the energy used by a diverse assortment of equipment used in the extraction process. A summary of some prominent EROI studies are contained in Table 1.
It is difficult to generalize the global and regional trends indicated in Table 1. Considering the unknown margin of error imposed by a top-down methodology, which converts published expenditures to energy, the authors are reluctant to conclude that global and regional EROIs are declining as a general rule. The presumption by many researchers is that newly discovered fields are less energetically favorable than historical fields, but evidence of such is scarce. Furthermore, there have been significant advances in technology with regards to drilling and recovery methods that could potentially offset any perceived reduction in the energetic quality of newly discovered fields, versus fields discovered 20 to 50 years in the past. On the other hand, it is widely observed that the energy intensity of specific fields increases over time. The reasons for this are the gradual depletion of hydrocarbons, decreasing reservoir pressure, the introduction of more energy intensive recovery methods to mitigate declining production, and compliance with increasingly stringent environmental regulations for the disposal of associated fluids, such as reservoir water, and natural gas, which has no route to market. Therefore, field-level EROIs trends are the impetus for oil and gas operators to better understand and potentially improve their application of energy to recover hydrocarbon resources.
It is also noteworthy that the established body of literature on the EROI approach, particularly field-specific case studies, do not go beyond developing EROI indicators at the field level. This research assumes that the collective EROI trends at the field-level are underpinned by performance of the individual wells. Therefore, in order to develop a better understanding of field-level EROIs, this research explores the benefits of extending the EROI methodology to the individual well level.

1.2. The Concept of Lifting Energy

The predominant energy demand for a typical oil extraction process is often the energy required to raise the reservoir fluids to the surface, a practice that is generally referred to as “artificial lift” in the oil and gas industry [12]. The energy required to inject associated water is also a significant component of the total energy demand. The term “Lifting Cost” is often used in the oil and gas industry to describe the incremental costs of producing an additional barrel of oil [13]. This research introduces a new corresponding term called “Lifting Energy”, which can be thought of as the incremental energy of producing an additional barrel of oil. In this paper, lifting energy is proposed to include the energy required to raise reservoir fluids to the surface, to inject separated water back into the formation, as well as the incremental energy required for initial processing on the platform. The energy inputs and outputs accounted for in the overall lifting balance are described in Figure 1.
In relation to the “Lifting Energy” concept, this research proposes a new more practical category of EROI, which includes only the direct energy used for lifting, excluding indirect energies and the energies embodied in materials. The proposed category is “EROILifting”. It should be noted that EROILifting is closely related to the “energy intensity” of lifting, which is essentially the inverse of the EROI, except that instead of using an energy output, the energy intensity uses a non-energy unit as the output, which for crude oil is a standard barrel (bbl). Equation (2) describes the energy intensity ratio.
E n e r g y   I n t e n s i t y   o f   L i f t i n g   ( E I ) =   E n e r g y   I n v e s t e d   ( I n p u t ) U n i t   o f   P r o d u c t i o n   ( O u t p u t )
This level of focus into EROILifting, and the related energy intensity of lifting, can provide several benefits:
  • Insight into the energy returns and energy intensities of the extraction process on an individual well basis;
  • A means to better understand the factors impacting the lifting costs of the extraction process on an individual well basis;
  • An additional factor by which to rank wells and support decision making regarding operations.

1.3. Lifting Costs

As described in the preceding section, lifting costs are the variable costs used to produce one additional barrel of oil [13]. The lifting cost of a well is an important parameter affecting oil field economics and is normally reported in US dollars per barrel of crude produced (USD/BBL). In most oil and gas fields, the lifting costs are directly related to energy consumption. Therefore, it is proposed that by understanding the detailed lifting energetics, we can gain insight into the main influences on lifting costs. Lifting cost has been interpreted to be a function of the following parameters [13]:
  • Gross rate;
  • Oil rate;
  • Gas rate;
  • Injection water rate;
  • Oil wells count;
  • Gas wells count;
  • Injection wells count.
Consistent with the energetic definition of “lifting” used in this research, lifting cost is assumed to include the costs of raising the fluids from the subsurface reservoir to the surface, the costs of injection of associated water or gas to comply with environmental requirements and/or to stimulate the reservoir, and the costs to run processing equipment and miscellaneous support utilities on the offshore platform. In the proposed method, the share of costs for injection of associated water is allocated based on each well’s contribution of water, while the share of costs required for processing and miscellaneous utilities is split equality by all wells. For imported energy, lifting costs is simply the energy intensity multiplied by the unit cost of energy as described by Equation (3).
L i f t i n g   C o s t s = E I   ×   E n e r g y   C o s t s =   ( k W h B a r r e l   C r u d e ) × ( U S D k W h ) = U S D B a r r e l   C r u d e

1.4. Artificial Lifting

Liquid hydrocarbon reservoirs typically do not have sufficient pressure to “free flow” the reservoir liquids to the surface at economically sufficient rates. There are a number of technologies available to artificially lift reservoir fluids to the surface such as sucker rod pumps, progressive cavity pumps, gas lift, jet pumps, and electrical submersible pumps (ESPs). A number of studies have been developed, which describe the criteria that can be applied to select an appropriate artificial lifting technology [12,13,14,15,16]. With regard to offshore platforms, as opposed to onshore extraction systems, a key consideration is surface space, which is quite limited in an offshore environment, and essentially eliminates the option to use sucker rod pumps, which are the preferred artificial lift method for onshore wells. Therefore, ESPs are widely employed on offshore platforms due to their small surface footprint and their ability to tolerate non-vertical wells, which are more common in an offshore environment due to a constraint on the drilling location for production wells from a centrally located offshore platform. Furthermore, ESPs are known to accommodate wells with depths of up to 12,000 feet or more and can facilitate a wide range of flowrates. These are some of the reasons that ESPs have become the second most common artificial life method in the world, after sucker rod pumps. Therefore, this research examines the energetic behavior of ESPs, as they have recently become an indispensable technology used to produce a significant share of the worlds hydrocarbons.

1.5. ESP Energy Balances

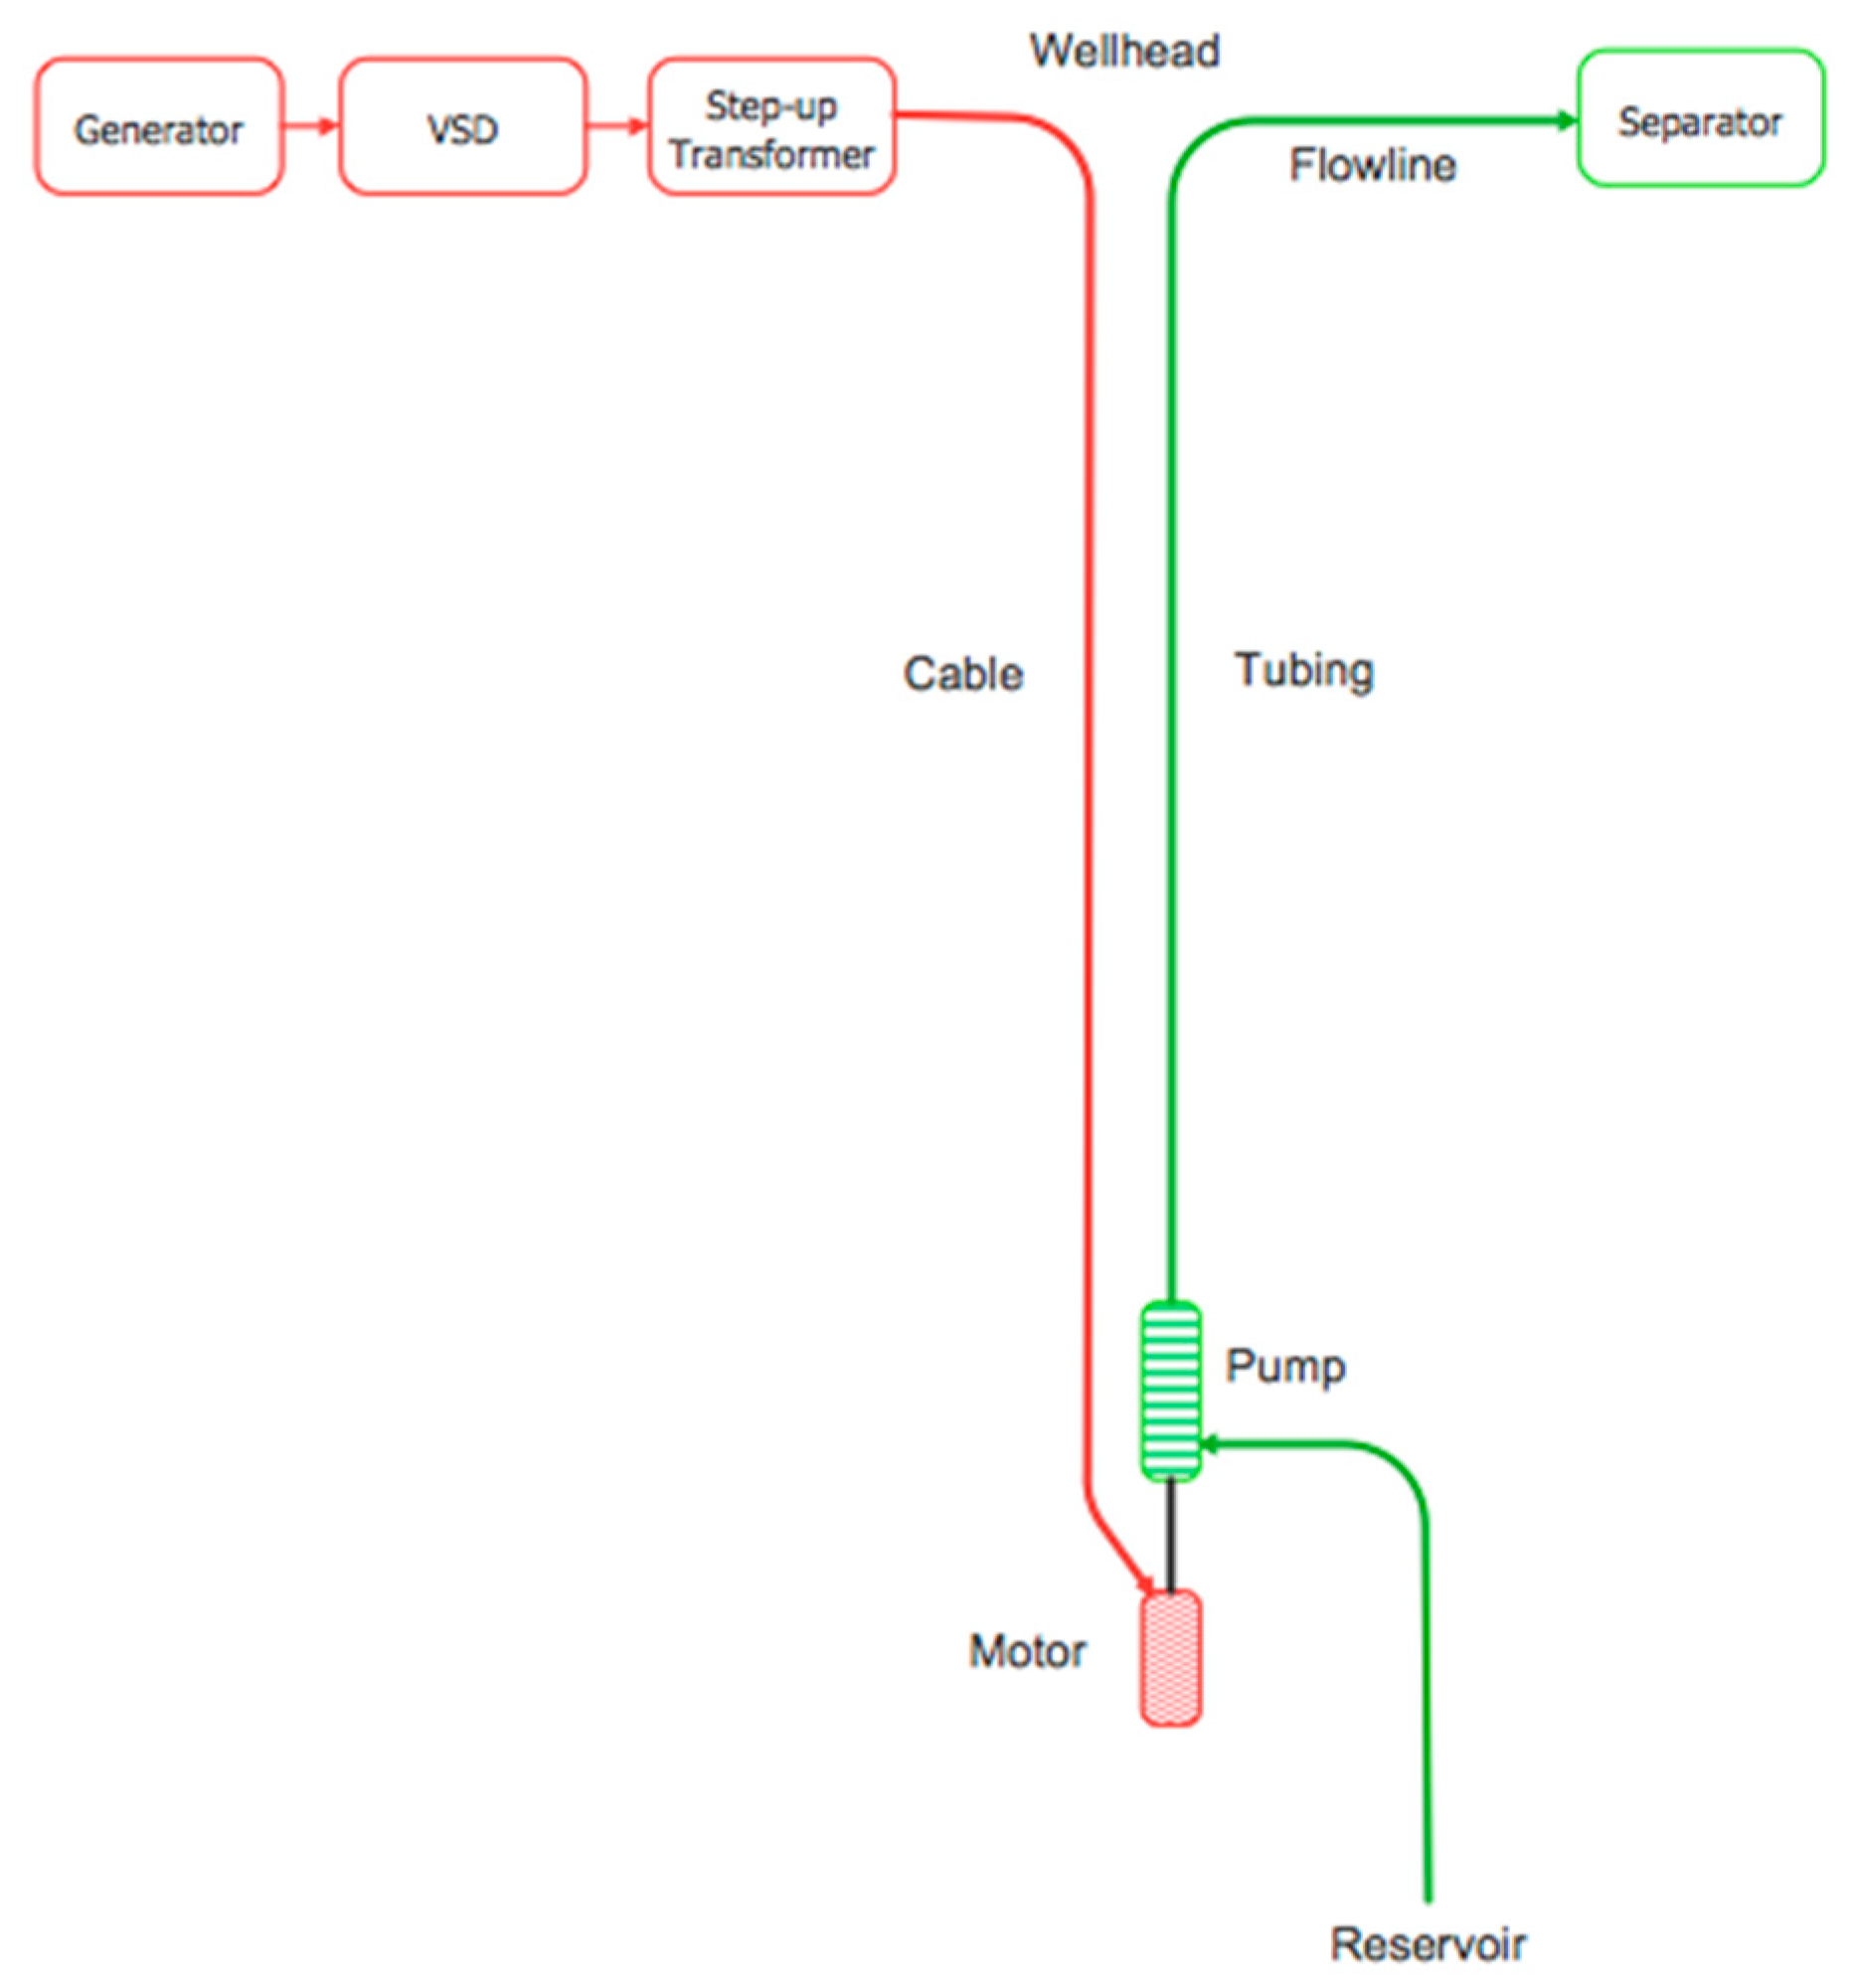
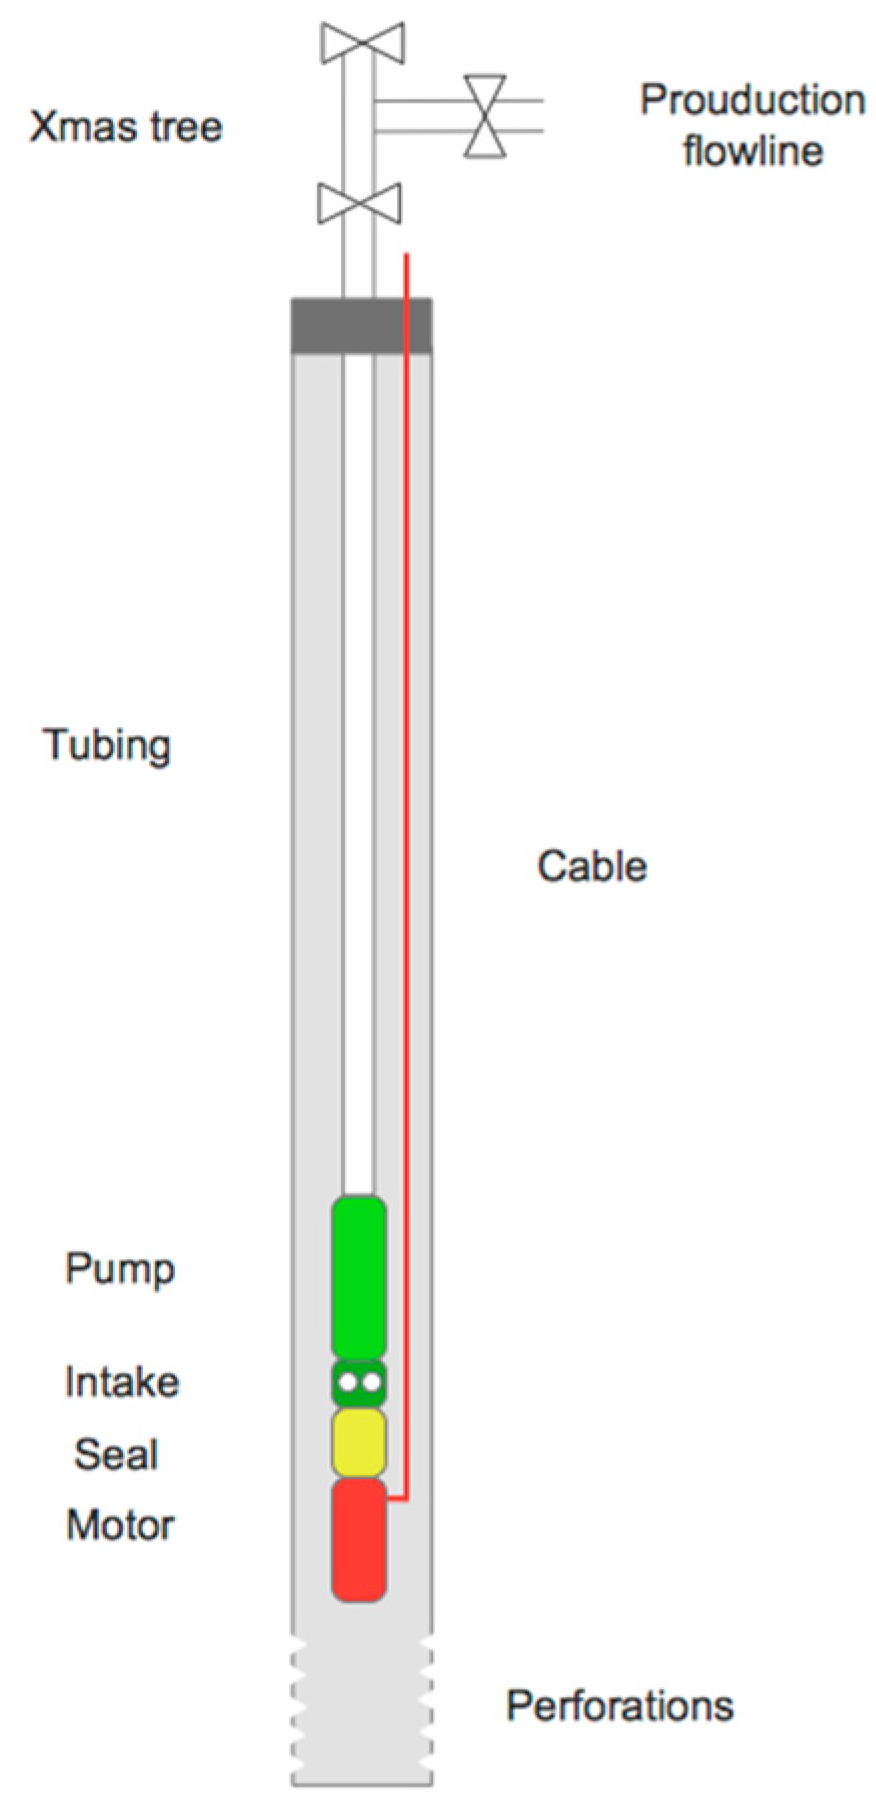
ESP systems are composed of two general subsystems, electrical and hydraulic. The electrical system includes an electrical power source, surface equipment (motor controller and transformer), cables, and the ESP motor itself, which is located beneath the pump in the well. The hydraulic subsystem includes the pump and the discharge piping, which raises the reservoir fluids to the surface facilities (the well tubing). A seal system is in place to prevent reservoir fluids from entering the motor housing. Figure 2 and Figure 3 describe the ESP systems and its two primary subsystems, electrical and hydraulic.
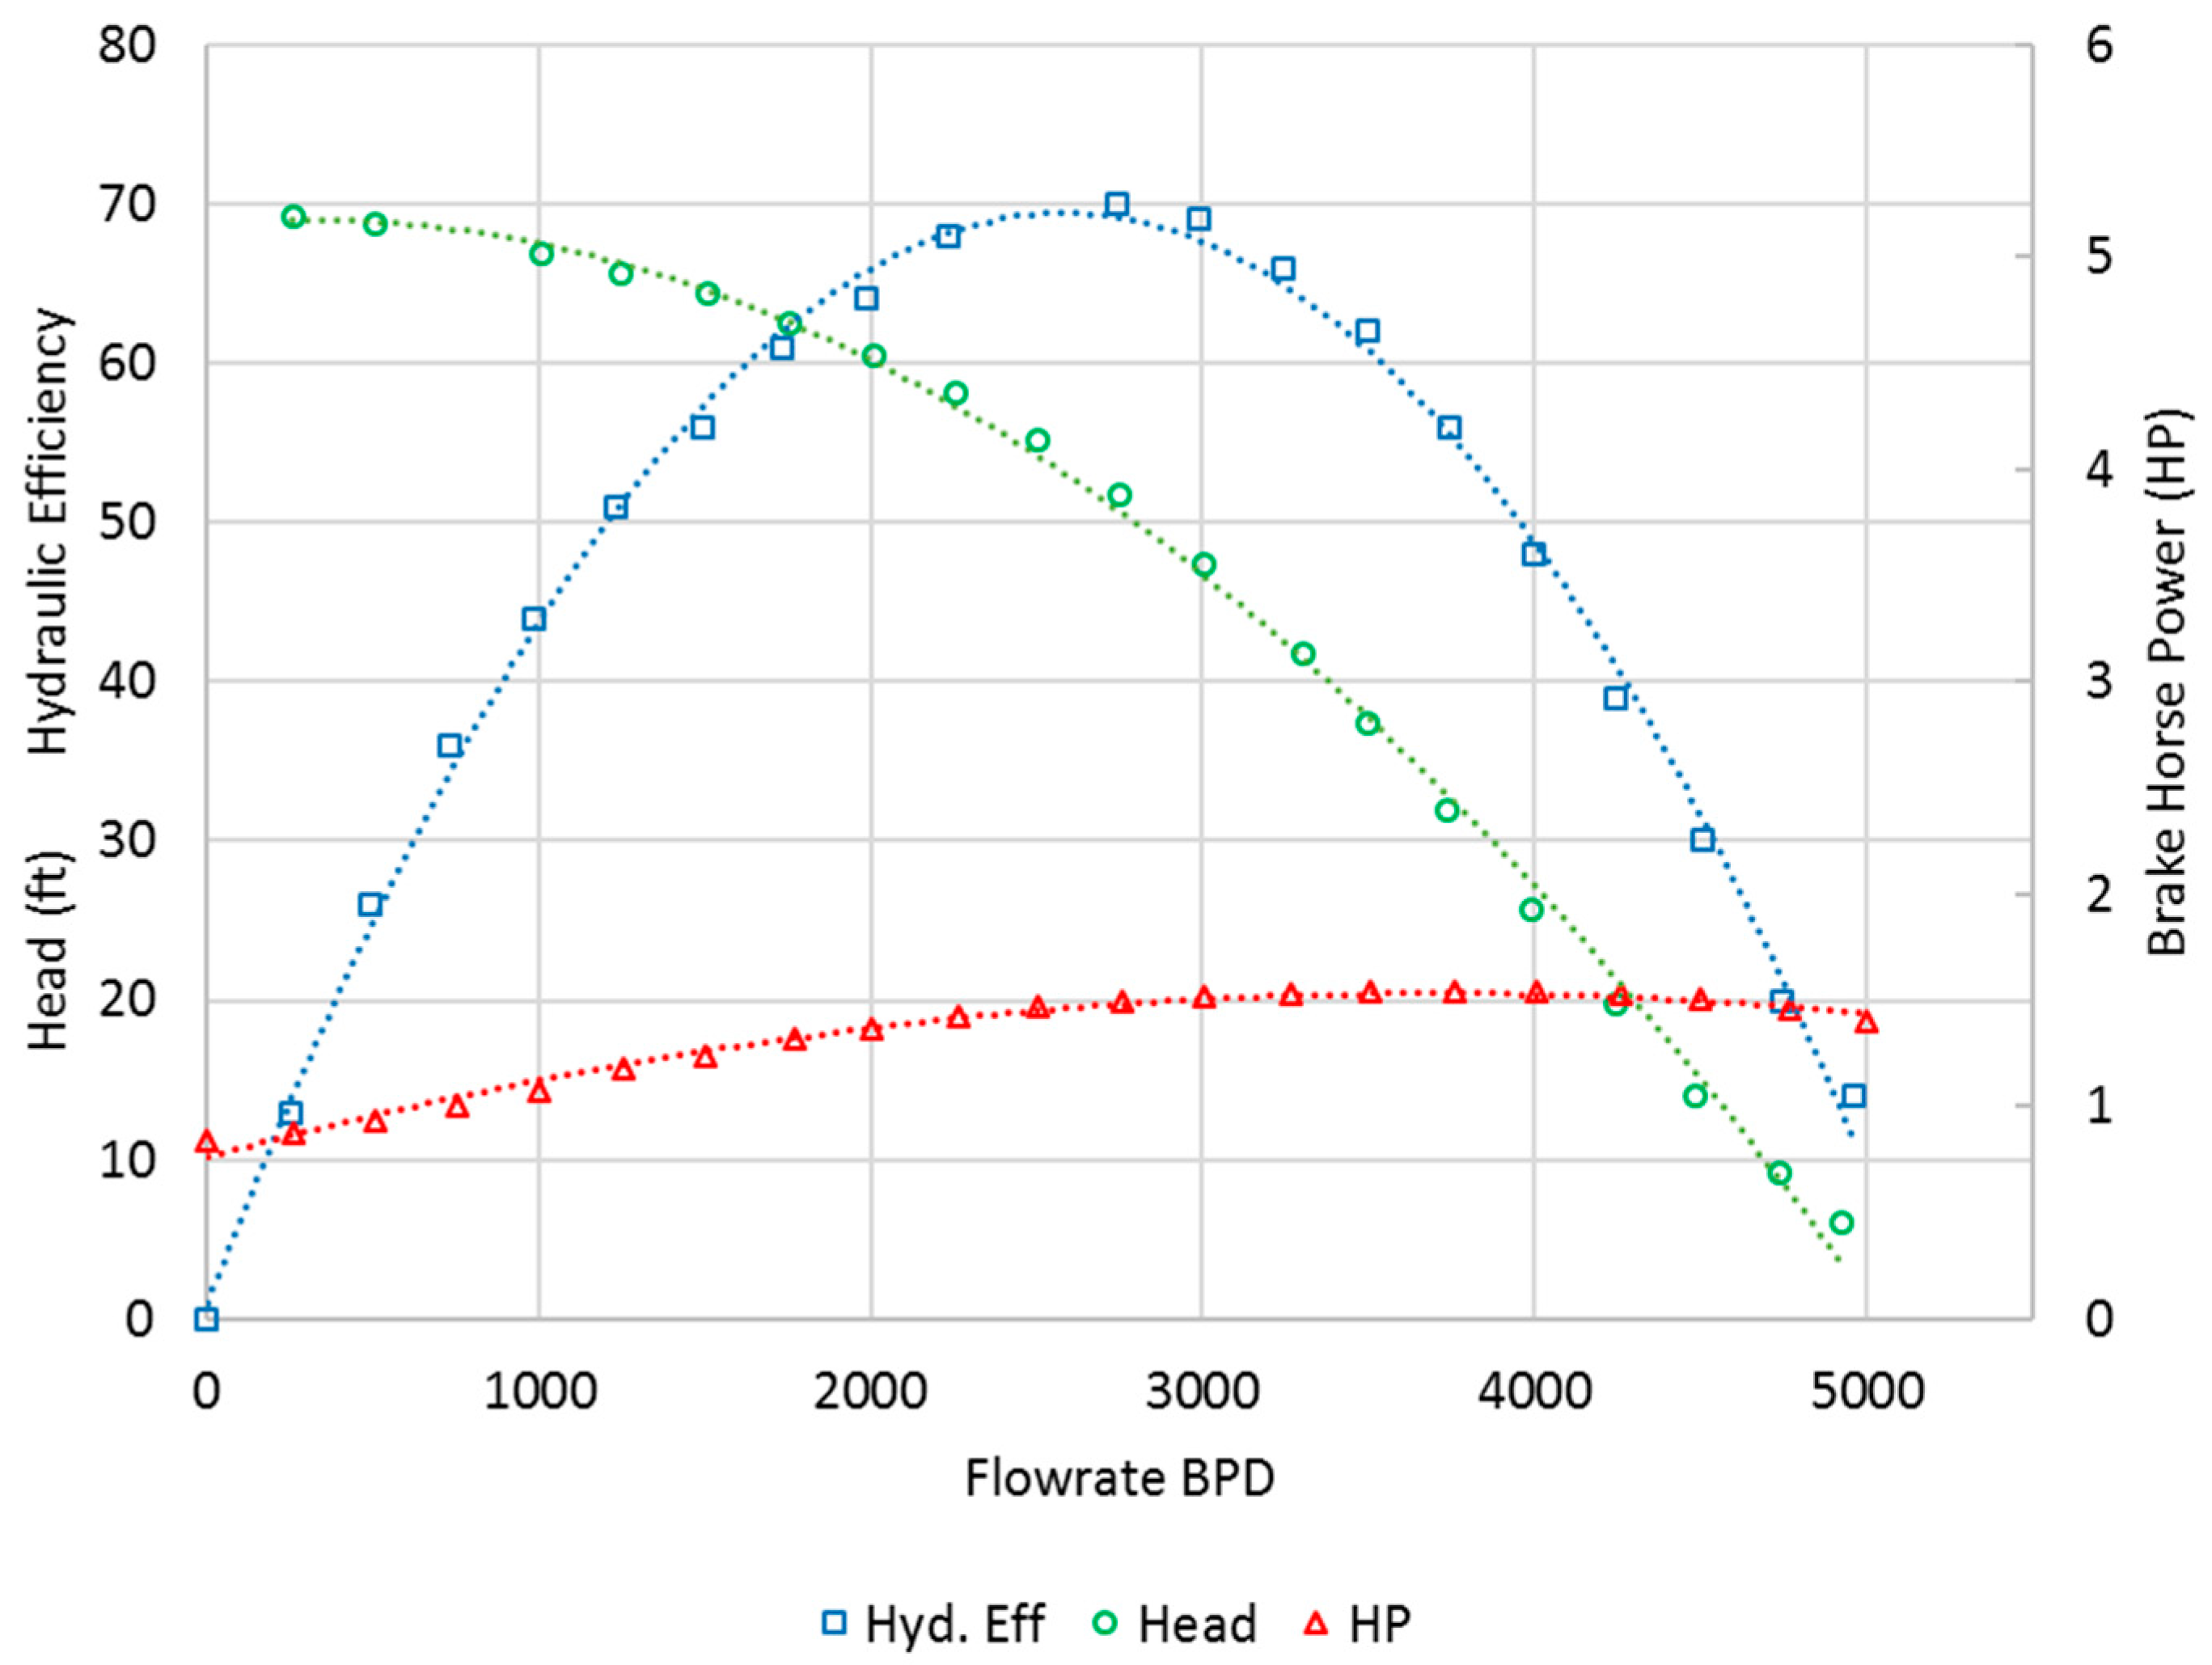
The ESP pump itself is a multistage centrifugal pump with numerous rotating impellers, each of which is an integral component of a single pump stage. The performance of an ESP pump is best described by curves provided by the manufacturer. A set of ESP pumps curves describe the flow/head relationship, the brake horsepower (BHP) required by the pump over the full range of its flow, the pump hydraulic efficiency as a function of flow rate, and the motor efficiency as a function of the percentage nameplate power provided to the motor. Typical ESP performance curves describing a single pump stage are shown in Figure 4 and Figure 5.
Hydraulic efficiencies generally range between 0.20 and 0.60 for the pump itself depending on the operating conditions. For every centrifugal pump, there is an optimal point where the maximum efficiency is achieved. This is commonly called the best efficiency point (BEP) and it is usually identified as a point on the flow/head curve. It is not always possible to operate at the BEP; therefore, a typical ESP flow/head curve also includes the recommended operating range. ESP systems are frequently provided with variable speed drives (VSDs), which can be used to adjust the speed of the pump and cause a shift in both the flow/head and the efficiency curves.
Energy balances can be derived by considering the ESP system components shown in Figure 3. Electrical losses can occur at the surface equipment (variable speed drive and transformer), downhole cables, and within the ESP motor itself. Hydraulic losses are due to pumping inefficiencies, frictional losses in the tubing, and losses associated with backpressure at the surface. Figure 6 indicates the flow of energy through the ESP system as well as the location of energy consumption and losses.
Referring to the left side of Figure 6, the electrical balance is simply the electrical power into the system minus the energy losses in the surface equipment, the cable, and the motor. Therefore, the electrical efficiency is the ratio of brake power provided by the ESP motor divided by the electrical energy into the ESP surface equipment.
A hydraulic balance can be conducted by inspecting the elements on the right side of Figure 6. The hydraulic power balance is simply the brake power, less the hydraulic power required to raise/uplift the fluids from the subsurface reservoir to the surface, the hydraulic losses in the pumps, the hydraulic power required to overcome backpressure at the surface, and the hydraulic power required to overcome friction in the discharge piping. Therefore, the hydraulic efficiency is the hydraulic head provided by the pump (for uplifting, backpressure, and friction) divided by the break horsepower provided by the motor.

2. Materials and Method

The researchers have access to detailed data operational data from several offshore platforms located in South East Asia. The platforms tend to have 15 to 20 wells each, which are all equipped with electrical submersible pumps. One representative platform is selected for analysis, and a typical day’s data is evaluated from the year 2017. The selected platform has 18 production wells, which represent a wide range of operating conditions such as well depth, fluid properties, crude and water flowrates, and bottom-hole pressures. The methodology involves treating each production well as a separate energy accounting center, to facilitate comparisons between wells and to evaluate the factors that influence energy related parameters, such as the EROI and EI, and economic factors, such as the lifting costs. It should be noted that there are also 3 water disposal wells, which receive pressurized water from centrifugal pumps located on the platform.
Therefore, the methodology for this research entails the following steps:
  • Step 1: Development of EROILifting and EI for each well.
  • Step 2: Development of lifting costs for each well.
  • Step 3: Development of Detailed Energy Balances for each well.
  • Step 4: Analysis.
Step 1: Development of EROI-Lifting and energy intensity for each well.
The equations used to calculate the EROILifting, energy intensity for each well are indicated in Equation (4) through Equation (6). Table 2 indicates the provided data and the calculated data. The actual provided data and calculated are contained in Appendix A, Table A1 and Table A2 respectively.
Equation (4) is the overall energy balance that can be applied to any well. The total lifting energy input for the well is comprised of the energy supplied to the ESP plus the energy supplied to inject any associated water produced from the well into the injection reservoir, plus the marginal energy required for platform processing and utilities.
E ˙ L i f t i n g i n =   E ˙ E S P i n + E ˙ W a t e r   I n j e c t i o n i n + E ˙ P r o c e s s   a n d   U t i l i t i e s i n
where:
E ˙ L i t i n g i n = Overall   lifting   power   in   ( kW ) ,
E ˙ E S P i n = ESP   electrical   power   ( kW ) ,
E ˙ W a t e r   I n j e c t i o n i n = Water   injection   electrical   power   ( kW ) ,
E ˙ P r o c e s s   a n d   U t i l i t i e s i n = Process   and   Utilities   electrical   power   ( kW ) .
Equation (5) is used to calculate the energy output from an ESP equipped well, which is simply the well’s volumetric flowrate of crude oil produced multiplied by the chemical energy of the crude product, also known as the heating value. A typical lower heating value of 6.1 GJ per barrel is assumed in all calculations.
E ˙ L i f t i n g o u t = Q ˙ c r u d e   Δ H c r u d e c h e m c a l
where:
E ˙ L i f t i n g o u t = Overall   lifting   energy   out   ( kW ) ,
Q ˙ c r u d e = Crude   oil   production   rate   ( barrel / sec ond ) ,
Δ H c r u d e c h e m c a l = Crude   oil   chemical   energy   ( GJ / barrel ) .
Therefore, the overall EROILifting for each well can be calculated by dividing Equation (4) by Equation (5), as indicated in Equation (6).
  E R O I L i f t i n g   = ( E ˙ L i f t i n g o u t E ˙ L i f t i n g i n )
where:
E R O I L i f t i n g =   Energy   Return   on   Investment   of   Lifting ,
E ˙ L i f t i n g I n =   Lifting   energy   ( kJ / s ) ,
E ˙ L i f t i n g o u t =   Crude   chemical   energy   ( kJ / s ) .

2.1. Energy Intensity

The energy intensity for lifting for each well, as shown in Equation (7), can be found by taking the inverse of the EROILifting and multiplying it by the chemical energy per barrel of crude.
E I L i f t i n g   = 1   E R O I L i f t i n g ( E b a r r e l )
where:
E I L i f t i n g =   E n e r g y   i n t e n s i t y   ( G J / B B L ) ,
E R O I L i f t i n g = R a t i o   o f   u s e f u l   e n e r g y   o u t p u t   t o   a p p l i e d   e n e r g y   i n p u t ,
E b a r r e l   =   C h e m i c a l   E n e r g y   p e r   B a r r e l   C r u d e   ( G J / B B L ) .
Step 2: Development of lifting costs for each well.
Lifting costs were developed by converting the daily diesel consumption to a cost based on a diesel cost of 2.7 US dollars per gallon, which was the 2017 average cost of diesel. Therefore, the lifting cost for each well can be derived by multiplying the energy intensity by the energy costs as described in Equation (8).
L C =   E I L i f t i n g   ×   E C o s t
where:
L C =   L i f t i n g   c o s t   ( U S D / B B L ) ,
E I L i f t i n g =   E n e r g y   i n t e n s i t y   ( G J / B B L ) o r   ( k W h / B B L ) ,
E C o s t =   E n e r g y   c o s t   ( U S D / G J ) o r   ( U S D / k W h ) ,
B B L   =   B a r r e l   C r u d e .
Step 3: Development of Detailed Energy Balances for each well.
This research involved an analysis of a set of ESPs from an actual offshore platform in order to gain a better understanding of the energetic behavior of ESP systems in an actual operating environment. A typical day was selected and data were retrieved from site via the distributed control system, the variable speed drives, and the transformer tapping arraignments. For step 3, the provided data and calculated data are shown in Table 3. The actual data provided and calculated are contained in Appendix A, Table A3 and Table A4 respectively.
A number of equations are employed to calculate an energy balance for each of the 18 ESP systems.
The overall electrical balance for each well is described by Equation (9).
E ˙ e i n E ˙ e s u r f a c e   l o s s E ˙ e c a b l e   l o s s E ˙ e e s p   m o t o r   l o s s = BHP   ( 0.746 )
where:
E ˙ e i n =   electrical   power   input   ( kW ) ,
E ˙ e s u r f a c e   l o s s =   electrical   power   loss   in   surface   equipment   ( kW ) ,
E ˙ e c a b l e   l o s s =   electrical   power   loss   in   cables   ( kW ) ,
E ˙ e e s p   m o t o r   l o s s =   electrical   loss   by   ESP   motor   ( kW ) ,
BHP   =   shaft   power   provided   by   motor   ( HP ) ,
0.746   =   conversion   factor   HP   to   kW .
Surface power losses are calculated by taking into account the power factor of the surface equipment as indicated in Equation (10).
E ˙ e s u r f a c e =   E ˙ e i n ( 1 η s u r f a c e   )
where:
E ˙ e s u r f a c e   =   electrical   power   losses   in   surface   equipment   ( kW ) ,
E ˙ e i n =   electrical   power   input   ( kW ) ,
η s u r f a c e =   surface   equipment   power   factor   ( assumed   to   be   0.95 ) .
Downhole cable losses are a function of the cable resistance, and the current as shown in Equation (11).
E ˙ e c a b l e s =   3 I 2 R T 1000
where:
E ˙ e c a b l e s =   electrical   power   loss   in   cables   ( kW ) ,
I   =   required   motor   current   ( amps ) ,
R T =   resistance   of   the   power   cable   at   well   temperature   ( ohms ) .
Motor losses are calculated by multiplying the electrical power into the motor by the ESP motor efficiency factor, which is extracted from the motor efficiency curve, as indicated in Equation (12).
E ˙ e e s p   m o t o r   l o s s =   E ˙ e e s p   m o t o r   i n ( 1 η e s p   m o t o r )
where:
E ˙ e e s p   m o t o r   l o s s =   electrical   power   loss   in   ESP   motor   ( kW ) ,
E ˙ e e s p   m o t o r   i n = electrical   power   into   ESP   motor   ( kW ) ,
η e s p   m o t o r =   ESP   motor   efficiency   ( derived   from   manufacturers   motor   efficiency   curves ) .
The overall electrical power efficiency for each well is simply the brake power output of the motor divided by the power into the ESP electrical system as described in Equation (13).
η e l e c t r i c a l = BHP E ˙ e i n 0.746
where:
η e l e c t r i c a l = electrical   power   efficiency   for   each   well ,
BHP   =   shaft   power   provided   by   motor ,
E ˙ e i n = Power   in   ESP   System   ( kW ) ,
0.746   =   conversion   factor   HP   to   kW .
The overall hydraulic energy balance for each well is described in Equation (14).
BHP = ( E ˙ h   u p l i f t i n g + E ˙ h b p + E ˙ h f r + E ˙ h e s p   p u m p   l o s s ) / 0.746
where:
BHP   =   shaft   power   provided   by   motor   ( HP ) ,
E ˙ h   u p l i f t i n g =   hydraulic   lifting   power   ( kW ) ,
E ˙ h b p = hydraulic   power   lost   due   to   surface   backpressure   ( kW ) ,
E ˙ h f r =   hydraulic   power   lost   due   to   friction   in   well   tubing   ( kW ) ,
E ˙ h   e s p   p u m p   l o s s =   hydraulic   power   lost   in   the   ESP   pump   ( kW ) ,
0.746   =   conversion   factor   HP   to   kW .
The hydraulic lifting power of the ESP pump is indicated in Equation (15).
E ˙ h   u p l i f t i n g + E ˙ h b p = ( Q ρ g h ) 3.6 × 10 6 0.746
where:
E ˙ h   u p l i f t i n g =   hydraulic   lifting   power   ( kW ) ,
E ˙ h b p =   hydraulic   power   lost   due   to   surface   backpressure   ( kW ) ,
Q =   flowrate   ( cubic   meters   per   hour ) ,
ρ = fluid   density   in   ( kg / meter ^ 3 ) ,
g =   gravitational   constant   ( 9.81   m / sec 2 ) ,
h = total   developed   head   ( meters ) ,
0.746   =   conversion   factor   HP   to   kW .
The total head in meters is calculated by taking into account the true vertical depth of the pump, as well as the surface backpressure converted to head as described in Equation (16):
h = h T V D +   h b p = h T V D + ( W H P   ×   2.31 γ l   )   ( 0.348 )
where:
h =   total   developed   head   ( meters ) ,
h T V D =   true   vertical   depth   ( meters ) ,
h b p =   head   from   surface   backpressure   ( meters ) ,
W H P =   wellhead   pressure   ( psi ) ,
γ l =   specific   gravity   of   produced   liquid .
Frictional losses are calculated as per Equations (17) and (18).
Δ H fr = 2.083   ( 100 C ) 1.85 ( q 1.85 I D 4.86 )
where:
Δ H fr = frictional   head   loss   in   tubing   ( ft / 100   ft ) ,
C =   pipe   quality   number ,
q =   flowrate   ( gallon   per   minute ) ,
I D =   pipe   diameter   ( inches ) ,
E ˙ h fr = ( 7.368 × 10 0 q L Δ H fr γ l ) 0.746 ,
where:
E ˙ h fr = frictional   power   loss   ( kW ) ,
q L = liquid   production   rate   ( barrel   per   day ) ,
Δ H fr   total =   total   frictional   head   loss   in   tubing   ( feet ) ,
γ l = specific   gravity   of   produced   liquid ,
0.746   =   converstion   factor   HP   to   kW .
The hydraulic efficiency for each well is simply the hydraulic head required to uplift the fluids to the surface plus the energy required to overcome backpressure and friction divided by the brake power provided to the pump as shown in Equation (19):
Hydraulic   Efficiency =   η h y d r a u l i c = E ˙ h u p l i f t i n g + E ˙ h b p + E ˙ h f r B H P ( 0.746 )
where:
η h y d r a u l i c =   hydraulic   efficiency   for   each   well ,
E ˙ h   u p l i f t i n g =   hydraulic   lifting   power   ( kW ) ,
E ˙ h b p =   hydraulic   power   lost   due   to   surface   backpressure   ( kW ) ,
E ˙ h f r =   frictional   power   loss   ( kW ) ,
B H P   =   shaft   power   provided   by   motor   ( HP ) ,
0.746   =   converstion   factor   HP   to   kW .
Finally, the overall ESP system efficiency can be calculated by multiplying the hydraulic efficiency by the electrical efficiency as described in Equation (20).
Overall   Efficiency =   η o v e r a l l = ( η e l e c t r i c a l ) ( η h y d r a u l i c )
where:
η o v e r a l l =   overall   energy   efficiency   for   each   well ,
η e l e c t r i c a l = electrical   power   efficiency   for   each   well ,
η h y d r a u l i c =   hydraulic   efficiency   for   each   well .

2.2. Supplmental Electrical Equations

The relationship of flowrate, electrical frequencies and pumping speeds, head, and power is described by the pump affinity laws. The affinity laws state that the flow rate of the pump changes directly proportional to the speed, the head developed by the pump changes proportionally to the square of the speed, and the power required to drive the pump changes proportionally to the cube of the speed. The affinity laws are described by Equations (21)–(23).
Q 2 = Q 1 ( N 2 N 1 )
H 2 = H 1 ( N 2 N 1 ) 2
Power 2 = Power 1 ( N 2 N 1 ) 3
where:
N 2 , N 1   =   pumping   speeds   ( RPM ) ,
Q 2 , Q 1   = pumping   rates   at   N 2   and   N 1   ( barrels   per   day ) ,
H 2 , H 1   =   developed   heads   at   N 2   and   N 1   ( ft ) ,
Power 2 , Power 1   =   required   brake   power   at   N 2   and   N 1   ( kW ) .
Since the power frequency is directly related to the motor speed, the affinity laws can be calculated with either the pump speed or the power frequency as described in Equations (24)–(26).
Q 2 = Q 1 ( f 2 f 1 )
H 2 = H 1 ( f 2 f 1 ) 2
Power 2 = Power 1 ( f 2 f 1 ) 3
where:
f 2 , f 1 = AC   frequencies ,   Hz ,
Q 2 , Q 1 = pumping   rates   at   f 2   and   f 1 ( barrels   per   day ) ,
H 2 , H 1   = developed   heads   at   f 2   and   f 1 ( ( ft ) ,
Power 2 , Power 1   =   required   brake   power   at   f 2   and   f 1   ( kW ) .
It should also be noted that transformers are used to vary the voltage of an AC electrical source and work on the principle of electromagnetic induction. A transformer typically consists of an iron core and two coils of insulated metal wires. The incoming AC power is directed through the primary coils and the circuit to be powered is connected to the secondary coils. Alternative tapping points on the secondary coils can be used to select from a range of output voltages. The relationship between voltage, current, and the number of turns in the primary and secondary coils are shown in Equations (27) and (28).
U s = U p ( N s N p )
where:
U P , U S =   primary   and   sec ondary   voltage   ( volts ) ,
N P , N S =   number   of   turns   in   the   primary   and   sec ondary   coils .
The frequencies of the electric currents in both coils are identical, but the currents will be different. The following formula is found for the relationship of current.
I s = I p ( N p N s )
where:
I P , I S =   primary   and   sec ondary   current ( amps ) ,
N P , N S =   number   of   turns   in   the   primary   and   sec ondary   coils .
Finally, it should be noted that the real electric power, typically designated in kW units, is found by considering the real current such that Ireal = Iline*cos( ). For a three-phase power supply, Equations (29) and (30) can be used to determine the line power and the real power, respectively.
KVA = 3 U line I line 1000 = 1.732   ×   10 3 U line I line
KW = 3 U line I line 1000 cos = 1.732   ×   10 3 U line I line cos
where:
U   =   voltage   ( volts ) ,
I   =   current   ( amps ) ,
=   phase   angle ,
cos =   power   factor .
These equations can be used to determine the power anywhere within the system if the current, voltage, and power factor are known.

3. Results and Discussion

For the typical day analyzed, the total power consumed by the platform, which coincides with the daily ESP data collected, is 1536 kW. The largest consumer of power are the ESPs, which consume 1034 kW, followed by the water injection pumps, which consume 451 kW, with miscellaneous utilities consuming the remaining 51 kW. Surface mounted injection pumps inject water into designated low-pressure reservoirs and the performance of the surface pumps is impacted by the injection pressure and the flowrate, which are relatively stable. The ESP conditions vary significantly from well to well and depend on a wide number of parameters such as the inflow conditions, the true vertical depth (TVD), the measure depth (MD), the total liquid rate, the oil, water, and gas rates, the differential pressure across the pumps, the number of stages installed, and the design of the stages. Furthermore, ESPs systems are dynamic with inlet conditions continuously changing due to complex transient reservoir behavior.
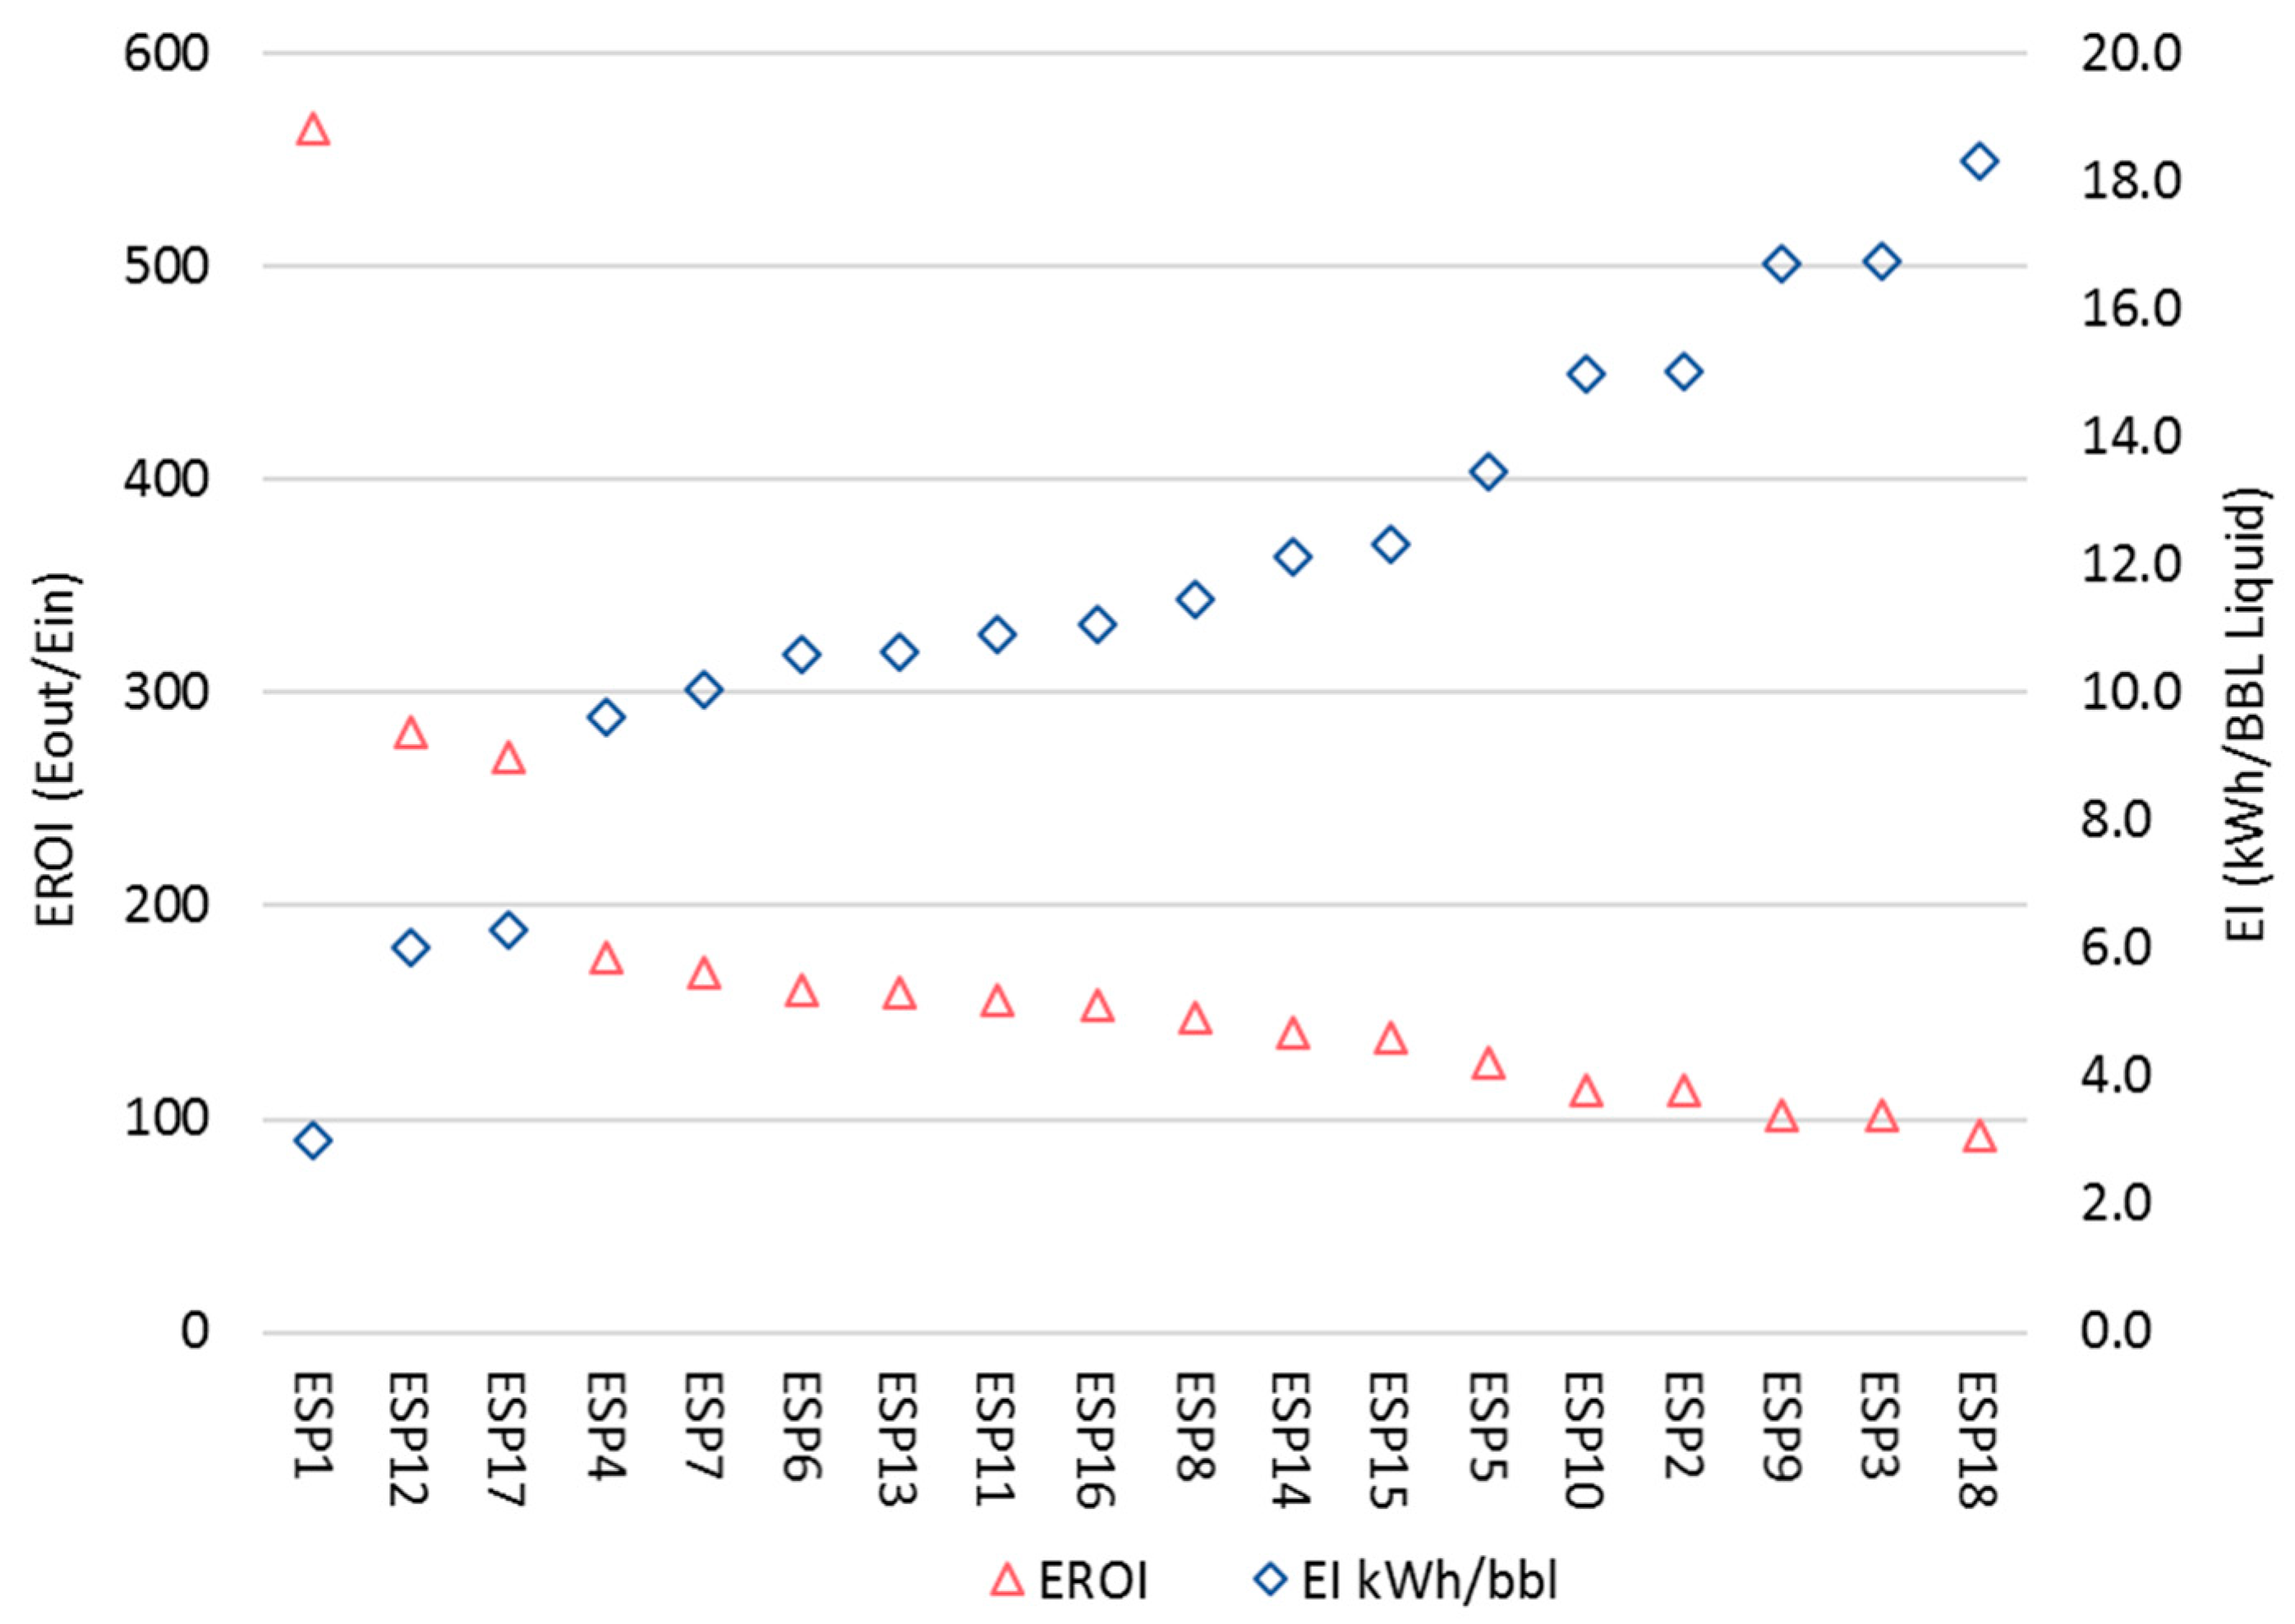
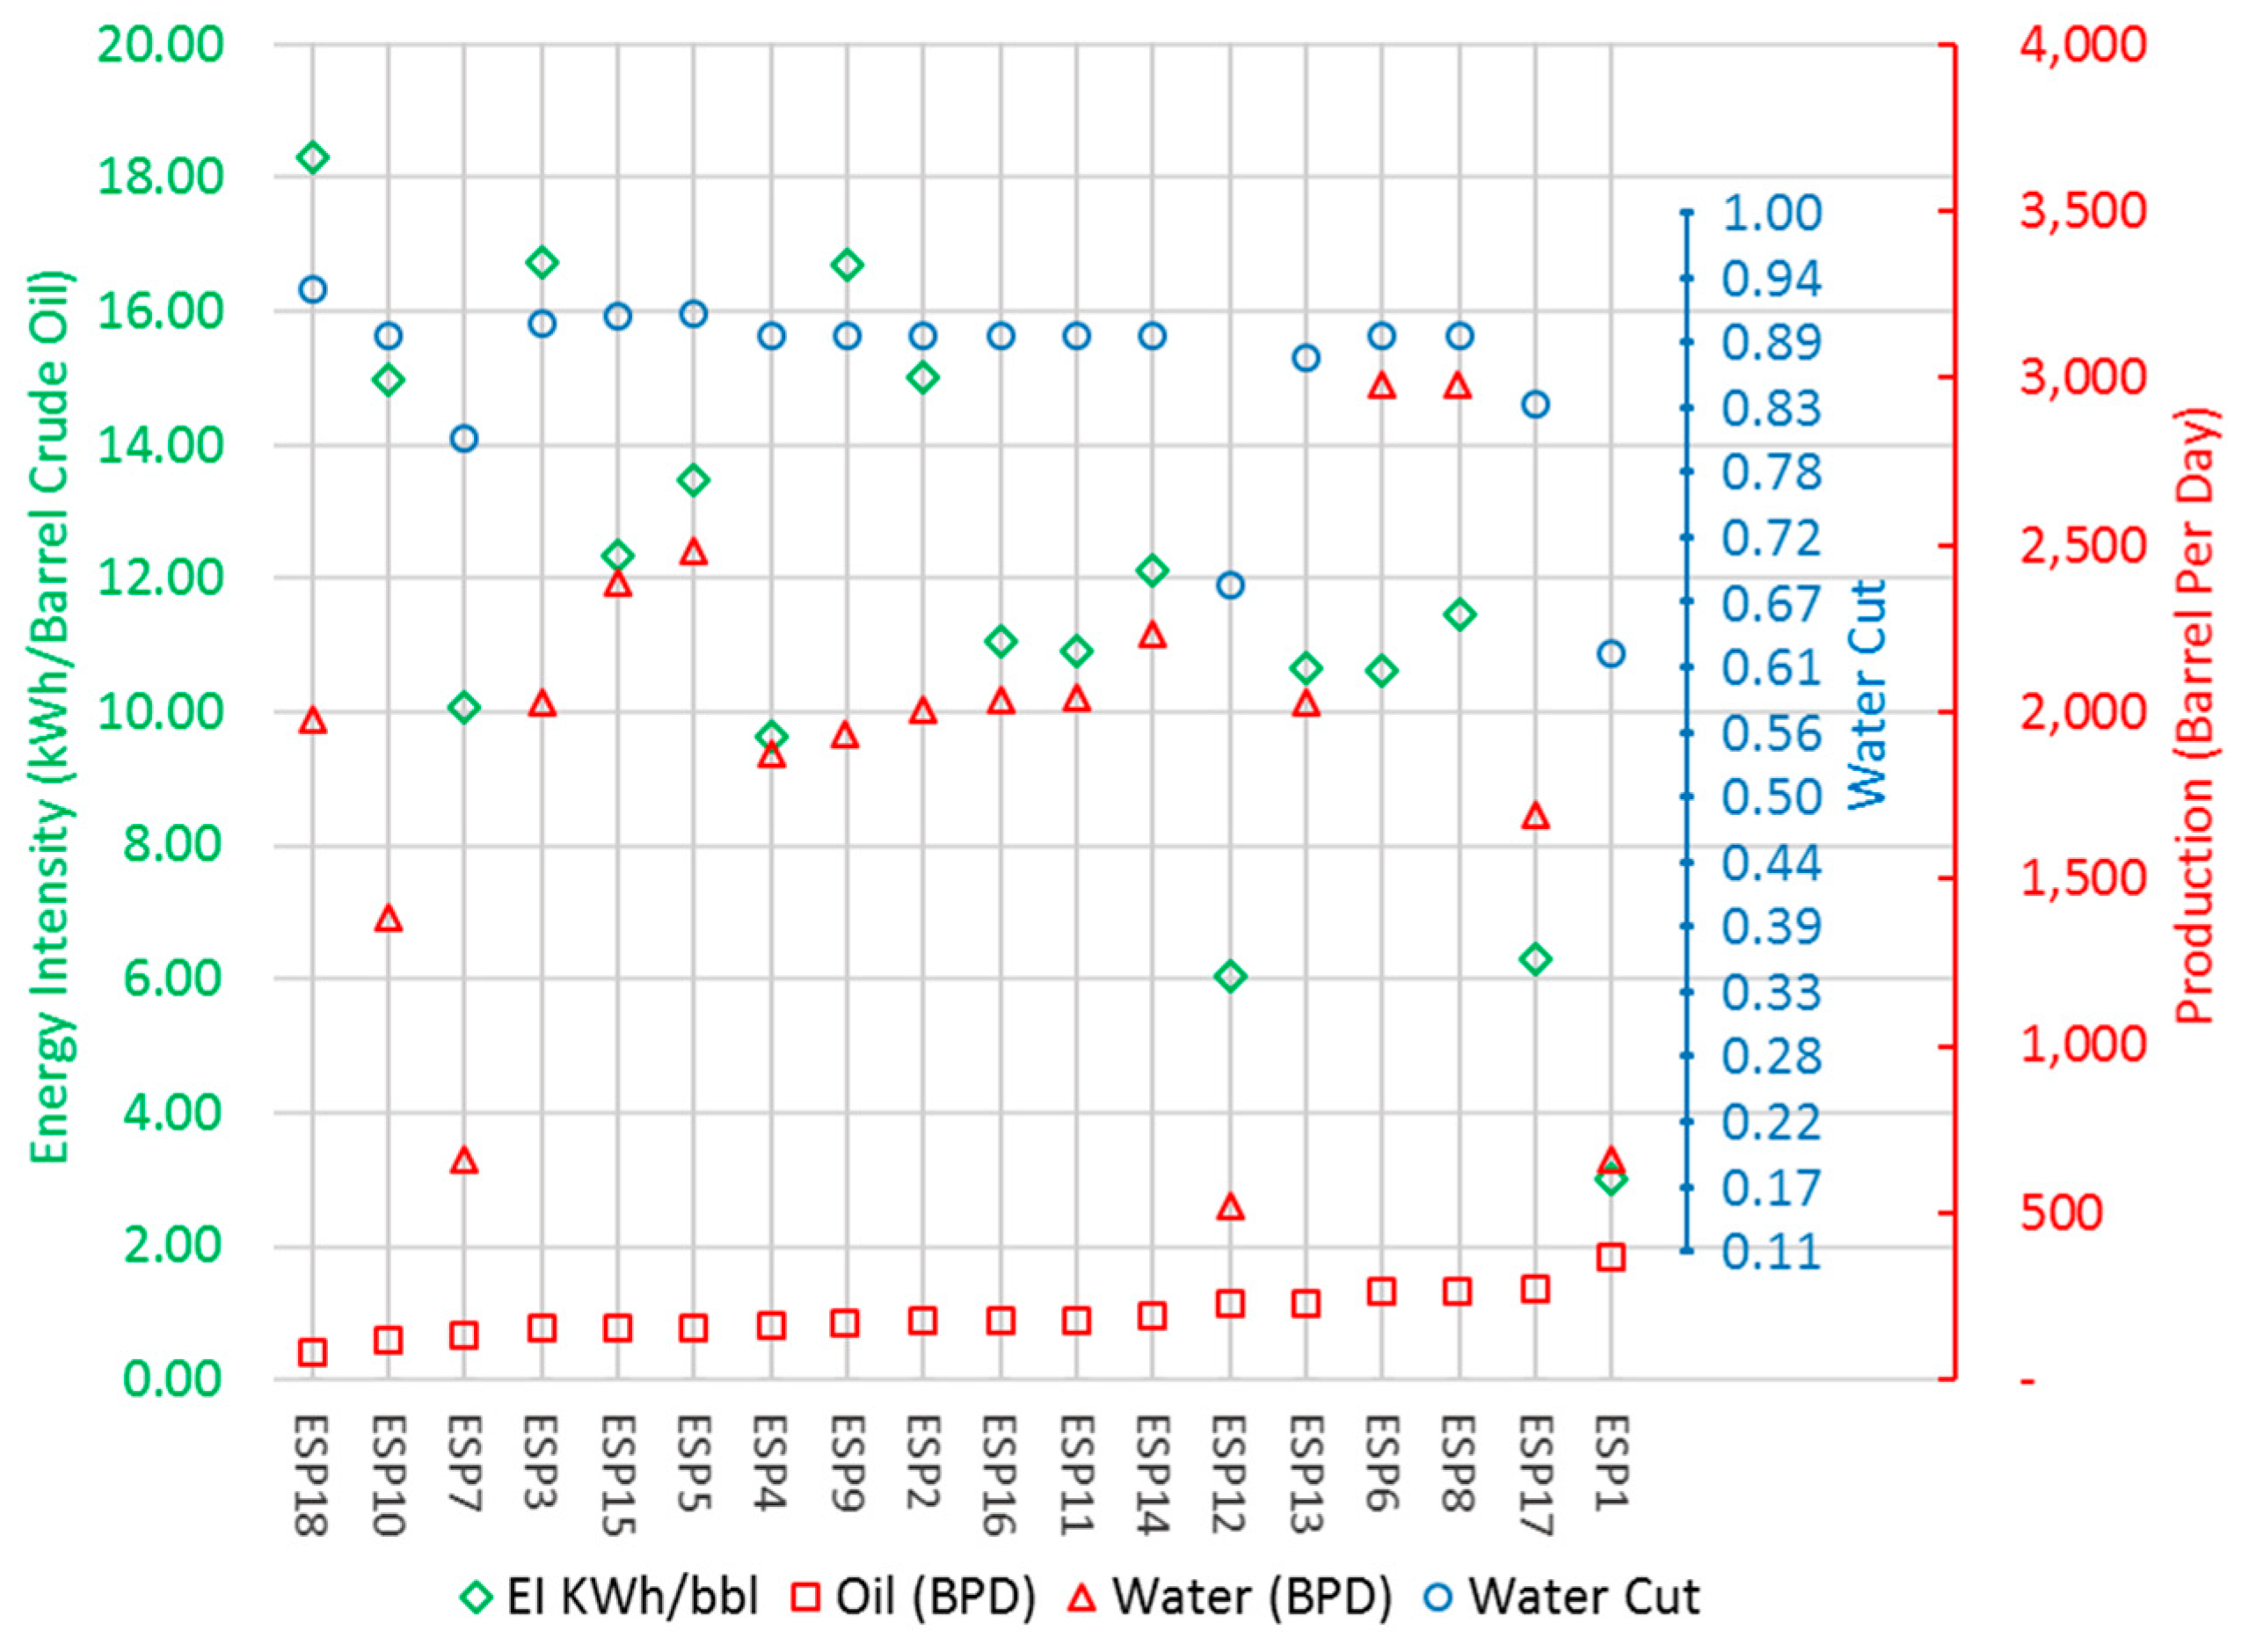
As such, of the 18 wells examined, no two wells experience the exact same operating conditions. This assumption is validated on inspection of the EROI and energy intensities of each of the 18 ESP systems, as indicted in Figure 7. As expected, the EROILifting and energy intensity are inversely related. The EROILifting values range from 93 to 565, and the wide range is explained by the highly variable conditions the ESPs are exposed to. The lowest EROILifting of 93 indicates that even the worst performing ESP system provides an energy return, which is nearly two orders of magnitude above the energy expended. Oil field analyst are more familiar with using energy intensity as a benchmarked parameter, and the lifting energy intensity ranges from 3.0 to 18.3 kWh per barrel of crude produced depending on the ESP. The overall energy intensity on the platform is 10.6 kWh per barrel of crude and the overall EROILifting on the platform is 160.
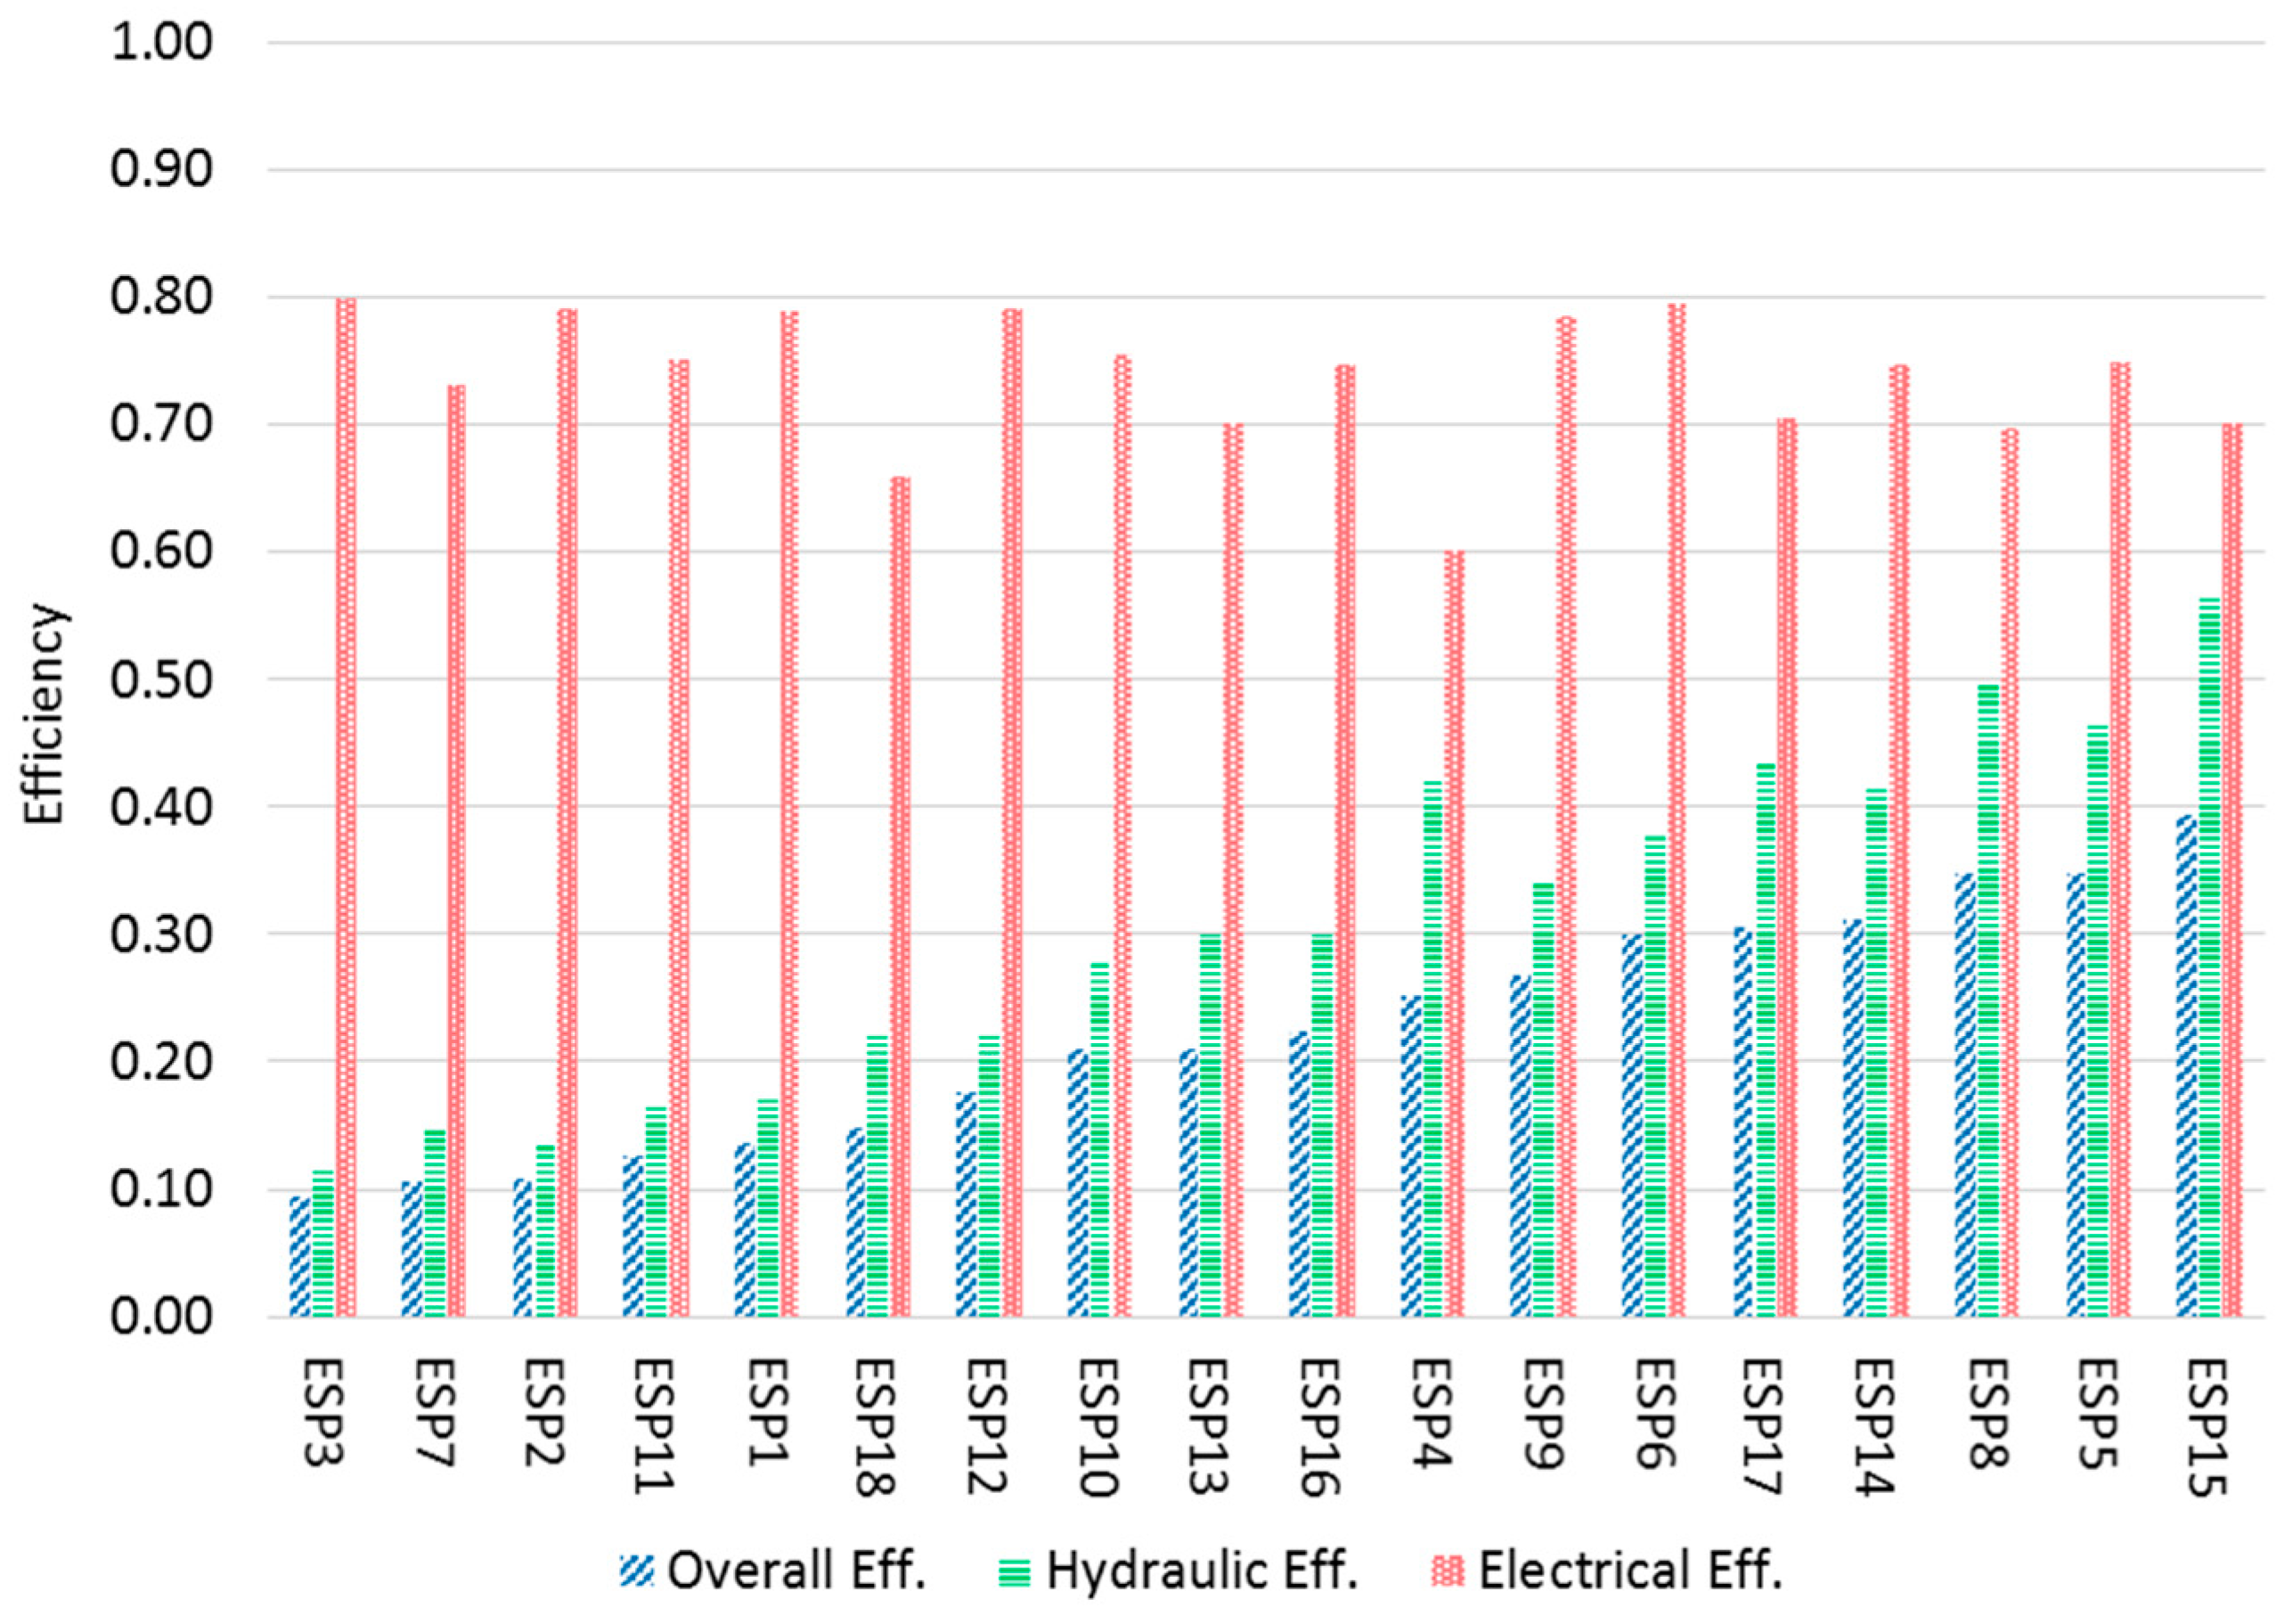
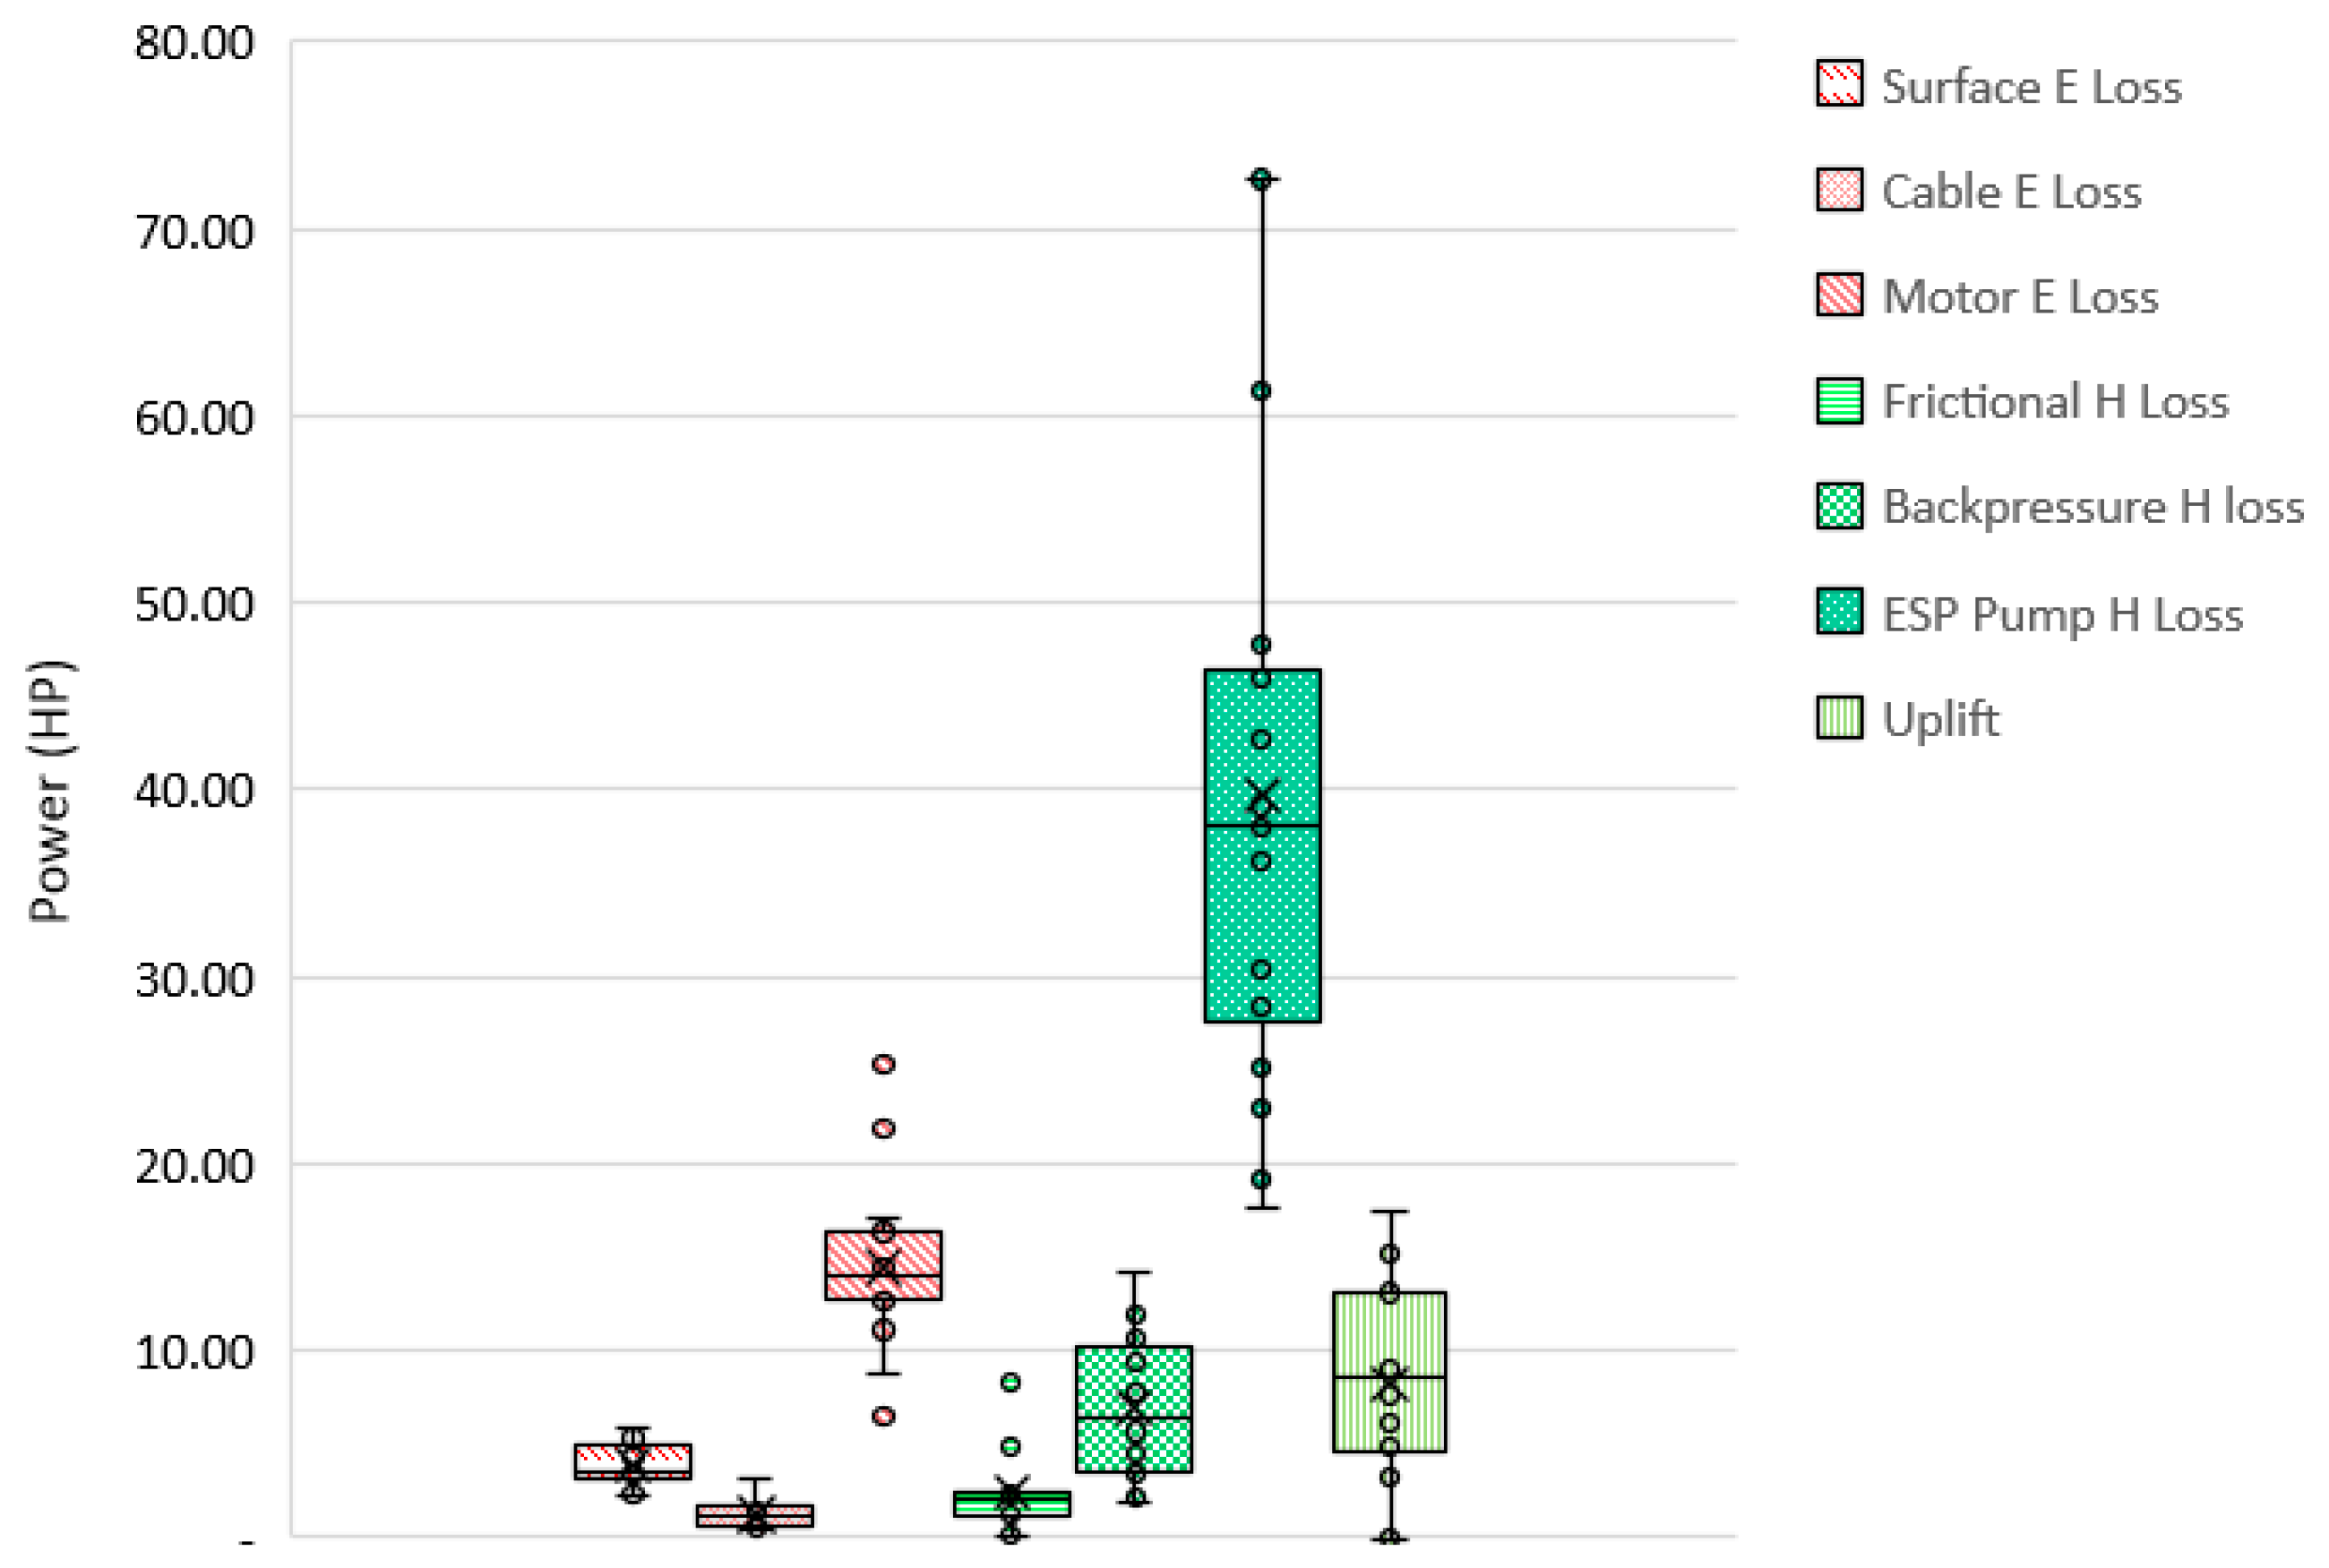
In order to better understand the variability observed in the calculated EROIs and energy intensities, a detailed energy accounting was conducted for each of the 18 ESP systems. The energy balance for ESP-06 is shown in Figure 8 as an example. In this example, the power provided to the ESP system is 72.0 kW, which is equivalent to 96.6 HP. The brake horsepower provided by the motor is 76.8 HP, therefore the electrical efficiency is equivalent to 0.80. The hydraulic head required is 29.0 HP and the hydraulic efficiency is equal to the hydraulic head divided by the brake horsepower provided to the pump, which yields a hydraulic efficiency of 0.38. The overall efficiency for this ESP is 0.30. The efficiencies for all 18 ESP systems are shown in Figure 9. Electrical efficiencies ranged from 0.60 to 0.80, while hydraulic efficiencies ranged from 0.12 to 0.56. This results in a range of overall efficiencies from 0.09 to 0.39. Clearly, hydraulic efficiencies are disproportionally contributing to the overall efficiency. The electrical efficiencies are mainly influenced by the ESP motor losses, which are relatively consistent among the 18 ESPs, as indicated by the narrow range exhibited in the box plot shown in Figure 10. As can be seen in Figure 10, significant hydraulic energy losses occur within the pump itself. Overall, Figure 10 describes a highly variable hydraulic system and a relatively low variability electrical system.
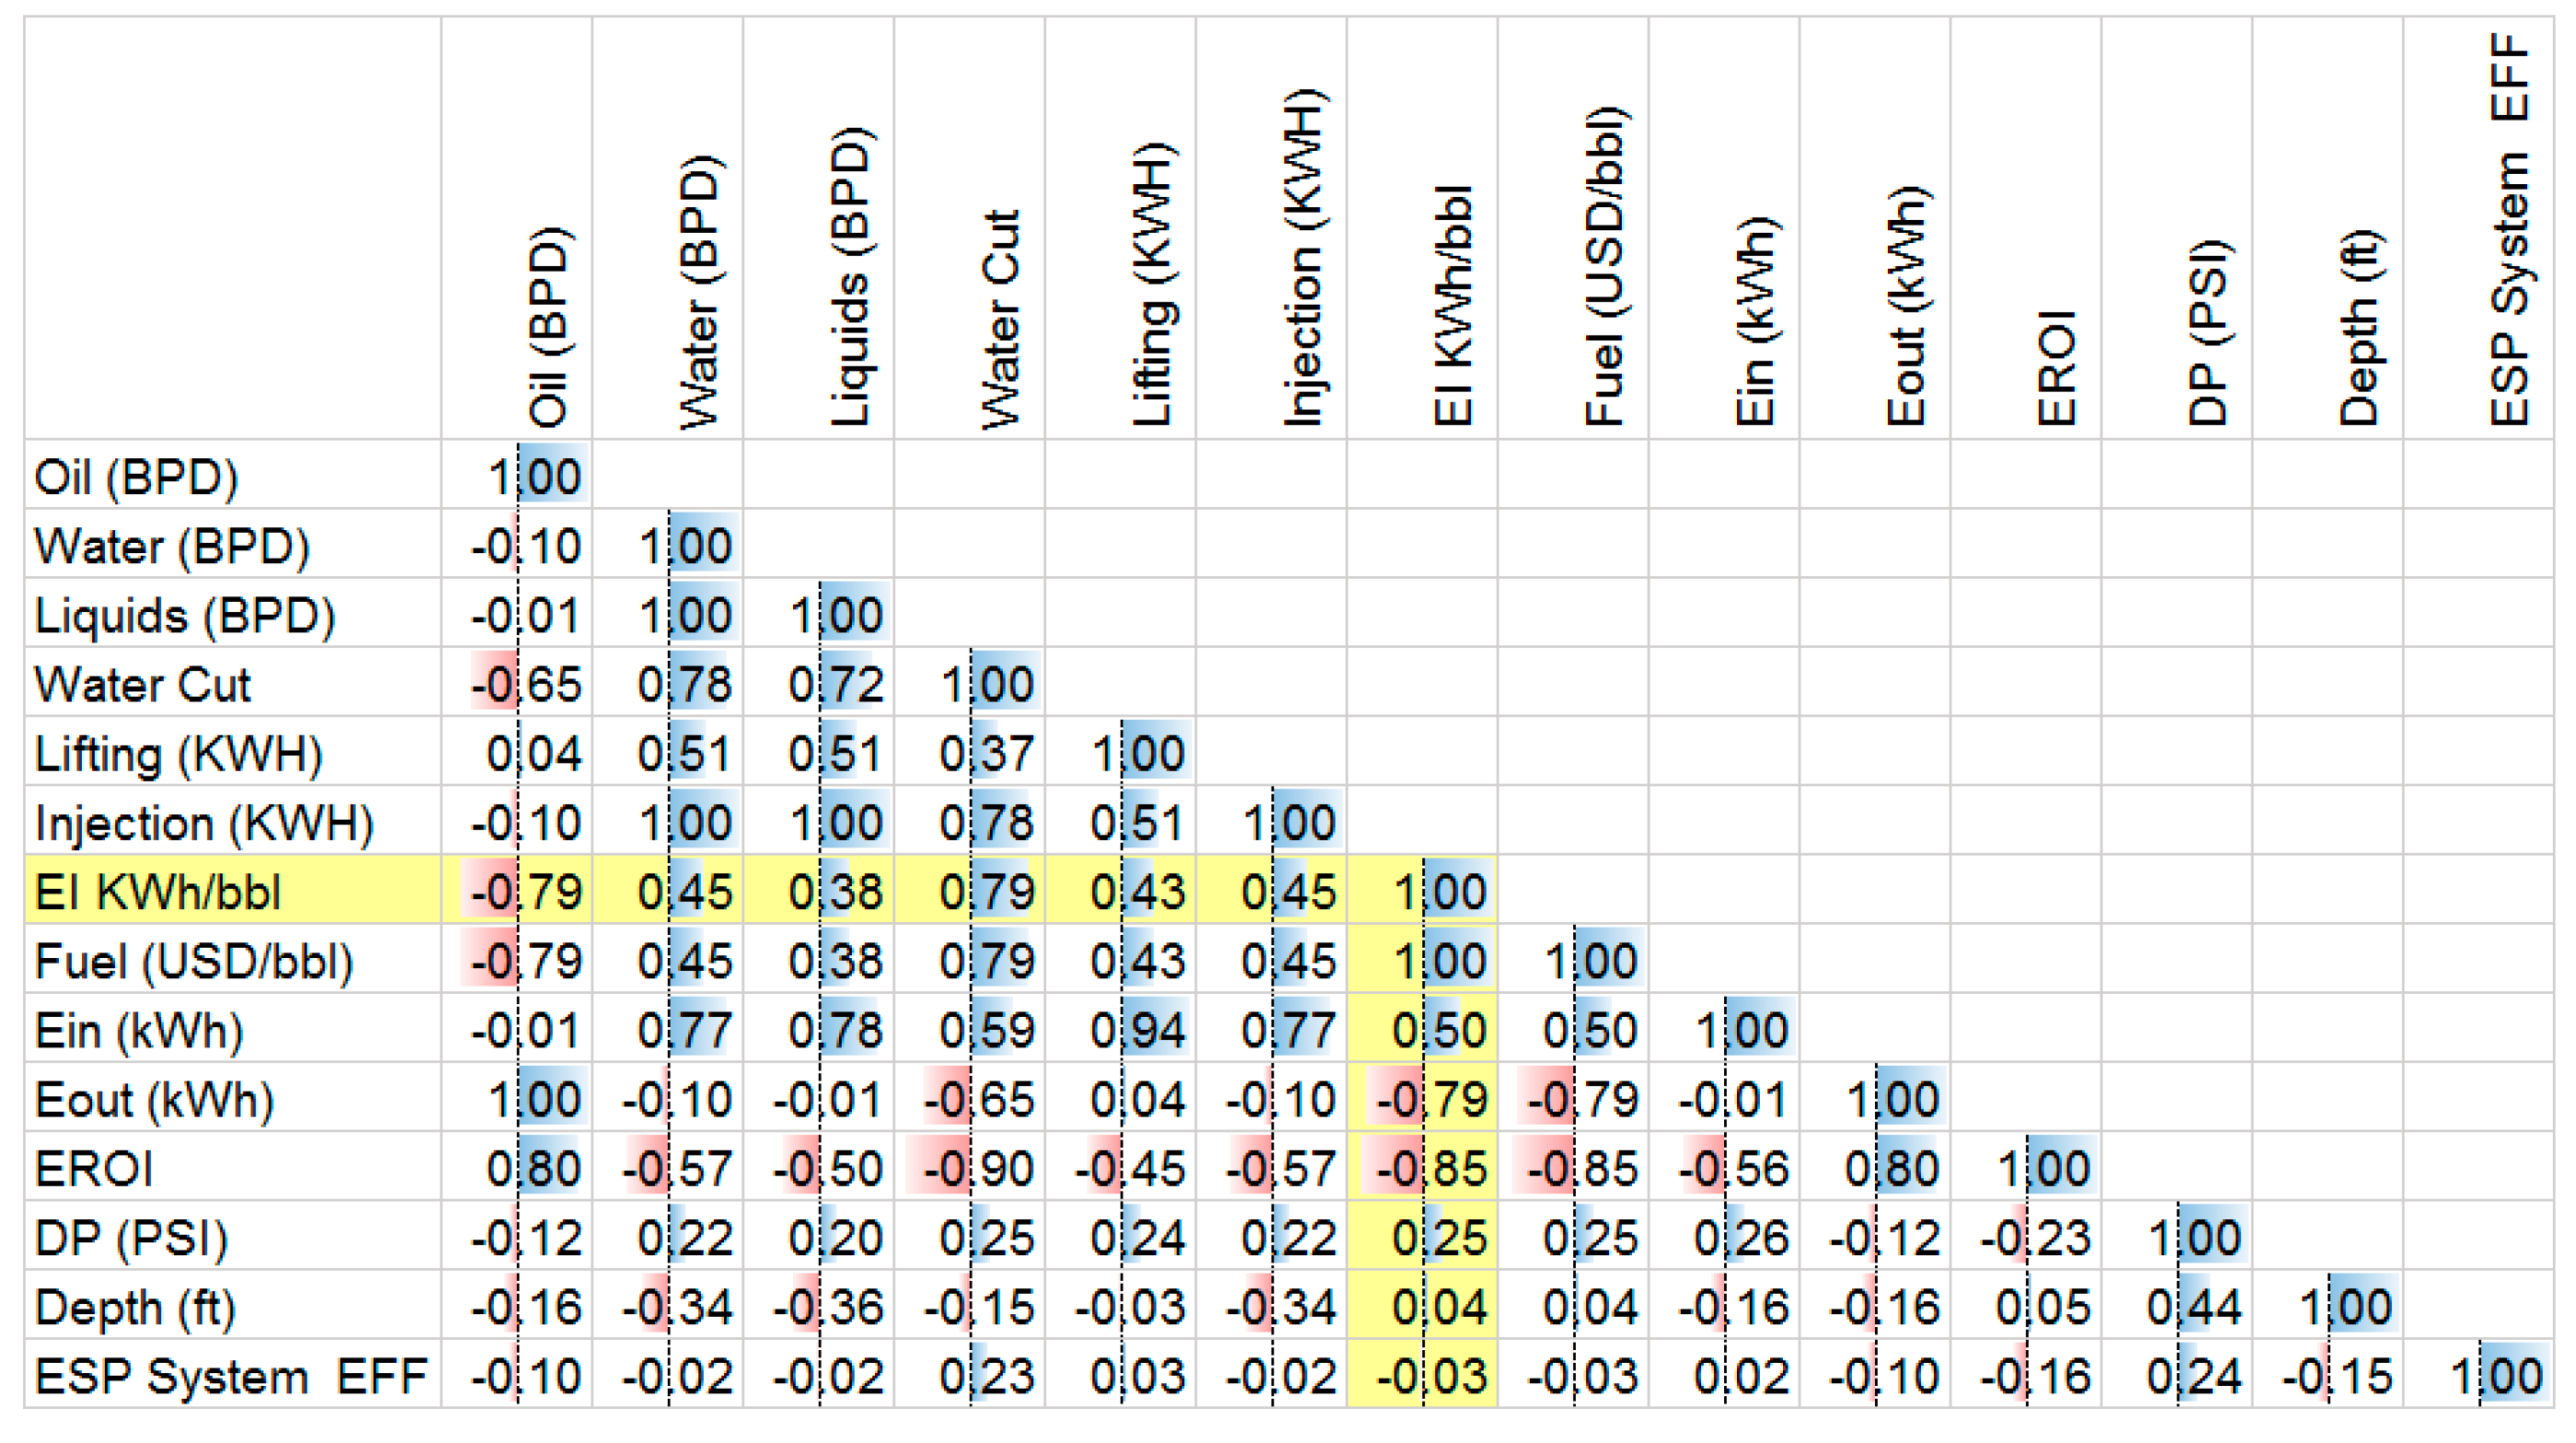
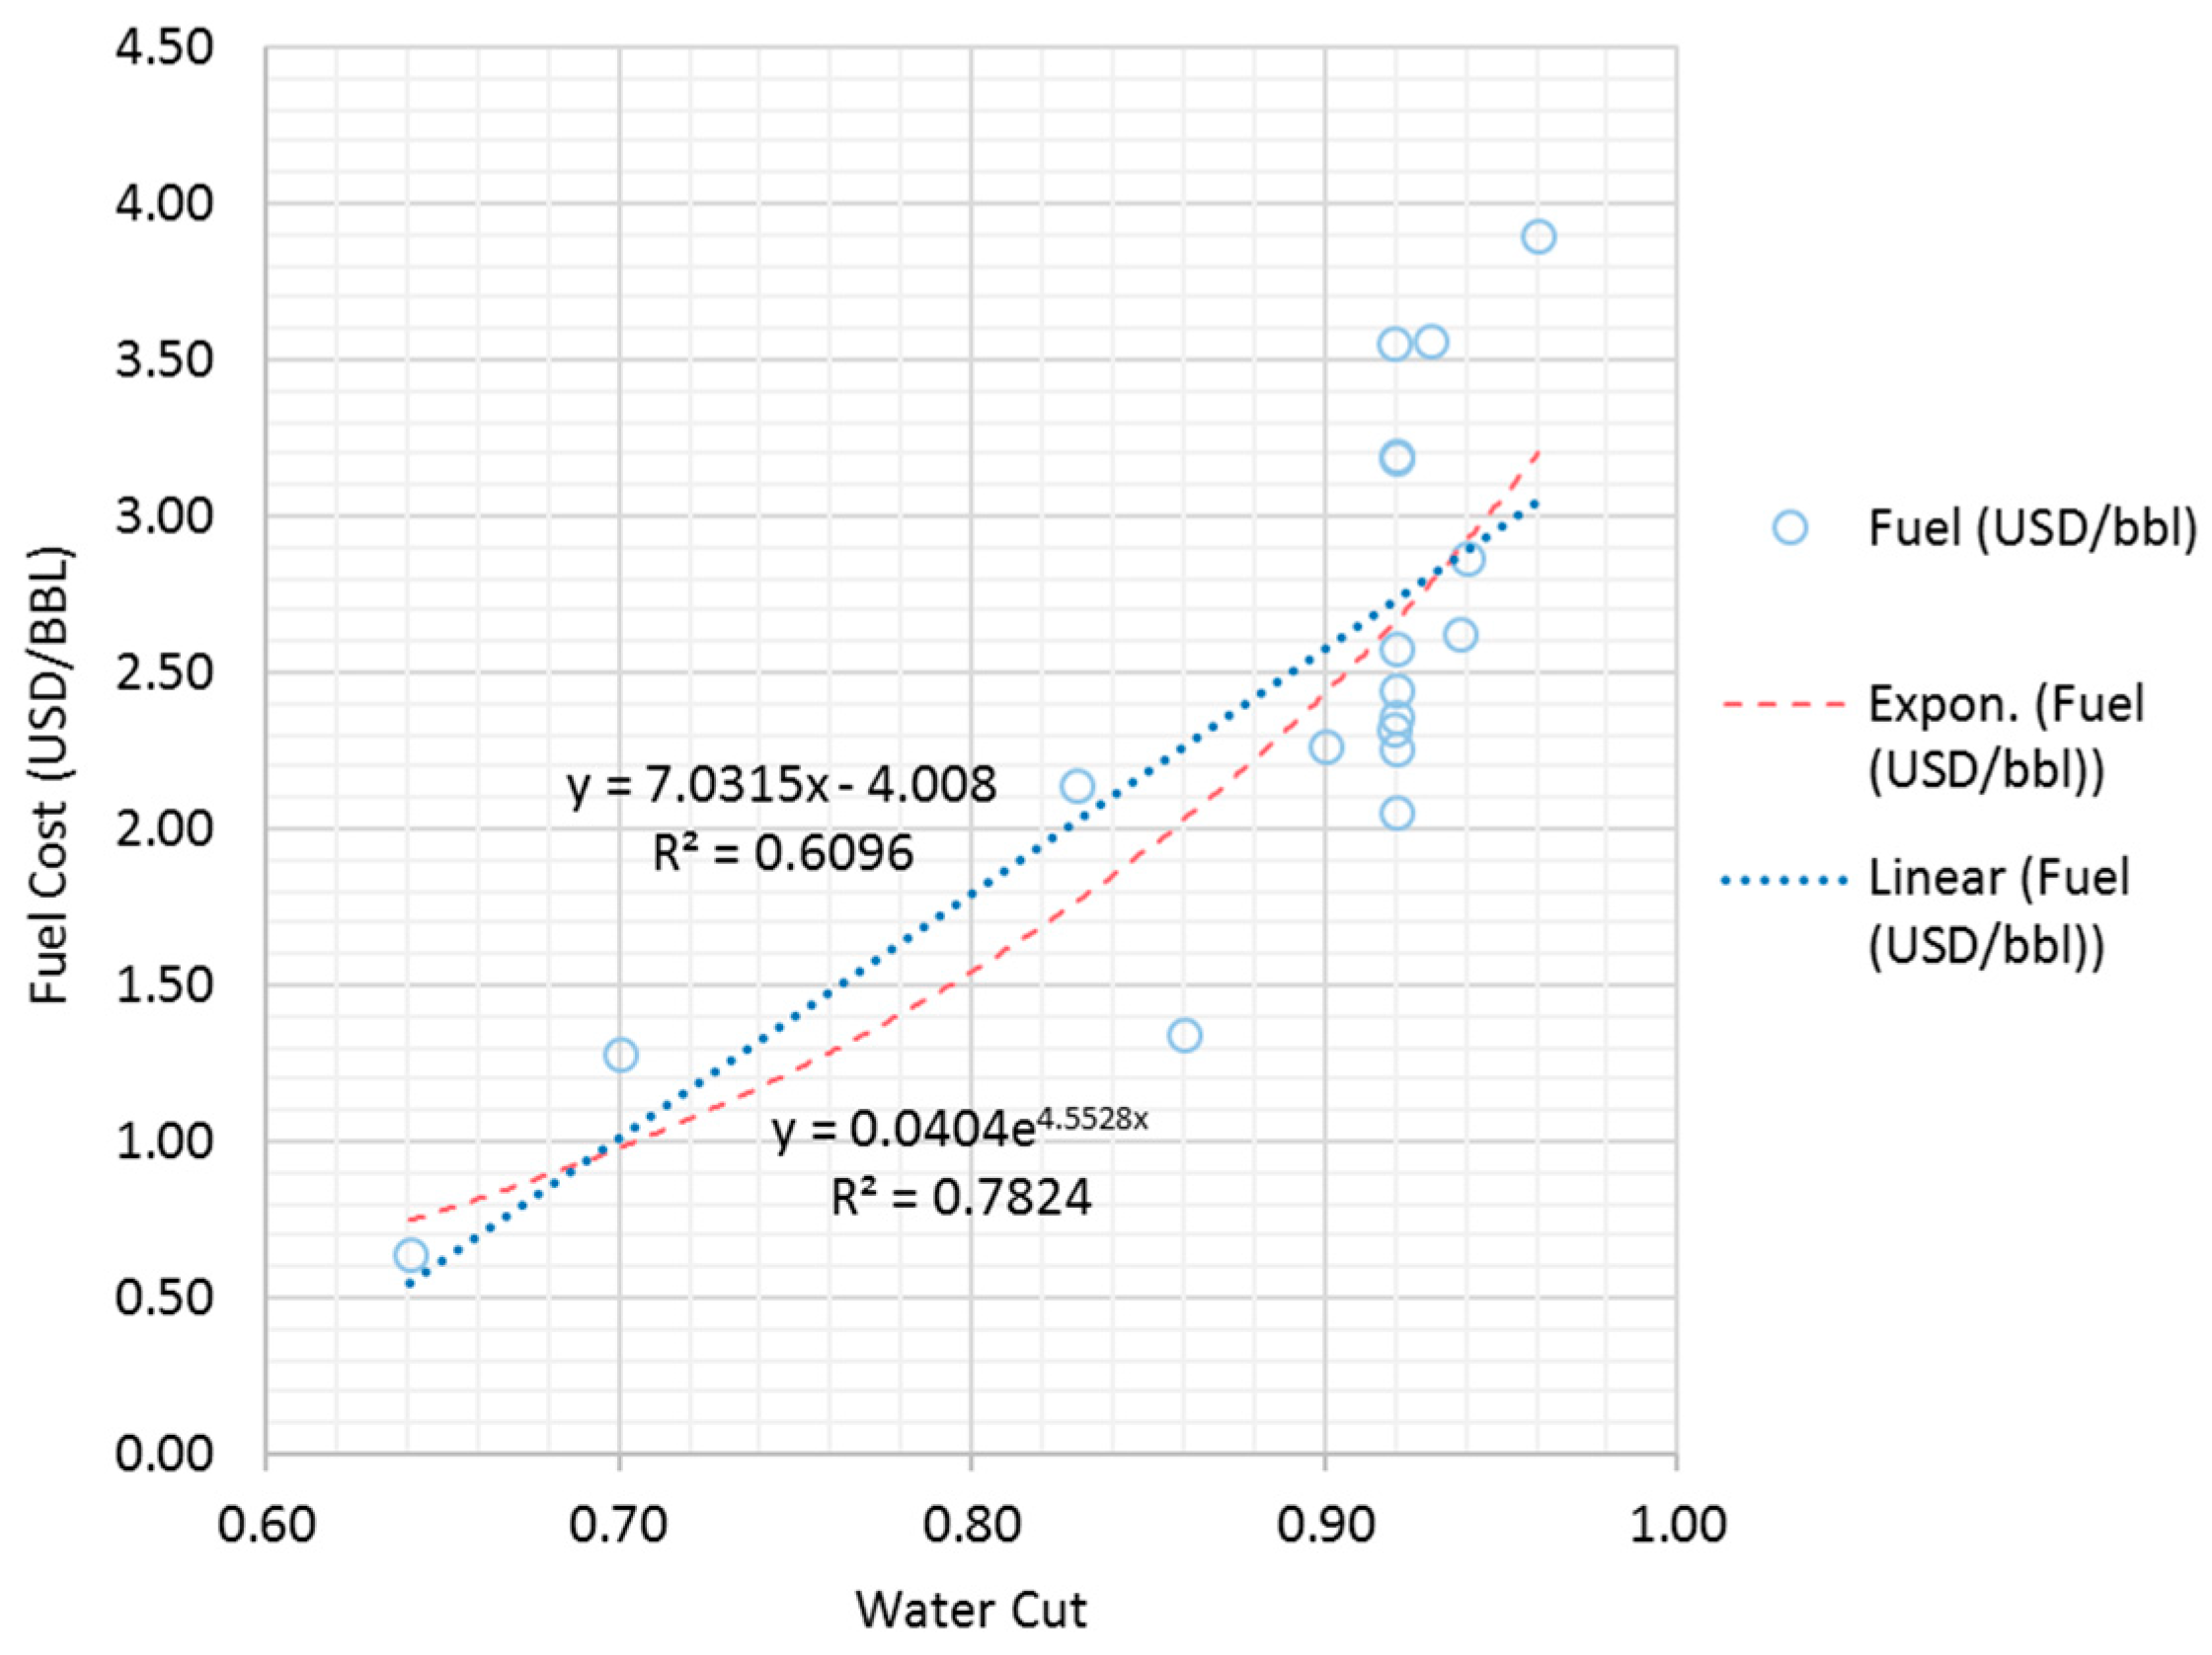
A Pearson correlation matrix was developed in order to better understand the factors that affect the EROI, energy intensity, and fuel costs. This matrix is described by Figure 11. Diesel generators provide the power to the platform exclusively, since there is insufficient quantity of natural gas, therefore imported diesel is the only driver of costs for energy and the energy intensity and fuel costs are directly proportional. Most of the relationships with correlations above 0.7 or below −0.7 are expected, such as the correlation between the water flow rate and the injection energy, or between the produced liquid flow rate and the uplifting energy. An interesting correlation, while not entirely unexpected, was between the water cut and energy intensity, as well as between water cut and EROILifting. Water cut is simply an oilfield term used to describe the fraction of water within the total liquids produced. The water cut exhibited a 0.79 correlation factor with energy intensity and fuel cost, and a 0.90 correlation factor with EROI. While most of the correlations can be explained by obvious causal associations, the relationship between water cut and energy intensity, fuel cost, and EROI is less obvious, and warrants a closer inspection. In Figure 12, the water cut is plotted against the fuel costs. Clearly, the fuel costs increase as the water cut rises. Linear and exponential regression analysis was performed to better understand this relationship. Exponential regression resulted in a higher R squared value of 0.78. The benefit of mathematically modeling this relationship is that operators can potentially use water cut as a means of estimating the fuel costs per barrel of crude. This has significant ramifications to the modeling of future operating expenses. The difficulty lies with comparing wells with water cuts above 0.90, where the accuracy of water cuts measurements tends to be lower due to limitations of equipment and techniques. It is therefore suggested that if the water cut measurements can be improved, this method can be used to quickly the estimate the fuel costs for each well, and as a means to rank the wells in terms of costs and efficiency.
For instance, as displayed in Figure 13, if we are to believe that ESP-06 and ESP-08 have an equivalent water cut of 0.92, with both wells producing the same amount of oil, we might conclude that ESP-06 is superior to ESP-08 due to its lower energy intensity of 10.6 kWh per barrel of crude compared to 11.5 kWh per barrel of crude for ESP-08. Similarly, we might conclude that ESP-02 is superior to ESP-9, due to its lower energy intensity and higher crude production rate.

4. Conclusions

This research examines the energetic and cost performance of individual wells equipped with ESPs. With regards to energy returns, it extends the EROI methodology significantly from its typical application at the global, regional, and field level. Artificial lifting is an inherently energy-intensive process, and as such, it makes sense to understand the net energy derived from each well as described by the EROI parameter. On a more practical level, the energy intensity of each well is an important consideration for operators faced with facility related constraints such as with respect to power and fluids handling; a common situation in offshore fields. Development of lifting costs for each well provides obvious value to the operators in terms of prioritizing wells and increasing the understanding of production economics. When taken together, the energy intensity and the lifting costs parameters provides oil and gas operators with critical information, which can be used to support decision making at the individual well level; decisions about what speed to run the pumps at and which wells to prioritize when faced with operational constraints such as fuel costs, power generation, and process equipment capacities.
The main limitation to this approach is that energy returns, or net energy analysis, as described by the EROI parameter, for individual wells may be considered impracticable information to oil and gas operators. The EROIs of individual wells are calculated by only considering the fuel energy applied, and this typically results in very high EROI values, compared to a more comprehensive field level lifecycle analysis, which takes into account all energies applied such as drilling energy, construction energy, etc. As such, the high EROIs as calculated in this research may provide misleading and overly optimistic information to operators. Conversely, the EI methodology intentionally ignores energy outputs with respect to associated products, such as formation water, gas, and solids. This might lead one to believe that the lifting process is less efficient than it actually is.
While the analysis contained in this paper only delved into ESP equipped wells, a logical extension of this research is to determine energy indicators for different types of artificial lifting, potentially as part of an artificial lifting concept selection methodology in situations where there is no obvious superior artificial lifting technology available, e.g., a comparison of gas lift vs. ESPs.
A number of more detailed conclusions can be reached related to the wells examined in this research:
  • An energy breakdown of a small offshore extraction scheme reveals that artificial lift and water injection are the prevalent consumers of energy. The energy consumed by the platform is distributed to each well based on the well-specific ESP power demand and the proportion of energy used to dispose of its share of produced water.
  • The wells exhibit a wide range of performance in terms of EROI, energy intensity, and lifting cost. This information can be used to rank wells and support decision making with regards to prioritization of wells.
  • The predominant loss of energy in an ESP system is within the pump itself, with hydraulic efficiencies ranging from 0.12 to 0.56. The pump efficiency can be improved by adjusting the speed of the pump, but this may or may not improve the energy intensity, lifting costs, and EROI. Careful analysis of changing pump speeds requires a reassessment of the energy in, energy out, and associated energy intensity and lifting cost intensity.
  • There is little opportunity to improve other factors influencing ESP system efficiencies.
  • The water cut, which is the fraction of water in the produced liquids, is highly correlated to energy intensity. It is suggested that water cut measurements may be used to provide a high-level estimate of lifting costs for each well.
  • There are several wells that exhibit similar flowrates and water cuts but with differing energy intensities and lifting costs. This information has the potential to facilitate well ranking, prioritization, and decision-making, but necessitates a more accurate measurement of water cuts above 0.9.

Author Contributions

Conceptualization, D.G. and D.O.; methodology, D.G. and D.O.; investigation, D.G.; writing—original draft preparation, D.G.; writing—review and editing, D.O.; visualization, D.G.; supervision, D.O. All authors have read and agreed to the published version of the manuscript.

Funding

This research received no external funding.

Conflicts of Interest

The authors declare no conflict of interest.

Appendix A

Table A1. Input data for well level EROI, EI, and fuel costs.
Input Data
ESP Well NumberESP ModelCrude Oil (BPD)Water (BPD)Total Liquids (BPD)Power Lifting (kW)
ESP-1AN2700/128370659102935
ESP-2TE2700/681742002217680
ESP-3TE1500/451532028218177
ESP-4TE2700/681631873203638
ESP-5TE2700/681582480263853
ESP-6TE2700/452592977323672
ESP-7TA2200/25613666279845
ESP-8TE5500/592592977323681
ESP-9TE1500/831681928209688
ESP-10TE2700/681201385150554
ESP-11TE2700/681782041221951
ESP-12TD1750/18222552575047
ESP-13TE5500/592252026225170
ESP-14Flex47/591942234242865
ESP-15TE2700/681582386254447
ESP-16TE2700/681772035221252
ESP-17TE2700/682751692196747
ESP-18TE2700/68821979206133
Table A2. Calculated data for well level EROI, EI, and fuel costs.
Calculated Data
Daily Power Lifting (kWh)Daily Power Water Disposal (kWh)Daily Power Misc. (kWh)EI (kWh/bbl)Ein (kWh)Eout (kWh)EROIFuel Cost (USD/BBL)
835210683.01114628,7805650.64
19086396815.02616295,6971133.20
18466486816.72562260,0091023.56
905598689.61571277,0031762.05
12697926813.52129268,5061262.87
17299516810.62748440,1461602.26
10892116810.11368231,1191692.14
19539516811.52972440,1461482.44
21226166816.72805285,5001023.55
12884426815.01798203,9291133.19
12246526810.91943302,4941562.32
1121168686.01357382,3662821.28
16806476810.62395382,3661602.26
15707146812.12351329,6851402.58
11177626812.31947268,5061382.62
12416506811.11959300,7951542.36
1126540686.31735467,3372691.34
8026326818.31502139,351933.90
Table A3. Input data for detailed ESP system energy balances.
Input Data
ESP Well NumberESP ModelTrue Vertifical Depth (feet)Crude Oil (BPD)Water (BPD)Total Liquids (BPD)Specific GravityVoltage out of VSD (Volts)Amperage out of VSD (Amperes)
ESP-1AN2700/128560837065910290.9330466
ESP-2TE2700/684849174200221760.98392117
ESP-3TE1500/452462153202821810.9946496
ESP-4TE2700/685407163187320360.9830472
ESP-5TE2700/685432158248026380.9932095
ESP-6TE2700/453455259297732360.9846490
ESP-7TA2200/25650001366627980.97256102
ESP-8TE5500/595164259297732360.98344137
ESP-9TE1500/834990168192820960.98400128
ESP-10TE2700/682593120138515050.9832097
ESP-11TE2700/683975178204122190.9833688
ESP-12TD1750/18273642255257500.9442464
ESP-13TE5500/593780225202622510.98312130
ESP-14Flex47/595000194223424280.98320118
ESP-15TE2700/685802158238625440.9932084
ESP-16TE2700/686330177203522120.9832093
ESP-17TE2700/683767275169219670.9732883
ESP-18TE2700/68387582197920610.9928069
Table A4. Calculated data for detailed ESP system energy balances.
Calculated Data
Power out of VSD (kW)Power out of Transformer (kW)Downhole Cable Voltage Drop (Volts)Power into ESP Motor (kW)Surface Electrical Loss (kW)Cable Electrical Loss (kW)Motor Electrical Loss (kW)Frictional Hydraulic Loss (HP)Backpressure Hydraulic loss (HP)ESP Pump Hydraulic Loss (HP)Uplift (HP)Electrical EfficiencyHydraulic EfficiencyOverall Efficiency
353336321.740.764.850.322.2230.473.800.790.170.14
807649743.981.6111.092.503.5072.705.530.790.140.11
777325723.850.7910.841.283.5872.664.830.800.120.09
383627351.890.4312.742.314.2417.616.210.600.420.25
535034492.640.759.904.8710.7128.369.120.750.470.35
726835673.601.0410.115.5210.1047.8113.370.800.380.30
454351412.271.608.300.153.0838.043.230.730.150.11
817752764.071.6518.928.2612.2338.2117.380.700.500.35
888463824.422.3112.252.3114.2061.2915.260.790.340.27
545116512.680.3610.120.476.4439.188.180.750.280.21
514825482.550.539.582.176.4742.75−0.020.750.170.13
474447432.340.906.520.171.8138.569.000.790.220.18
706638653.501.1116.342.147.8346.019.750.700.300.21
656244613.271.1212.202.1411.8838.0713.330.750.420.31
474437442.330.7110.882.149.3919.1313.100.700.560.39
524940482.590.869.652.145.6836.267.690.750.300.22
474524442.350.4611.032.148.0025.149.080.710.430.31
333220311.670.279.442.144.4711.2211.700.660.620.41

References

  1. Murphy, D.J.; Hall, C.A.; Dale, M.; Cleveland, C. Order from chaos: A preliminary protocol for determining the EROI of fuels. Sustainability 2011, 3, 1888–1907. [Google Scholar] [CrossRef] [Green Version]
  2. Guilford, M.C.; Hall, C.A.; O’Connor, P.; Cleveland, C.J. A new long term assessment of energy return on investment (EROI) for US oil and gas discovery and production. Sustainability 2011, 3, 1866–1887. [Google Scholar] [CrossRef] [Green Version]
  3. Poisson, A.; Hall, C.A. Time series EROI for Canadian oil and gas. Energies 2013, 6, 5940–5959. [Google Scholar] [CrossRef] [Green Version]
  4. Nogovitsyn, R.; Sokolov, A. Preliminary Calculation of the EROI for the Production of Gas in Russia. Sustainability 2014, 6, 6751–6765. [Google Scholar] [CrossRef] [Green Version]
  5. King, C.W.; Hall, C.A. Relating financial and energy return on investment. Sustainability 2011, 3, 1810–1832. [Google Scholar] [CrossRef] [Green Version]
  6. Brandt, A.R.; Sun, Y.; Bharadwaj, S.; Livingston, D.; Tan, E.; Gordon, D. Energy return on investment (EROI) for forty global oilfields using a detailed engineering-based model of oil production. PLoS ONE 2015, 10, e0144141. [Google Scholar] [CrossRef] [PubMed] [Green Version]
  7. Tripathi, V.S.; Brandt, A.R. Estimating decades-long trends in petroleum field energy return on investment (EROI) with an engineering-based model. PLoS ONE 2017, 12, e0171083. [Google Scholar] [CrossRef] [PubMed]
  8. Cleveland, C.J. Energy quality and energy surplus in the extraction of fossil fuels in the US. Ecol. Econ. 1992, 6, 139–162. [Google Scholar] [CrossRef]
  9. Herendeen, R.A.; Cleveland, C. Net energy analysis: Concepts and methods. Encycl. Energy 2004, 4, 283–289. [Google Scholar]
  10. Gagnon, N.; Hall, C.A.; Brinker, L. A preliminary investigation of energy return on energy investment for global oil and gas production. Energies 2009, 2, 490–503. [Google Scholar] [CrossRef]
  11. Brandt, A.R. Oil depletion and the energy efficiency of oil production: The case of California. Sustainability 2011, 3, 1833–1854. [Google Scholar] [CrossRef] [Green Version]
  12. Neely, B.; Gipson, F.; Clegg, J.; Capps, B.; Wilson, P. Selection of artificial lift method. In Proceedings of the 56th Annual Fall SPE Technical Conference and Exhibition of AIME, San Antonio, Texas, USA, 5–7 October 1981. [Google Scholar]
  13. Clegg, J.; Bucaram, S.; Hein, N. Recommendations and comparisons for selecting artificial-lift methods (includes associated papers 28645 and 29092). J. Pet. Technol. 1993, 45, 1, 121–128, 167. [Google Scholar] [CrossRef]
  14. Lea, J.F.; Nickens, H.V. Selection of artificial lift. In Proceedings of the SPE Mid-Continent Operations Symposium, Oklahoma City, OK, USA, 28–31 March 1999. [Google Scholar]
  15. Oyewole, P. Artificial Lift Selection Strategy to Maximize Unconventional Oil and Gas Assets Value. In Proceedings of the SPE North America Artificial Lift Conference and Exhibition, Woodlands, TX, USA, 25–27 October 2016. [Google Scholar]
  16. Kefford, P.; Gaurav, M. Well Performance Calculations for Artificial Lift Screening. In Proceedings of the SPE Annual Technical Conference and Exhibition, Dubai, UAE, 26–28 September 2016. [Google Scholar]
Figure 1. Overall lifting energy balance.
Energies 13 00302 g001
Figure 2. Electrical submersible pumps (ESP) system configuration.
Energies 13 00302 g002
Figure 3. ESP system electrical and hydraulic components.
Energies 13 00302 g003
Figure 4. Example pump curves–1 stage at 60 HZ.
Energies 13 00302 g004
Figure 5. Example ESP motor efficiency curve.
Energies 13 00302 g005
Figure 6. Electrical and hydraulic components of an ESP system.
Energies 13 00302 g006
Figure 7. EROI-lifting and energy intensity for 18 ESP systems.
Energies 13 00302 g007
Figure 8. Energy balance for ESP-06.
Energies 13 00302 g008
Figure 9. ESP Hydraulic, electrical, and overall efficiencies.
Energies 13 00302 g009
Figure 10. ESP Hydraulic, electrical, and overall losses.
Energies 13 00302 g010
Figure 11. Correlation matrix.
Energies 13 00302 g011
Figure 12. Water cut plotted against fuel costs.
Energies 13 00302 g012
Figure 13. Comparison of ESP systems.
Energies 13 00302 g013
Table 1. Previous energy return on investment (EROI) studies.
Year PublishedAuthor/sSectorMethodPeriodEROI Range
1992 [8]Cutler J. ClevelandUS petroleumTop Down: Converting published production rates to energy out and published direct costs to energy in.1954 to 198410 to 15
Unclear Trend
2004 [9]Cutler J. ClevelandUS petroleumTop Down: Converting published production rates to energy out and published direct costs to energy in.1954 to 199416 to 24
Unclear Trend
2009 [10]Gagnon N., et al.Global petroleumTop Down: Converting published production rates to energy out and published direct costs to energy in.1992 to 200625 to 20
Unclear Trend
2011 [11]Brandt., Adam R.California petroleumBottom-Up: Converting published production rates to energy out and engineering estimates for energy in.1950 to 201065 to 10
Decreasing Trend
2011 [2]Guilford, M., et al.US petroleumTop Down: Converting published production rates to energy out and published direct costs to energy in.1920 to 201024 to 15
Unclear Trend
2013 [3]Poisson and HallCanadian petroleumTop Down: Converting published production rates to energy out and published direct costs to energy in.1990 to 201017 to 14
Unclear Trend
2014 [4]Nogovitsyn and SokolovRussia petroleumTop Down: Converting published production rates to energy out and published direct costs to energy in.2005 to 201236 to–30
Unclear Trend
2017 [7]Tripathi and BrandtCantarell, MexicoBottom-Up Converting published production rates to energy out and engineering estimates for energy in.1978 to 201270 to 8
Decreasing Trend
2017 [7]Tripathi and BrandtForties, North SeaBottom Up Converting published production rates to energy out and engineering estimates for energy in.1974 to 199927 to 15
Decreasing Trend
2017 [7]Tripathi and BrandtMidway-Sunset, CaliforniaBottom Up Converting published production rates to energy out and engineering estimates for energy in.1965 to 200710 to 5
Decreasing Trend
2017 [7]Tripathi and BrandtPrudhoe Bay, Alaska 1977 to 200419 to 7
Decreasing Trend
Table 2. Provided and derived ESP data per well.
Provided DataCalculated Data
Crude Oil Rate (BPD)Daily Lifting Energy (kWh)
Water Rate (BPD)Daily Water Disposal Energy (kWh)
Voltage out of VSD (Volts)Daily Energy In (kWh)
Amperage out of VSD (Amperes)Daily Energy Out (kWh)
Energy Intensity (kWh/BBL)
EROI
Fuel Cost (USD/BBL)
Table 3. Provided and derived ESP data.
Provided DataCalculated Data
ESP ModelPower out of VSD (kW)
True Vertical Depth (feet)Power out of Transformer (kW)
Crude Oil Rate Per Well (BPD)Downhole Cable Voltage Drop (Volts)
Water Rate Per Well (BPD)Power into ESP motor (kW)
Specify Gravity Per WellSurface Equipment Electrical Losses (kW)
Voltage out of VSD (Volts)Downhole Cable Electrical Losses (kW)
Amperage out of VSD (Amperes)ESP Motor Electrical Losses (kW)
TransformerFrictional Hydraulic Losses (HP)
Backpressure Hydraulic Losses (HP)
ESP Pump Hydraulic Losses (HP)
Uplifting Energy (HP)
Electrical Efficiency
Hydraulic Efficiency
Overall Efficiency