Multi-Horizon Dependence between Crude Oil and East Asian Stock Markets and Implications in Risk Management
Abstract
1. Introduction
2. Model Specification
2.1. Marginal Distribution Models
2.2. Maximal Overlap Discrete Wavelet Transform (MODWT)
2.2.1. Discrete Wavelet Transform (DWT) and DWT-Based Multi-Resolution Analysis
2.2.2. MODWT and MODWT-Based Multi-Resolution Analysis
2.3. Copula Functions
2.4. Estimation Method
3. Data
4. Empirical Results
5. Risk Management Analysis
6. Conclusions
Author Contributions
Funding
Conflicts of Interest
Appendix A. Copula Functions
References
- Arouri, M.H.; Hammoudeh, S.; Lahiani, A.; Nguyen, D.K. On the Short- and Long-run Efficiency of Energy and Precious Metal Markets. Energy Econ. 2013, 40, 832–844. [Google Scholar] [CrossRef]
- Daskalaki, C.; Skiadopoulos, G. Should Investors Include Commodities in Their Portfolios After All? New Evidence. J. Bank. Financ. 2011, 35, 2606–2626. [Google Scholar] [CrossRef]
- Arouri, M.H.; Nguyen, D.K. Oil prices, stock markets and portfolio investment: Evidence from sector analysis in Europe over the last decade. Energy Policy 2010, 38, 4528–4539. [Google Scholar] [CrossRef]
- Avdulaj, K.; Barunik, J. Are benefits from oil-stocks diversification gone? New evidence from a dynamic copula and high frequency data. Energy Econ. 2015, 51, 31–44. [Google Scholar] [CrossRef]
- Balcilar, M.; Ozdemir, Z.A. The causal nexus between oil prices and equity market in the U.S.: A regime switching model. Energy Econ. 2013, 39, 271–282. [Google Scholar] [CrossRef]
- Hayate, G. Linking the gas and oil markets with the stock market: Investigating the U.S. relationship. Energy Econ. 2016, 53, 5–15. [Google Scholar]
- Huang, S.; Haizhong, A.; Gao, X.; Sun, X. Do oil price asymmetric effects on the stock market persist in multiple time horizons? Appl. Energy 2017, 185, 1799. [Google Scholar] [CrossRef]
- Sadorsky, P. The macroeconomic determinants of technology stock price volatility. Rev. Financ. Econ. 2003, 12, 191–205. [Google Scholar] [CrossRef]
- Sadorsky, P. Correlations and volatility spillovers between oil prices and the stock prices of clean energy and technology companies. Energy Econ. 2012, 1, 248–255. [Google Scholar] [CrossRef]
- Dent, C.M. Paths ahead for East Asia and Asia-Pacific regionalism. Int. Aff. 2013, 89, 963–985. [Google Scholar] [CrossRef]
- Cai, X.J.; Hamori, S. Business cycle volatility and hot money in emerging east Asian markets. In Financial Linkages, Remittances, and Resource Dependence in East Asia; WSPC: Albemarle, NC, USA, 2015; pp. 59–80. [Google Scholar]
- Cai, X.J.; Tian, S.; Yuan, N.; Hamori, S. Interdependence between oil and East Asian stock markets: Evidence from wavelet coherence analysis. J. Int. Financ. Mark. Inst. Money 2001, 48, 206–223. [Google Scholar] [CrossRef]
- Shin, E.; Savage, T. Joint stockpiling and emergency sharing of oil: Arrangements for regional cooperation in East Asia. Energy Policy 2011, 39, 2817–2823. [Google Scholar] [CrossRef]
- Ciner, C. Energy shocks and financial markets: Nonlinear linkages. Stud. Nonlinear Dyn. Econom. 2017, 5, 1–11. [Google Scholar]
- Fratzscher, M.; Schneider, D.; Van Robays, I. Oil Prices, Exchange Rates and Asset Prices; ECB Working Paper Series (1689) (July); European Central Bank: Frankfurt, Germany, 2014. [Google Scholar]
- Bjørnland, H.C. Oil price shocks and stock market booms in an oil exporting country. Scott. J. Political Econ. 2009, 56, 232–254. [Google Scholar] [CrossRef]
- Jammazi, R.; Reboredo, J.C. Dependence and risk management in oil and stock markets. A wavelet-copula analysis. Energy 2016, 107, 866–888. [Google Scholar] [CrossRef]
- Jia, X.; An, H.; Fang, W.; Sun, X.; Huang, X. How do correlations of crude oil prices co-move? A grey correlation-based wavelet perspective. Energy Econ. 2015, 49, 588–598. [Google Scholar] [CrossRef]
- Glosten, L.R.; Jagannathan, R.; Runkle, D.E. On the relation between the expected values and the volatility of the nominal excess return on stocks. J. Financ. 1993, 48, 1779–1801. [Google Scholar] [CrossRef]
- Hansen, B.E. Autoregressive conditional density estimation. Int. Econ. Rev. 1994, 35, 705–730. [Google Scholar] [CrossRef]
- Percival, D.B.; Mofjeld, H. Analysis of subtidal coastal sea level fluctuations using wavelets. J. Am. Stat. Assoc. 1997, 92, 868–880. [Google Scholar] [CrossRef]
- Percival, D.B.; Walden, A.T. Wavelet Methods for Time Series Analysis; Cambridge University Press: Cambridge, UK, 2000. [Google Scholar]
- Serroukh, A.; Walden, A.T.; Percival, D.B. Statistical properties and uses of the wavelet variance estimator for the scale analysis of time series. J. Am. Stat. Assoc. 2000, 95, 184–196. [Google Scholar] [CrossRef]
- Daubechies, I. Ten Lectures on Wavelets; SIAM: Philadelphia, PA, USA, 1992. [Google Scholar]
- Barnes, J.A.; Chi, A.R.; Cutler, L.S.; Healey, D.J.; Leeson, D.B.; Mcgunigal, T.E.; Mullen, J.A.; Smith, W.L.; Sydnor, R.L.; Vessot, R.F.C.; et al. Characterization of frequency stability. IEEE Trans. Instrum. Meas. 1971, 20, 105–120. [Google Scholar] [CrossRef]
- Liang, J.; Parks, T.W. A translation-invariant wavelet representation algorithm with applications. IEEE Trans. Signal Porcess. 1996, 44, 225–232. [Google Scholar] [CrossRef]
- Martín-Barragán, B.; Ramos, S.B.; Veiga, H. Correlations between oil and stock markets: A wavelet-based approach. Econ. Model. 2015, 50, 212–227. [Google Scholar] [CrossRef]
- Shensa, M.J. The discrete wavelet transform: Wedding the àtrous and mallat algorithms. IEEE Trans. Signal Process. 1992, 40, 2464–2482. [Google Scholar] [CrossRef]
- Gourène, G.A.Z.; Mendy, P.; Ake, G.M.N. Multiple time-scales analysis of global stock markets spillovers effects in African stock markets. Int. Econ. 2019, 157, 82–98. [Google Scholar] [CrossRef]
- Patton, A.J. Modeling asymmetric exchange rate dependence. Int. Econ. Rev. 2006, 47, 527–556. [Google Scholar] [CrossRef]
- Sklar, A. Fonctions de Repartition à n Dimensions et Leurs Marges; Publications de l’Institut de Statistique de l’Universite de Paris: Paris, France, 1959; Volume 8, pp. 229–231. [Google Scholar]
- Hong, H.G.; Stein, J. A unified theory of underreaction, momentum trading and overreaction in asset markets. J. Financ. 1999, 54, 2143–2148. [Google Scholar] [CrossRef]
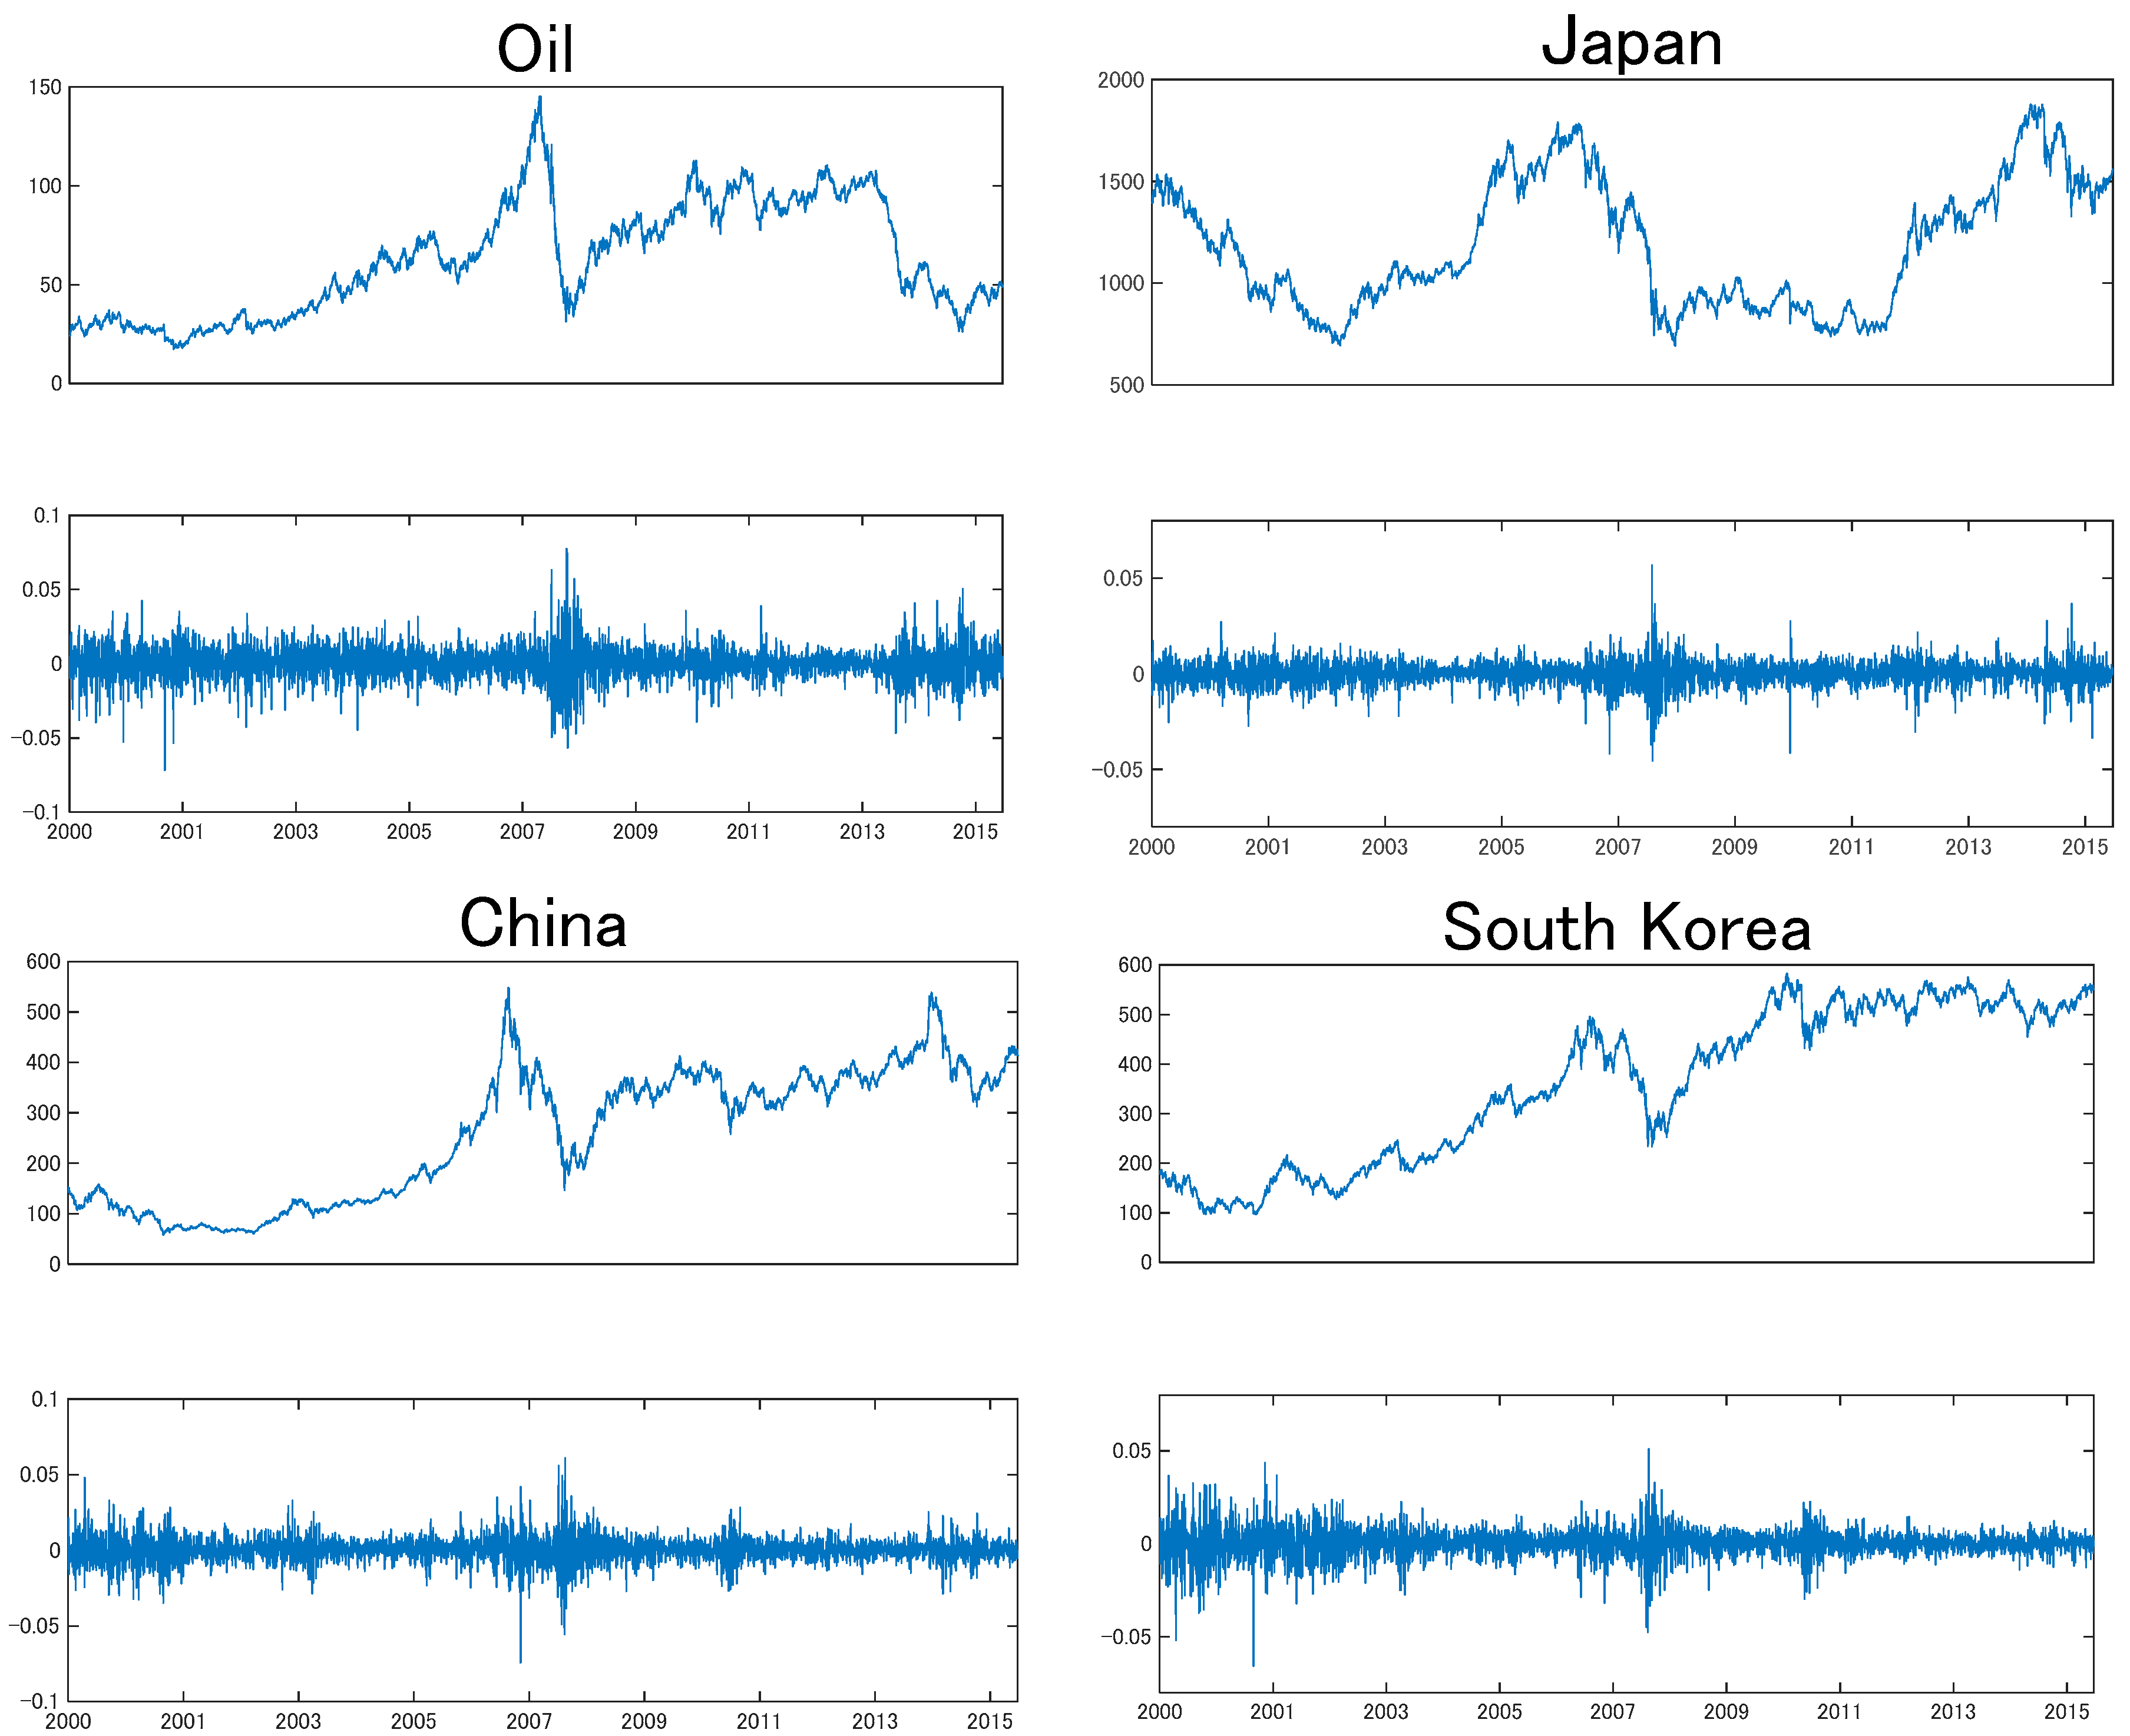
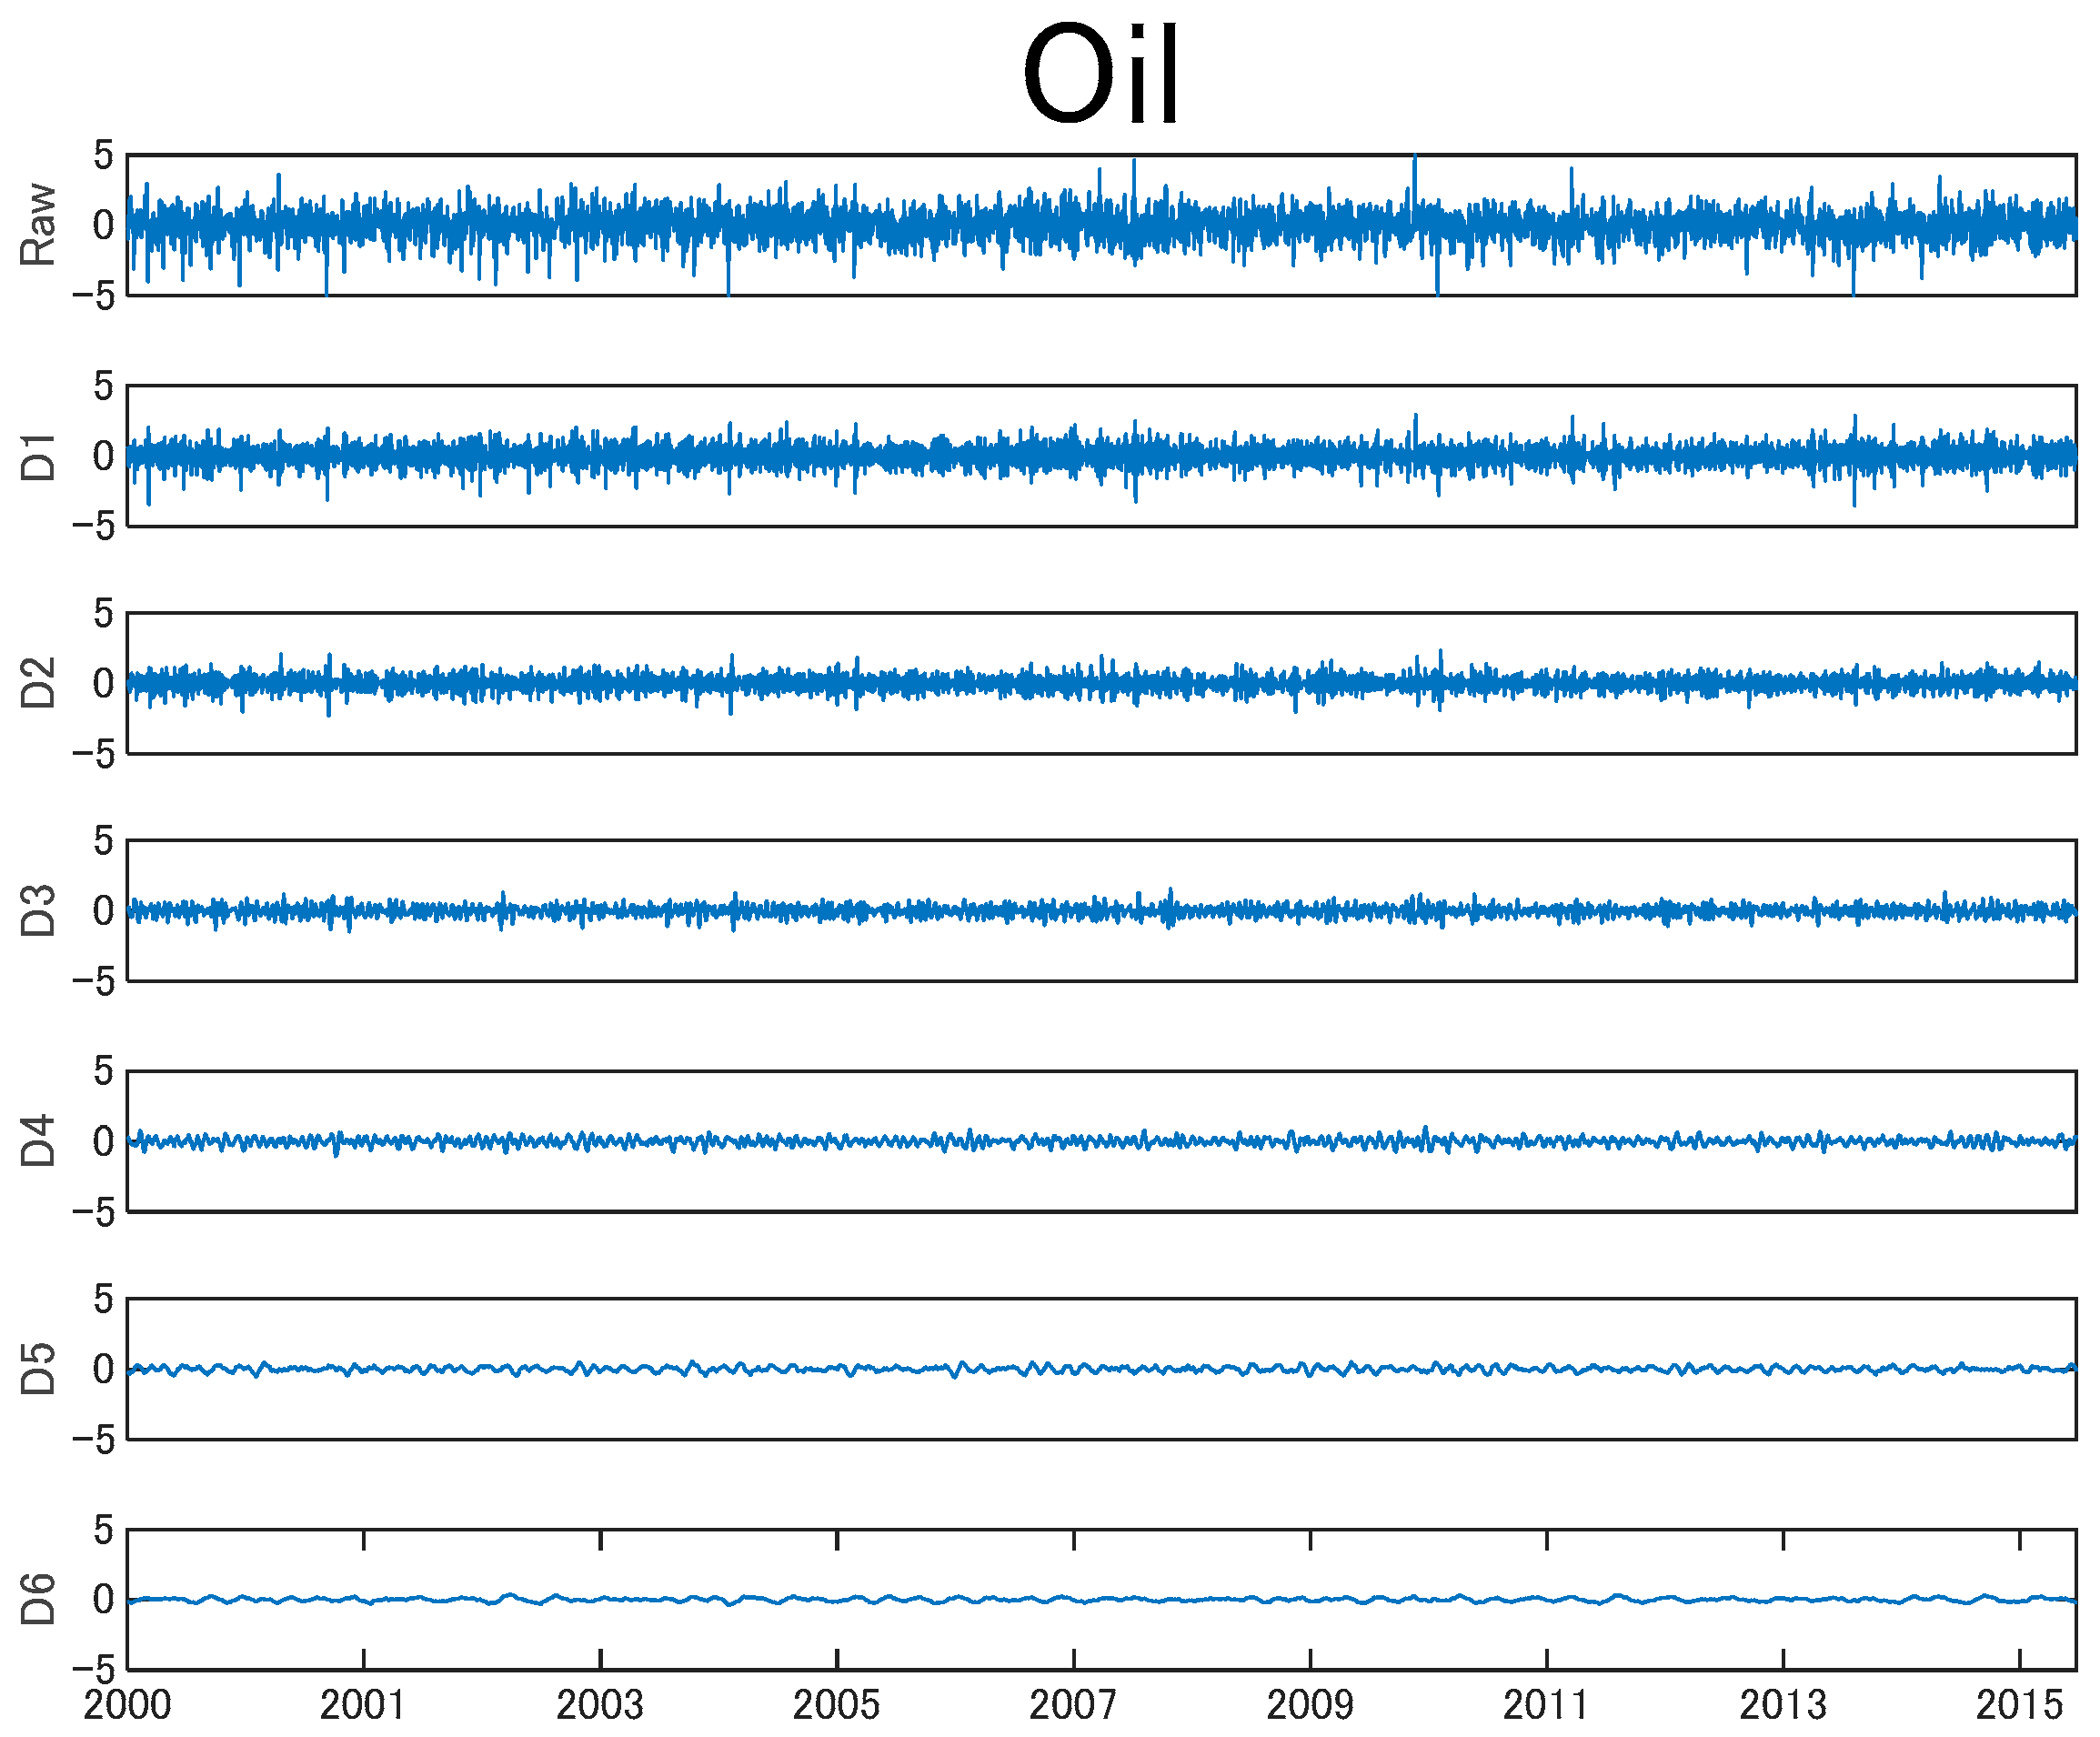
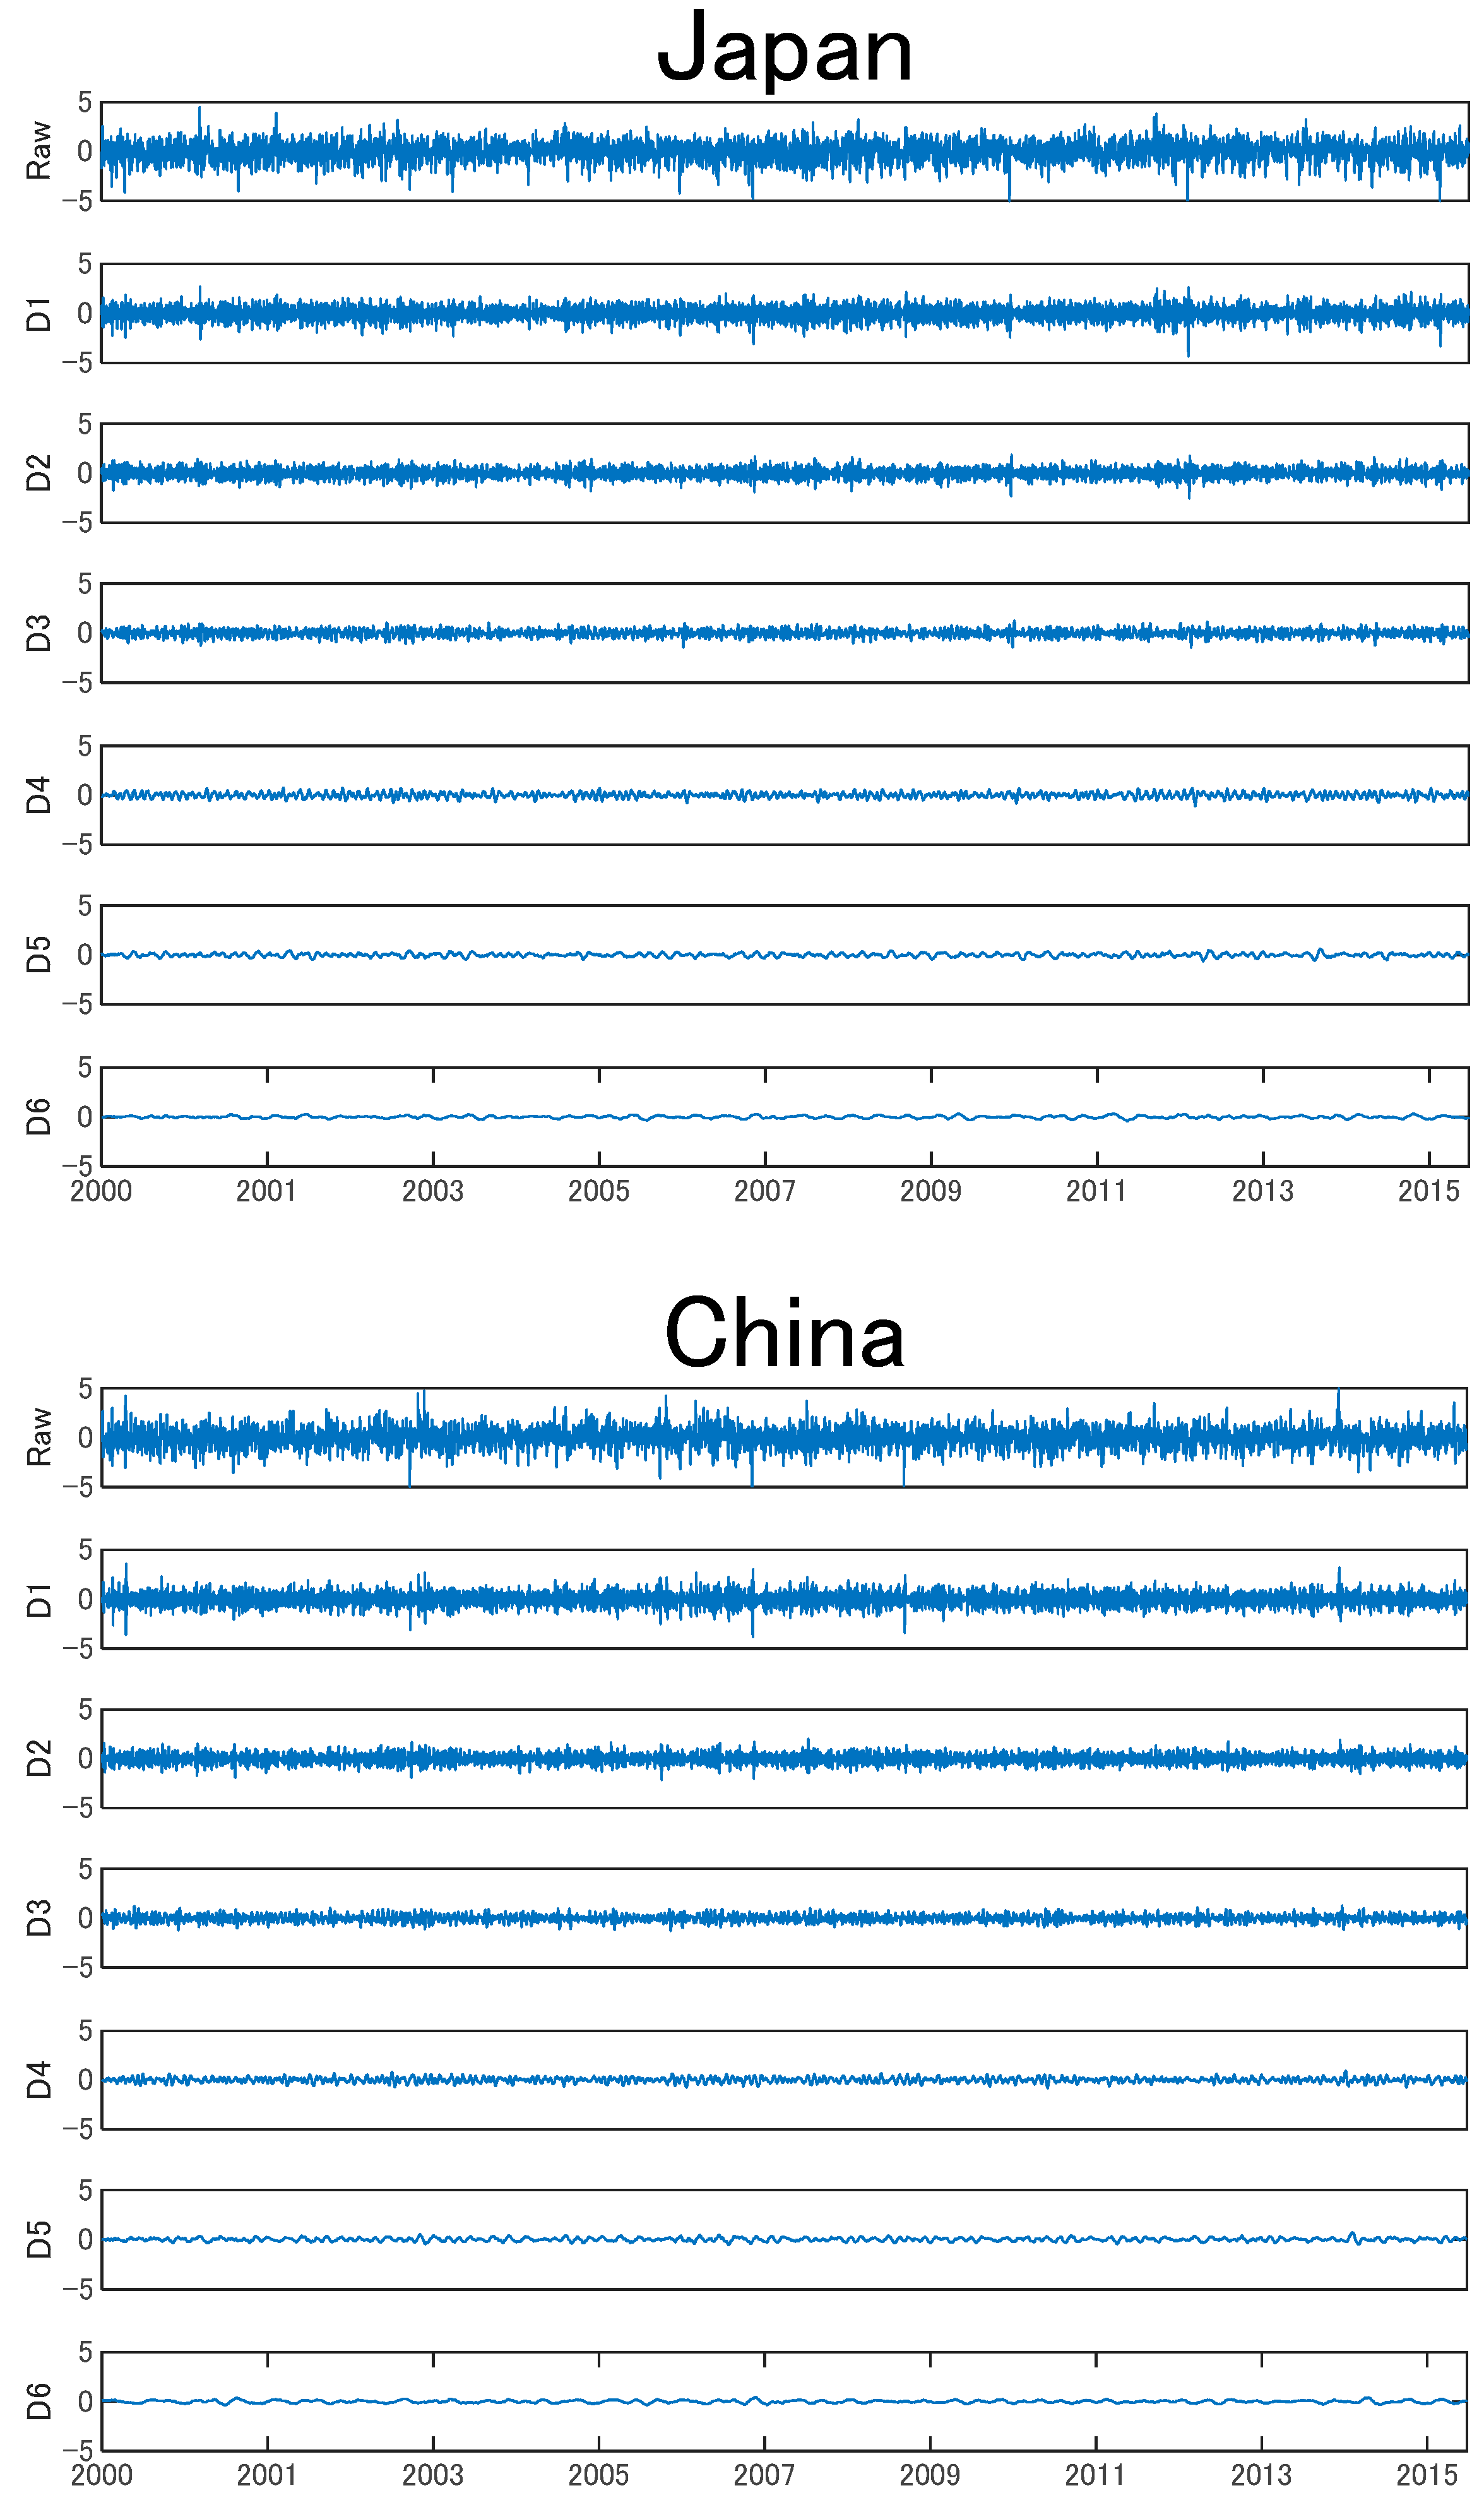
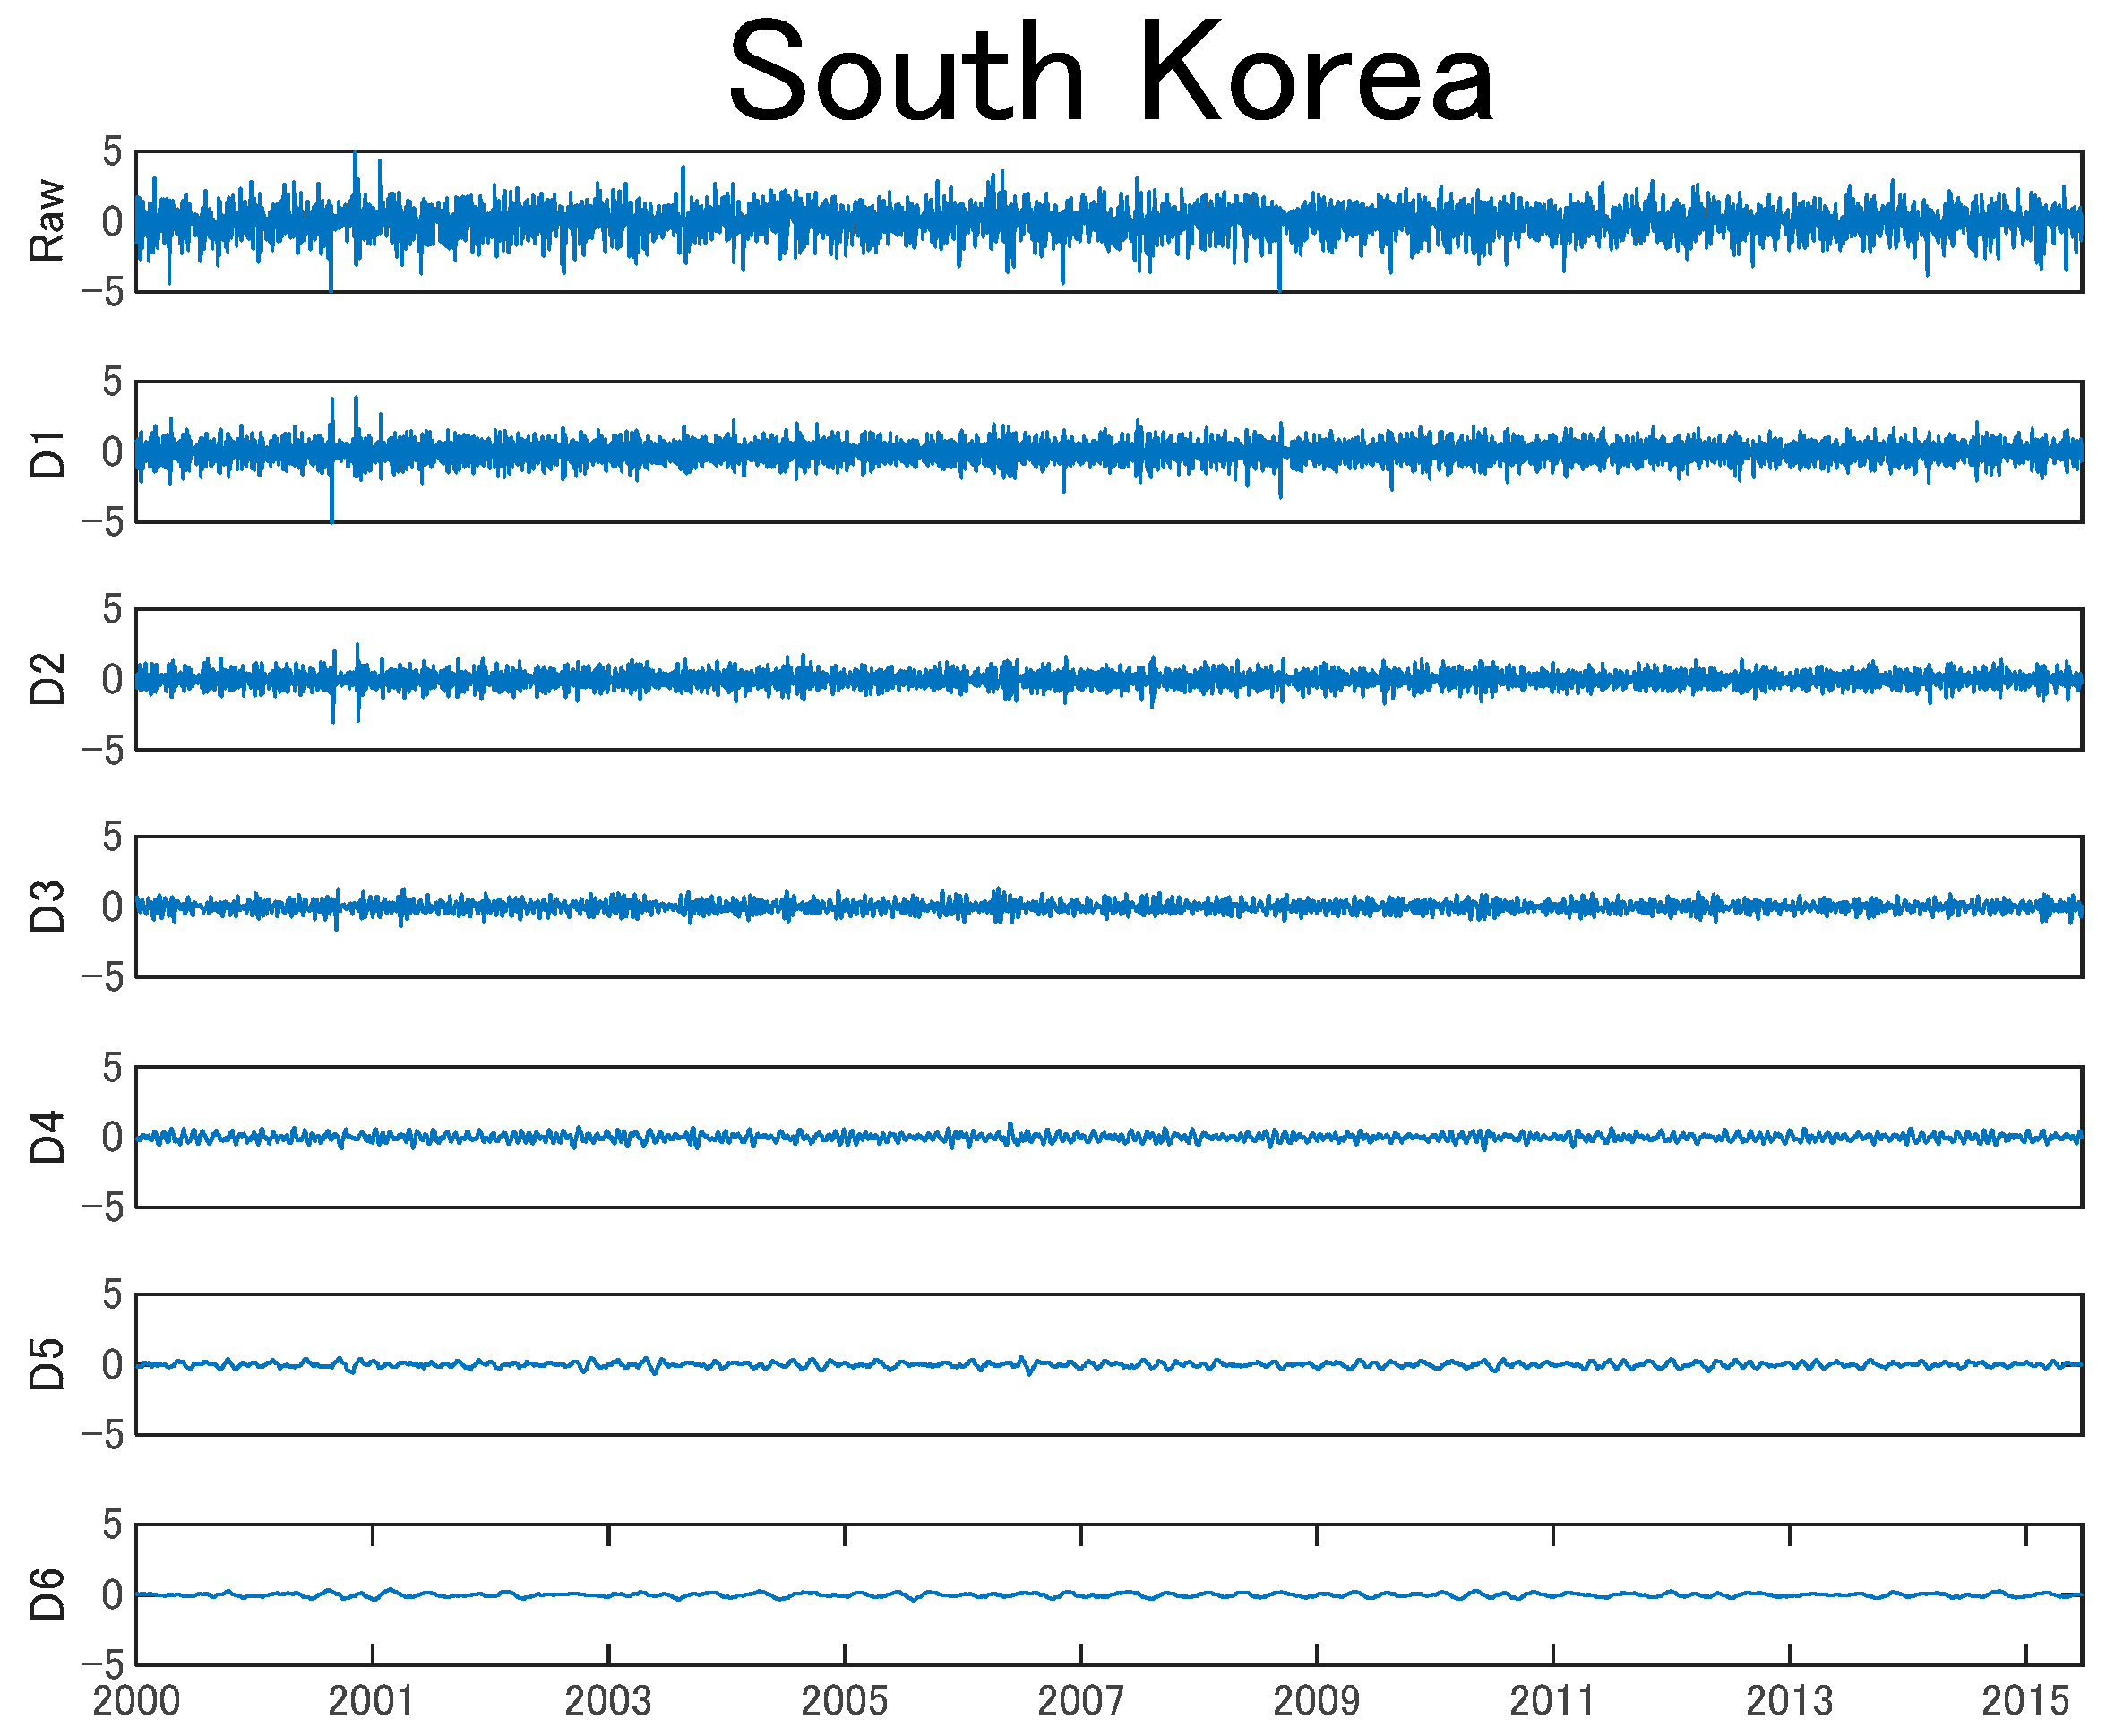
| Mean | Std.dev. | Skewness | Kurtosis | Jarque-Bera | |
|---|---|---|---|---|---|
| Oil | 01 | 0.0109 | −0.0434 | 7.0412 | 2804.1 *** |
| Japan | 00 | 0.0063 | −0.3540 | 9.2208 | 6727.7 *** |
| China | 01 | 0.0081 | −0.1059 | 9.5531 | 7377.8 *** |
| South Korea | 01 | 0.0074 | −0.3795 | 9.3222 | 6958.8 *** |
| Crude Oil | Japan | China | South Korea | |
|---|---|---|---|---|
| 0 | 0 | 0 | 0 | |
| (0) | (0) | (0) | (0) | |
| −0.041 | 0.032 | 0.043 | −0.004 | |
| (0.016) | (0.016) | (0.015) | (0.015) | |
| 0 | 0 | 0 | 0 | |
| (0) | (0) | (0) | (0) | |
| 0.023 | 0.021 | 0.029 | 0.014 | |
| (0.004) | (0.009) | (0.003) | (0.004) | |
| 0.953 | 0.890 | 0.922 | 0.943 | |
| (0.007) | (0.015) | (0.008) | (0.004) | |
| 0.041 | 0.124 | 0.076 | 0.075 | |
| (0.009) | (0.022) | (0.009) | (0.010) | |
| 0.924 | 0.929 | 0.979 | 0.931 | |
| (0.020) | (0.020) | (0.020) | (0.018) | |
| 8.256 | 8.651 | 6.816 | 6.521 | |
| (0.491) | (1.196) | (0.643) | (0.642) | |
| (30) | 0.791 | 0.973 | 0.190 | 0.682 |
| (30) | 0.138 | 0.768 | 0.184 | 0.545 |
| Japan | China | South Korea | |||||||||||||||||||
|---|---|---|---|---|---|---|---|---|---|---|---|---|---|---|---|---|---|---|---|---|---|
| Raw | D1 | D2 | D3 | D4 | D5 | D6 | Raw | D1 | D2 | D3 | D4 | D5 | D6 | Raw | D1 | D2 | D3 | D4 | D5 | D6 | |
| Normal | |||||||||||||||||||||
| 0.069 | 0.008 | 0.111 | 0.142 | 0.085 | 0.176 | 0.234 | 0.112 | 0.039 | 0.155 | 0.175 | 0.212 | 0.283 | 0.277 | 0.115 | 0.057 | 0.148 | 0.185 | 0.159 | 0.170 | 0.285 | |
| (0.015) | (0.020) | (0.019) | (0.019) | (0.025) | (0.030) | (0.019) | (0.015) | (0.019) | (0.019) | (0.019) | (0.025) | (0.028) | (0.019) | (0.015) | (0.019) | (0.019) | (0.019) | (0.026) | (0.030) | (0.018) | |
| log | 9.807 | 0.129 | 25.350 | 41.659 | 14.810 | 64.622 | 116.356 | 25.884 | 3.160 | 50.066 | 63.891 | 95.053 | 171.456 | 164.292 | 27.293 | 6.608 | 45.477 | 71.346 | 52.904 | 60.130 | 174.298 |
| GOF | 0.640 | 0.920 | 0.890 | 0.130 | 0.350 | 0.540 | 0.100 | 0.340 | 0.540 | 0.420 | 0.140 | 0.290 | 0.680 | 0 | 0.670 | 0.940 | 0.710 | 0.820 | 0.110 | 0.070 | 0.280 |
| Clayton | |||||||||||||||||||||
| 0.067 | 0.015 | 0.185 | 0.252 | 0.243 | 1.118 | 2.413 | 0.130 | 0.076 | 0.257 | 0.338 | 0.576 | 1.415 | 2.359 | 0.120 | 0.100 | 0.234 | 0.344 | 0.440 | 1.108 | 2.502 | |
| (0.017) | (0.021) | (0.027) | (0.028) | (0.033) | (0.044) | (0.056) | (0.019) | (0.025) | (0.027) | (0.028) | (0.033) | (0.045) | (0.056) | (0.019) | (0.026) | (0.027) | (0.028) | (0.033) | (0.044) | (0.057) | |
| 0 | 0 | 0.023 | 0.064 | 0.057 | 0.538 | 0.750 | 0.005 | 0 | 0.067 | 0.128 | 0.294 | 0.613 | 0.745 | 0.003 | 0.001 | 0.052 | 0.133 | 0.207 | 0.535 | 0.758 | |
| log | 8.871 | 0.195 | 26.195 | 42.014 | 25.222 | 266.924 | 818.850 | 29.088 | 4.892 | 48.171 | 76.385 | 142.574 | 438.961 | 806.460 | 24.742 | 8.244 | 40.391 | 77.834 | 83.290 | 260.970 | 886.425 |
| GOF | 0.480 | 0.210 | 0.040 | 0 | 0.010 | 0 | 0 | 0.640 | 0 | 0 | 0.010 | 0 | 0 | 0 | 0.450 | 0.630 | 0.050 | 0 | 0.020 | 0 | 0 |
| Rotated Gumbel | |||||||||||||||||||||
| 1.034 | 1.018 | 1.099 | 1.139 | 1.132 | 1.673 | 2.473 | 1.071 | 1.047 | 1.139 | 1.177 | 1.296 | 1.862 | 2.471 | 1.066 | 1.061 | 1.130 | 1.187 | 1.229 | 1.668 | 2.539 | |
| (0.009) | (0.012) | (0.013) | (0.014) | (0.016) | (0.027) | (0.035) | (0.011) | (0.013) | (0.014) | (0.015) | (0.019) | (0.028) | (0.035) | (0.011) | (0.013) | (0.014) | (0.015) | (0.018) | (0.027) | (0.036) | |
| 0.045 | 0.025 | 0.121 | 0.162 | 0.155 | 0.487 | 0.677 | 0.090 | 0.062 | 0.162 | 0.198 | 0.293 | 0.549 | 0.676 | 0.085 | 0.079 | 0.154 | 0.207 | 0.242 | 0.485 | 0.686 | |
| log | 8.446 | 1.338 | 31.604 | 54.808 | 37.146 | 325.876 | 973.632 | 32.569 | 7.968 | 59.365 | 87.819 | 156.087 | 517.525 | 981.967 | 27.484 | 13.357 | 51.723 | 95.710 | 97.195 | 319.391 | 1.053E03 |
| GOF | 0.250 | 0.150 | 0.050 | 0 | 0.050 | 0 | 0 | 0.840 | 0.380 | 0 | 0.150 | 0 | 0 | 0 | 0.240 | 0.690 | 0.030 | 0 | 0.080 | 0 | 0 |
| Student’s t | |||||||||||||||||||||
| 0.069 | 0.006 | 0.122 | 0.157 | 0.112 | 0.381 | 0.614 | 0.112 | 0.048 | 0.174 | 0.199 | 0.256 | 0.518 | 0.639 | 0.115 | 0.068 | 0.170 | 0.207 | 0.201 | 0.372 | 0.653 | |
| (0.016) | (0.019) | (0.019) | (0.018) | (0.020) | (0.029) | (0.052) | (0.016) | (0.019) | (0.018) | (0.018) | (0.020) | (0.027) | (0.096) | (0.016) | (0.019) | (0.018) | (0.018) | (0.020) | (0.030) | (0.066) | |
| 0 | 0.166 | 0.206 | 0.363 | 0.488 | 0.667 | 0.909 | 0.030 | 0.196 | 0.217 | 0.350 | 0.501 | 0.667 | 0.909 | 0.026 | 0.188 | 0.241 | 0.407 | 0.467 | 0.667 | 0.909 | |
| (0) | (0.035) | (0.036) | (0.032) | (0.032) | (0.047) | (0.149) | (0.016) | (0.033) | (0.035) | (0.032) | (0.033) | (0.062) | (0.315) | (0.029) | (0.034) | (0.034) | (0.031) | (0.033) | (0.047) | (0.223) | |
| 0.005 | 0.034 | 0.077 | 0.178 | 0.215 | 0.381 | 0.549 | 0 | 0.056 | 0.097 | 0.186 | 0.275 | 0.450 | 0.563 | 0 | 0.055 | 0.111 | 0.217 | 0.240 | 0.377 | 0.572 | |
| log | 9.806 | 8.438 | 37.583 | 86.714 | 101.237 | 522.136 | 1.107E03 | 27.916 | 17.577 | 66.303 | 109.867 | 204.256 | 687.731 | 1.143E03 | 28.597 | 18.521 | 65.776 | 140.545 | 143.103 | 524.385 | 1.180E03 |
| GOF | 0.680 | 0.350 | 0.790 | 0.870 | 0.760 | 0.100 | 0.150 | 0.170 | 0.550 | 0.760 | 0.230 | 0.330 | 0.720 | 0 | 0.770 | 0.840 | 0.710 | 0.900 | 0.360 | 0.110 | 0.390 |
| SJC | |||||||||||||||||||||
| 0 | 0 | 0.049 | 0.113 | 0.080 | 0.507 | 0.718 | 0 | 0 | 0.098 | 0.078 | 0.180 | 0.578 | 0.740 | 0.001 | 0 | 0.121 | 0.130 | 0.143 | 0.515 | 0.737 | |
| (0) | (0) | (0.029) | (0.030) | (0.037) | (0.016) | (0.008) | (0.002) | (0) | (0.029) | (0.032) | (0.033) | (0.013) | (0.007) | (0.003) | (0) | (0.029) | (0.030) | (0.034) | (0.016) | (0.007) | |
| 0.002 | 0 | 0.026 | 0.041 | 0.080 | 0.477 | 0.703 | 0.035 | 0.011 | 0.059 | 0.142 | 0.280 | 0.549 | 0.686 | 0.020 | 0.024 | 0.023 | 0.119 | 0.208 | 0.473 | 0.709 | |
| (0.003) | (0) | (0.026) | (0.028) | (0.037) | (0.018) | (0.010) | (0.070) | (0.011) | (0.028) | (0.030) | (0.025) | (0.015) | (0.010) | (0.012) | (0.004) | (0.026) | (0.031) | (0.029) | (0.019) | (0.009) | |
| log | 9.817 | 0.196 | 34.121 | 61.196 | 37.787 | 433.488 | 1.163E03 | 31.686 | 5.736 | 66.539 | 90.553 | 171.933 | 650.844 | 1.203E03 | 29.012 | 10.434 | 62.106 | 102.417 | 106.582 | 435.570 | 1.251E03 |
| GOF | 0.970 | 0.920 | 0.960 | 1 | 1 | 1 | 1 | 1 | 0.950 | 0.990 | 1 | 1 | 1 | 0.980 | 0.920 | 0.940 | 0.950 | 1 | 0.910 | 1 | 1 |
| Japan | China | South Korea | |||||||||||||||||||
|---|---|---|---|---|---|---|---|---|---|---|---|---|---|---|---|---|---|---|---|---|---|
| Raw | D1 | D2 | D3 | D4 | D5 | D6 | Raw | D1 | D2 | D3 | D4 | D5 | D6 | Raw | D1 | D2 | D3 | D4 | D5 | D6 | |
| −12.81 | −13.47 | 1.57 | 4.69 | 5.91 | 3.64 | 7.78 | −11.74 | −20.69 | 1.29 | 4.30 | 5.88 | 7.96 | 2.44 | −9.87 | −14.31 | 1.88 | 4.44 | 6.22 | 7.24 | 2.20 | |
| (2.35) | (0.57) | (0.49) | (0.48) | (0.39) | (0.10) | (0.14) | (2.55) | (0.40) | (0.43) | (0.37) | (0.37) | (0.18) | (0.34) | (8.59) | (0.63) | (0.49) | (0.30) | (0.27) | (0.07) | (0) | |
| 0.03 | 0 | −16.29 | −23.51 | −25.15 | −15.96 | −21.41 | 0.08 | 0 | −12.25 | −21.78 | −25.48 | −28.01 | −11.45 | −3.38 | 0.01 | −14.12 | −20.81 | −26.98 | −24.57 | −14.06 | |
| (0.29) | (0) | (2.97) | (2.50) | (1.64) | (0.24) | (0.36) | (0.72) | (0) | (1.97) | (1.81) | (2.16) | (1.80) | (1.35) | (10.93) | (0) | (2.46) | (1.63) | (2.20) | (0.86) | (0) | |
| 0 | 0 | 0.32 | −3.47 | −3.97 | 0.98 | −4.61 | 0 | 0 | 0.52 | −3.53 | −4.06 | −4.67 | 0.68 | −0.01 | 0 | 0.93 | −3.51 | −3.99 | −4.37 | 1.07 | |
| (0) | (0) | (0.80) | (0.13) | (0.12) | (0.01) | (0.05) | (0.30) | (0.01) | (0.45) | (0.18) | (0.11) | (0.07) | (0.24) | (0) | (0) | (0.44) | (0.14) | (0.12) | (0.07) | (0) | |
| −10.01 | −14.08 | 2.09 | 4.79 | 6.89 | 6.92 | 8.10 | 0.23 | 3.45 | 1.32 | 5.11 | 6.62 | 6.93 | 2.30 | 2.45 | 2.54 | 2.40 | 4.19 | 6.29 | 7.20 | 2.03 | |
| (7.62) | (0.51) | (0.58) | (0.38) | (0.28) | (0.12) | (0.04) | (0.87) | (0.80) | (0.49) | (0.28) | (0.27) | (0.23) | (0.47) | (1.06) | (0.66) | (0.65) | (0.27) | (0.26) | (0.23) | (0) | |
| −2.27 | 0 | −18.63 | −22.96 | −29.38 | −24.34 | −22.88 | −12.78 | −23.62 | −13.33 | −21.91 | −23.85 | −23.88 | −12.16 | −20.54 | −17.67 | −19.17 | −19.95 | −24.93 | −27.22 | −14.07 | |
| (2.64) | (0) | (3.15) | (1.86) | (2.12) | (0.26) | (0.25) | (3.62) | (3.91) | (2.21) | (1.51) | (1.47) | (2.02) | (1.71) | (5.34) | (2.77) | (3.64) | (1.51) | (1.88) | (1.05) | (0) | |
| 0.01 | 0 | 0.24 | −3.37 | −4.05 | −4.13 | −4.97 | 1.66 | −4.61 | 0.71 | −3.51 | −4.09 | −4.33 | 0.82 | −11.62 | −5.95 | −1.81 | −3.42 | −4.04 | −4.31 | 1.43 | |
| (0.01) | (0) | (0.72) | (0.17) | (0.08) | (0.09) | (0.03) | (1.41) | (1.36) | (0.85) | (0.14) | (0.11) | (0.06) | (0.34) | (3.75) | (2.31) | (1.30) | (0.14) | (0.10) | (0.17) | (0) | |
| log | 9.02 | −2.840 | 64.32 | 227.79 | 469.93 | 985.88 | 1939 | 35.97 | 12.72 | 101.49 | 300.78 | 586.14 | 1252 | 2083 | 33.03 | 21.60 | 105.82 | 289.50 | 478.24 | 1011 | 1966 |
| Raw | D1 | D2 | D3 | D4 | D5 | D6 | |
|---|---|---|---|---|---|---|---|
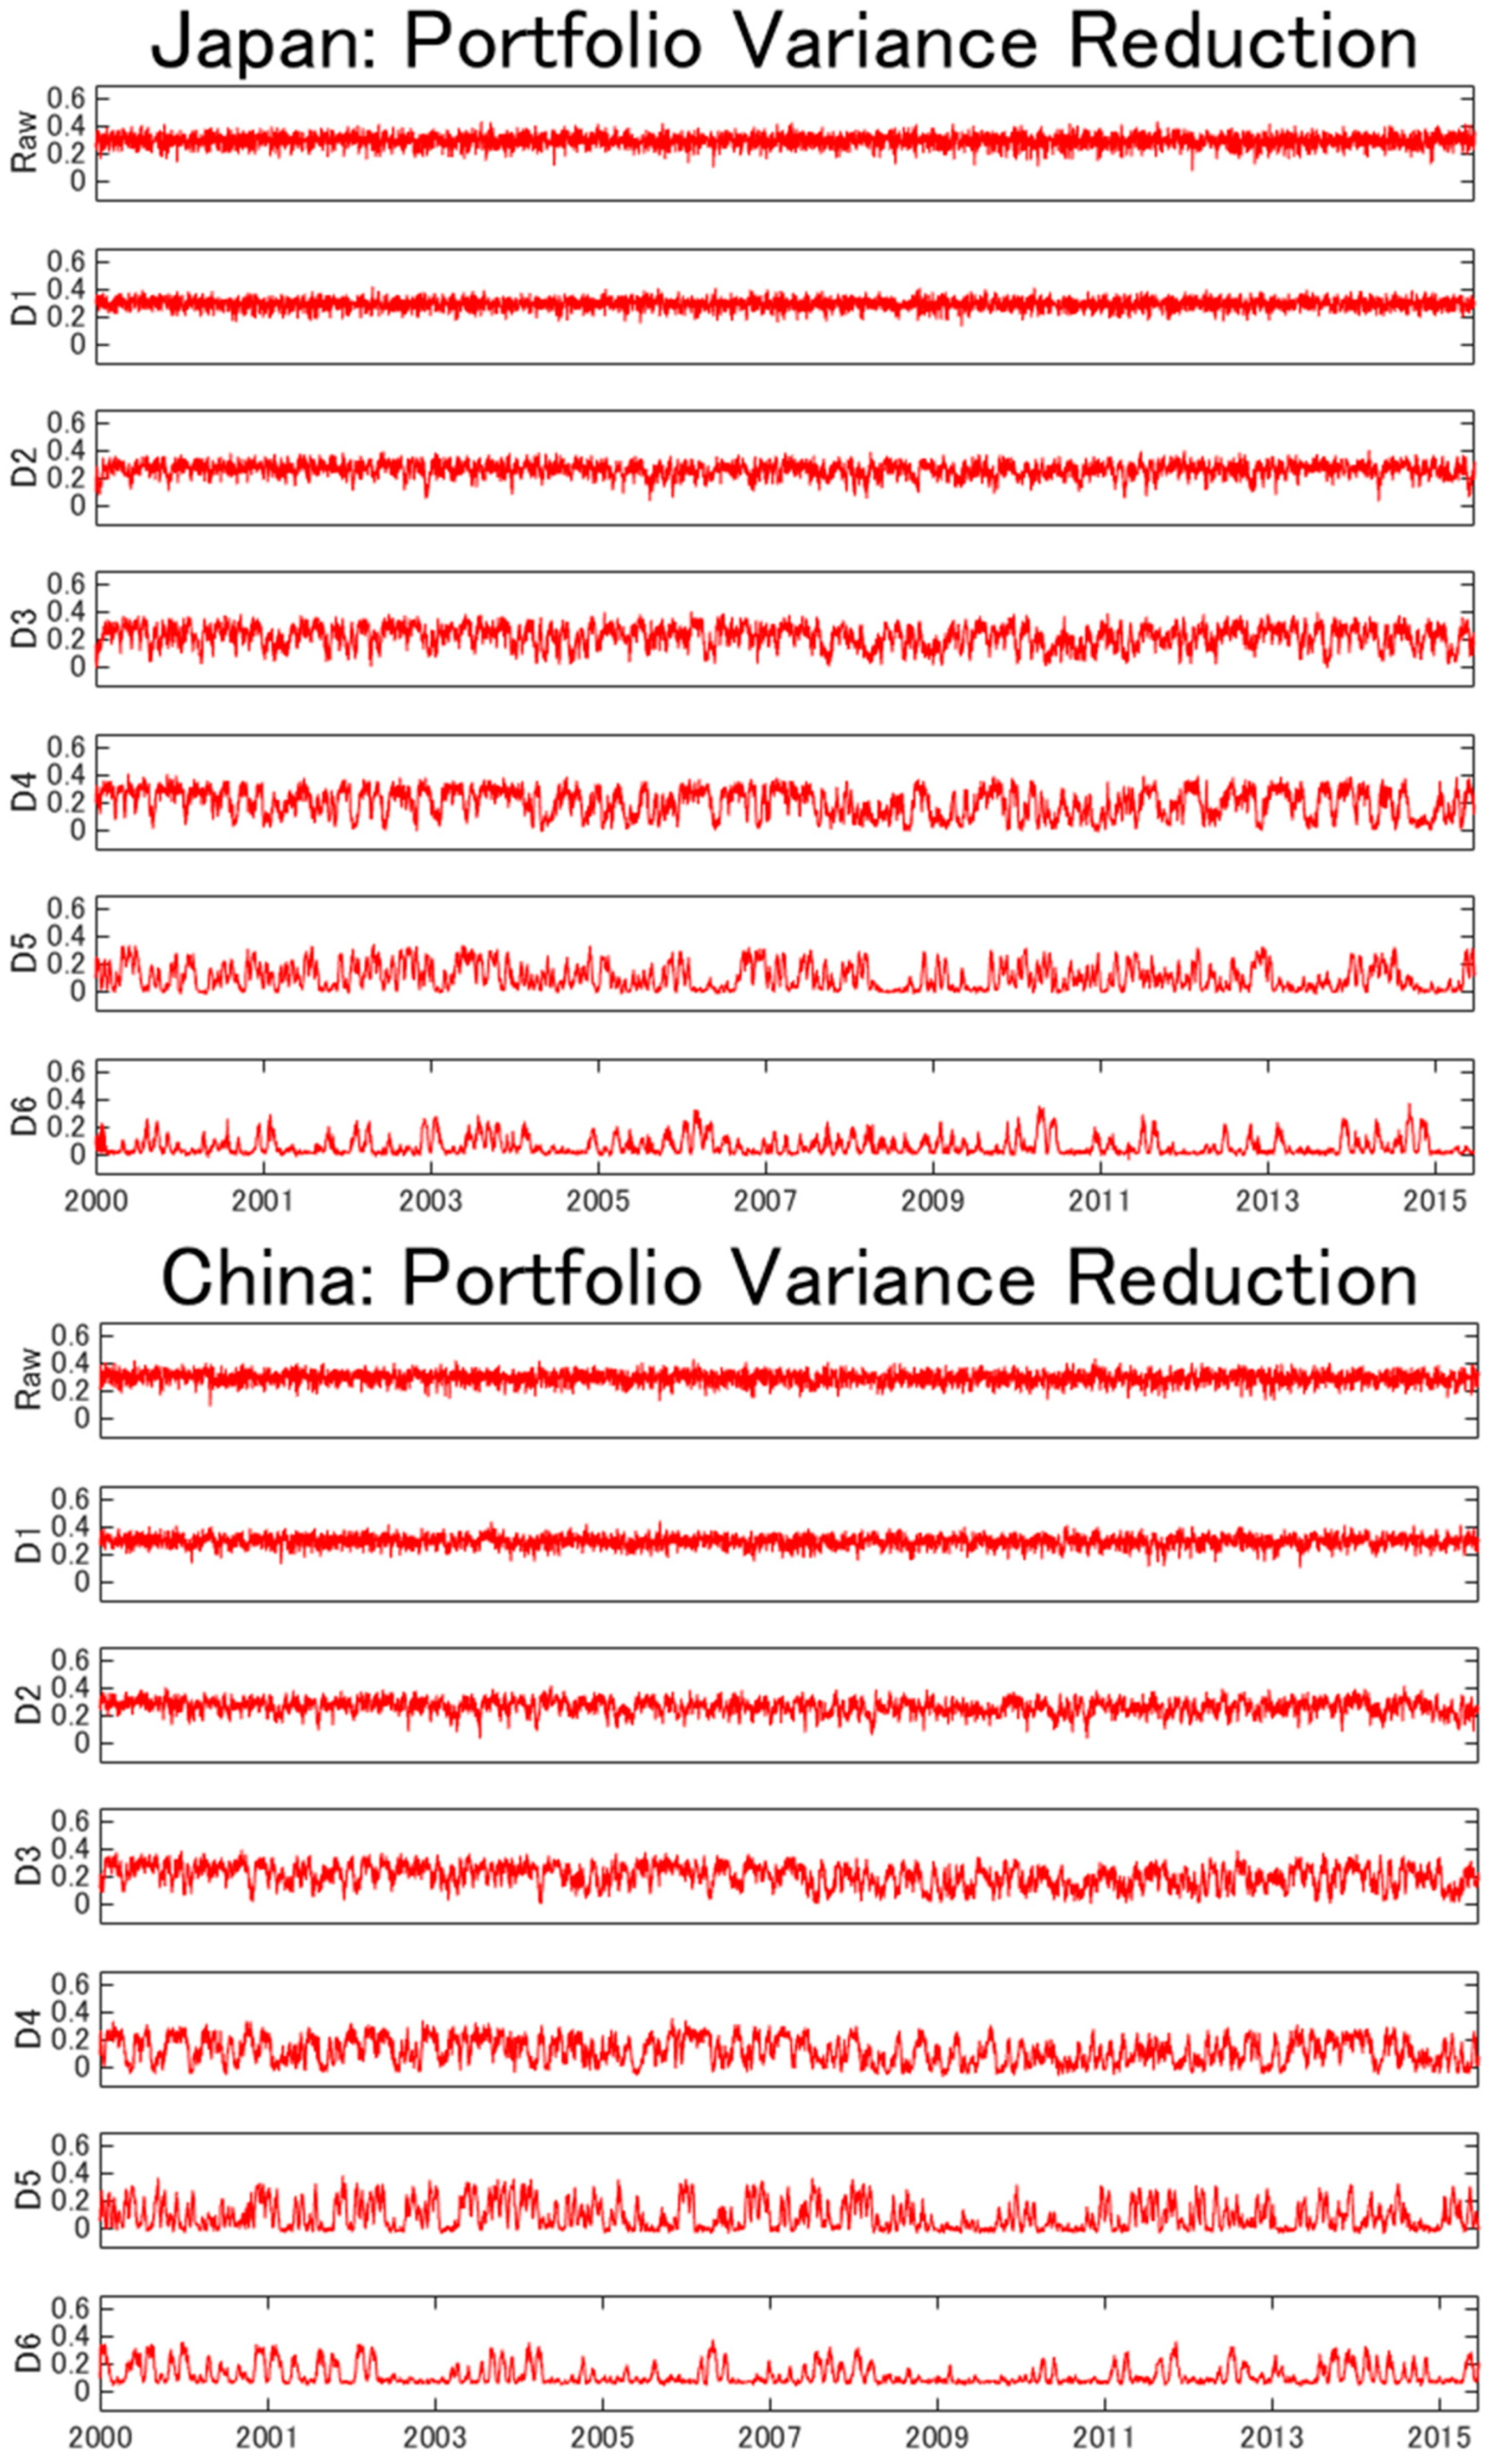
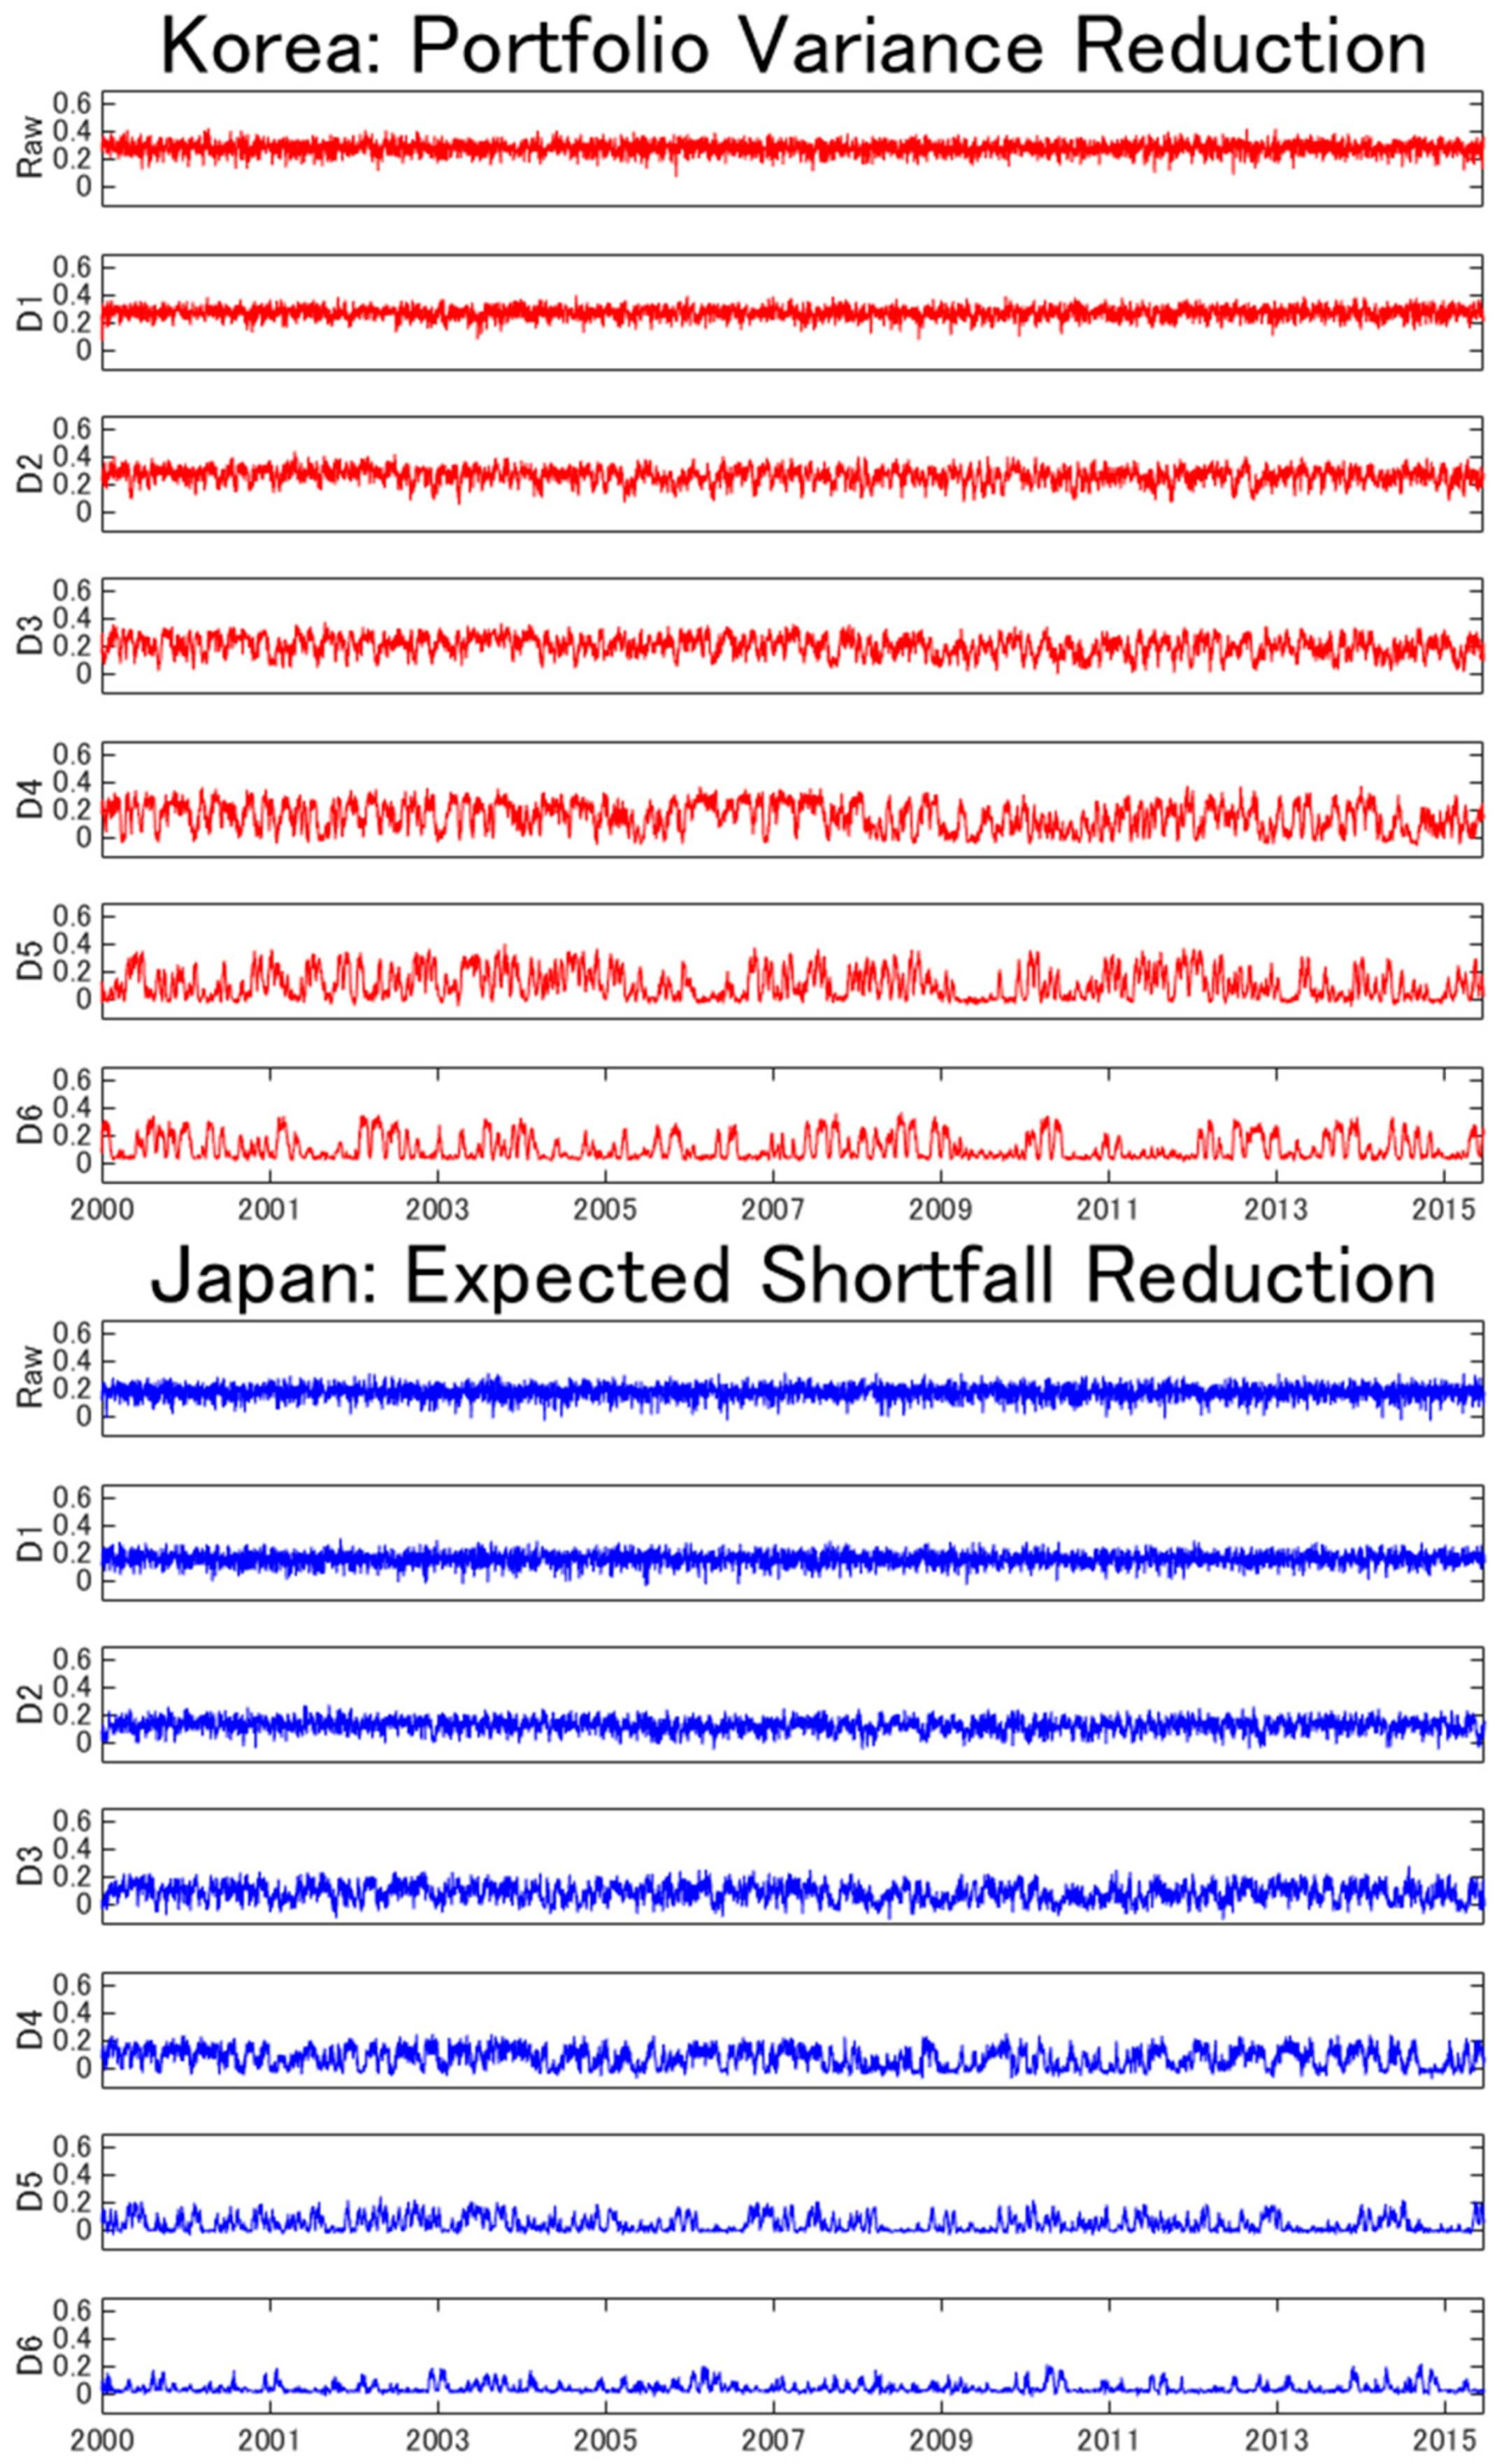
| Panel A. Portfolio variance | |||||||
| Japan | 0.295 | 0.296 | 0.262 | 0.222 | 0.200 | 0.104 | 0.063 |
| (0.048) | (0.042) | (0.055) | (0.081) | (0.100) | (0.089) | (0.065) | |
| China | 0.295 | 0.296 | 0.265 | 0.206 | 0.120 | 0.088 | 0.121 |
| (0.047) | (0.044) | (0.055) | (0.080) | (0.093) | (0.098) | (0.072) | |
| South Korea | 0.280 | 0.272 | 0.265 | 0.203 | 0.152 | 0.106 | 0.112 |
| (0.048) | (0.045) | (0.060) | (0.071) | (0.100) | (0.102) | (0.085) | |
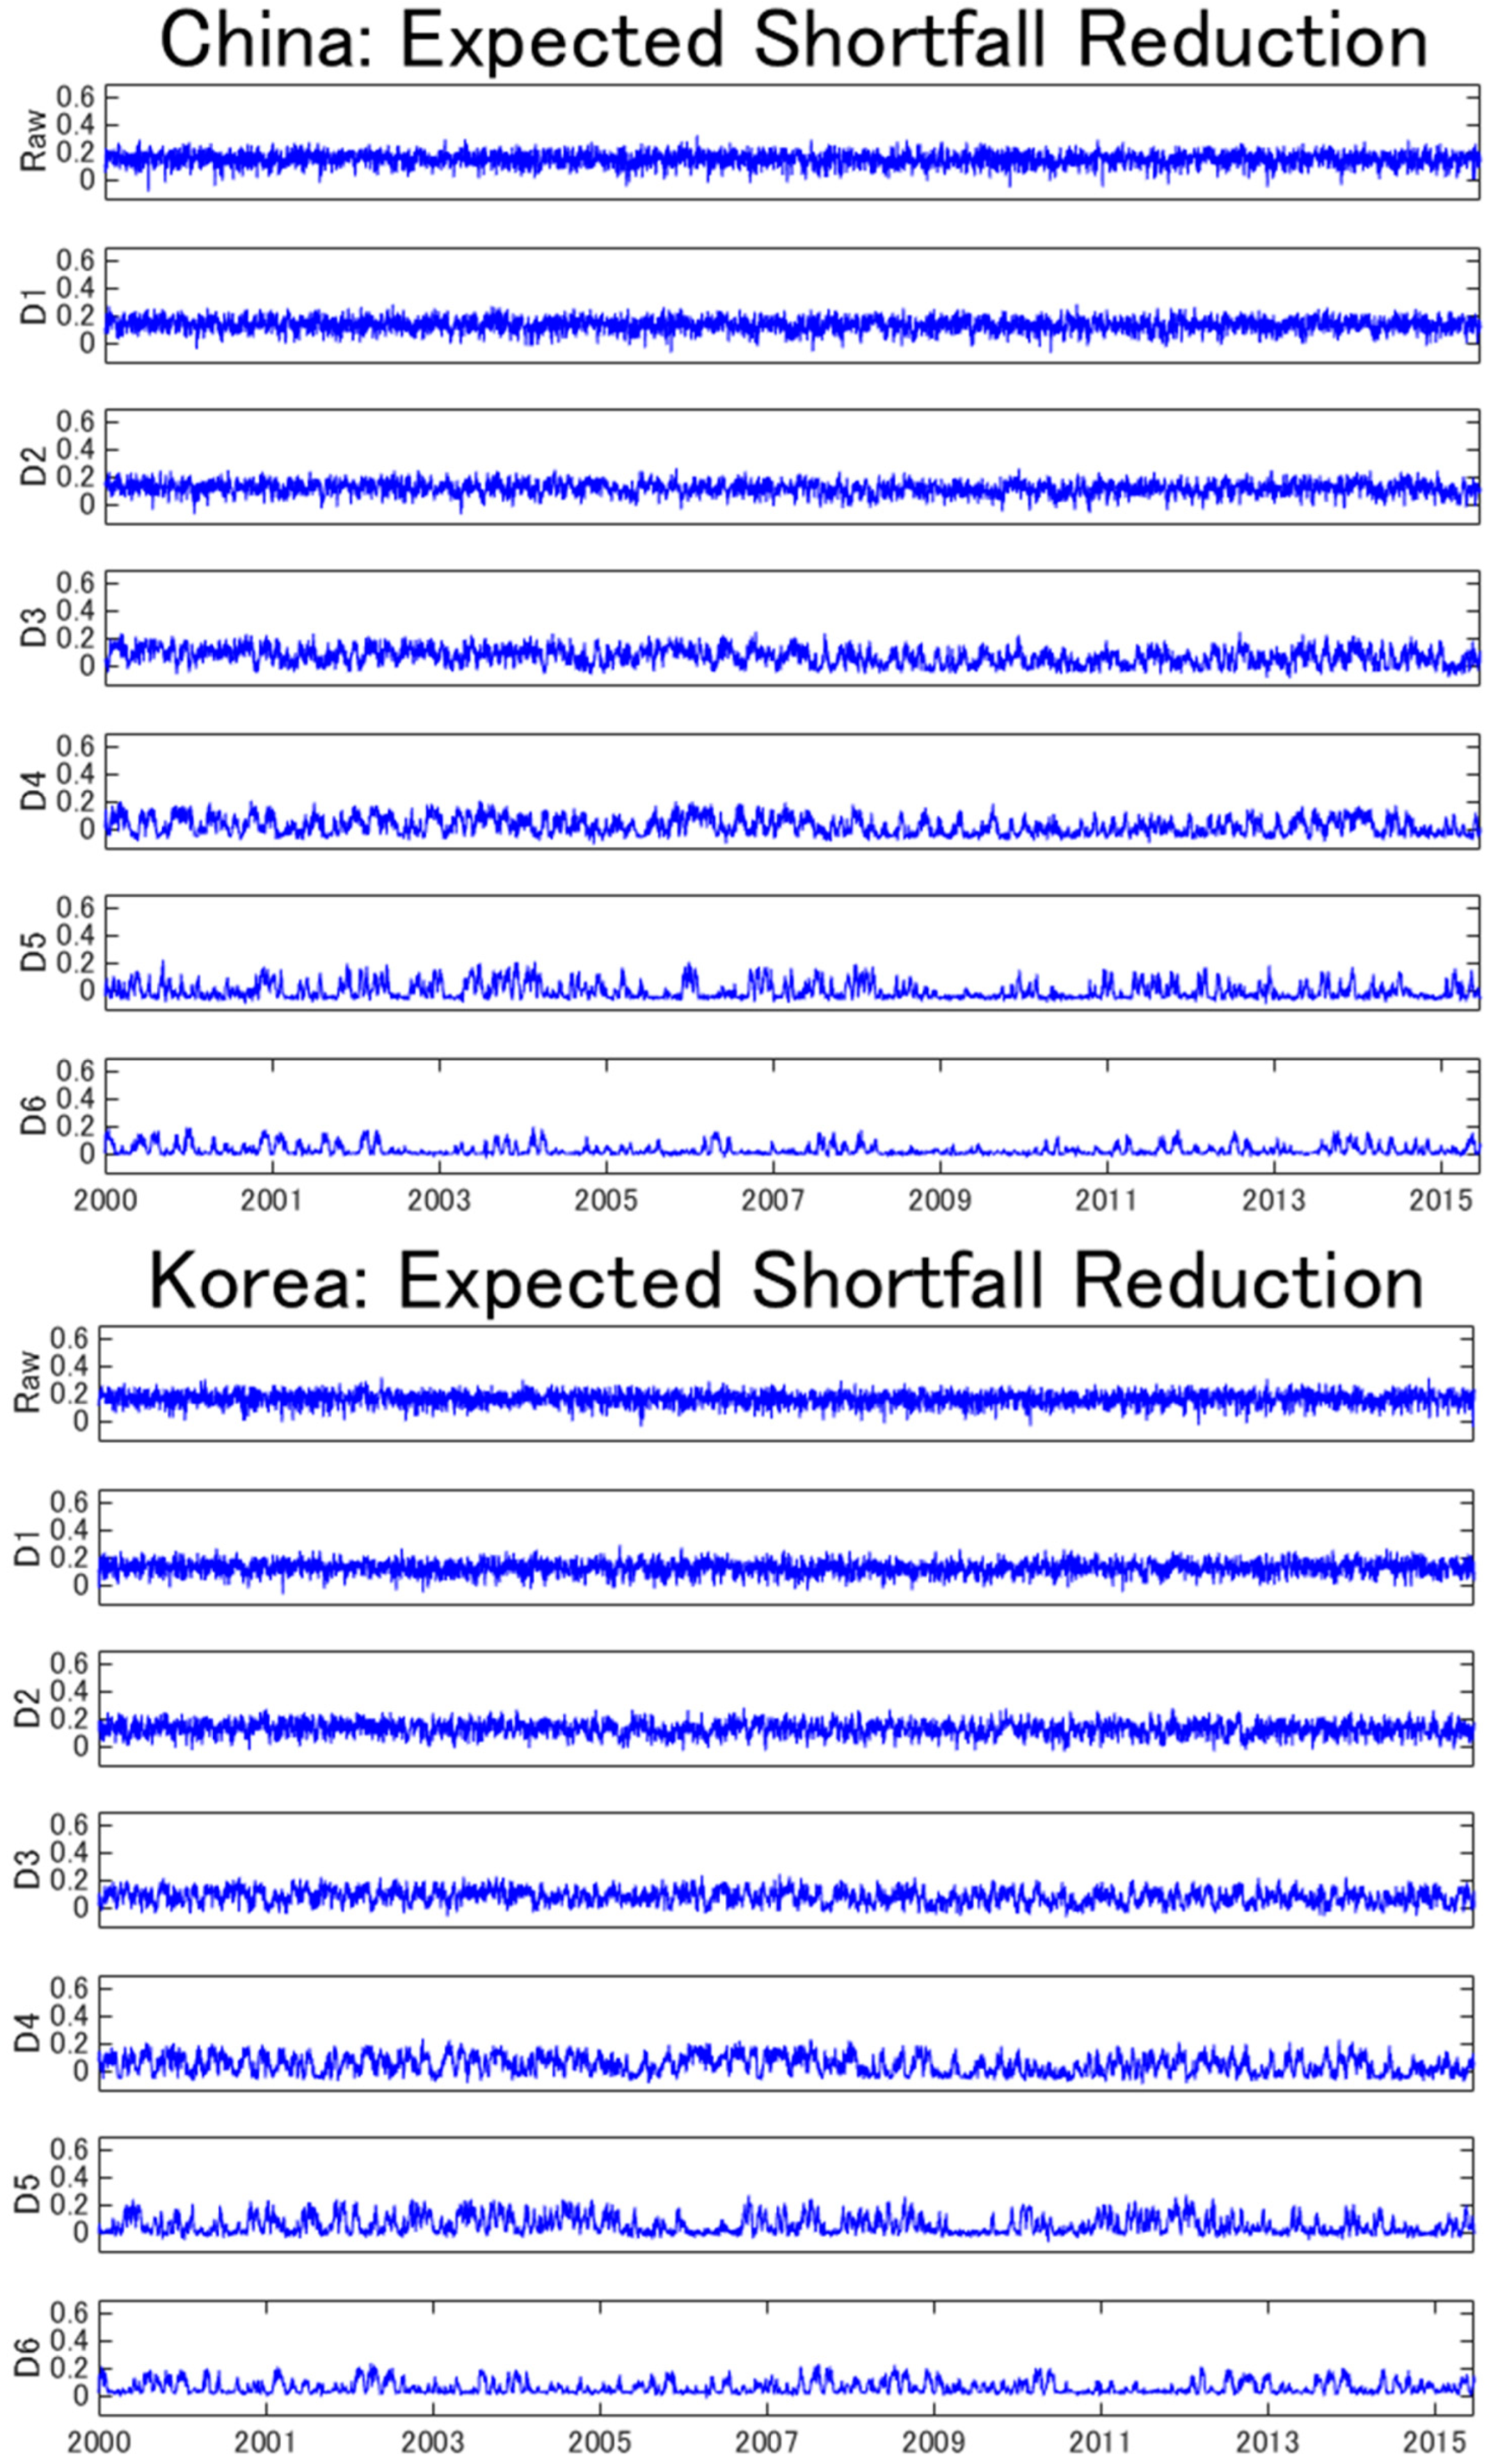
| Panel B. Expected shortfall | |||||||
| Japan | 0.176 | 0.159 | 0.125 | 0.084 | 0.075 | 0.044 | 0.043 |
| (0.053) | (0.049) | (0.052) | (0.065) | (0.071) | (0.055) | (0.036) | |
| China | 0.152 | 0.135 | 0.119 | 0.069 | 0.025 | −0.002 | 0.031 |
| (0.052) | (0.052) | (0.050) | (0.063) | (0.062) | (0.059) | (0.039) | |
| South Korea | 0.164 | 0.128 | 0.130 | 0.081 | 0.048 | 0.056 | 0.063 |
| (0.050) | (0.051) | (0.054) | (0.055) | (0.067) | (0.065) | (0.047) | |
© 2020 by the authors. Licensee MDPI, Basel, Switzerland. This article is an open access article distributed under the terms and conditions of the Creative Commons Attribution (CC BY) license (http://creativecommons.org/licenses/by/4.0/).
Share and Cite
Cai, X.; Hamori, S.; Yang, L.; Tian, S. Multi-Horizon Dependence between Crude Oil and East Asian Stock Markets and Implications in Risk Management. Energies 2020, 13, 294. https://doi.org/10.3390/en13020294
Cai X, Hamori S, Yang L, Tian S. Multi-Horizon Dependence between Crude Oil and East Asian Stock Markets and Implications in Risk Management. Energies. 2020; 13(2):294. https://doi.org/10.3390/en13020294
Chicago/Turabian StyleCai, Xiaojing, Shigeyuki Hamori, Lu Yang, and Shuairu Tian. 2020. "Multi-Horizon Dependence between Crude Oil and East Asian Stock Markets and Implications in Risk Management" Energies 13, no. 2: 294. https://doi.org/10.3390/en13020294
APA StyleCai, X., Hamori, S., Yang, L., & Tian, S. (2020). Multi-Horizon Dependence between Crude Oil and East Asian Stock Markets and Implications in Risk Management. Energies, 13(2), 294. https://doi.org/10.3390/en13020294


