Abstract
Distributed Generation (DG) has changed the power generation system to small-scale instead of large-scale generation. The demanding issue with the interconnection of DG is the detection of unintended islanding in a network. Several methods proposed in the literature show drawbacks such as high non-detection zones (NDZ) and higher tripping time. In this paper, the IEEE 13 bus distribution network with DGs like wind and solar power plants is integrated at two buses. Islanding is detected by utilizing data from a micro-synchrophasor located at the distribution grid and the DG. The micro-synchrophasor-based unintended islanding detection algorithm is based on parameters such as voltage, rate of change of voltage, frequency, rate of change of frequency, voltage phase angle difference and the rate of change of the voltage phase angle difference between the utility and the islanded grid. The proposed islanding detection algorithm discriminates between islanding and non-islanding conditions and is highly efficient under zero power mismatch conditions. The proposed method has null NDZ and satisfies the IEEE 1547 standard for DG tripping time. The effectiveness of the proposed IDM was verified when there are multiple DGs in the islanded grid. Also, the proposed method does not require additional hardware as it can be incorporated in digital relays with synchrophasor functionality.
1. Introduction
In recent years renewable energy is gaining importance, due to ever-growing load requirements, depletion of fossil fuels, and environmental concerns caused by carbon emissions. There has consequently been growing interest in harvesting and utilizing alternative energy sources like solar and wind energy systems. The advantages of integrating distributed generation (DG) into the utility grid are flexibility in accommodating the DG resources within utility location, enhanced grid reliability, reduced loading of distribution systems, and thereby improving the voltage profile of the distribution systems.
Issues related to large integration of distributed generation include:
- Unintentional islanding
- Protection issues
- Operational issues
- Power quality issues
- Power generated through distributed generation cannot be wheeled through transmission lines as they operate close to the loading limits.
- Shortage of technically trained workforce.
The critical issue associated with the grid interconnected DG system is the unintended islanding of a network. Islanding is defined as “a situation where a portion of the grid and the local loads connected to the DG is isolated from the main grid by an opening of the circuit breaker (CB) at the point of common coupling (PCC)” [1]. During this condition, DG act as an independent feeding system for the local load requirements. The islanding scenarios are categorized into intended (planned) islanding network and unintended (unintentional or unplanned) islanding network. An unintended islanding of a network is undesirable as it causes voltage and frequency instability. This poses a serious threat to the deployed maintenance person. In view of human and apparatus protection, the islanding of a network has to be detected and DG has to be isolated from the main grid.
Literature Review
Various unintentional islanding detection methods (IDMs) are reported in the literature. IDMs are classified as local detection techniques and remote detection techniques. Further, local detection techniques are classified into active islanding detection methods (active IDM) and passive islanding detection methods (passive IDM) [1]. Each technique has several algorithms with their own merits and demerits.
Dutta et al. [1] reviewed issues related to islanding and the researches in detecting unintended islanding of a network. They also presented an evaluation of various metrics for island detection. An exhaustive study of various IDMs is presented in [2]. The authors also presented an economical and feasibility analysis of IDMs available in the literature.
Active IDMs work on the injected disturbances of the system and thereby, they analyze the affected parameters. Active IDMs are designed based on the type of DGs integrated at PCC. For inverter-based DGs, current signals are intentionally injected into the system, thereby introducing a power mismatch in the system [2].
Valsamas et al. [3] investigated the active anti-IDMs for module integrated converters with high DG penetration levels. Sivadas and Vasudevan [4] presented an active island detection method with more than one inverter operating parallelly in the microgrid environment and it is based on the injection of active power in predefined periodic step-change patterns. Murugesan and Murali [5] proposed a tailor-made active IDM based on d-axis current injection strategies suitable for grids with multiple DGs. They claimed that the method has zero NDZ and a high speed of islanding detection.
In the case of synchronous based generators, feedback from real and reactive power control loops introduces a power imbalance in the system. A modified reactive power control strategy for limiting the unwanted reactive power injections for islanding detection in active IDMs was reported in the literature [6,7]. This strategy improved the system in maloperations against the non-islanding scenarios (NISs).
Some of the active IDMs designed for inverter-based DGs reported are Sandia frequency shift [8], active frequency drift, slip mode frequency shift, Sandia voltage shift, negative sequence current injection, current harmonic injection, voltage drifting technique, positive feedback method, etc.
Methods related to positive feedback for real and reactive power control loops are widely reported for islanding detection in synchronous based generation [9]. Zamani et al. [9] proposed the signal processing of two active and reactive power loops which accelerate the detection of islands at an early stage of instability. The authors claim that despite being an active IDM, it has minimal impact on power quality.
Bakshi Jafarabadi and Sadeh [10] proposed a fast and precise voltage feedback-based IDM for a grid-connected photovoltaic system. Since it is an active islanding technique, perturbations were introduced in the inverter’s d-axis reference current and the response of active power output is studied. The algorithm was very effective and detected the islanding with a time duration of 810 ms.
Murugesan and Murali [11] studied an active unintentional islanding detection method based on disturbance injection through q-axis current controller. Based on the frequency variation, islanding was detected within 178 ms for the most crucial islanding for PMSG-based DGs.
The main advantage of the active IDM is that it possesses a very low NDZ. Even though the power mismatch is very low, active IDMs detect the islanding efficiently. The drawbacks of active IDMs are the late response of injected perturbations. This deteriorates the power quality of the system.
In passive IDM, system parameters such as under voltage/over voltage, rate of change of voltage (ROCOV), frequency, rate of change of frequency (ROCOF), active power mismatch (APM) and reactive power mismatch (RPM) are monitored continuously and if a violation of predefined threshold values is detected, then the system is said to be in islanded condition.
Nale et al. [12] studied the passive IDM based on intrinsic time decomposition in which islanding is detected based on energy computed from the baseline signal. The method was highly reliable in distinguishing the islanding scenarios (ISs) and non-islanding scenarios (NISs).
Many passive IDMs [13] have been reported in the literature, which includes over voltage/under voltage (OV/UV), over frequency/under frequency (OF/UF), ROCOF (based on real power imbalance), ROCOV (based on reactive power imbalance), loss of mains detection, voltage surge relays, etc.
Gupta et al. [14] evaluated the performance of ROCOF relay under perturbations of inverter fed DG and proposed new threshold setting to limit the non-detection zone. Abd-Elkader et al. [15] proposed a passive IDM based on voltage index for large and small power mismatches.
Markovic et al. [16] proposed an improved analytical formulation for estimating the non-detection zone (NDZ) of LoM protection devices in the presence of grid-feeding inverters. The authors also presented the inverter requirements for the performance of LoM protection systems.
Xie et al. [17] investigated the issues with islanding detection in the presence of synchronous and inverter-based distributed generators. The proposed passive IDM is based on the dynamic behavior of the load conditions. It was inferred that the proposed method was reliable under islanding and system disturbance conditions.
Passive IDMs suffer from large NDZs and nuisance tripping. During the islanded condition, when the power mismatches were very low, then passive IDMs landed up in large NDZ. Also, when the prespecified threshold values were very narrow, then it led to nuisance tripping. Hence proper setting of threshold values was a challenging task when passive islanding methods were considered.
Apart from this combination of active and passive IDMs, the hybrid IDMs are also reported in the literature. The objective of these methods is to reduce NDZ and to enhance detection sensitivity. Hybrid IDMs include wavelet transform (WT) [18], Hilbert—Huang transform, hyperbolic S transform, mathematical morphology (MM) etc., The drawbacks of these methods were computational complexity, hypersensitive to noise, separate module/experimental setup required for islanding detection and transients in non-stationary signals. Ahmadipour et al. [19] proposed a new IDM based on a wavelet packet transform (WPT) and a probabilistic neural network (PNN). The results showed that the proposed IDM was simple and better in accuracy compared to other passive IDMs. Kermany et al. [20] assessed the probability of islanding (threshold values) by processing the signals measured at PCC with wavelet transform and artificial neural network. Gupta and Garg [21] evaluated the threshold values for island detection by processing negative voltage sequence components at PCC and classified it with a binary tree classifier. Ghalavand et al. [22] presented a time-domain approach utilizing mathematical morphology (MM) operators and dilation-erosion differential filter (DED) at PCC for islanding detection. The authors claimed the proposed IDM was accurate and efficient under various power mismatch conditions. Dubey et al. [23] developed a Transient Monitoring Function (TMF) based islanding detection technique, that can process the voltage samples at DG location through Fourier–Taylor transformation. The TMF value was the deciding criteria in detecting islands. The proposed method satisfied the island detection time criteria as guidelined in the IEEE 1547 standard.
Wang et al. [24] investigated the performance analysis of a hybrid islanding detection method by considering voltage unbalance, total harmonic distortion, and bilateral reactive power variation. The degradation of power quality was minimal in a hybrid IDM. The algorithm maintained zero NDZ and detected the island in the range of 0.098 s to 0.138 s for various IS and NISs.
Kolli and Ghaffarzadeh [25] discussed the phaselet algorithms for islanding detection, in which phasor estimation of the negative sequence components of the voltage and current waveforms were utilized. The proposed method detected the islanding occurrence within two cycles even in the case of perfect power match and possessed zero NDZ with no power quality degradation.
Thomas et al. [26] utilized K-means clustering on the signatures extracted from reactive power using the empirical mode decomposition method for islanding detection. Changes in reactive power and clustering for IS and NISs are the key metrics in deciding islanding conditions. The authors claimed that the method had very close NDZ and the detection time was 40 ms for a fixed window system and 20 ms for the sliding window approach.
In hybrid IDMs, some authors explored the learning-based methods to achieve the above metrics, such as the reduction in NDZ and lesser detection time, which includes neural network and deep learning-based methods. Cui et al. [27] proposed a decision tree-based intelligent relay for island detection and validated the results for NDZ conditions under zero power mismatch conditions through hardware-in-the-loop simulations. Tan and Lan [28] proposed an active IDM to reduce islanding detection time with two probabilistic fuzzy neural network (PFNN) controllers and the same is validated for the effectiveness of islanding detection. Li et al. [29] implemented a data-driven learning approach to detect DG driven NDZ. It was inferred that the proposed method was quick and efficient in detecting the NDZs without utilizing any time-consuming electromagnetic transient simulations.
Haque et al. [30] developed an islanding classification mechanism to overcome the issues of NDZ with traditional IDMs. They used a support vector-based data description technique with Gaussian RBF kernels for IS and NISs. The classifier was efficient with a detection rate of 99.2% and a false alarm rate of 0.2%.
Another broad type of classification of IDM was the remote IDM [31]. In this method, islanding is detected by establishing communication infrastructure between DG and the main grid. The remote IDM based system reads the status of various circuit breakers (CBs), and serves as inputs for a central computing processor and based on the output of the islanding algorithms, islanding detection is done. Hence, remote methods were more reliable than local detection methods [32]. Methods such as power line signaling and phasor measurement unit (PMU) were some of the remote IDMs available in the literature.
Radhakrishnan et al. [33] proposed an islanding detection method for the data-intensive grid-connected microgrid. The algorithm was based on various parameters such as voltage phasors, frequency, and rate of change of frequency received from various locations which are processed through the moving window principal component analysis. Islanding detection factors such as detection time was within the prescribed limit of 2 s and the algorithm reported minimum false alarms.
Katyara et al. [34] proposed an anti-islanding technique utilizing wireless sensor networks. Phasor measurement units are the backbone for field data measurement and the same was transferred using wireless sensor networks. The method was highly reliable in detecting the islanding of a network.
The advantages of these IDMs were negligible or null NDZ, fast response/high speed of detection, and highly efficient in discriminating islanding from grid disturbances. The infrastructure requirements are also costly, with risky in loss of communication, and require backup protection.
Hojabri et al. [35] reviewed the various applications of PMUs in distribution systems. A review of PMU based protection applications was provided in [36,37]. Guo et al. [38] developed a systematic principal component analysis method for islanding detection utilizing phasor measurement units. This method is more versatile in distinguishing wide area disturbance from an islanding event. Also, the algorithm performs better in grids with low inertia systems (DGs). Skok et al. [39] proposed a synchronized measurement technology-based adaptive protection against the islanding scenarios in the microgrid environment. Stewart and von Meier presented an exhaustive study on phasor measurements for distribution system applications in [40]. Modelling and simulation of a phasor measurement unit is presented in [41].
Meier et al. [42] assessed the potential of distribution PMU or a micro-phasor measurement unit (µPMU). A detailed study on its capabilities, applications on the distribution grid with distributed generation was presented. Dutta et al. [43] evaluated the deployment of µPMUs in the distribution grid against islanding detection. Phase angle difference (PAD) between positive and zero sequence components was the key factor in deciding the islanding conditions. The method was found to be robust and free from non-detection zones. Sun et al. [44] deployed the µPMU in distribution systems and tested its capabilities by computing linear state estimation.
The communication requirements for the implementation of the above-discussed synchrophasor based methods are summarized in [45]. Hence, it can be concluded from the literature that the parameters such as non-detection zone and response time were essential in the detection of islanding of a network. “Non-detection zone (NDZ) is the range of power mismatches (APM and RPM) between DG supply and the local load for which islanding has occurred” [46]. Fast detection of island or response time is the time difference between the formation of the island and the time to trip the circuit breaker connected to the distributed generation.
Muda and Jena [47] proposed a phase angle-based principal component technique for island detection. They utilized the phase angle between positive sequence voltage and positive sequence current as a deciding criterion in detecting the islanding of a network. The algorithm was validated under perfect power mismatch and NISs.
As learned from the literature, the local active IDMs have low NDZ but degrades the power quality. Also, active methods are relatively slow in detecting islands and detection methods depend on the type of interconnected DG. Whereas, local passive IDMs possess large NDZ for which islanding detection methods might fail. In passive detection methods, nuisance tripping has been widely reported due to improper setting of threshold values. Rigorous limits lead to false islanding and loose setting takes a long time to detect the islanded condition.
Hence, there exists a need to develop algorithms with negligible or null NDZ and are faster in detecting the islanding of a network. According to the IEEE 1547—2003 standard “the unintentional islanding has to be detected and DG should be disconnected within two seconds after the utility disconnection” [48,49].
This research article aims in developing a remote IDM based on micro-synchrophasor to overcome the above issues. Micro-synchrophasor based measurements provide an accurate and detailed source of information to capture both static and dynamic behavior of the system. Micro- phasor measurement units (µPMU) or micro-synchrophasors are widely deployed in distribution systems for anomaly detection, and some protection applications. In this paper, a µPMU-based study is carried for islanding detection in distribution systems with DGs. In the proposed technique, voltage phase angle difference (VPAD) is taken as an important criterion in detecting islanding conditions.
The main contribution in this work is by using the proposed micro-synchrophasor based islanding detection method the drawbacks of traditional IDMs such as large NDZ and higher tripping time are resolved. Also, islanding detection time is well within the IEEE 1547 standards. The proposed method is so versatile that, it can detect islanding even when there are multiple DGs of different types present in the islanded grid. The advantage of the proposed µPMU based method is that it can be easily deployed in the distribution network since it does not require additional hardware to carry out the islanding detection, as they can be integrated into the digital relays with PMU functionality which are currently in use.
The paper is divided into five sections: Section 1 introduces the issues related to islanding of a network. Section 2 deals with the modeling of the test system. Section 3 gives an insight into the proposed IDM. Section 4 presents the results and validates the proposed method. Section 5 summarizes the findings.
2. Methodology
2.1. Modeling of IEEE 13—Node Distribution Test Feeder
The IEEE 13—node distribution test feeder [50,51] is a standard distribution system test model developed by the IEEE Power Engineering Society. The operating voltage of the distribution feeder is 4.16 kV at a power frequency of 60 Hz. The distribution system components modeled in the test feeder includes overhead lines, underground cables, spot loads, distributed loads, capacitors, transformers, and regulators. A single line diagram of the modified IEEE 13—node distribution test feeder as described in the article [52] is shown in Figure 1. In the modified test system, DGs like a wind and a solar PV power plant is integrated into the feeders at nodes B634 and B675 respectively. Also, micro-synchrophasors are incorporated at PCC of each DG, utility grid, and load terminals. The data from µPMU is transferred to Phasor Data Concentrators (PDCs) in the IEEE C37.118 format, which is further processed in the micro-synchrophasor application-based framework.
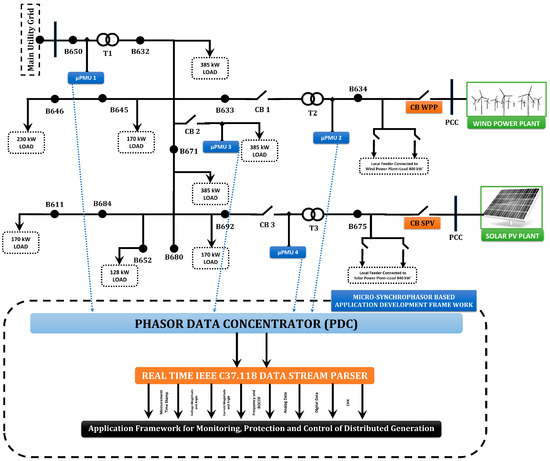
Figure 1.
Single line diagram of modified IEEE 13-bus distribution feeder.
2.2. Modeling of Solar Photo Voltaic (PV) Plant
The equivalent circuit model of the PV cell is shown in Figure 2.
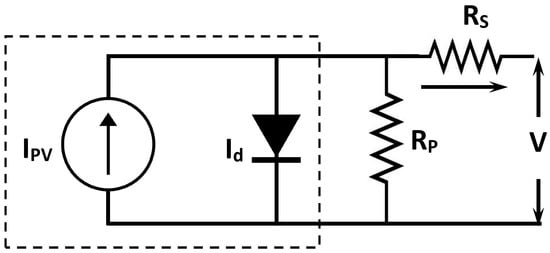
Figure 2.
An equivalent circuit model of a PV cell.
The I-V characteristics of an ideal photovoltaic cell is governed by Equation (1):
where Ipv,cell is the current generated by the incident light, Io,cell is the reverse saturation current of the diode, q is the electron charge (1.60217646 × 10⁻¹⁹ C), k is the Boltzmann constant (1.380650 × 10⁻²³ J/K), T is the temperature of the p-n junction in Kelvin and a is the diode ideality constant.
In order to meet the load requirements, PV cells are connected in series and parallel combinations. PV cells arranged in parallel combinations yield higher output current while the cells that are connected in series provide greater output voltages.
Equation (1) is modified by the addition of internal parameters of the PV cell and the same is expressed as Equation (2):
SPR-415E-WHT-D solar PV module (SunPower, San Jose, CA, USA) data is used for simulation. The specifications of the SunPower SPR-415E-WHT-D are given in Table 1.

Table 1.
Specifications of solar panel.
Design of LC Filter for Inverter
For filtering out the unwanted harmonics, a LC filter is used at the output of the inverter. The cut off frequency is governed by Equation (3):
where L and C are filter inductance and capacitance, respectively.

Table 2.
LC filter values.
2.3. Modelling of Wind Power Plant
A 9 MW wind power plant (WPP) driven by a doubly fed induction generator (DFIG) is considered for this study. The generalized schematic of a DFIG wind turbine is shown in Figure 3. The mechanical power developed from the wind turbine is transmitted through the gear assembly which consists of low-speed/high-speed gear arrangements that provide constant speed to the rotor of the induction generator. The generated power output from the stator terminals is fed to AC/DC/AC converter to satisfy the grid code requirements.

Figure 3.
Model of DFIG wind turbine.
The power recovered from the rotor circuit is processed through a rotor-side converter (RSC) and a grid-side converter (GSC) for real and reactive power control and to meet the voltage and frequency requirements of the utility grid.
The power developed by the wind turbine is given in Equation (4):
where v is the wind speed (m/s), ρ is the air density (kg/m3), cp is the performance coefficient, λ is the tip speed ratio, β is the pitch angle (deg) and A is the turbine swept area (m2).
The tip speed ratio is governed by Equation (5):
where ω is the angular speed of the wind turbine (rad/sec).
The torque developed by the wind turbine is obtained using Equation (6):
The turbine power coefficient Cp (α, β) is calculated as in Equation (7):
The coefficients are C1 = 0.5176, C2 = 116, C3 = 0.4, C4 = 5, C5 = 21, and C6 = 0.0068. The wind turbine specifications are shown in Table 3.

Table 3.
Specifications of the wind turbine.
2.4. Modeling of Micro-Synchrophasor (Micro-Phasor Measurement Unit)
In modern electric power systems, synchronized phasor measurements are widely deployed for monitoring, protection, and control of power grids. The block diagram of the micro-phasor measurement unit (µPMU) [53] is shown in Figure 4.
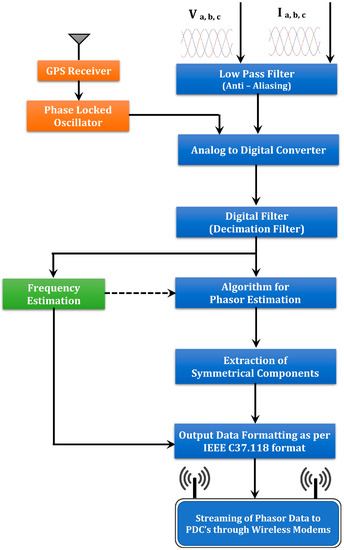
Figure 4.
Block diagram of µPMU.
Three-phase voltage and current signals from PTs and CTs are fed as inputs to the μPMU. The signal conditioning module in a μPMU is an anti-aliasing filter that eliminates the unwanted high-frequency noise signals. The analog signals are converted to digital values with the help of an A/D converter. The crystal oscillator in the GPS module provides the sampling clock pulses for conversion. The phasor processor utilizes one cycle discrete Fourier transform to estimate positive sequence phasor magnitude and angle. In addition to these parameters, local frequency, ROCOF, and harmonics are also measured. Micro-synchrophasor data consists of analog and digital values with GPS clock time stamping. The above-mentioned parameters are recorded at various locations and configured as per the IEEE C37.118 data file format, then, they are transmitted, through wireless modems to phasor data concentrators (PDCs).
The µPMU possesses ±0.05% precision total vector error (TVE), ±0.01˚ angle accuracy, ±0.0002% magnitude resolution, and ±0.002˚ angle resolution suitable for detecting unobservable events in the distribution networks with distributed generation.
2.4.1. Micro-Synchrophasor Based Voltage Phasor Estimation
In a µPMU, the phasor representation of the voltage quantity is obtained by carrying out DFT on the sampled voltage signals. The algorithm used to model µPMU is a non-recursive type phasor estimation. The non-recursive type phasor estimation technique illustrated in [53] is used to obtain the phasor estimates.
A pure sinusoidal waveform can be represented by a unique complex number known as a phasor. Consider a sinusoidal signal as represented in Equation (8):
A sinusoidal signal can be represented in phasor form as given in Equation (9):
The magnitude of the estimated phasor is the root mean square value of the sinusoidal input signal Xm/√2, whereas the phase angle is φ. The phasor representation of a sinusoidal signal is illustrated in Figure 5.
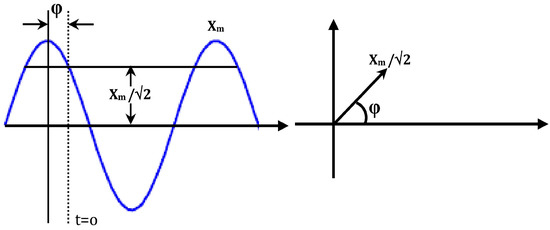
Figure 5.
Sinusoidal signal and its phasor representation.
Phasor estimation is a continuous process, where phasor estimates are updated with newer data samples. In a phasor estimation process, when the Nth sample is acquired after the N-1 samples, the phasor estimate can be computed as per Equation (12), the method to obtain the phasor estimates is to repeat the estimation process as given in Equations (10) and (11) for the new data window which begins at n = 1 and ends at n = N:
Phasor estimates of the window 1 are represented as phasor 1 and window 2 are represented as phasor 2. The first sample in window 1 lags the peak of the sinusoidal signal by an angle φ, while the first sample of window 2 (n = 1) lags the peak by an angle (φ + θ), where, θ is the angle difference between the samples [53]. The non-recursive type phasor estimation is shown in Figure 6.
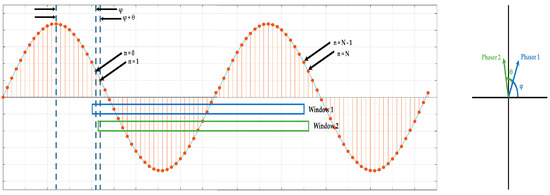
Figure 6.
Non-recursive method of updating phasor.
The phasor estimated from a sinusoidal input signal of nominal frequency has a constant magnitude and rotates in the counter-clockwise direction by angle θ as the data window advances by one sample. Since the phasor estimates are carried out when new samples are available for each window without using any data from the earlier estimates, this algorithm is known as a non-recursive phasor estimate.
The Nth sample of voltage magnitude from µPMU is computed as per Equation (12):
where n is the number of samples in µPMU per second, VN is the voltage of the N-th sample, θ is the phase angle recorded by µPMU.
2.4.2. Determination of Rate of Change of Voltage (ROCOV)
The reactive power generation of a DG is given in Equation (13):
where VD is the operating voltage of the DG, ID is the current delivered by the DG and ϕ is the phase angle difference between voltage and current of the DG.
Equation (13) is remodeled with load parameters as in Equation (14):
where VL is the load voltage and YL is the load admittance.
The partial derivative of QD is represented by Equation (15):
Equation (15) can be rewritten as Equation (16):
where BL is the imaginary part of YL.
Finally, ROCOV is represented as in Equation (17):
It can be observed that ROCOV of a system varies with the variation in the reactive power.
2.4.3. Micro-Synchrophasor Based Phase Angle Difference between Voltage Signals (VPAD)
The voltage magnitude and the phase angle of the µPMU placed near the utility grid is taken as reference and hence, VPAD is the phase angle difference between voltage signals of utility grid and DG or between the grid side and the load terminals. The VPAD values are computed and compared with the angle threshold values. If the angle difference is greater than the threshold value, the algorithm indicates an islanding of a network.
The phase angle difference between the grid voltage and the generated DG voltage during a specified processing time interval (k) is given in Equation (18):
where is the difference between positive sequence grid voltage and generated DG voltage, is the positive sequence utility grid voltage phasor angle at k processing interval and is the positive sequence DG voltage phasor angle at k processing interval.
The threshold value for voltage phase angle is computed through Equation (19):
where δTh is the threshold value of the phase angle (30° for this study) and n represents the number of samples per second (12 for this study).
2.4.4. Micro-Synchrophasor Based Rate of Change of Voltage Phase Angle Difference (ROCOVPAD)
The ROCOVPAD method utilizes the positive sequence voltage phase angle acquired from the utility grid and the islanded grid to calculate the angle difference δk as governed by Equation (18). The rate of change of δk defines the ROCOVPAD Sfk as given by Equation (20):
where, Sfk is the ROCOVPAD at the k processing interval, δk and δk−1 are the consecutive voltage angle difference at times k and k − 1 and MRATE is the µPMU message rate (50 frames/sec for this study).
The angle difference can be viewed as an integration of frequency difference. When the frequencies of two disconnected systems are different, then the angle difference between the systems grows and hence, the rate of change of phase angle difference also increases. Unit step variation in frequency component beyond the threshold value of VPAD value leads to an increase in ROCOVPAD values of about 360 deg/sec. An article on phase angle calculations: considerations and use cases published by the North American Synchrophasor Initiative (NASPI) was taken as reference in calculating threshold values [54].
2.4.5. Micro-Synchrophasor Based Frequency Estimation
In µPMU based frequency estimation method, the frequency of the voltage signal is calculated in accordance with Equation (21):
where θk and θk−1 are the consecutive positive sequence voltage angles at k and k − 1 processing intervals and ∆t is the time difference between angle calculations.
∆t is calculated using Equation (22):
where Fs is the µPMU reporting rate.
2.4.6. Micro-Synchrophasor Based Rate of Change of Frequency (ROCOF)
µPMU calculates the ROCOF by computing the time derivative of the difference in consecutive frequency estimations and is represented as in Equation (23):
where fk and fk−1 are consecutive frequencies estimated by the µPMU at time k and k − 1 and Fs is the µPMU reporting rate.
3. Proposed Micro-Synchrophasor Based IDM
In a balanced operating state, the generators produce power to meet the load requirements. Hence, load requirements are calculated a priori and generators are scheduled to operate close to the loading limits. Hence, there exists a perfect match between power generation and load requirement. Consider a case where power generated is greater than the load requirement, the system frequency increases and if the load requirements are higher than the generating capacity, then the frequency will reduce drastically. These factors are significant in an islanded condition rather than a grid-connected system. Under frequency/over frequency conditions are used to detect islanding of a network with proper threshold values.
During islanding conditions, when the threshold for frequency deviation is set to a lower value, then the frequency of the power system network decreases slowly resulting in a longer time duration for the trip signal to be generated during lower power mismatches. Hence, ROCOF relays are deployed when frequency variations are limited as in APM conditions.
In a power system network, real and reactive power flows are governed by parameters such as operating frequency and voltage, respectively. As already discussed, frequency is a function of the active power and any change in voltage is governed by changes in the reactive power flows in the system. Hence, switching of loads alters the reactive power requirements in the system, therefore the operating voltage gets affected. When reactive power requirements are high, nominal operating voltage falls below the pre-specified limits (threshold values) and vice versa. These conditions are highly appreciable under islanded condition rather than grid-connected conditions, with which an islanding can be easily detected.
In general, DGs are operated close to UPF conditions with the help of capacitor banks. The reactive power generation is governed by the operating voltage of distributed generation. When islanding occurs, operating voltage (as discussed above) changes, and hence, with a change in voltage, the reactive power generated by the capacitor banks also varies.
When reactive power mismatches (RPM) are higher, UV/OV relay will generate a trip signal and hence, the DG can be isolated from the distribution network. Consider a case where, a low power factor load (lag p.f.) is detached from the utility grid. It can be understood that the reactive power requirements of an LPF load (lag) will be higher and hence, RPM will be appreciable, therefore, UV/OV relay will isolate the DG from the distribution network on the occurrence of an islanded condition. On the other hand, when a unity power factor (UPF) load is disconnected from the system, its reactive power requirements will be very low, hence RPM may not be appreciable in detecting the islanding of a network. Hence under low RPM, the relay may fail. This issue can be overcome by utilizing a ROCOV relay with appropriate threshold values.
The frequency variations in the system are related to APM. When the APM is very low, UF/OF, ROCOF relays are ineffective in detecting the islanding conditions. Frequency surges also affect the performance of the above-mentioned relays.
Changes in the operating voltage of the power system are due to RPM. When the RPM is too low, traditional detection methods such as UV/OV, ROCOV relays are ineffective in detecting the islanding of a network. Under certain conditions, when threshold limits are relaxed the above-mentioned relays may detect islanding in a delayed manner. Due to delayed tripping of DGs, the IEEE standard 1547–2008 on DG tripping time cannot be achieved.
Methods such as rate of change of phase angle difference (ROCOPAD) are also reported in the literature, but it is ineffective in discriminating ISs and NISs which is a drawback. ROCOPAD calculates the phase angle between voltage and current, with which islanding is detected.
Hence, there exists a need to develop algorithms with negligible or null NDZ and are faster in detecting the islanding of a network. In this work, a remote IDM based on micro-synchrophasor incorporated with passive islanding detection method is proposed to overcome the above issues and the same is validated on the IEEE 13 bus test feeder. The graphical representation of the proposed algorithm is shown in Figure 7.
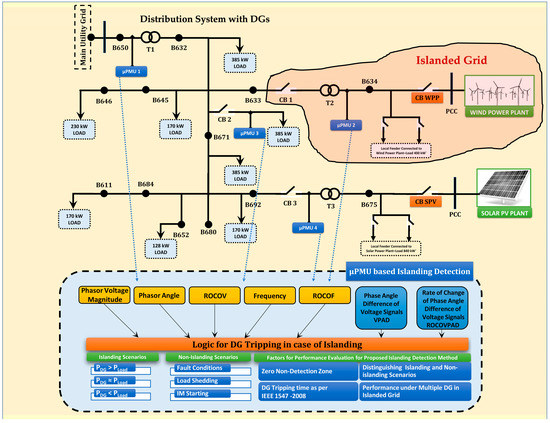
Figure 7.
Graphical representation of the proposed micro-synchrophasor based IDM.
Table 4 provides information on system parameters used in the modified IEEE 13 bus test system.

Table 4.
Parameter values of modified IEEE 13 bus test system.
The proposed algorithm is based on the data received from micro-synchrophasor located at PCC of DG, utility grid, and load terminals. Micro-synchrophasor measures the parameters such as positive sequence voltage and current magnitudes, phasor angles, frequency, ROCOF with GPS time-stamping. Apart from these, parameters such as ROCOV, PAD between voltage signals and ROCOVPAD are computed for islanding detection. The proposed IDM utilizes inputs from UF/OF, ROCOF relay for validating APM, and UV/OV, ROCOV relay for RPM. With the inputs from the above relays incorporated with µPMU based VPAD and ROCOVPAD methods, islanding detection is carried out. Also, the parameters such as VPAD and ROCOVPAD greatly change in islanding conditions, while they do not change under grid-connected operating conditions.
The µPMU-based IDM is validated for various islanding and non-islanding scenarios as described in [55]. Non-islanding scenarios include faults, motor starting conditions, and load shedding, while islanding conditions are verified for variations in APM and RPM. The NDZs are evaluated based on the power mismatch between DG and load. Also, the performance of the proposed algorithm is evaluated for IEEE standards on DG tripping time.
3.1. Algorithm for Proposed Micro-Synchrophasor Based IDM
The logic diagram of the proposed µPMU based IDM is shown in Figure 8. The algorithm for the proposed µPMU based IDM is explained with reference to the following ISs and NISs.
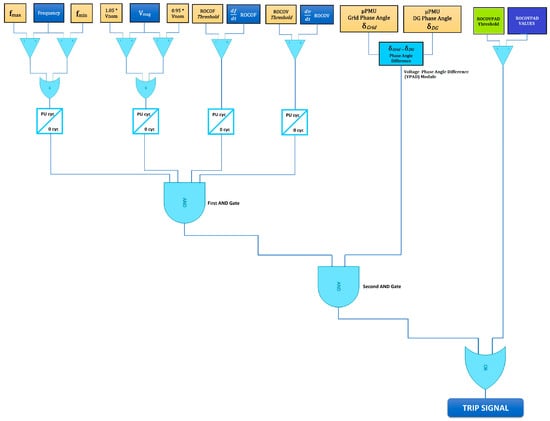
Figure 8.
Logic diagram for islanding detection.
The islanding scenarios considered are:
- (a)
- Power generated by DG > Power requirement of local loads
- (b)
- Power generated by DG < Power requirement of local loads
- (c)
- Power generated by DG ≈ Power requirement of local loads
and non-islanding scenarios are:
- (a)
- Faults
- (b)
- Load shedding
- (c)
- Starting characteristics of industrial motor loads (induction motors)
3.1.1. Islanding Scenarios
Consider the case (a), where the power generated by DG is greater than the actual power requirement of local loads. The power mismatches are computed for both APM and RPM. The frequency of the system varies significantly when there is an APM and the terminal voltages vary with variation in RPM.
After islanding, when the load requirements are less than the generated power, then the frequency of the power system network rises significantly and violates the maximum threshold for allowed frequency variations and the ROCOF values also vary rapidly and violates the threshold limit, because over frequency and ROCOF relays respond to the situation and outputs high binary signal at its terminals. Similarly, due to the low power requirements of the load, the voltage shoots up to new high value and violates the voltage setting of the relay. Hence, the over-voltage relay and ROCOV relay picks up the unprecedented situation and sets a high binary signal at its output terminals. In response to this, all input pins of the first AND gate goes high and outputs a logical high state. Under these conditions, the VPAD between the utility grid and DG is less than the threshold limit, and hence, the VPAD modules output a high binary signal. Since the two inputs of the second AND gate is at a high state, the output will be a logical high state. As the variations in the ROCOVPAD values are high, the ROCOVPAD relays also violate the threshold limits and hence outputs a high binary state. Since both the inputs of the OR gate are high, the OR gate generates a high binary signal, which would be the trip signal for the CB at PCC where the DG is interfaced with the distribution feeder. Thus, islanding condition is detected and DG is disconnected from the distribution grid.
Considering case (b), after islanding when the power generated by DG is much lesser than the actual power requirement of local loads, the frequency of the system reduces to a very low value, thereby violating the lower threshold limit of the frequency relay. Similarly, due to high load requirements, the voltage profile of the system drops down to a very low value violating the lower threshold voltage setting of the UV relay. Also, ROCOF and ROCOV relays respond similarly as in case (a). In response to this, all input pins of the first AND gate goes high and outputs a logical high. The VPAD between the utility grid and DG was less than the threshold limit and hence, the VPAD modules output a high binary signal. Since two inputs of the second AND gate goes high, the second AND gate maintain a high state. As the variation in ROCOVPAD values are higher violating the threshold limits, the relay outputs a logical high and hence the OR gate generates a high binary signal with these inputs, which would be the trip signal for the CB at PCC where DG is interfaced with the distribution feeder. Thus, islanding condition is detected and DG is disconnected from the distribution grid.
Case (c) deals with zero power mismatch conditions i.e., the power generated by DG is almost equal to the power requirement of local loads. Since the APM is very minimum, the frequency variation is also within the stable operating limit and the same condition holds good for voltage variation, since the RPM is minimal. Under these conditions, OF/UF, ROCOF, OV/UV, and ROCOV relays do not respond and hence the logical state of the relays is at low binary value. Hence, the first AND gate maintains its low binary state. Even under zero power mismatch conditions, the VPAD between the utility grid and DG was less than the threshold limit, and hence, the VPAD modules output a high binary signal. Since, one of the inputs is at a low state, the second AND gate maintains its low binary state. As the variation in ROCOVPAD values is higher violating the threshold limits, the relay outputs a logical high and hence the OR gate goes to a high state, with these inputs and thereby islanding is detected under zero power mismatch conditions. This high binary signal trips the DG interfaced with the distribution feeder. Hence, even at zero mismatch conditions VPAD and ROCOVPAD modules detect the islanding conditions accurately.
3.1.2. Non-Islanding Scenarios
During most of the non-islanding scenarios, the system frequency is found to be less affected than other parameters. However, OF/UF and ROCOF relays may mal operate depending on the non-islanding scenario. The voltage profile of the system drops drastically during non-islanding conditions, due to which, OV/UV and ROCOV relay may detect the occurrence of the non-islanding condition. Under these conditions, the output of the first AND gate will remain in low binary state. Meanwhile, the VPAD values increase beyond the threshold value, and hence, the VPAD module maintains a low binary state. The second AND gate also maintains its low state since both of its inputs are at low states. As the variations in VPAD values are limited the ROCOVPAD values will be lesser than the threshold limit and hence the module outputs a low binary signal. Both the inputs to the OR gate are in low binary state and hence no trip signal is generated. Thus, the proposed algorithm discriminates between ISs and NISs and disconnects the DG only during islanding conditions.
µPMU-based remote IDM relies on the communication infrastructure for decision making and in case of latency, passive islanding detection methods with the help of local measurements generate appropriate trip signals to disconnect DG from the distribution grid. Thus, passive islanding method acts as a backup protection for micro-synchrophasor-based IDM.
4. Results and Discussion
The results of the µPMU-based IDM are validated under the following operating conditions (a) steady state operating conditions (b) islanding conditions and (c) non-islanding conditions.
4.1. System under Steady-State Operating Conditions
The steady-state operating conditions are simulated on the IEEE—13 bus distribution system with two DGs namely wind power plant and solar photovoltaic system. The feeder connecting the DG (wind power plant is considered here for discussion purposes) is loaded up to its normal operating conditions. The simulation results show no variations in the voltage and frequency, as they are operating within their steady-state limits. The ROCOV and ROCOF values are also well below the threshold conditions. With these inputs, the first AND gate will maintain its logical low state.
With the phasor angle data received from the µPMU1 and µPMU2, the VPAD between positive sequence grid voltage angle and PCC voltage angle is calculated. Also, the ROCOVPAD is calculated based on the VPAD. It can be inferred that under steady-state, the VPAD and ROCOVPAD values are below the threshold values and hence, the VPAD module outputs a high binary signal, whereas the ROCOVPAD module outputs a low binary signal. With these inputs, it can be inferred that the second AND gate also maintain its logical low state. Since both inputs to the OR gate is at low state and the status of the OR gate is also maintained at a low binary state, indicating that no islanding scenario has occurred in the distribution grid. The grid remains stable under steady-state conditions in the presence of distributed generation.
4.2. System under Islanded Operating Conditions
4.2.1. Case (i) Islanding Condition: Power Generated by DG > Power Requirement of Local Loads (High Power Mismatch)
The islanding condition is simulated on the IEEE 13 bus distribution feeder by the opening of the circuit breaker CB1 near the node B633. Hence, a part of the distribution feeder with local loads and DG was detached from the main grid and an island has been created. Studies have been carried out by varying the active and reactive power requirements of the load. With the inputs from various parameters measured from the islanded grid, the proposed micro-synchrophasor based IDM is validated for NDZ and DG tripping time. For the study, the loads are varied from −80% to 100% for APM and 20 to 100% for RPM of the local loads connected to the PCC. The islanding was simulated at time t = 3 s. The feeder voltage, DG voltage magnitude and phase angle recorded by µPMU2 are shown in Figure 9a–c. Under high mismatch conditions i.e., when the power delivered by DG is very high when compared to the load requirements, it can be seen that the voltage magnitude varies beyond the upper threshold limit of Vmax = 1.05 p.u and hence, the over voltage relay picks up the signal and sets a high binary signal at its output. Also, the variation in islanded grid voltage was seen in the ROCOV values, thereby violating the ROCOV threshold value of 0.5 V/s, and hence a logical high state was set by ROCOV relay as shown in Figure 9d. The frequency and ROCOF values measured by µPMU2 are shown in Figure 9e,f. It is inferred that the frequency of the islanded grid increases drastically and exceeds the upper threshold of fmax = 60.5 Hz. Also, the ROCOF value increases rapidly and exceeds the threshold value of 1.8 Hz/s at a very shorter duration. Hence, both over frequency relay and ROCOF relay output a high binary state at its terminals.
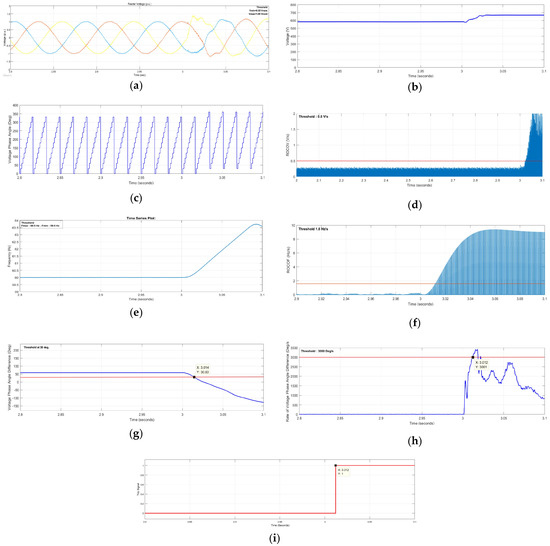
Figure 9.
Results of case (i) Islanding condition: power generated by DG > power requirement of local loads. (a) Feeder voltage; (b) DG voltage magnitude; (c) DG voltage phase angle; (d) ROCOV relay; (e) frequency relay; (f) ROCOF relay; (g) Voltage phase angle difference; (h) Rate of change of voltage phase angle difference; (i)Trip Signal.
In the proposed µPMU-based VPAD method, a threshold value of the change of angle difference is set to 30° can only detect the events such as ISs and NISs. The threshold value is the difference between the angle before the pre-island condition and the set value of change of angle difference. Considering the case of an islanding event, it is observed that at the inception of the island at time t = 3 s, the phase-angle difference between the DG and the utility grid falls down the pre-island condition of 60° to a minimum value of −150°. In this case, the threshold value was calculated as 30° (60° − 30° = 30°). The angle difference characteristic curve drops below the threshold value in case of islanding and increases beyond the threshold value in case of non-islanding conditions. Considering the islanding scenario at time t = 3 s, the phase angle difference curve started dropping below the pre-island condition and the angle difference value dropped below the threshold limit of 30° at time t = 3.014 s. On violation of these criteria, islanding is detected, and the angle difference module sets a high binary signal at its output. Hence, an island is identified at a time duration of 14 ms. The ROCOVPAD value is computed and compared with the threshold value of 3000 deg/s. It can be observed that the rate of VPAD values is higher than the threshold values at time t = 3.012 s and the relay sets a high state at its output. The island is detected by this module with a time duration of 12 ms. Figure 9g,h. show the variations in VPAD and ROCOVPAD. Since, OV/UV, OF/UF, ROCOV, and ROCOF relays are in a high state the output of first AND gate is set to a logical high state. Since the output of first AND gate is high and the output of PAD is high, the second AND gate sets a logical high at its output. As the output of second AND gate and ROCOVPAD module is high the OR gate sets a high binary signal at its terminals and a trip signal is generated at time t = 3.012 s as the ROCOVPAD module responded quickly when compared to other modules and hence the OR gate has generated a trip signal at time t = 3.012 s The generated trip signal is shown in Figure 9i. The island is created at time t = 3 s and trip signal to circuit breaker CB-WPP near PCC is generated at time t = 3.012 s to disconnect the DG, thereby islanding was successfully detected at a time interval of 12 ms.
4.2.2. Case (ii) Islanding Condition: Power Generated by DG < Power Requirement of Local Loads (High Power Mismatch)
After islanding, when the power generated by DG is less than load requirements, all the parameters except the voltage varies, in a similar manner as discussed in case (i), since case (i) is also a high-power mismatch condition. When the load requirements are higher than the generation, then the voltage of the feeder falls to a low value lesser than the lower threshold of Vmin = 0.95 p.u. Hence, the under-voltage relay picks up this condition and sets a logical high at its output. It can be observed that the frequency of the islanded grid also drops down drastically and exceeds the lower threshold of fmin = 59.5 Hz. Also, the ROCOF value increases beyond the threshold value of 1.8 Hz/s at a very shorter duration. Hence, both under frequency relay and ROCOF relay outputs a binary high at its terminals. The VPAD and ROCOVPAD modules respond similarly as discussed in case (i) and sets a logical high at its outputs.
The input bits for both the AND gates are high and hence the outputs are at a high state. Consistent with the above gate outputs, the OR gate also generates a high binary signal. The island is created at time t = 3 s and trip signal to circuit breaker CB-WPP was generated at time t = 3.012 s to disconnect the DG, thereby islanding is successfully detected. The various plots related to the case (ii) are shown in Figure 10a–h.
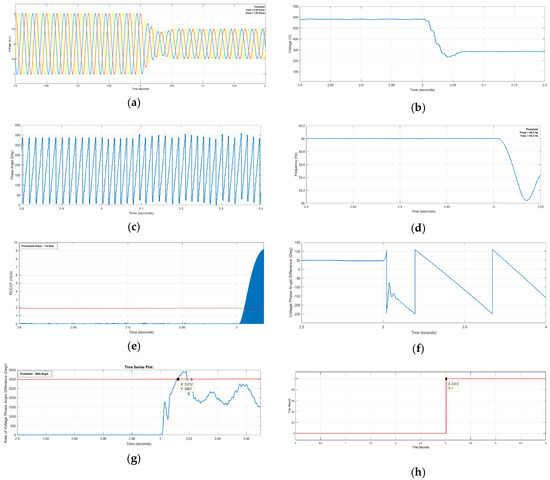
Figure 10.
Results of case (ii) Islanding condition: power generated by DG < power requirement of local loads. (a) Feeder voltage; (b) DG voltage magnitude; (c) DG voltage phase angle; (d) frequency relay; (e) ROCOF relay; (f) Voltage phase angle difference; (g) Rate of change of voltage phase angle difference; (h) Trip Signal.
4.2.3. Case (iii) Islanding Condition: Power Generated by DG = Power Requirement of Local Loads (Low Power Mismatch)
When the power generated by DG matches the load power requirements closely, the variations in the operating voltage of the island grid is very low, as the RPM is very low. Since the voltage variations are between the upper and lower threshold limits (Vmax = 1.05 p.u. and Vmin = 0.95 p.u.) of the UV/OV relay settings, the output of the relay is maintained at a low binary state. The same condition is suitable for OF/UF relay as APM is low, the frequency is maintained well between the threshold limits (fmax = 60.5 Hz and fmin = 59.5 Hz). It is inferred that UV/OV, ROCOV, and UF/OF relays are at low binary state during zero power mismatch conditions. Since the slope of the variation of frequency is high, maloperation in ROCOF relays can be observed during some cases of low power mismatch scenarios due to which ROCOF relay sets a binary high state. In spite of binary high state at ROCOF relay, the first AND maintains its binary low state. During these conditions, the VPAD between the utility grid and the islanded grid is found to be lesser than the threshold value of 30° and the condition is identified as islanding and logical high is given as input to second AND gate. As one of its input is at a low state, the second AND gate outputs a low binary state. As the variations of VPAD between utility and island grid is very high, the ROCOVPAD values exceed the threshold value of 3000 deg/s with a slight delay at time t = 3.014 s (when compared with high power mismatches) and set a logical high at its outputs. This input drives the OR gate to produce a high state at its output and hence, the trip signal to DG is generated. During low power mismatch conditions, it is found that all modules except VPAD and ROCOVPAD modules had been mal operated. The VPAD parameter is the guiding factor in determining the islands during zero or low power mismatch conditions. The plots for various parameters discussed for low power mismatch conditions are shown in Figure 11a–i. The island is created at time t = 3 s and the trip signal to circuit breaker CB WPP is generated at time t = 3.014 s to disconnect the DG, thereby islanding is successfully detected.
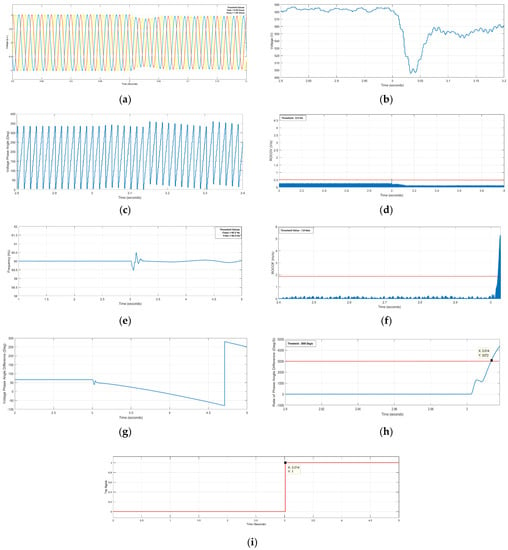
Figure 11.
Results of case (iii) Islanding condition: power generated by DG ≈ power requirement of local loads. (a) Feeder voltage; (b) DG voltage magnitude; (c) DG voltage phase angle; (d) ROCOV relay; (e) frequency relay; (f) ROCOF relay; (g) Voltage phase angle difference; (h) Rate of change of voltage phase angle difference; (i)Trip Signal.
4.2.4. Case (iv) Non-Islanding Condition: Short Circuit Fault
The reliability of the proposed IDM is also tested when a three-phase short circuit fault occurs on the distribution feeder. The short circuit fault is simulated at node B633 of the IEEE 13 bus distribution feeder. During short circuit conditions, the frequency of the system remains stable with small variations, hence UF/OF relays do not operate. Due to surges in frequency values and as the rate of variation of slope of the frequency quantity is higher, the ROCOF values exceed the threshold limits and have mal operated under short circuit conditions. On the other hand, the voltage drops drastically with a lower slope and the ROCOV values are well below the threshold values. Since ROCOV relays have not operated, the output of the first AND gate will be in a low state.
Considering the fault condition at time t = 3 s, the phase angle difference curve started increasing above the pre-fault value as well as above the threshold limit since the inception of fault. As the phase angle difference values are higher than the threshold value of 30°, the condition was identified as a non-islanding state and no actions were taken further. The phase angle module also maintains a low state during fault conditions and hence, the output of second AND gate is also at low binary state. The ROCOVPAD value is computed and compared with the threshold value of 3000 deg/s. It can be observed that the ROCOVPAD values are very low in the order of 200 deg/sec and hence, the relay maintains the low state at its output. With these inputs, the output of the OR gate is set to a binary low condition and no trip signal is generated under fault condition. Hence, the proposed method does not operate under fault condition which is a non-islanding scenario. The graphs representing various relay outputs are shown in Figure 12a–i.
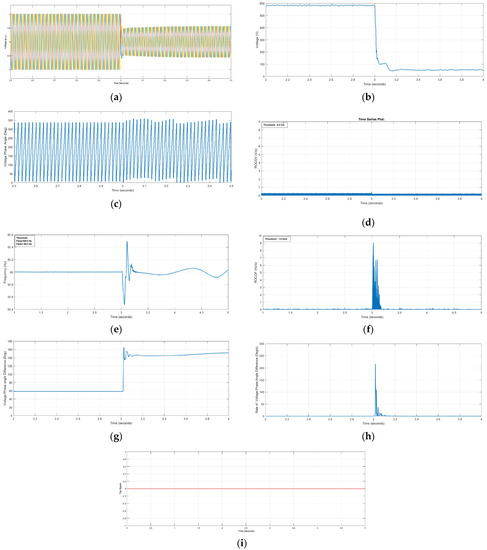
Figure 12.
Results of case (iv) Non-islanding condition: short circuit fault. (a) Feeder voltage; (b) DG voltage magnitude; (c) DG voltage phase angle; (d) ROCOV relay; (e) frequency relay; (f) ROCOF relay; (g) Voltage phase angle difference; (h) Rate of change of voltage phase angle difference; (i)Trip Signal.
4.2.5. Case (v) Non-Islanding Condition: Load Shedding
To realize the non-islanding condition, a 100 kVA load connected to the local feeder of the DG is disconnected and studies are carried out. At time t = 3 s the loads are disconnected from the network. It can be observed that there is a marginal increase in system voltage and it was well within the upper and lower threshold limits. As the system voltage increases with marginal slope the UV/OV and ROCOV relays do not respond under this condition.
Meanwhile, the frequency of the system has violated the upper threshold limit and hence UF/OF relay has responded to the situation. Also, the ROCOF values are observed to be higher than the threshold values because the variation of slope of the frequency quantity is very high. Hence, it can be inferred that the frequency and ROCOF relays mal operate under certain non- islanding scenarios, and there exists a need to set proper threshold limits.
Due to these input conditions, the output of the first AND gate remain in low binary state. The VPAD values are higher than 30° and the ROCOVPAD module does not meet the threshold condition of 3000 deg/s and hence both the relays are at a low binary state. With these inputs, the output of the second AND gate is set to a low binary condition. The OR gate also maintains its low state under these conditions and hence, no trip signal is generated under load shedding condition. Hence, the proposed method does not operate under load shedding condition which is a non-islanding scenario. The graphs representing various relay outputs are shown in Figure 13a–i.
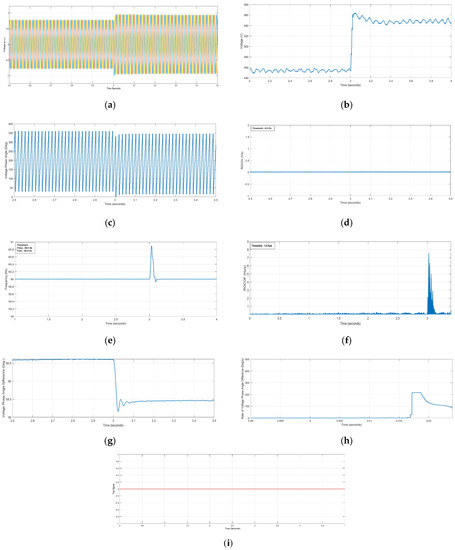
Figure 13.
Results of case (v) Non-islanding condition: load shedding. (a) Feeder voltage; (b) DG voltage magnitude; (c) DG voltage phase angle; (d) ROCOV relay; (e) frequency relay; (f) ROCOF relay; (g) Voltage phase angle difference; (h) Rate of change of voltage phase angle difference; (i)Trip Signal.
4.2.6. Case (vi) Starting Characteristics of Industrial Motor loads
The starting characteristics of the three-phase induction motor is studied for its impact on the proposed IDM. A 2.4 MW induction motor load is configured at node B634 for this purpose. A cumulative load of 10 units of 320 HP induction motors is connected across two local feeders at this node. Due to inrush currents at the time of starting, the voltage decreases below the nominal value, and hence, ROCOV values have exceeded the threshold limits, due to which under-voltage relay and ROCOV had detected the unprecedented condition. The system frequency is not affected under this scenario and hence, frequency and ROCOF relays have not responded to it. Under these inputs, the first AND gate maintained its low binary state. The values of the VPAD module are found to be greater than 30° and the ROCOVPAD values are below the threshold limits. With reference to the above inputs, the second AND gate maintained its low state, and the status of the OR gate remains unchanged. Hence, the proposed algorithm remained stable for induction motor starting characteristics. Since the values of VPAD and ROCOVPAD are the deciding factors of the proposed algorithm, the graphs corresponding to VPAD and ROCOVPAD are shown in Figure 14a–c.
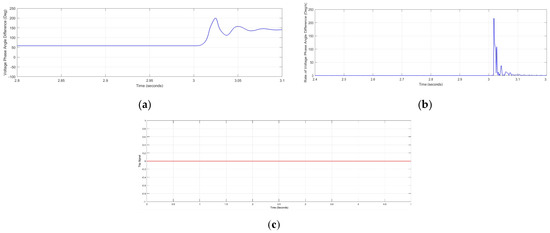
Figure 14.
Results of case (vi) Starting of Industrial Motor Loads. (a) Voltage phase angle difference; (b) Rate of change of voltage phase angle difference; (c) Trip Signal.
4.2.7. Case (vii) Effect of Multiple DGs on the Islanded Grid
Effect of multiple DGs on islanding detection is carried out by accommodating a solar PV plant in addition to the wind power plant in the islanded grid as discussed earlier. It is observed that the performance of the proposed algorithm is similar to that of a single DG in the islanded grid and the proposed IDM is not affected by the presence of another DG within the island zone. Since the values of VPAD and ROCOVPAD are the deciding factors of the proposed algorithm, the graphs corresponding to VPAD and ROCOVPAD are shown in Figure 15a,b.

Figure 15.
Results of case (vii) Effect of Multiple DGs on the Islanded Grid. (a) Voltage phase angle difference; (b) Rate of change of voltage phase angle difference.
Since the proposed micro-synchrophasor-based IDM can detect islands under zero power mismatch conditions, it can be concluded that the proposed method possesses a null non-detection zone with a high speed of island detection in the order of 14 ms.
Passive islanding detection methods mal-operate during ISs and NISs. It can be inferred that during low power mismatches, short circuit, and load shedding conditions the ROCOF relay has mal operated and ROCOV relay during induction motor starting characteristics. Hence, incorporating μPMU based parameters (VPAD and ROCOVPAD) with passive islanding detection methods improve the system reliability in discriminating the islanding and non-islanding scenarios as well as islanding detection during low power mismatch conditions.
4.3. Summarized Results of the Proposed Micro-Synchrophasor Based IDM
The islanding detection time of the proposed micro-synchrophasor based IDM is tabulated for various ISs and NISs in Table 5. It can be inferred that islanding is detected within 14 ms of occurrence of the island which is well with IEEE 1547 standards and has not responded during the non-islanding scenarios.

Table 5.
Results of proposed IDM.
4.4. Comparative Study with Other Islanding Techniques
Table 6 tabulates the parameters that affect islanding and compares those parameters of traditional IDMs with the proposed IDM. The proposed method has a lower detection time when compared with other methods and it possesses null NDZ.

Table 6.
Comparison of proposed islanding detection method with other IDMs.
The performance of the proposed micro-PMU-based islanding detection method is compared with other IDMs found in the literature against various metrics such as non-detection zone, detection time, and impact of multiple DGs in the same islanded grid.
From Table 6, it can be inferred that in the case of active IDMs [8,10,11,56,57] the non-detection zone is found to be very small, but due to perturbations introduced into the electrical system, the island detection time is higher in the order of 100 to 900 ms depending on the nature of perturbations introduced. Also, issues such as synchronization arise when multiple DGs of different types (inverter fed and synchronous) are there in the islanded grid. It was also observed that due to perturbations power quality of the grid also gets affected. Active IDMs with its salient feature of a very small non-detection zone suffers from drawback such as very high detection time, synchronization, and power quality issues.
Meanwhile, passive IDMs [13,16,17] possess a high speed of island detection, with a compromise in the non-detection zone. Also, the minimum values of APM and RPM mismatches are required for detecting islands. To overcome the above issues, hybrid methods [24,25] combination of active and passive IDMs was reported. Hybrid IDMs acquire the salient feature of both methods; hence, they possess small NDZ with reasonable island detection time. But minimal effects of degradation of power quality and synchronization issues were reported in some cases.
On the other hand, hybrid IDMs based on signal processing technique [26,30] and communication-based remote IDMs [33,34,58] are accurate, efficient, fast, and reliable in detecting islands but they have high computational burden and cost concerns. Remote IDMs dominates the IDMs with its high speed of detection in the order of 20 ms with very small or almost zero NDZ. Dedicated hardware with computationally complex algorithms is the drawback of the remote IDMs.
In comparison with the above algorithms, the proposed micro-synchrophasor-based islanding detection algorithm detects islanding conditions within 12 ms in case of high-power mismatch and 14 ms in case of low power mismatch. Also, it discriminates between islanding and non-islanding scenarios. In comparison with remote IDMs reported in the literature, the proposed method possesses zero NDZ and does not require any additional infrastructure for its implementation, since they can easily be integrated into digital protection relays, with synchrophasor functionality which is currently in practice. Hence, in comparison with other IDMs, it possesses less computational burden and financial feasibility, apart from the high speed of detection and null NDZ.
Since the proposed method is a communication-based IDM, issues concerning latency and data acquisition in harmonic and unbalanced conditions are reported. With advancements in micro-synchrophasors, the error due to latency is incorporated and novel phasor estimation techniques, the error rate in the system is 0.088% for unbalanced magnitudes and 0.052° for phase angle. Hence, the proposed method is highly reliable.
5. Conclusions
With a large amount of capacity addition happening through DGs in the distribution grid, the demanding issue with DG integration is the islanding detection. If islanding is not detected properly it poses a threat to utility workers and capital equipment. In this work, the proposed micro-synchrophasor-based IDM is investigated to overcome the issues like large NDZ and high tripping time as seen in conventional islanding methods. Micro-synchrophasor has become an integral part of the modern smart distribution grid in overcoming the above issues. Micro-synchrophasor-based VPAD and ROCOVPAD parameters are taken as the key factors in detecting islanding conditions. The performance of the algorithm was tested on IEEE 13—bus distribution feeder for ISs and NISs. Under high power mismatch conditions, islanding is successfully detected at a time interval of 12 ms whereas during low power mismatch conditions the algorithm took 14 ms to detect the island. Thus, the proposed method possesses null NDZ and also satisfies the IEEE 1547 standard for the DG tripping time of 2 s. Traditional islanding detection methods fail during low power mismatch or takes higher time to detect islanding conditions. But with the proposed VPAD- and ROCOVPAD-based methods, the above issues have been rectified. Also, the performance of the algorithm is tested under non-islanding scenarios such as fault conditions, load shedding, and induction motor starting conditions. The proposed algorithm has not responded during non-islanding scenarios. Thus, the proposed algorithm efficiently distinguishes the ISs and NISs. Also, the proposed micro-synchrophasor-based IDM does not require any additional infrastructure for its implementation, since they can be easily integrated into digital protection relays, with synchrophasor functionality. Hence, in comparison with other IDMs, the proposed IDM possesses less computational burden and is financially feasible, apart from the high speed of detection and null NDZ. With µPMUs, a situational awareness dashboard can also be developed in the future for monitoring and protection against islanding.
Author Contributions
Conceptualization, investigation, methodology, software, validation, and writing of the original draft preparation was done by K.S.; Data curation, formal analysis, funding acquisition, project administration, resources, supervision, and visualization were done by A.K.L. All authors have reviewed and edited the manuscript. All authors have read and agreed to the published version of the manuscript.
Funding
This research received no external funding.
Acknowledgments
This work was supported by ASEAN - India Science & Technology Development Fund (DST), under Grant of No. IMRC/AISTDF/R&D/P-2/2017 for the ASEAN—India Collaborative Research Project entitled “Design and Development of Smart Grid Test Bed for Experimental Verification of Synchrophasor based Algorithms for Wide Area Monitoring, Protection, and Control (WAMPAC) for Power Grids with Large Penetration of Renewable Energy Resources”.
Conflicts of Interest
The authors declare no conflict of interest.
References
- Dutta, S.; Sadhu, P.K.; Jaya Bharata Reddy, M.; Mohanta, D.K. Shifting of research trends in islanding detection method—A comprehensive survey. Prot. Control Mod. Power Syst. 2018, 3, 1. [Google Scholar] [CrossRef]
- Kim, M.-S.; Haider, R.; Cho, G.-J.; Kim, C.-H.; Won, C.-Y.; Chai, J.-S. Comprehensive Review of Islanding Detection Methods for Distributed Generation Systems. Energies 2019, 12, 837. [Google Scholar] [CrossRef]
- Valsamas, F.; Voglitsis, D.; Rigogiannis, N.; Papanikolaou, N.; Kyritsis, A. Comparative study of active anti-islanding schemes compatible with MICs in the prospect of high penetration levels and weak grid conditions. IET Gener. Transm. Distrib. 2018, 12, 4589–4596. [Google Scholar] [CrossRef]
- Sivadas, D.; Vasudevan, K. An Active Islanding Detection Strategy with Zero Non detection Zone for Operation in Single and Multiple Inverter Mode Using GPS Synchronized Pattern. IEEE Trans. Ind. Electron. 2020, 67, 5554–5564. [Google Scholar] [CrossRef]
- Murugesan, S.; Murali, V. Hybrid Analyzing Technique Based Active Islanding Detection for Multiple DGs. IEEE Trans. Ind. Inform. 2019, 15, 1311–1320. [Google Scholar] [CrossRef]
- Mishra, P.P.; Bhende, C.N. Islanding detection scheme for distributed generation systems using modified reactive power control strategy. IET Gener. Transm. Distrib. 2019, 13, 814–820. [Google Scholar] [CrossRef]
- Zamani, R.; Hamedani-Golshan, M.E.; Haes Alhelou, H.; Siano, P.; Pota, H.R. Islanding Detection of Synchronous Distributed Generator Based on the Active and Reactive Power Control Loops. Energies 2018, 11, 2819. [Google Scholar] [CrossRef]
- Khodaparastan, M.; Vahedi, H.; Khazaeli, F.; Oraee, H. A Novel Hybrid Islanding Detection Method for Inverter-Based DGs Using SFS and ROCOF. IEEE Trans. Power Deliv. 2017, 32, 2162–2170. [Google Scholar] [CrossRef]
- Zamani, R.; Hamedani Golshan, M.E.; Haes Alhelou, H.; Hatziargyriou, N. A novel hybrid islanding detection method using dynamic characteristics of synchronous generator and signal processing technique. Electr. Power Syst. Res. 2019, 175, 105911. [Google Scholar] [CrossRef]
- Bakhshi-Jafarabadi, R.; Sadeh, J. New voltage feedback-based islanding detection method for grid-connected photovoltaic systems of microgrid with zero non-detection zone. IET Renew. Power Gener. 2020, 14, 1710–1719. [Google Scholar] [CrossRef]
- Murugesan, S.; Venkatakirthiga, M. Active Unintentional Islanding Detection Method for Multiple PMSG based DGs. IEEE Trans. Ind. Appl. 2020, 56, 4700–4708. [Google Scholar] [CrossRef]
- Nale, R.; Venkatanagaraju, K.; Biswal, S.; Biswal, M.; Kishor, N. Islanding detection in distributed generation system using intrinsic time decomposition. IET Gener. Transm. Distrib. 2019, 13, 626–633. [Google Scholar] [CrossRef]
- Almas, M.S.; Vanfretti, L. RT-HIL Implementation of the Hybrid Synchrophasor and GOOSE-Based Passive Islanding Schemes. IEEE Trans. Power Deliv. 2016, 31, 1299–1309. [Google Scholar] [CrossRef]
- Gupta, P.; Bhatia, R.S.; Jain, D.K. Active ROCOF Relay for Islanding Detection. IEEE Trans. Power Deliv. 2017, 32, 420–429. [Google Scholar] [CrossRef]
- Abd-Elkader, A.G.; Saleh, S.M.; Magdi Eiteba, M.B. A passive islanding detection strategy for multi-distributed generations. Int. J. Electr. Power Energy Syst. 2018, 99, 146–155. [Google Scholar] [CrossRef]
- Uros, M.; Demetris, C.; Petros, A.; Gabriela, H. Impact of inverter-based generation on islanding detection schemes in distribution networks. Electr. Power Syst. Res. 2021, 190. [Google Scholar] [CrossRef]
- Xing, X.; Chun, H.; Danni, L. A new passive islanding detection approach considering the dynamic behavior of load in microgrid. Int. J. Electr. Power Energy Syst. 2020, 117. [Google Scholar] [CrossRef]
- Shabani, H.; Vahidi, B.; Naghizadeh, R.A.; Hosseinian, S.H. Islanding Detection in Unbalanced Distribution Systems with Doubly Fed Induction Generator Based Distributed Generation Using Wavelet Transform. Electr. Power Compon. Syst. 2015, 43, 866–878. [Google Scholar] [CrossRef]
- Ahmadipour, M.; Hizam, H.; Lutfi Othman, M.; Amran Mohd Radzi, M. An Anti-Islanding Protection Technique Using a Wavelet Packet Transform and a Probabilistic Neural Network. Energies 2018, 11, 2701. [Google Scholar] [CrossRef]
- Kermany, S.D.; Joorabian, M.; Deilami, S.; Masoum, M.A.S. Hybrid Islanding Detection in Microgrid With Multiple Connection Points to Smart Grids Using Fuzzy-Neural Network. IEEE Trans. Power Syst. 2017, 32, 2640–2651. [Google Scholar] [CrossRef]
- Gupta, N.; Garg, R. Algorithm for islanding detection in photovoltaic generator network connected to low-voltage grid. IET Gener. Transm. Distrib. 2018, 12, 2280–2287. [Google Scholar] [CrossRef]
- Ghalavand, F.; Alizade, B.A.M.; Gaber, H.; Karimipour, H. Microgrid islanding detection based on mathematical morphology. Energies 2018, 11, 2696. [Google Scholar] [CrossRef]
- Dubey, R.; Popov, M.; Samantaray, S.R. Transient monitoring function-based islanding detection in power distribution network. IET Gener. Transm. Distrib. 2019, 13, 805–813. [Google Scholar] [CrossRef]
- Wang, G.; Gao, F.; Liu, J.; Li, Q.; Zhao, Y. Design consideration and performance analysis of a hybrid islanding detection method combining voltage unbalance/total harmonic distortion and bilateral reactive power variation. CPSS Tran. Power Electron. Appl. 2020, 5. [Google Scholar] [CrossRef]
- Kolli, A.T.; Ghaffarzadeh, N. A novel phaselet-based approach for islanding detection in inverter-based distributed generation systems. Electr. Power Syst. Res. 2020, 182. [Google Scholar] [CrossRef]
- Thomas, S.R.; Kurupath, V.; Nair, U. A passive islanding detection method based on K-means clustering and EMD of reactive power signal. Sustain. Energy Grids Netw. 2020, 23. [Google Scholar] [CrossRef]
- Cui, Q.; El-Arroudi, K.; Joós, G. Islanding Detection of Hybrid Distributed Generation Under Reduced Non-Detection Zone. IEEE Trans. Smart Grid 2018, 9, 5027–5037. [Google Scholar] [CrossRef]
- Tan, K.-H.; Lan, C.-W. DG System Using PFNN Controllers for Improving Islanding Detection and Power Control. Energies 2019, 12, 506. [Google Scholar] [CrossRef]
- Li, Y.; Zhang, P.; Li, W.; Debs, J.N.; Ferrante, D.A.; Kane, D.J.; Woolard, S.N.; Kalbfleisch, R.; Bowes, K.B.; Kasznay, A.J. Nondetection Zone Analytics for Unintentional Islanding in a Distribution Grid Integrated With Distributed Energy Resources. IEEE Trans. Sustain. Energy 2019, 10, 214–225. [Google Scholar] [CrossRef]
- Haque, A.; Alshareef, A.; Khan, A.I.; Alam, M.M.; Kurukuru, V.S.B.; Irshad, K. Data Description Technique-Based Islanding Classification for Single-Phase Grid-Connected Photovoltaic System. Sensors 2020, 20, 3320. [Google Scholar] [CrossRef]
- Bayrak, G.; Kabalci, E. Implementation of a new remote islanding detection method for wind–solar hybrid power plants. Renew. Sustain. Energy Rev. 2016, 58, 1–15. [Google Scholar] [CrossRef]
- Shrestha, A.; Kattel, R.; Dachhepatic, M.; Mali, B.; Thapa, R.; Singh, A.; Bista, D.; Adhikary, B.; Papadakis, A.; Maskey, R.K. Comparative Study of Different Approaches for Islanding Detection of Distributed Generation Systems. Appl. Syst. Innov. 2019, 2, 25. [Google Scholar] [CrossRef]
- Radhakrishnan, R.M.; Sankar, A.; Rajan, S. Synchrophasor based islanding detection for microgrids using moving window principal component analysis and extended mathematical morphology. IET Renew. Power Gener. 2020. [Google Scholar] [CrossRef]
- Katyara, S.; Hashmani, A.; Chowdhary, B.S.; Musavi, H.B.; Aleem, A.; Chachar, F.A.; Shah, M.A. Wireless Networks for Voltage Stability Analysis and Anti-islanding Protection of Smart Grid System. Wirel. Pers. Commun. 2020, 5. [Google Scholar] [CrossRef]
- Hojabri, M.; Dersch, U.; Papaemmanouil, A.; Bosshart, P. A Comprehensive Survey on Phasor Measurement Unit Applications in Distribution Systems. Energies 2019, 12, 4552. [Google Scholar] [CrossRef]
- Sharma, N.K.; Samantaray, S.R. Assessment of PMU-based wide-area angle criterion for fault detection in microgrid. IET Gener. Transm. Distrib. 2019, 13, 4301–4310. [Google Scholar] [CrossRef]
- Eissa, M.M. Developing wide area phase plane primary protection scheme “WA4PS” for complex smart grid system. Int. J. Electr. Power Energy Syst. 2018, 99, 203–213. [Google Scholar] [CrossRef]
- Guo, Y.; Li, K.; Laverty, D.M.; Xue, Y. Synchrophasor-Based Islanding Detection for Distributed Generation Systems Using Systematic Principal Component Analysis Approaches. IEEE Trans. Power Deliv. 2015, 30, 2544–2552. [Google Scholar] [CrossRef]
- Skok, S.; Frlan, K.; Ugarkovic, K. Detection and Protection of Distributed Generation from Island Operation by Using PMUs. Energy Procedia 2017, 141, 438–442. [Google Scholar] [CrossRef]
- Emma, M. Stewart and Alexandra von Meier. In Phasor Measurements for Distribution System Applications, Smart Grid Handbook; John Wiley & Sons, Ltd.: Hoboken, NJ, USA, 2016. [Google Scholar]
- Kumar, L.A.; Karthikeyan, S. Modeling of Phasor Measurement Unit for Wide Area Monitoring and control of Smart Grids with Distributed Energy Resources. In Proceedings of the 2016 IEEE Conference on Technologies for Sustainability (SusTech), Phoenix, AZ, USA, 9–11 October 2016; pp. 188–194. [Google Scholar] [CrossRef]
- Meier, A.V.; Stewart, E.; McEachern, A.; Andersen, M.; Mehrmanesh, L. Precision Micro-Synchrophasors for Distribution Systems: A Summary of Applications. IEEE Trans. Smart Grid 2017, 8, 2926–2936. [Google Scholar] [CrossRef]
- Dutta, S.; Sadhu, P.K.; Reddy, M.J.B.; Mohanta, D.K. Smart inadvertent islanding detection employing p-type µPMU for an active distribution network. IET Gener. Transm. Distrib. 2018, 12, 4615–4625. [Google Scholar] [CrossRef]
- Sun, Y.; Chen, X.; Yang, S.; Tseng, K.J.; Amaratunga, G. Micro PMU based monitoring system for active distribution networks. In Proceedings of the 2017 IEEE 12th International Conference on Power Electronics and Drive Systems (PEDS), Honolulu, HI, USA, 12–15 December 2017; pp. 518–522. [Google Scholar] [CrossRef]
- Appasani, B.; Mohanta, D.K. A review on synchrophasor communication system: Communication technologies, standards and applications. Prot. Control Mod. Power Syst. 2018, 3, 37. [Google Scholar] [CrossRef]
- Pouryekta, A.; Ramachandaramurthy, V.K.; Mithulananthan, N.; Arulampalam, A. Islanding Detection and Enhancement of Microgrid Performance. IEEE Syst. 2018, 12, 3131–3141. [Google Scholar] [CrossRef]
- Muda, H.; Jena, P. Phase angle-based PC technique for islanding detection of distributed generations. IET Renew. Power Gener. 2018, 12, 735–746. [Google Scholar] [CrossRef]
- IEEE Application Guide for IEEE Std 1547(TM), IEEE Standard for Interconnecting Distributed Resources with Electric Power Systems; IEEE Std 1547.2-2008; IEEE: Piscataway, NJ, USA, 2009; pp. 1–217. [CrossRef]
- Chandak, S.; Mishra, M.; Nayak, S.; Rout, P.K. Optimal feature selection for islanding detection in distributed generation. IET Smart Grid 2018, 1, 85–95. [Google Scholar] [CrossRef]
- Kim, I.; Regassa, R.; Harley, R.G. The modeling of distribution feeders enhanced by distributed generation in DIgSILENT. In Proceedings of the 2015 IEEE 42nd Photovoltaic Specialist Conference (PVSC), New Orleans, LA, USA, 14–19 June 2015; pp. 1–5. [Google Scholar] [CrossRef]
- Kersting, W.H. Radial distribution test feeders. In Proceedings of the 2001 IEEE Power Engineering Society Winter Meeting. Conference Proceedings (Cat. No.01CH37194), Columbus, OH, USA, 28 January–1 February 2001; pp. 908–912. [Google Scholar] [CrossRef]
- Chandak, S.; Mishra, M.; Rout, P.K. Hybrid islanding detection with optimum feature selection and minimum NDZ. Int. Trans. Elect. Energy Syst. 2018, 28, e2602. [Google Scholar] [CrossRef]
- Phadke, A.G.; Thorp, J.S. Synchronized Phasor Measurements and Their Applications; Springer: New York, NY, USA, 2008. [Google Scholar]
- Phase Angle Calculations: Considerations and Use Cases. Available online: https://www.naspi.org/node/633 (accessed on 6 September 2020).
- Zheng, T.; Yang, H.; Zhao, R.; Kang, Y.C.; Terzija, V. Design, Evaluation and Implementation of an Islanding Detection Method for a Micro-grid. Energies 2018, 11, 323. [Google Scholar] [CrossRef]
- Lopes, L.A.C.; Sun, H. Performance assessment of active frequency drifting islanding detection methods. IEEE Trans. Energy Convers. 2006, 21, 171–180. [Google Scholar] [CrossRef]
- Hamzeh, M.; Farhangi, S.; Farhangi, B. A new control method in PV grid connected inverters for anti-islanding protection by impedance monitoring. In Proceedings of the 2008 11th Workshop on Control and Modeling for Power Electronics, Zurich, Switzerland, 17–20 August 2008; pp. 1–5. [Google Scholar]
- Wang, W.; Kliber, J.; Zhang, G.; Xu, W.; Howell, B.; Palladino, T. A Power Line Signaling Based Scheme for Anti-Islanding Protection of Distributed Generators—Part II: Field Test Results. IEEE Trans. Power Deliv. 2007, 22, 1767–1772. [Google Scholar] [CrossRef]
© 2020 by the authors. Licensee MDPI, Basel, Switzerland. This article is an open access article distributed under the terms and conditions of the Creative Commons Attribution (CC BY) license (http://creativecommons.org/licenses/by/4.0/).