Article

Machine Learning Modeling for Energy Consumption of Residential and Commercial Sectors

1
Faculty of Mechanical and Energy Engineering, Shahid Beheshti University, Tehran 16589-53571, Iran
2
Department of Renewable Energy and Environment, University of Tehran, Tehran 14174-66191, Iran
3
Institute for Atmospheric and Earth System Research (INAR)/Physics, University of Helsinki, FI-00014 Helsinki, Finland
4
Department of Civil, Water and Environmental Engineering, Shahid Beheshti University, Tehran 16589-53571, Iran
5
Department of Computer Science, University of Helsinki, FI-00014 Helsinki, Finland
*
Author to whom correspondence should be addressed.
Energies 2020, 13(19), 5171; https://doi.org/10.3390/en13195171
Submission received: 15 August 2020 / Revised: 22 September 2020 / Accepted: 25 September 2020 / Published: 5 October 2020

Abstract

:
Energy has a strategic role in the economic and social development of countries. In the last few decades, energy demand has been increasing exponentially across the world, and predicting energy demand has become one of the main concerns in many countries. The residential and commercial sectors constitute about 34.7% of global energy consumption. Anticipating energy demand in these sectors will help governments to supply energy sources and to develop their sustainable energy plans such as using renewable and non-renewable energy potentials for the development of a secure and environmentally friendly energy system. Modeling energy consumption in the residential and commercial sectors enables identification of the influential economic, social, and technological factors, resulting in a secure level of energy supply. In this paper, we forecast residential and commercial energy demands in Iran using three different machine learning methods, including multiple linear regression, logarithmic multiple linear regression methods, and nonlinear autoregressive with exogenous input artificial neural networks. These models are developed based on several factors, including the share of renewable energy sources in final energy consumption, gross domestic production, population, natural gas price, and the electricity price. According to the results of the three machine learning methods applied in our study, by 2040, Iranian residential and commercial energy consumption will be 76.97, 96.42 and 128.09 Mtoe, respectively. Results show that Iran must develop and implement new policies to increase the share of renewable energy supply in final energy consumption.

1. Introduction

Energy is a vital need for contemporary human life and has profound impressions on social security, welfare as well as sturdy economic growth and development of a nation [1,2]. Despite the high cost and scarcity of energy [3], the growing world population has raised the global energy demand, especially in residential and commercial sectors. For example, energy demand had increased 2.3% in 2018 in comparison with 2017 [4].
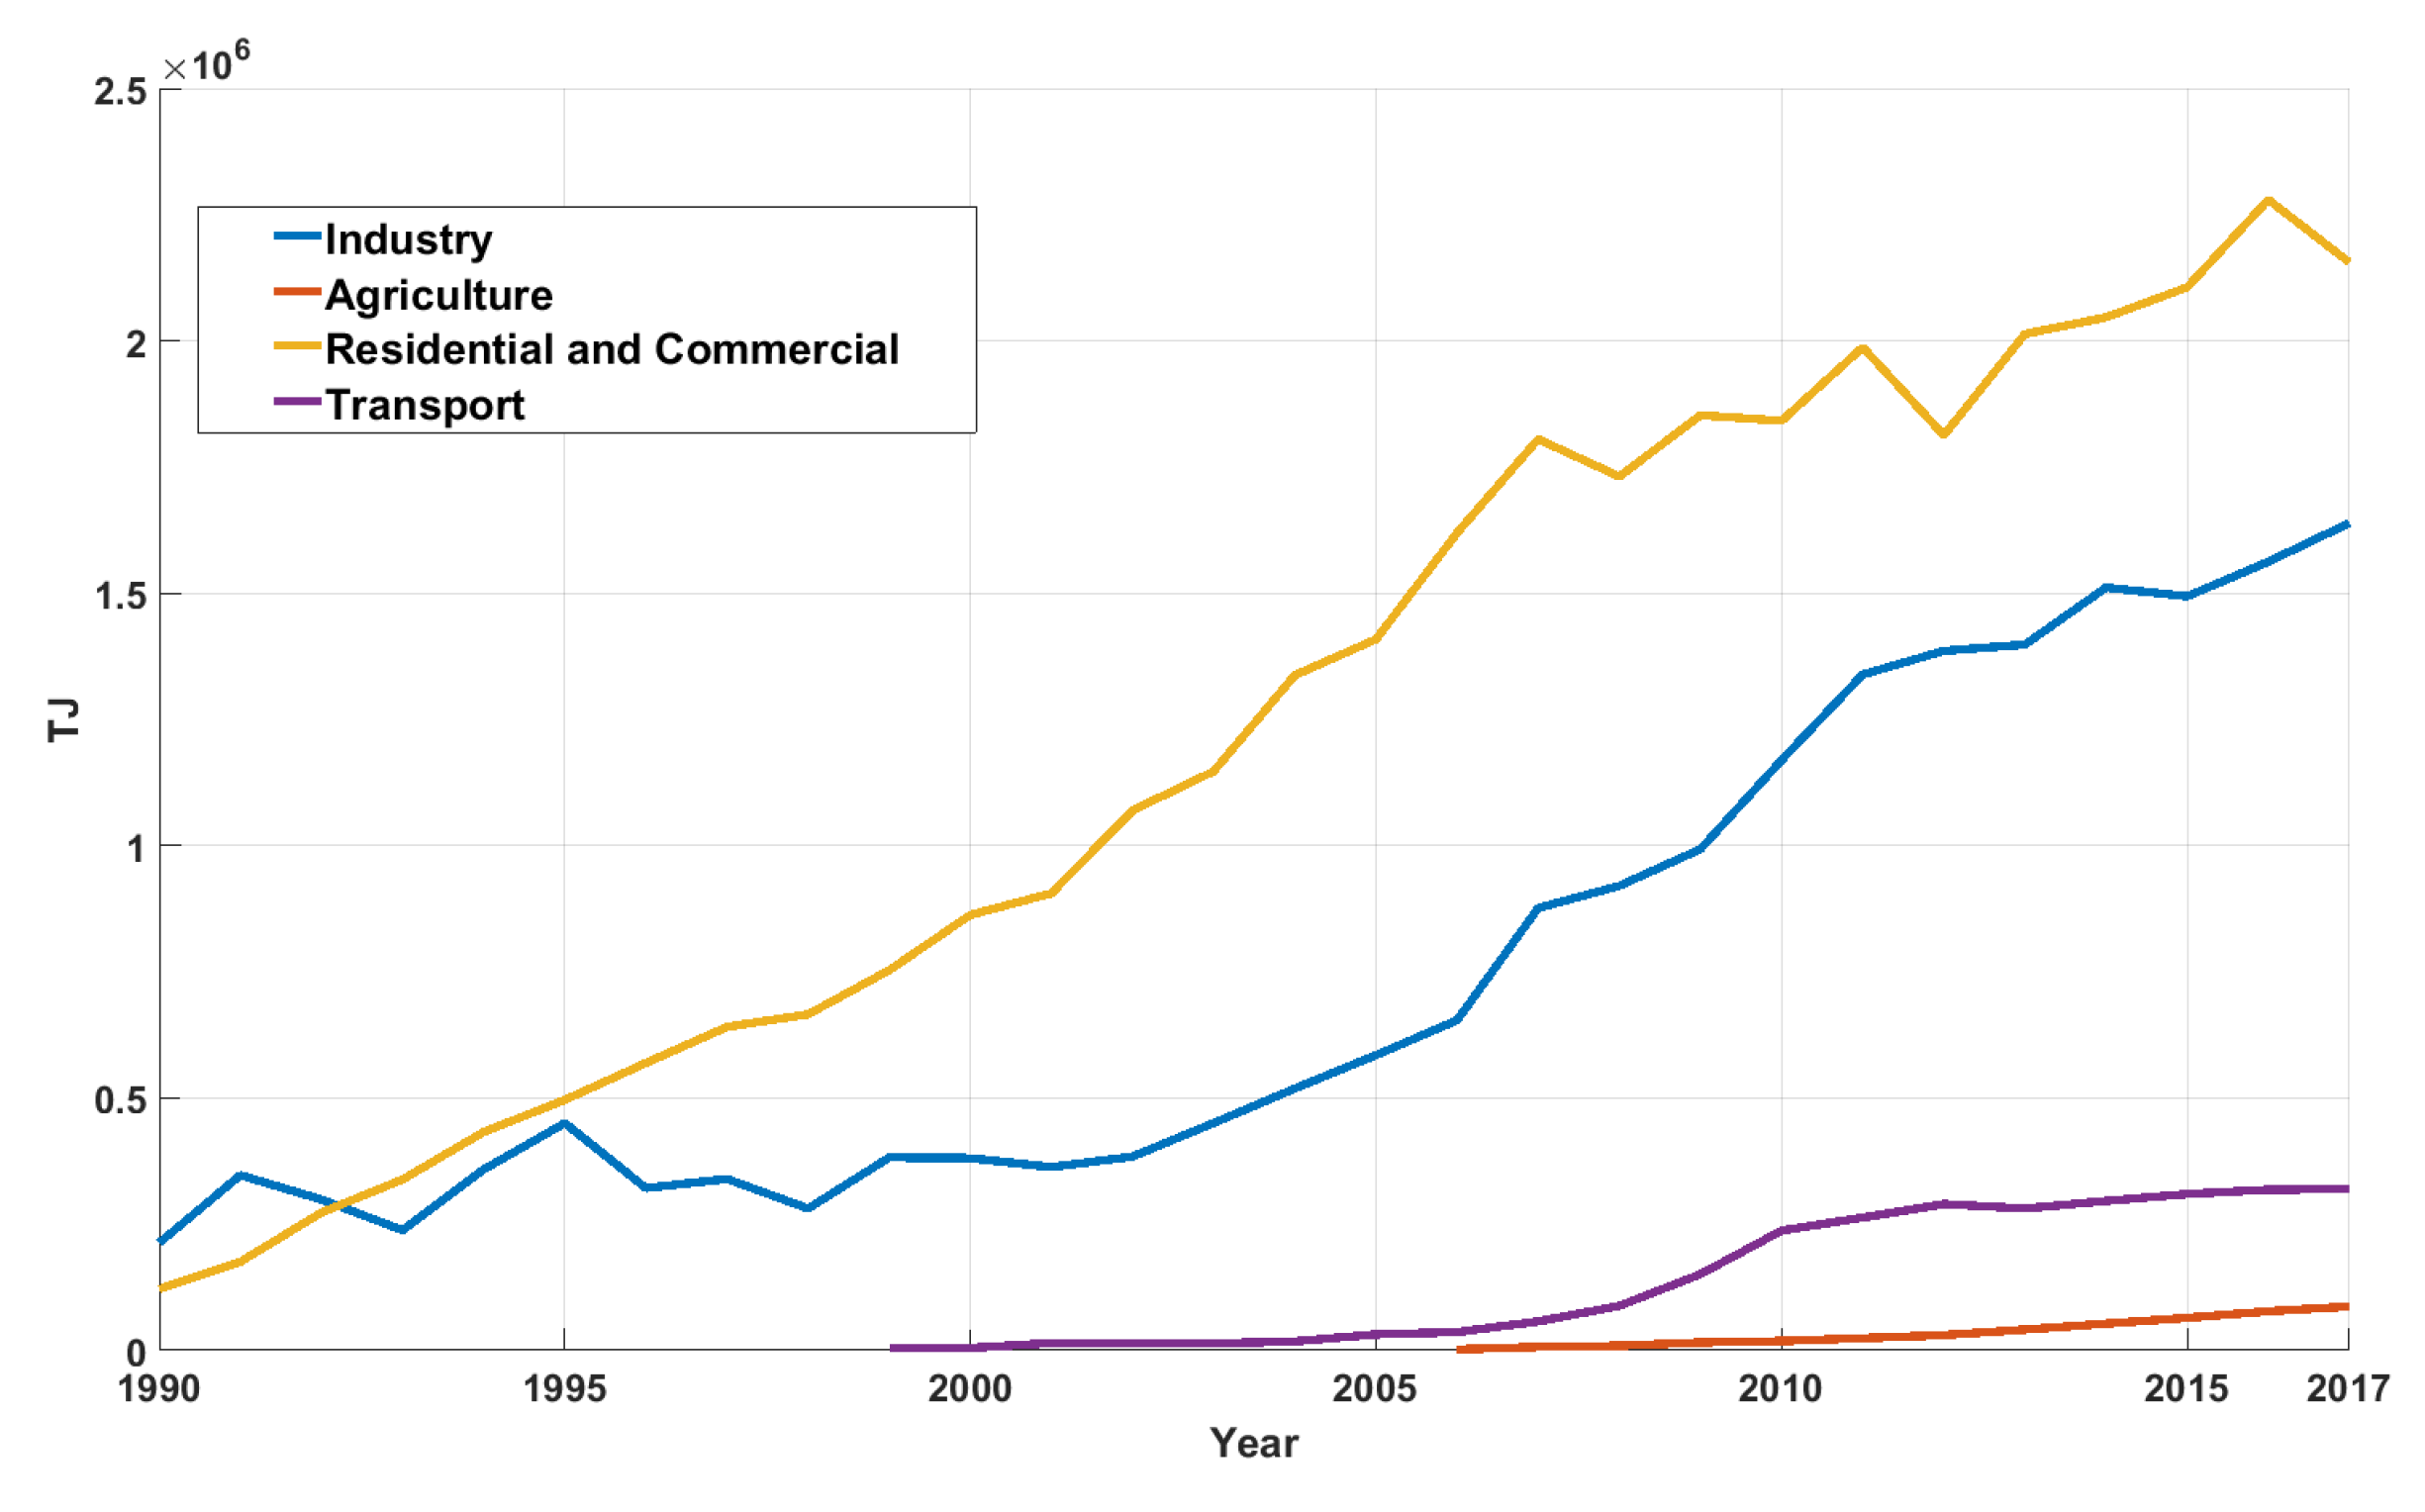
Residential and commercial buildings are the main sources of energy consumption in different countries [5]. Figure 1a shows the final energy consumption in Iran for different sectors in 2017. The Residential and Commercial Energy Consumption (RCEC) is about 33% in Iran, while all other sectors including industry, transport, agriculture and forestry, and non-energy-related uses account for two-third of Iranian energy consumption according to the international energy agency report in 2017 [6].
Dependency on fossil fuels and concerns about Green House Gas (GHG) emissions have fostered the development of policies and technological solutions to reduce energy consumption in buildings [7,8]. Moreover, according to the study in [9], the countries including Iran, China, the US, India, Russia, Japan, Germany, South Korea, Canada, and the UK are responsible for two-thirds of global CO 2 emissions. These countries have direct and significant impacts on global warming through the RCEC and GHG emissions. Due to the rise of global demands for energy as well as the concerns about GHG emissions, the decision-makers should make complex and risk-based assessments for the future. To this end, there is an urgent need for the developments of tools to assist decision-makers to establish policies related to an integrated energy system [10].
Iran is a country with a 1,648,000 square kilometer area, which has a 657-kilometer coastline with Caspian see in the north and 1259 km coastline with the Persian Gulf and 784 km with the Oman Sea in the south. Generally, Iran has a dry climate with long summers and short winters. Indeed, Iran has a diverse climate with cold winters in the northwest, hot summers in the south, and muggy and rainy climate in the north of the country [11]. Iran has one of the largest natural gas and oil sources in the world. However, its population raised to more than 82 million in 2020 [12] that causes a significant increase in Residential and Commercial Energy Demand (RCED).
Iran’s RCED was 34% and 33% of total energy consumption in 2012 and 2017 [6], respectively, with the total energy consumption in the residential sector about 30% [13]. Energy consumption in Iran has been growing drastically, especially in the residential and commercial sectors [14]. Figure 1b shows the energy consumption in residential and commercial along with the consumption in industrial, transport, agriculture, and forestry sectors in Iran. Indeed, the drastic growth of population and economy that has been accompanying rapid urbanization had an essential effect on Iranian energy consumption [15]. However, the real value of energy carriers is not adequately assessed in Iran leading to a lack of inclination to invest in renewable energy sources. This has caused consistent use of fossil fuels which then have severe environmental damages [16].
An effective way to decrease GHG emissions and improve environmental sustainability is through reducing RCEC [17]. Iran has tried to reduce energy consumption through developing energy policies for residential and commercial sectors, for example, by implementing the de-subsidization policy. However, it was not clear whether this policy has decreased the energy consumption or not [18]. Finally, a few years after implementing this policy, it was found that the de-subsidization policy is ineffective in energy-saving and reducing energy intensity [19]. In addition, in the early 90s, the Iranian ministry of housing and urban development released the first version of principles to highlight the importance of energy saving in buildings. However, these principles were also found to be inefficient in the reduction of RCEC [20]. Hence, reducing energy consumption in Iran has remained an unsolved problem that requires comprehensive studies in different sectors, especially the residential and commercial sectors.
In this paper, we forecast residential and commercial energy demands in Iran using three different machine learning methods, including multiple linear regression, logarithmic multiple linear regression methods, and nonlinear autoregressive with exogenous input artificial neural networks. In a nutshell, the findings of our study include:
  • Residential and commercial energy consumption will increase up to 76.97 Mtoe in 2040, according to NARX model forecasting.
  • NARX artificial neural network has higher accuracy than logarithmic multiple linear regression and multiple linear regressions.
  • The developed NARX model is applicable for forecasting energy consumption with high precision in different energy sectors.
  • Population, gross domestic production and renewable energy share in final consumption are the most dominant factors in residential and commercial energy consumption.
  • Increase in renewable energy share in final consumption will lead the reduction in energy consumption for residential and commercial sectors.

2. Background

Energy modeling which involves the effective use of energy resources is used to achieve sustainable development. In energy modeling, to decrease energy demand, technical, organizational, and behavioral statistics are important factors to be considered. However, cost-effective options, commercially viable alternatives, and environmentally friendly solutions should be considered in the modeling process [21]. A well-known example of modeling energy consumption is using a top-down and a bottom-up approach. These approaches rely on different levels of information, calculation and simulation. Hence, the results achieved from these approaches are different [22]. In the following, we review the research works which have used these approaches in their studies.

2.1. Bottom-Up

Bottom-up (BU) models are used for modeling the energy sectors. The advantages of BU models are in determining energy end-uses as well as the energy supply technologies [23]. BU models approximate energy consumption based on hierarchical structure of an energy system. In the hierarchical structure of the BU approach, higher levels are affected by lower levels. The lower levels’ results are accumulated to create results of the higher levels. This structure leads to a clear vision of the effects of energy consumption operations on higher levels [24]. To model the total energy consumption, in BU models the energy consumption is accumulated in houses followed by the regions and the countries. The BU models aggregate economic and technical data of energy systems to ensure the security of economic development, and the demand and supply balance of the energy systems [22].
In previous studies on BU models, the influence of various factors on energy systems was investigated. These studies include the household income [25], different energy carriers’ price [26,27], GDP, population, and oil price, CO 2 emission, electricity and heat demands, household energy demand, and demographic behaviors of households [28]. The applied methods in these studies include various types of techno-economic or end-use approach [27], energy demand model [29], linear regression models [30], and ANN models were also developed as BU models [31]. Studies on ANN models address ANN as an accurate tool for modeling energy consumption in office and school buildings [32,33].
In general, one of the main limits of BU models is that for pathways in energy systems, the successive connections between energy units from lower levels to higher levels are not completely separable from each other. Indeed, the energy pathways are interconnected to each other. For example, residential energy sector is linked to natural gas industry; however, the natural gas industry is not understandable without modeling oil industry. These pathways are affected by non-energy-related processes. These interconnections make solving BU models a challenge which requires data analysis for several sectors, industries and processes [34].

2.2. Top-Down

The development of Top-Down (TD) models have started from the energy crisis that occurred in the 1970s. The TD models were developed to study the effects of changes in energy supply and energy pricing on consumer’s behavior. Numerous TD models were developed to be applied to the residential sector as an energy sink. These models can use consumption factors to determine energy trends. Most of the TD models are developed based on statistical economic theories. TD models consider the economy at a national or regional level and assess the cumulative effects of energy policies on the economy. TD models use accumulated data to detect relations between energy parameters and non-energy parameters. TD models use macro-economic indicators such as GDP [35], population [36], fuel price and income [37], technological indicators [38] and environmental factors [39].
The studies about Iranian residential and commercial energy consumption include different methodologies including macro-economic and technological indicators. For example, electricity consumption has been modeled using neural network and logarithmic linear autoregression by taking into account the natural gas price and electricity price as influential variables. ARMAX models, nonlinear programming and genetic algorithms for modeling natural gas consumption in the residential and commercial sectors have been applied [40]. In addition, scenario-based analysis to predict Iranian long-term energy demand, and system dynamic methods for analyzing the energy demand has been used [41].
Moreover, in TD approaches, ANN models are among the widely used methods. For instance, a feed forward neural network is applied to study energy consumption in the transport sector. This neural network uses the gross national product, population and total annual average vehicle-kilometer historical data. The results obtained from applying the method have shown to be effective in studying the energy demand in the transport sector [42]. Machine learning algorithms are also used in TD approaches, for example, they are used to predict building energy demand and found human behavior as an essential factor which remarkably affects building machine learning energy demand models [43].

2.3. Artificial Neural Network

Artificial Neural Networks (ANN) are computational models of biological neural networks. Generally, they are used for modeling complex nonlinear functions. ANN has high abilities in self-learning, flexibility and non-linearity modeling. The method has become a well-known tool for classification, clustering, pattern recognition, and prediction in various scientific fields [44], air quality [45,46], environmental sciences [47,48], business intelligence [49], engineering applications [50] and applied physics [51].
ANN attempts to find a pattern within datasets using its neurons, which interact with each other across weighted connections. It then generalizes the patterns as the human brain learns to apply in various situations and uses the knowledge for upcoming events. A key feature of ANN is in alleviating the necessity for prior hypothesis and particular functional structure between input and output that eliminates the need for pre-assumptions [52]. Generally, the ANN model is developed based on a nonlinear relationship between inputs and outputs. This method consists of processing neurons that have feed forward or feed backward interconnection between the neuron layers [53,54]. ANN models include an input layer, hidden layers and an output layer. Artificial neurons of one layer are fully or partially connected to the artificial neurons of the next layer [55]. The ANN accuracy depends on several factors such as the structure of the network, number of neurons, number of layers, iterations, connection weights, learning algorithm and transfer function [56]. In principle, the dataset used for ANN methodology is divided into two groups. The first group of data is for training the network, and the second group is used to test the accuracy of the network [57].
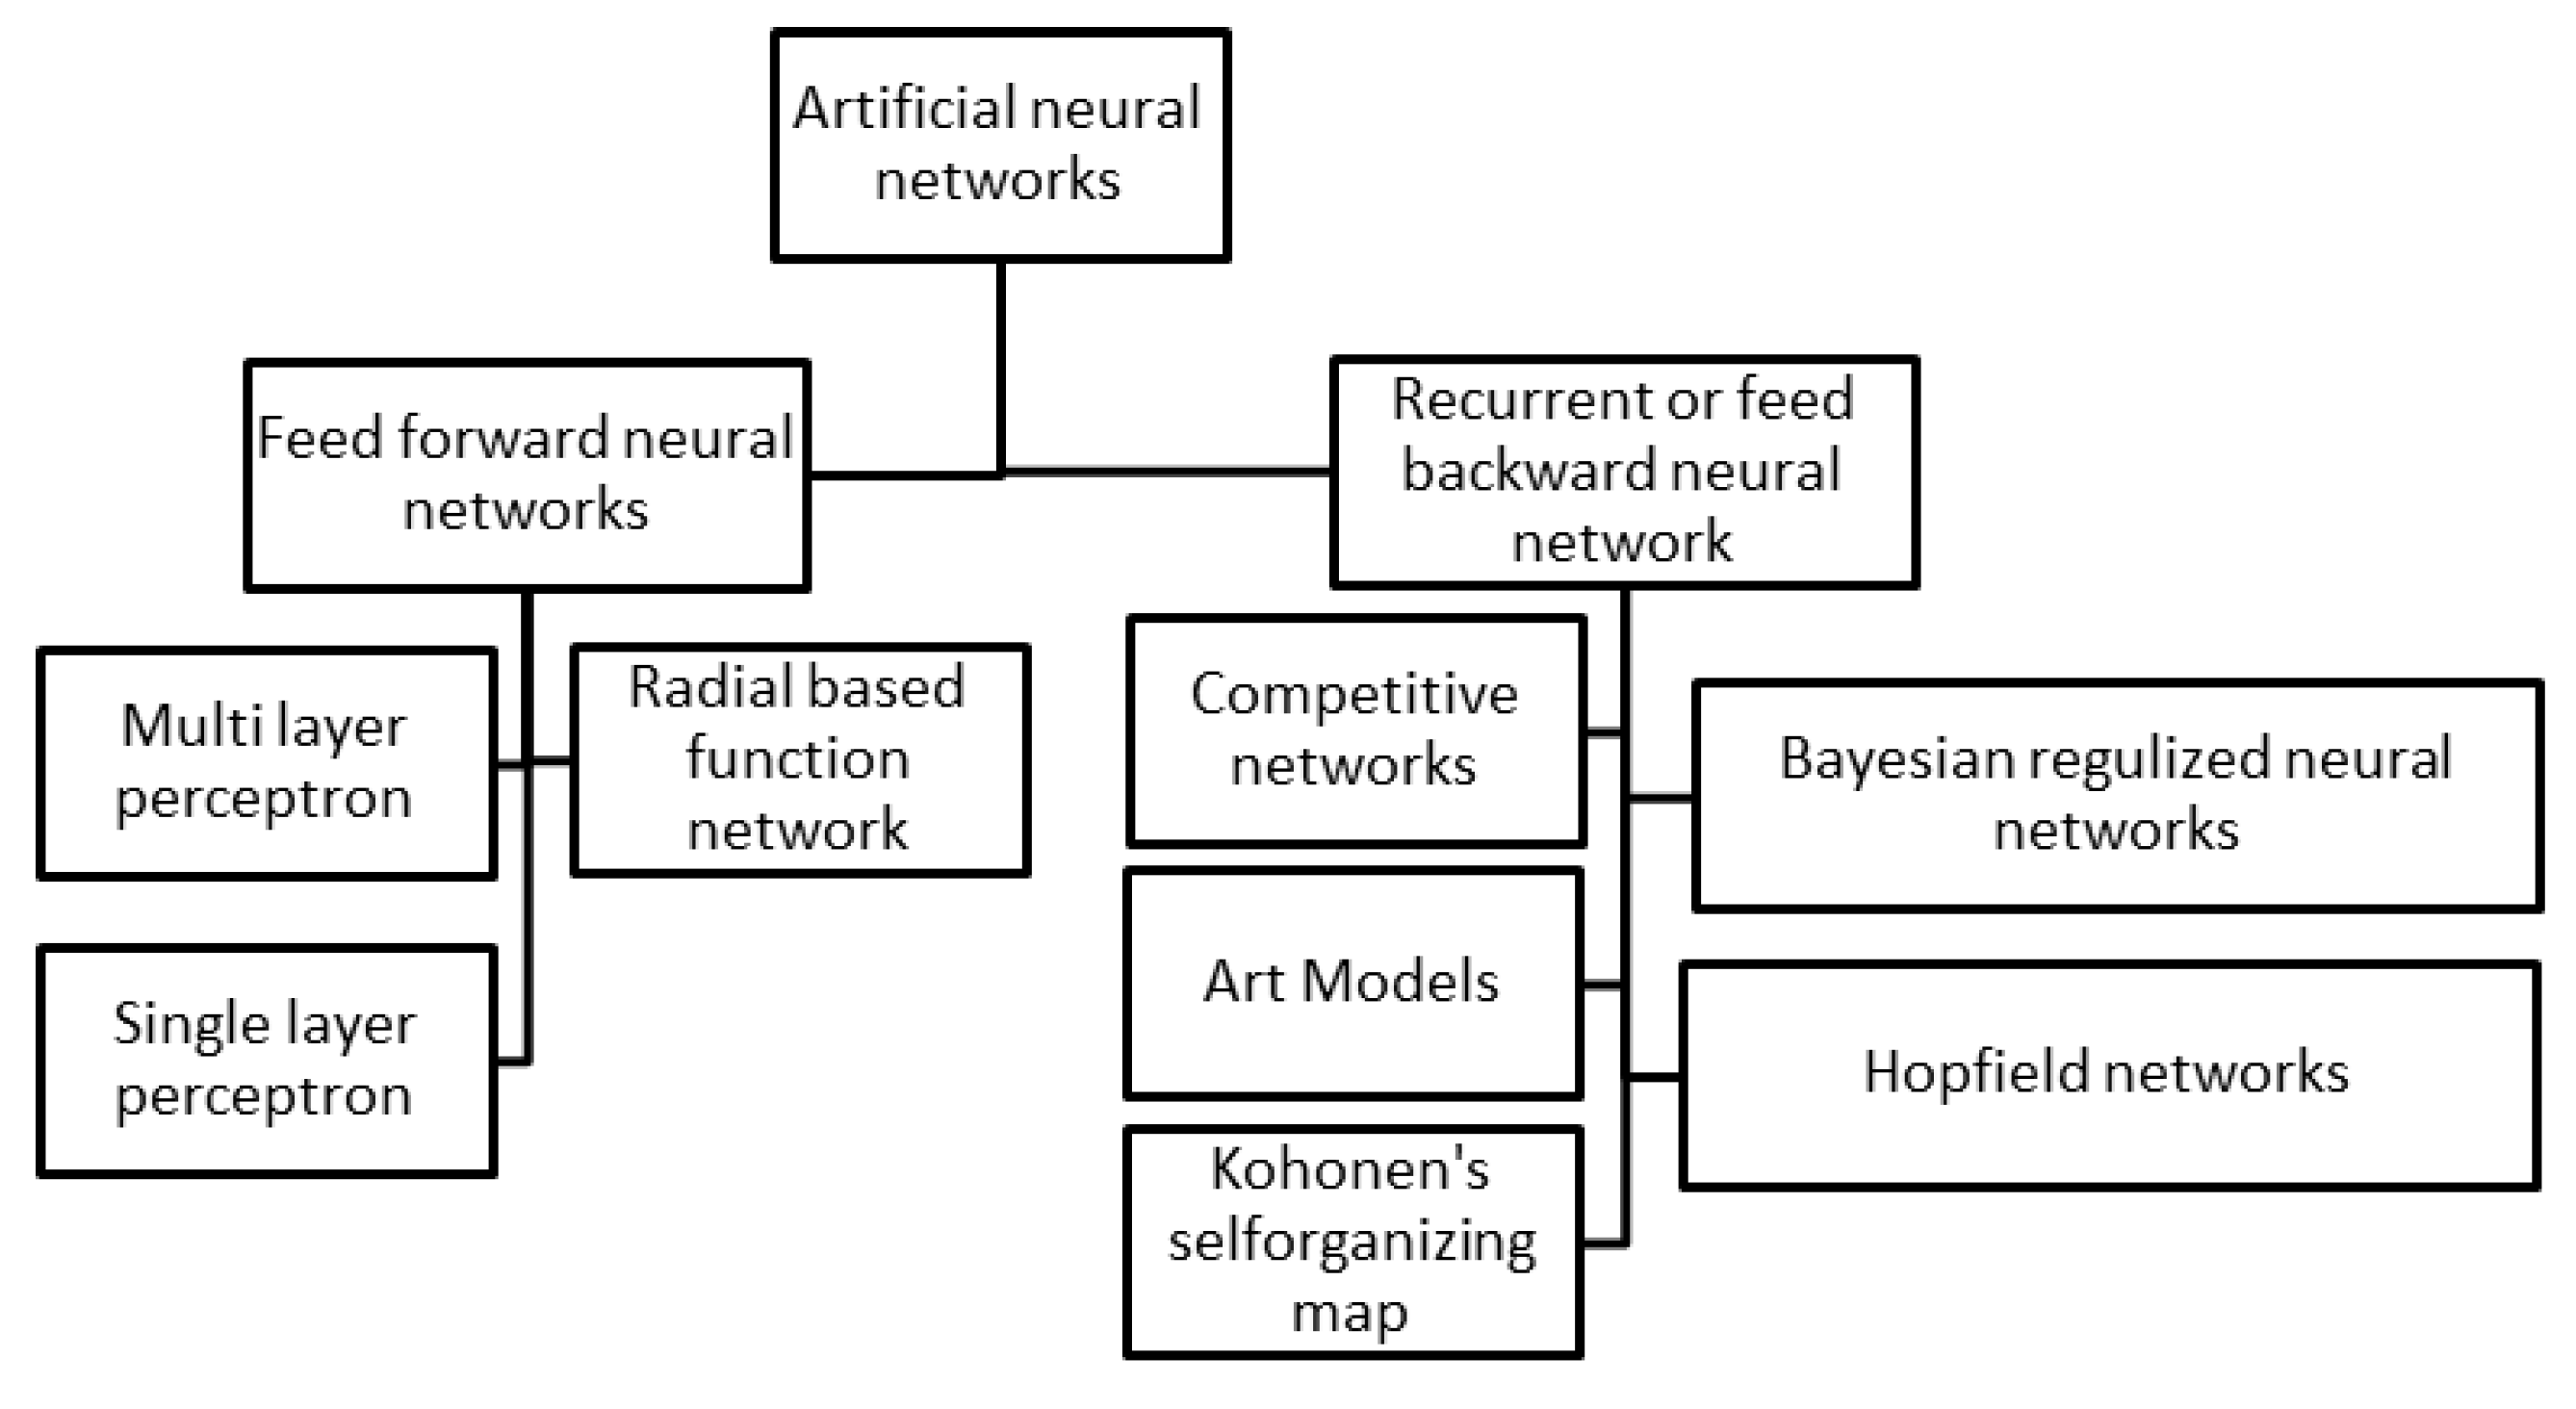
Typically, ANN is classified into two main groups; feed forward and feed backward [58]. Figure 2 shows a classification of the ANN model in detail. In our paper, the implemented NARX artificial neural network belongs to the recurrent or feed backward neural networks category. We also used the Bayesian regularization algorithm as the training algorithm. In the literature, many studies have used ANN methodology to model energy consumption in different sectors. They have compared their ANN methodology with other conventional models such as MLR and MARS. In the following, we perform a brief review and conduct a comparison between ANN and other conventional methods.
ANN has shown to be more effective than MLR for modeling the residential and commercial energy consumption, as described in [59,60]. Although ANN has a higher level of accuracy, MLR models are simple and understandable for non-professionals [61]. Moreover, ANN has been found to be more accurate than Linear regression, support vector machine [62] and, MARS [63] methodologies for modeling nonlinear fluctuating phenomena [64]. ANN is capable of modeling energy consumption based on hourly intervals [65] or even less than hourly intervals (e.g., 15 min) [66]. ANN is also a potential model for nonlinear fluctuating data in comparison with other conventional methods [67].
According to the literature review, there is a lack of precise models in Iranian residential and commercial energy sectors to predict energy consumption considering social, economic and technical factors. The studies in the literature mostly focused on the residential sector and neglected the commercial sector while these two sectors are not separable from each other for the following reasons. First, the Iranian census center considered these two sectors as one energy sector from 1967 until 1990. This limits the available data for modeling these two sectors while each set of data is vital in developing an accurate model. Furthermore, residential and commercial energy sectors have the same growth trends as presented in Figure 1c, showing that the two sectors are affected by the same factors.
In this study, we considered important factors such as renewable energy share in final consumption which has not been taken into account in other TD models, energy price, GDP, and population. In this study, we also developed three methodologies to predict Iranian residential and commercial energy consumption. Based on the literature survey, the methodologies including ANN, LMLR and MLR are promising for modeling RCEC.
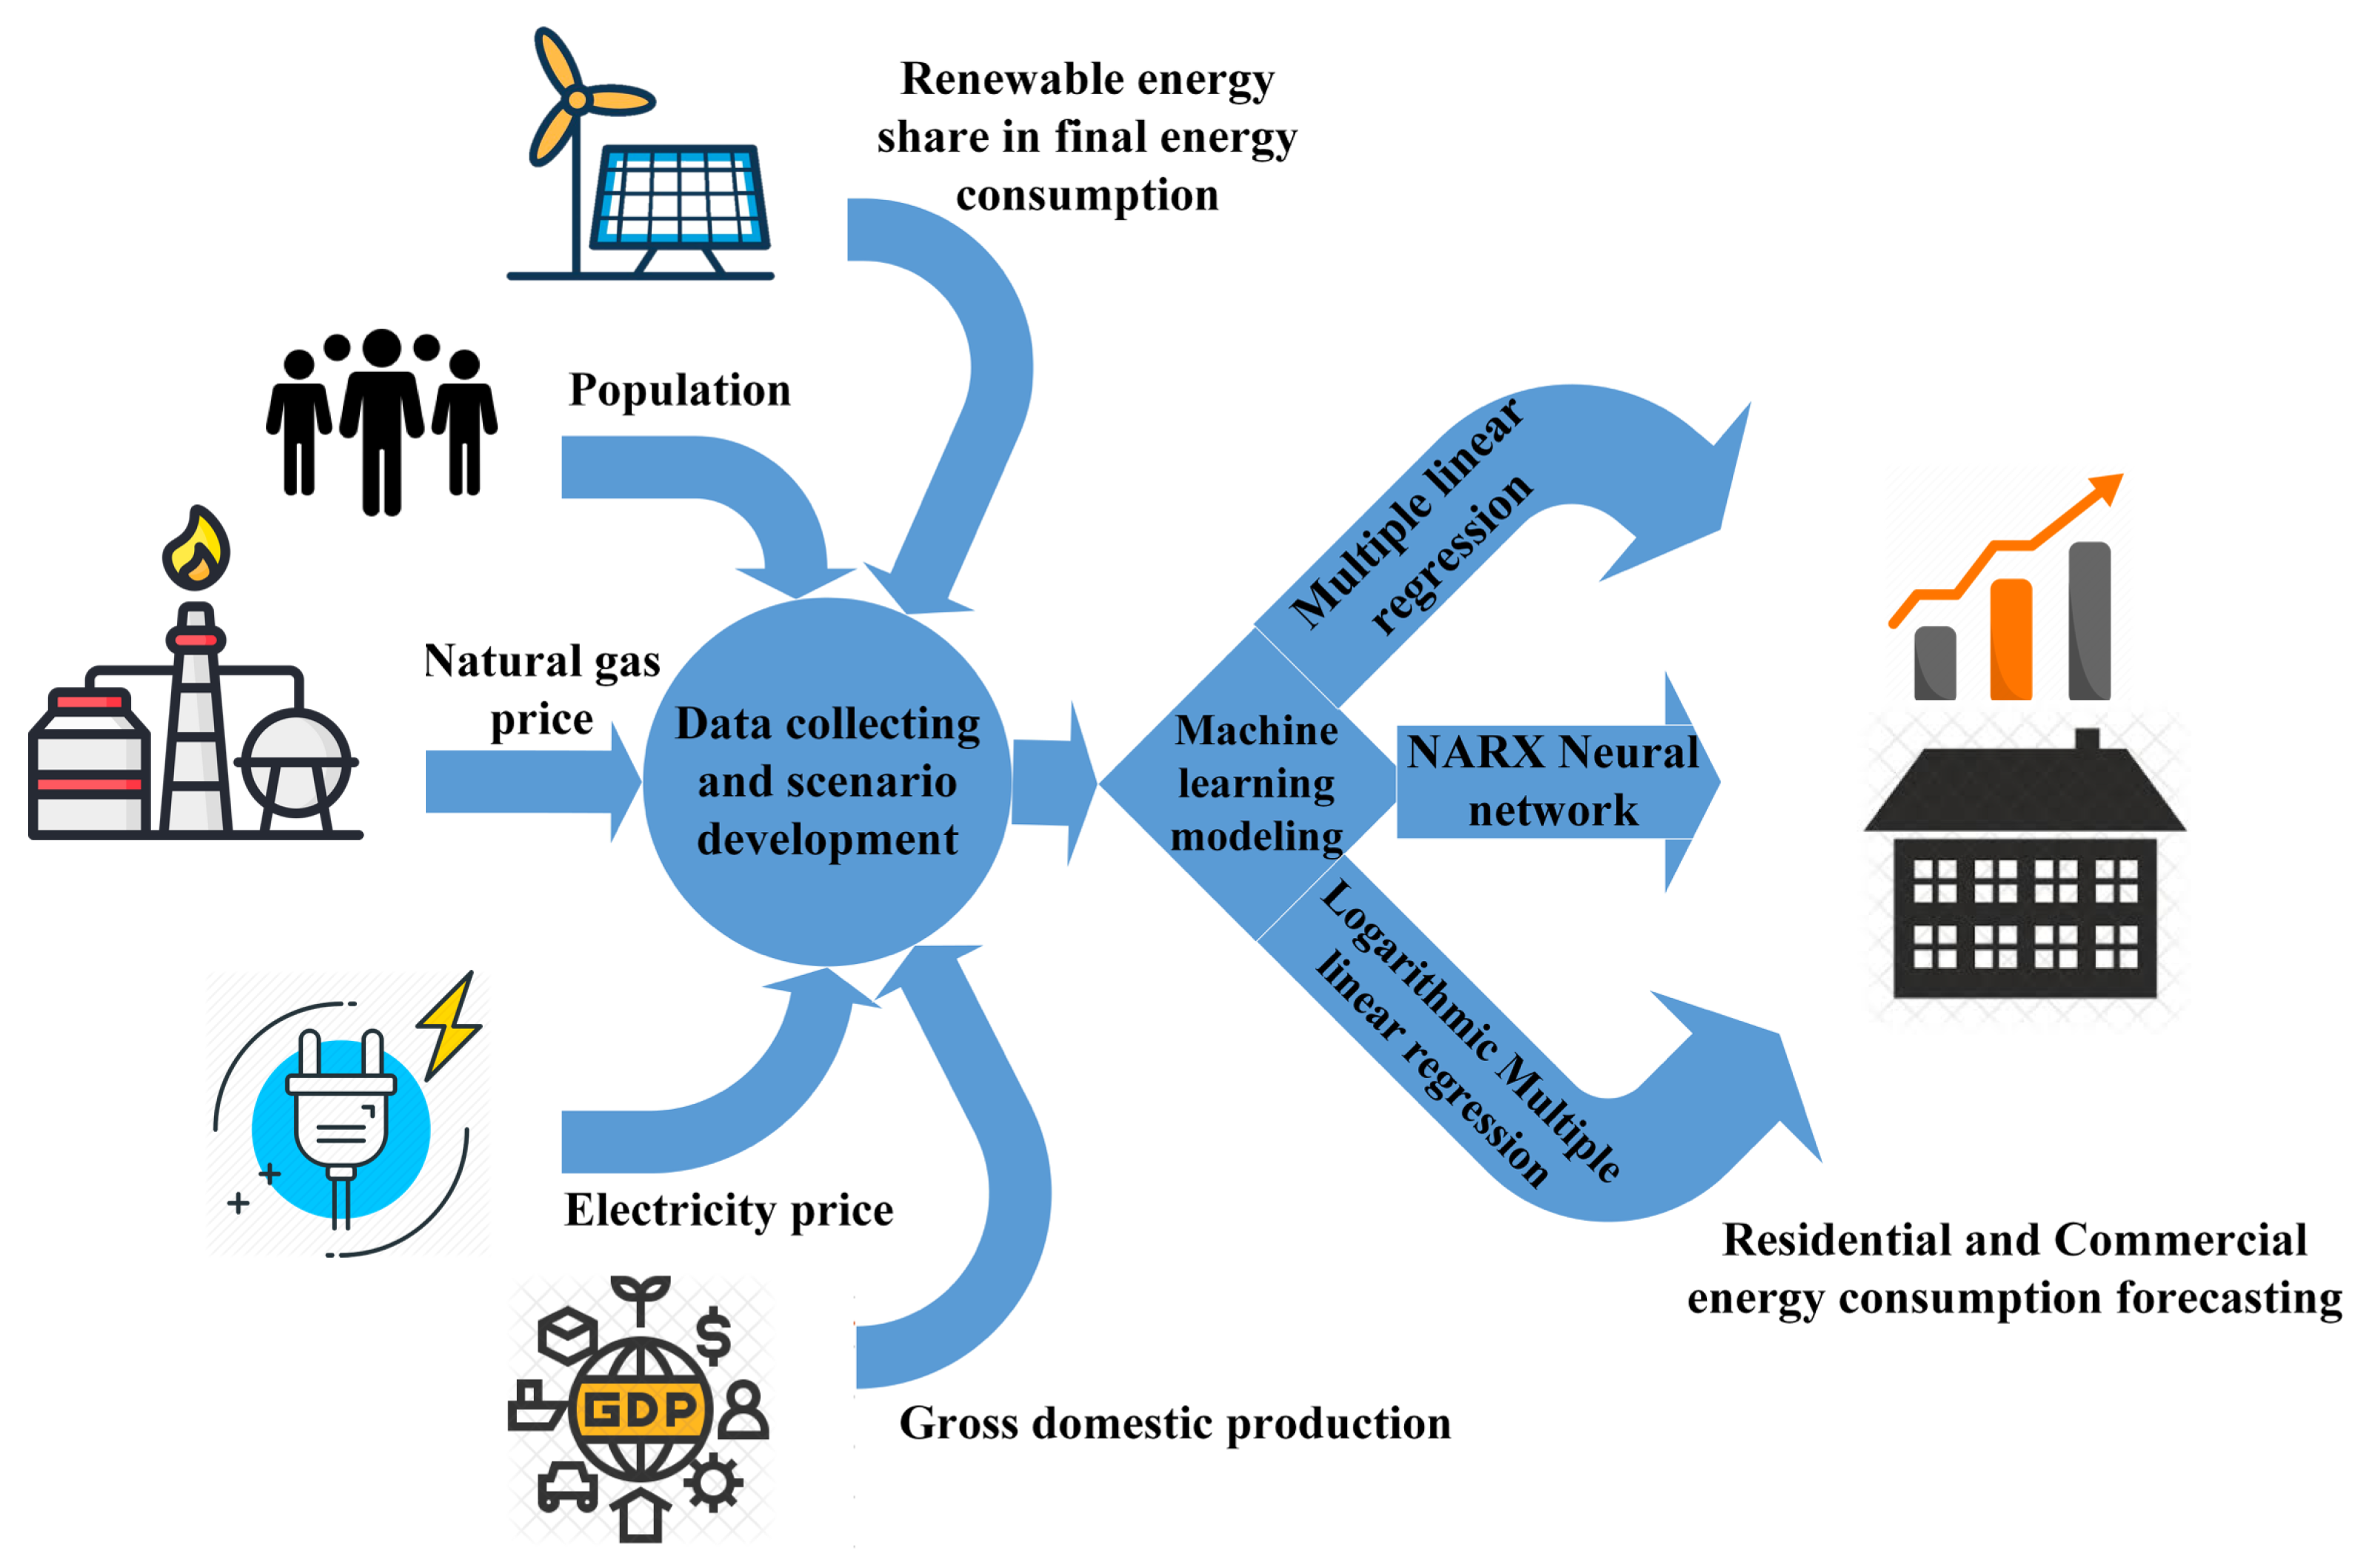
The purpose of our study is to model RCEC as a function of selected socioeconomic factors extracted from a rich literature of energy and economics. Then, we evaluate the effects of macro-economic factors such as Population (POP), Gross Domestic Production (GDP), Natural Gas Price (NGP), Electricity Price (EP) and Renewable Energy share in final energy consumption (RESH) on RCEC. As shown in Figure 3, using these socioeconomic factors and applying machine learning methods, we forecast Iranian energy consumption in residential and commercial sectors. In addition, we reviewed most of the common energy modeling methods and then according to data accessibility, we chose the TD modeling (as explained in previous subsection). First, we analyzed the variables above (i.e., factors) and their trends. Furthermore, we forecasted the future scenarios for variables of POP, GDP, NGP, EP, and RESH using the feed forward Artificial Neural Network (ANN). Next, we modeled energy consumption using TD modeling approaches, including Multi-Linear Regression (MLR), Logarithmic Linear Regression (LMLR), and Nonlinear AutoregRessive with eXogenous input (NARX). The modelings are then evaluated and compared. Finally, the developed models are used to forecast energy consumption by 2040.

3. Data Evaluation and Variable Trend Analysis

In this section, we analyze the variables GDP, POP, EP, NGP, and RESH to establish reliable scenarios to study the forecast of these variables in the future. The data for these variables are collected from 1967 to 2017. Then, feed forward ANN method is used to model and forecast these variables. Finally, the estimated variables are used as ANN fitting inputs to anticipate the forecasts by 2040.

3.1. Population

According to the World Bank report, the Iranian population has been rapidly growing over the last few decades. Iran’s population was 26.5 million in 1967 and 82.01 million in 2018 [68]. Moreover, the population in urban areas has been growing more quickly than in rural areas. Urbanization is generally the main indicator of economic development. In Iran, however, urbanization is not directly related to economic development. Urbanization in Iran is the result of a major difference between urban and rural incomes, access to welfare facilities in cities, and the problems caused by seasonal droughts in agriculture [69].
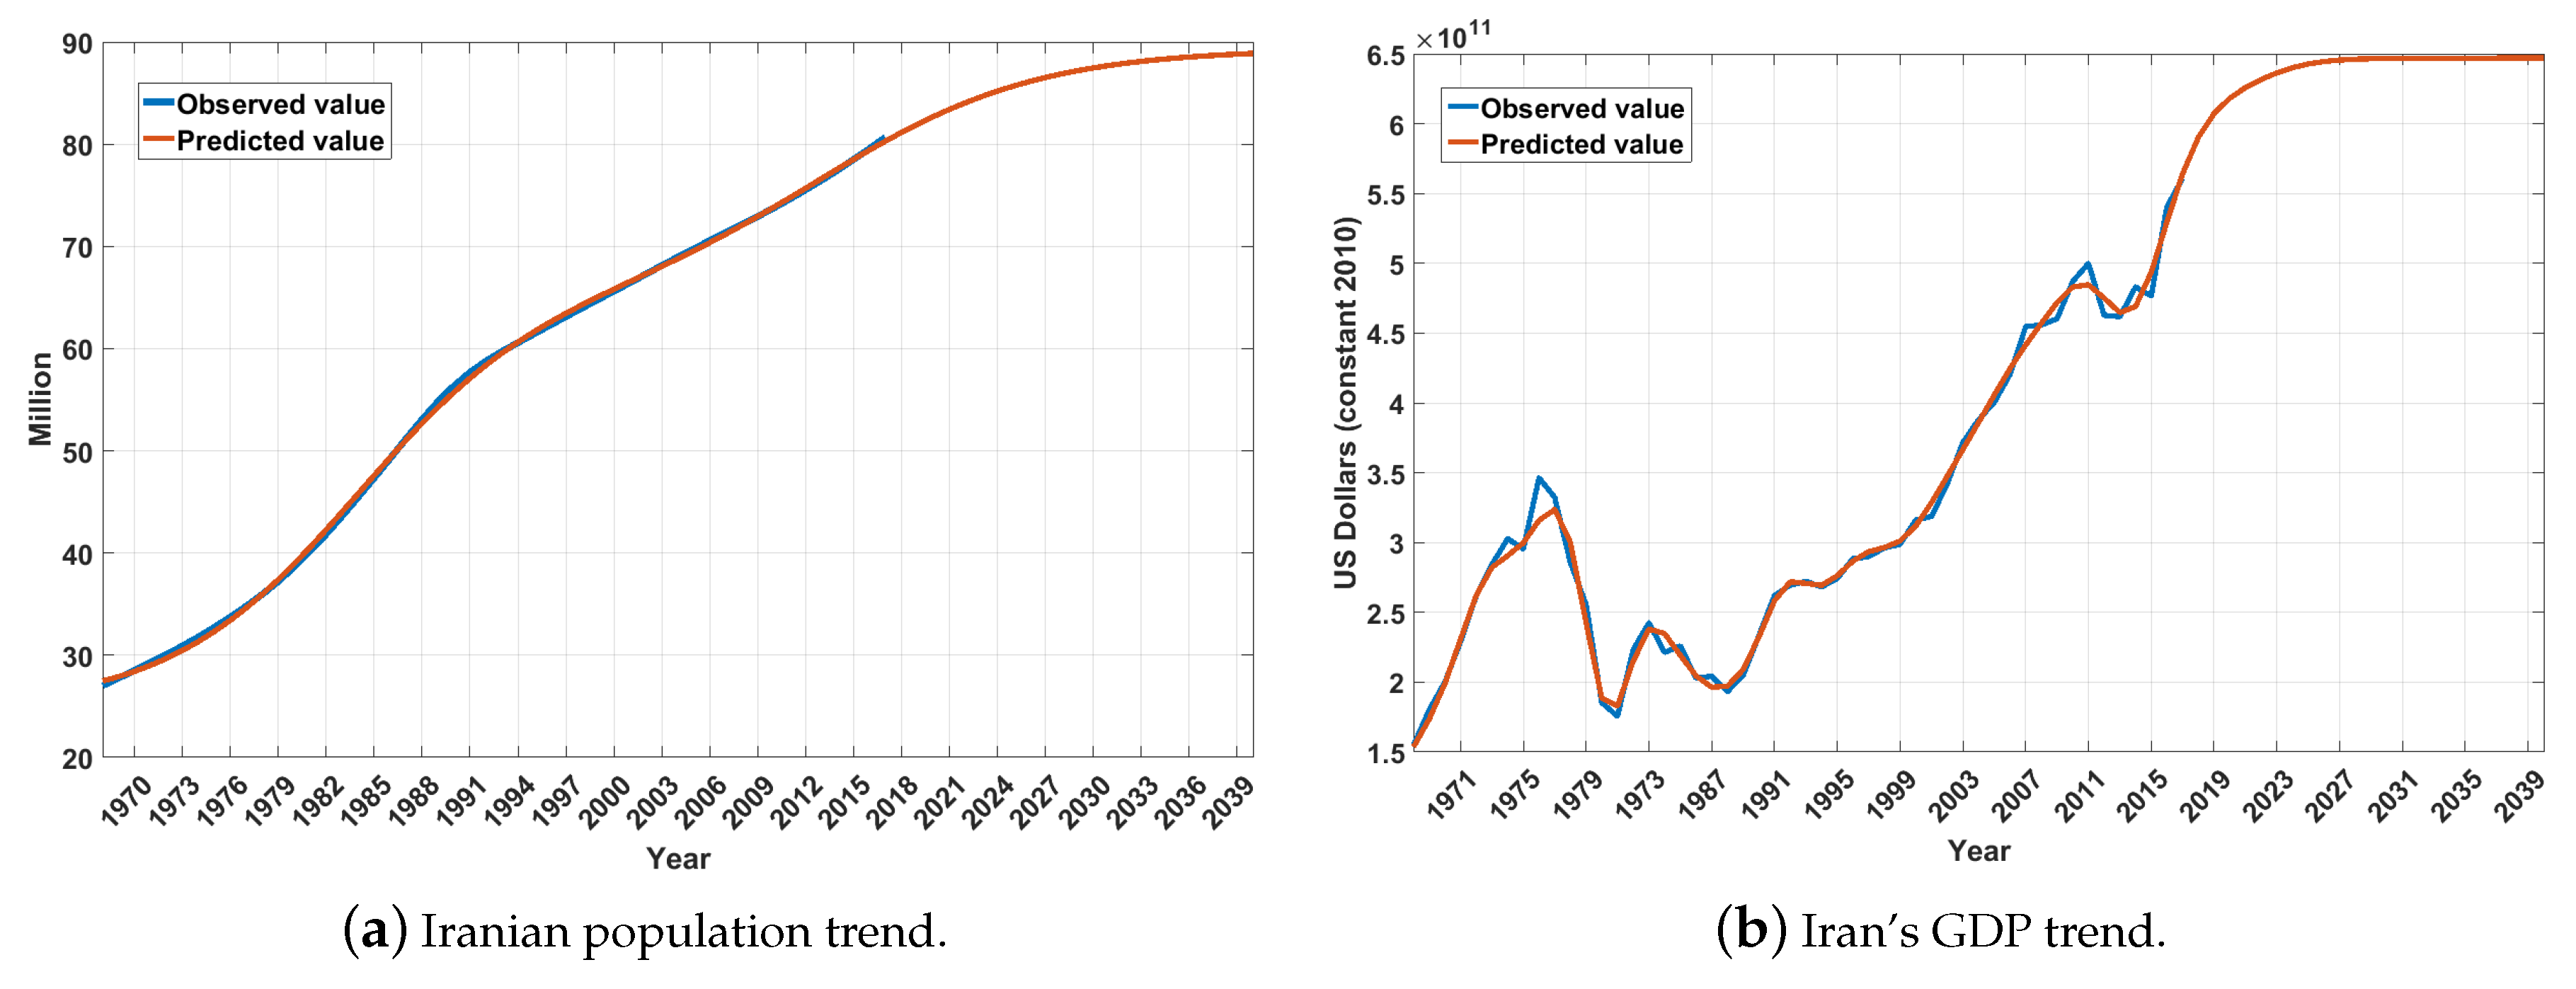
According to the Iranian census center (https://www.amar.org.ir/english), population growth is 1.24% compared to 2011. In this paper, we forecast the population growth until 2040 using feed forward ANN model. The population growing trend (https://data.worldbank.org/) and ANN prediction results are presented in Figure 4a. According to Figure 4a, Iran’s population has been growing since 1967, and the highest growth rates happened between 1979 and 1991. Based on the ANN model prediction, Iran’s population will reach to 90 million in 2040.

3.2. Gross Domestic Production

The gross domestic production (GDP) is the market value of total produced goods and services in a country. The GDP is an overall index of the economic growth of a country and it is directly correlated with standards of living [70]. In this paper, a feed forward ANN model with three layers and eight neurons is used to predict the growing trend of GDP by 2040. This trend is depicted in Figure 4b.
As is evident in Figure 4b, GDP in Iran has been fluctuating in the last few decades. However, in a long-term perspective, the GDP shows a high rate growth especially during 2000–2011. GDP in Iran has increased with an annual average rate of 5.5% from 1988 to 2008. According to the study in [27], the GDP growth rate will be 3.4% and 3% in 2020 and 2030, respectively.
Indeed, the high rate increase between 2000 and 2011 is a consequence of oil price and crude oil export increase. Between 2008 and 2009, the GDP has decreased because of the global economic crisis. The global sanctions imposed on Iran have also affected the economic growth of the country, especially from 2011 to 2014. The global sanctions have reduced the GDP by more than 17%, while the highest reduction has occurred in 2012 [71].

3.3. Natural Gas Price

Since 2000, GHG emissions caused by fossil fuel consumption as the primary energy source of residential and industrial sectors has been an important concern in Iran. This concern, the discovery, and exploiting gas fields in the south of the country have encouraged Iranian governments to develop new policies about reliance on natural gas as an energy carrier [72].
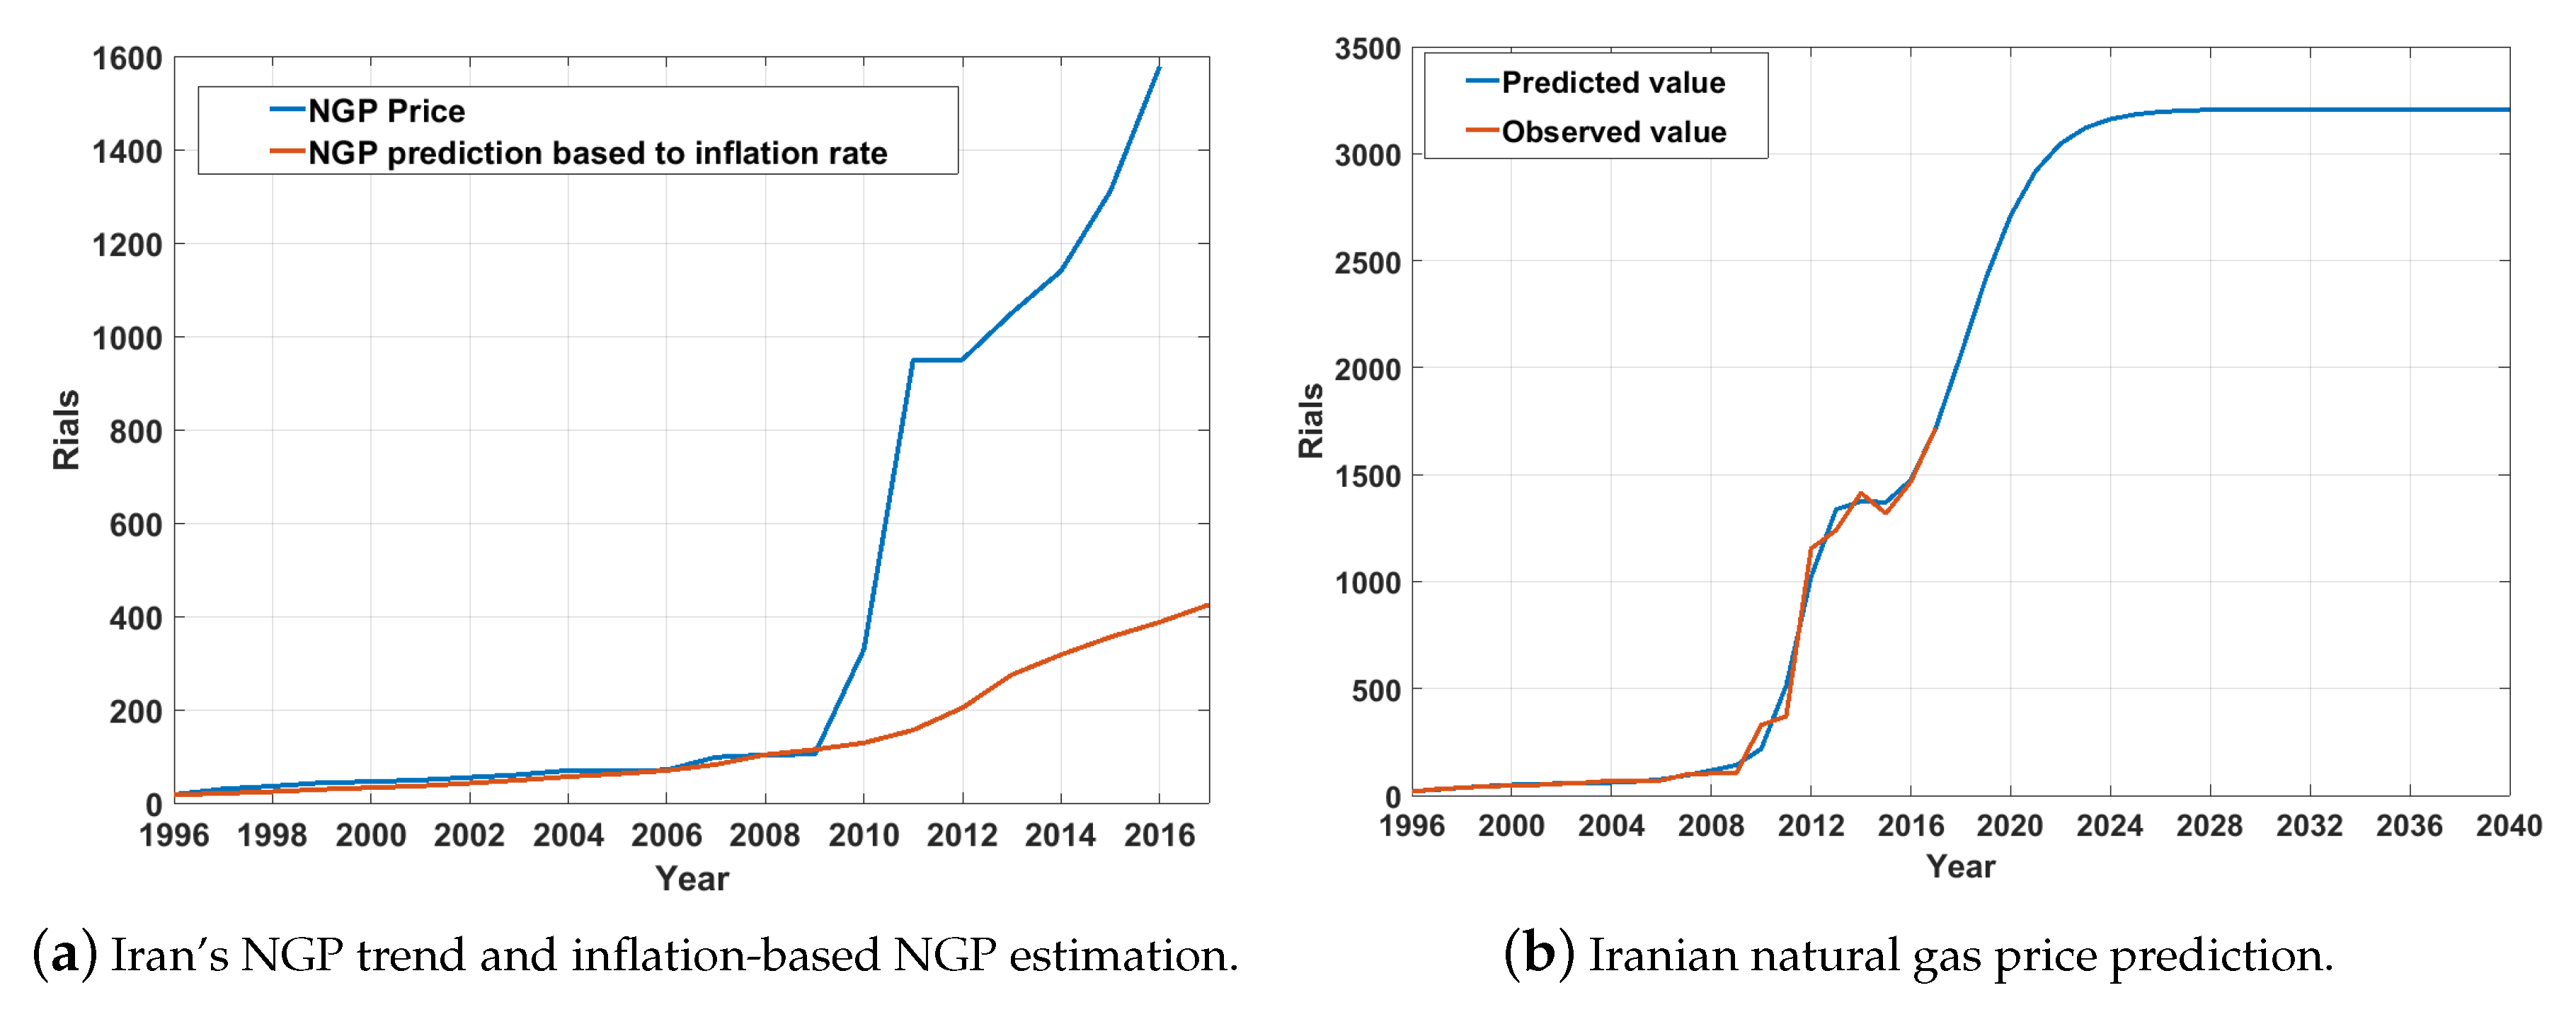
Iranian policymakers found natural gas as a tool to control energy consumption. Therefore, they simultaneously have increased both reliance on natural gas resources and the price of natural gas in the residential and commercial sectors. The government has increased NGP more drastically than its usual trend. Figure 5a shows the trend of estimated NGP which is calculated based on the inflation rate since 1990. Furthermore, the Iranian government developed price reforming policies to decrease energy consumption in 2010. As a result of these policies, natural gas price increased six hundred percent (from 100–130 rials/cm to 700 rials) for households and 1500% (from 50 rials/cm to 800 rials) for power plants [73].
According to Figure 5a, the natural gas price had followed the estimated natural gas price based on the Iranian total inflation rate from 1996 to 2009. This illustrates that the Iranian governments had not developed any policy to control the natural gas price. However, from 2009 to 2016, NGP had increased more drastically than estimated NGP based on the Iranian total inflation rate. This states that the Iranian government developed policies from 2009 to 2016 to increase NGP for controlling the natural gas consumption and consequently the energy consumption.
Table 1 presents the inflation rate, natural gas price and estimated natural gas price based on the inflation rate from 1991 to 2016. The estimated NGP for each year is equal to the estimated NGP value of a year before it plus the effect of inflation. Figure 5a also shows the estimation and actual growing trends of NGP with orange and blue colors, respectively. In addition, as depicted in Figure 5b, the NGP is expected to grow drastically and increase to more than 3200 Rials by 2040.
In practice, natural gas emits fewer greenhouse gases than other fossil energy sources. To this end, policies were implemented to improve sustainable development in Iran by replacing other fossil resources with natural gas [74]. Moreover, natural gas prices and electricity prices both affect natural gas and electricity consumption in the residential sector significantly. This is while, as shown in Figure 6, residential and commercial sectors have the highest natural gas consumption in Iran. Therefore, considering natural gas and electricity prices as an influential factor in RCEC is indispensable.

3.4. Electricity Price

In different countries, one of the most important drivers that affect consuming energy is the energy price, especially the price of electricity. However, there is a strong relationship between energy intensity and electricity prices. In countries with low electricity prices, there is a high level of energy consumption per unit of GDP [75].
In 2010, to tackle increasing economic and social problems concerning the high energy subsidies, the Iranian government started an intense energy price reform. The essential goals of this price reform were to control energy consumption and to unravel the government’s budget deficit. This led to an increase in the electricity price of almost three hundred percent from an average of 160 rials/kWh to 450 rials/kWh [73].
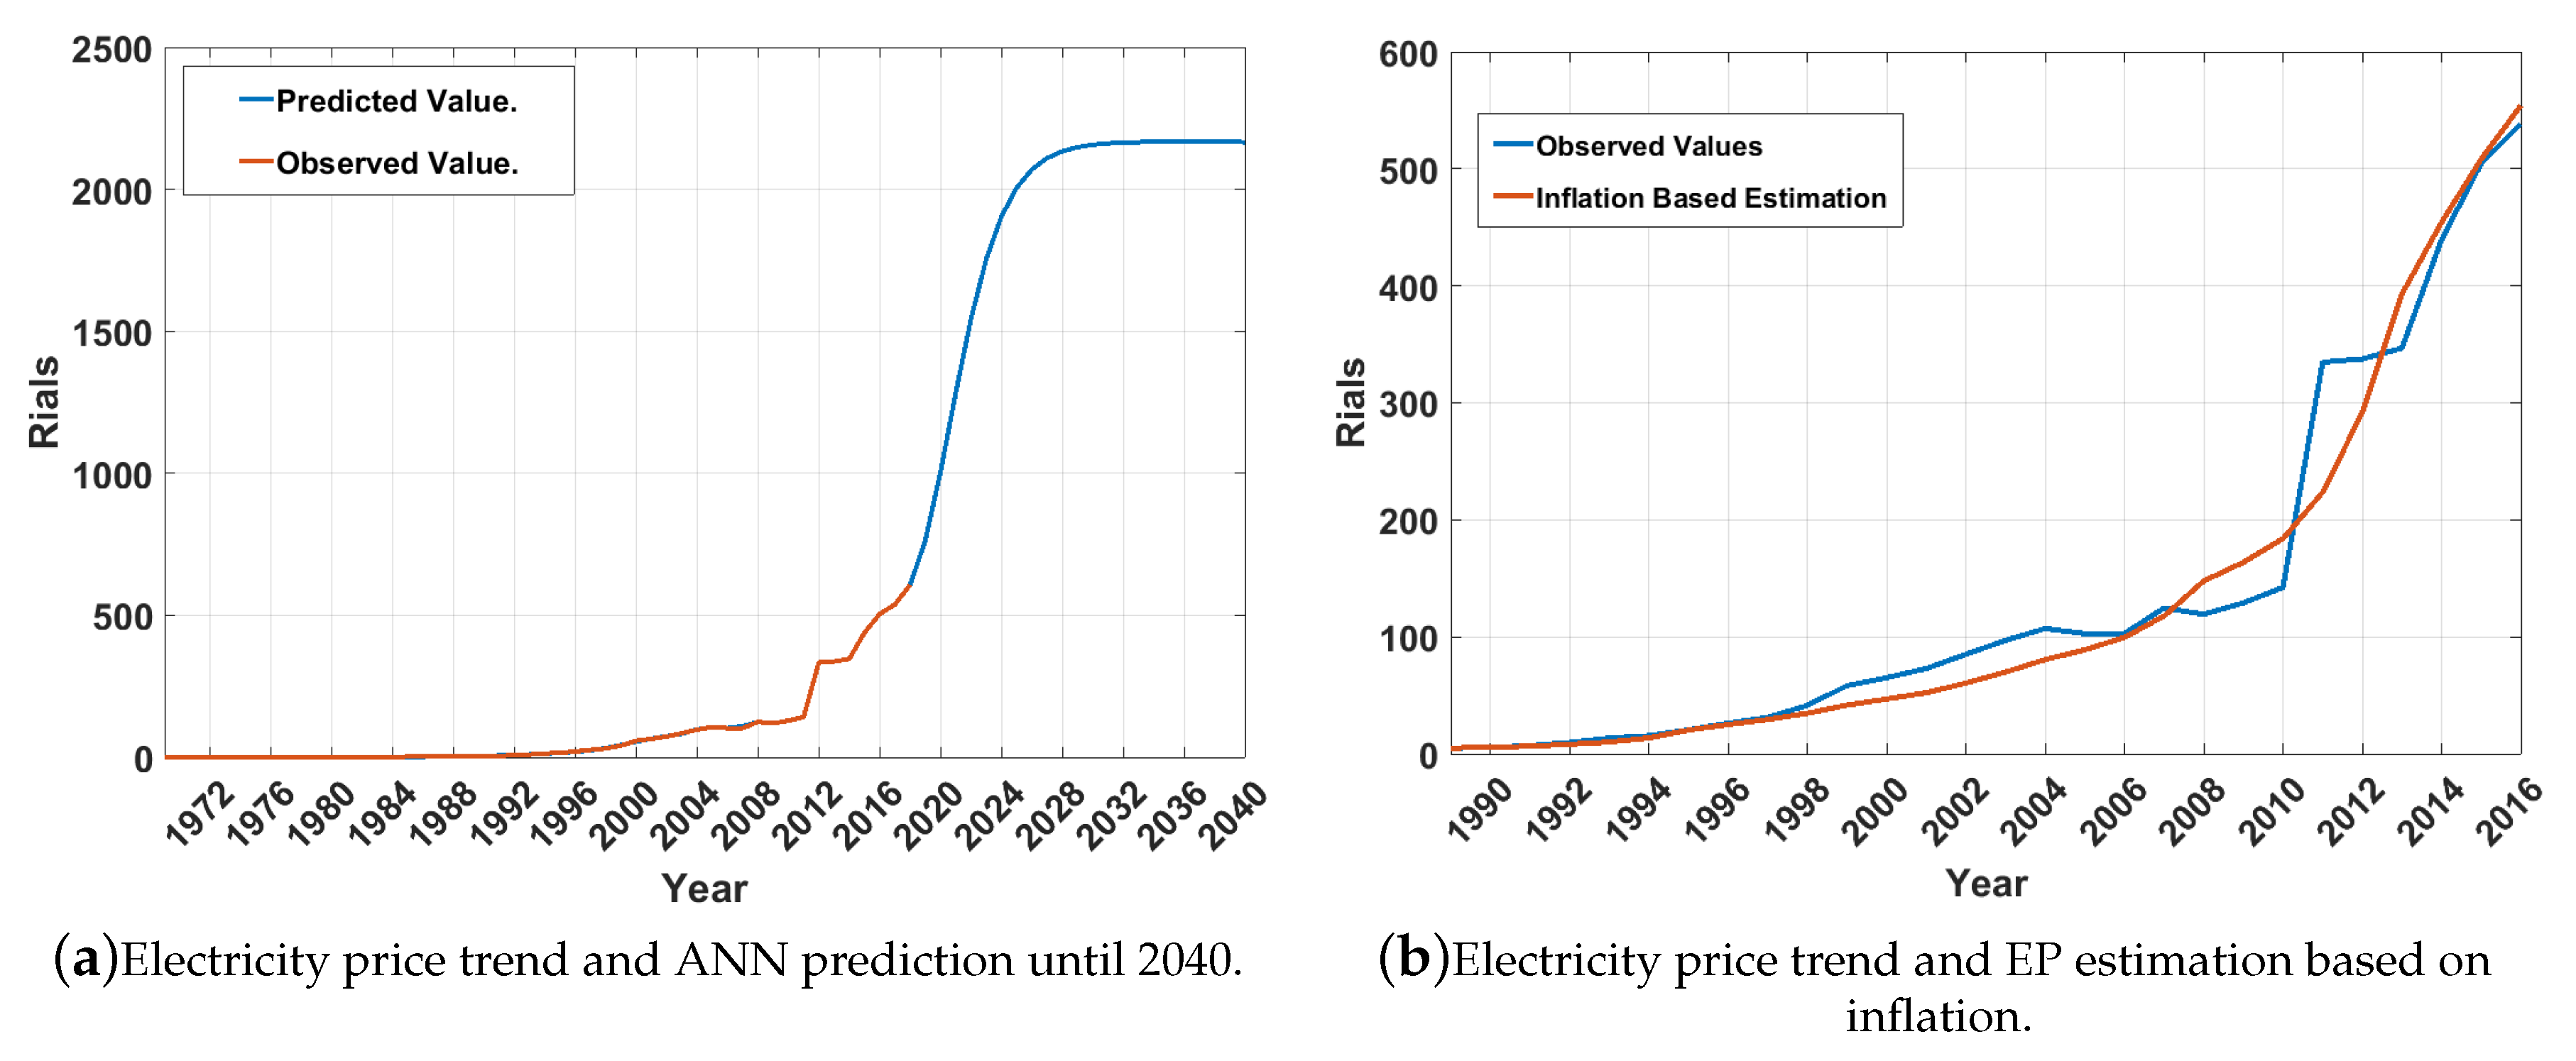
However, the trend of electricity price in the country is depicted in Figure 7b. It demonstrates the actual electricity prices in comparison with its estimation, which is based on the inflation rate and 1990 EP as the base year for estimation. It shows the fact that electricity prices followed the inflation-based price estimation. Hence, the Iranian government’s energy price policies were ineffective in controlling the electricity price and consequently the electricity consumption in residential and commercial sectors. In this paper, as shown in Figure 7a, the electricity price growth is forecasted by the ANN model until 2040. According to this forecast, the EP will reach 2200 Rials per KW by 2040.

3.5. Share of Renewable Energy Sources in Final Energy Consumption

Over the past few years, renewable energy sources have attracted the Iranian government’s attention. Having considered the decline of fossil fuel resources, the government has paid more attention to renewable energy sources [76]. However, the portion of renewable energy resources such as biomass, hydro-power, wind, and solar energy is just 1% in Iran. This is a small proportion compared to the developed countries. Iranian policymakers focused on natural gas consumption to decrease greenhouse emissions as a way to achieve sustainable development. Hence, the share of natural gas in energy supply increased from 44.63% in 2001 to 54.93% in 2008.
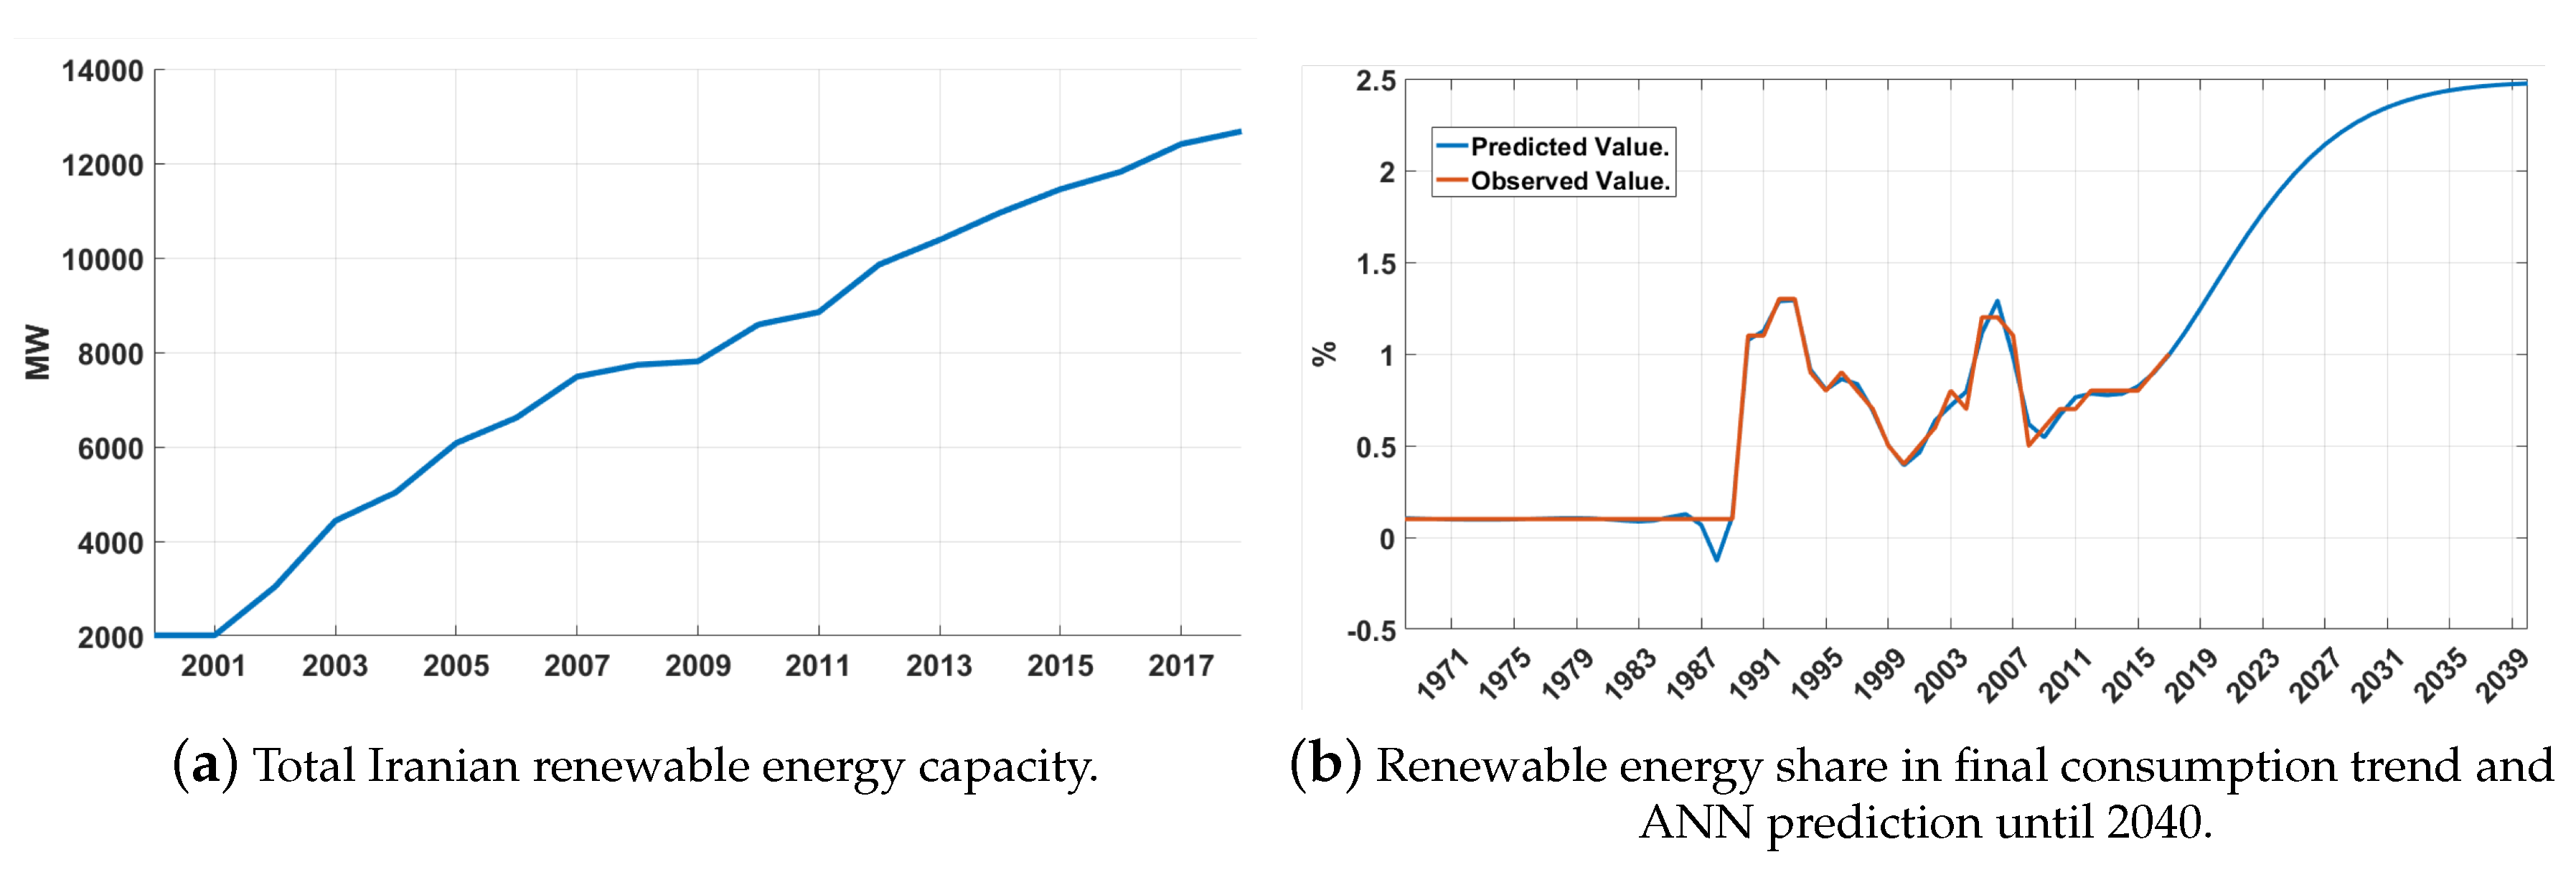
Recently, Iranian policymakers developed a five-year development plan forcing the government to add 5000 MW to the total renewable energy capacity in each plan by 2021. Ever since fortunately this enforcement has resulted in achieve 4.1% and 5.7% of the two five-year consecutive plans [77]. Figure 8a demonstrates the growing trend of renewable energy capacity in Iran.
In this paper, the renewable energy share in final consumption is predicted by ANN by 2040. The trend of Iranian renewable energy share in final consumption [78], and the ANN prediction is also presented in Figure 8b. As illustrated in Figure 8a, the RE sources have a low share in final energy consumption, while RESH is anticipated to reach 2.5% by 2040.

4. Methodology

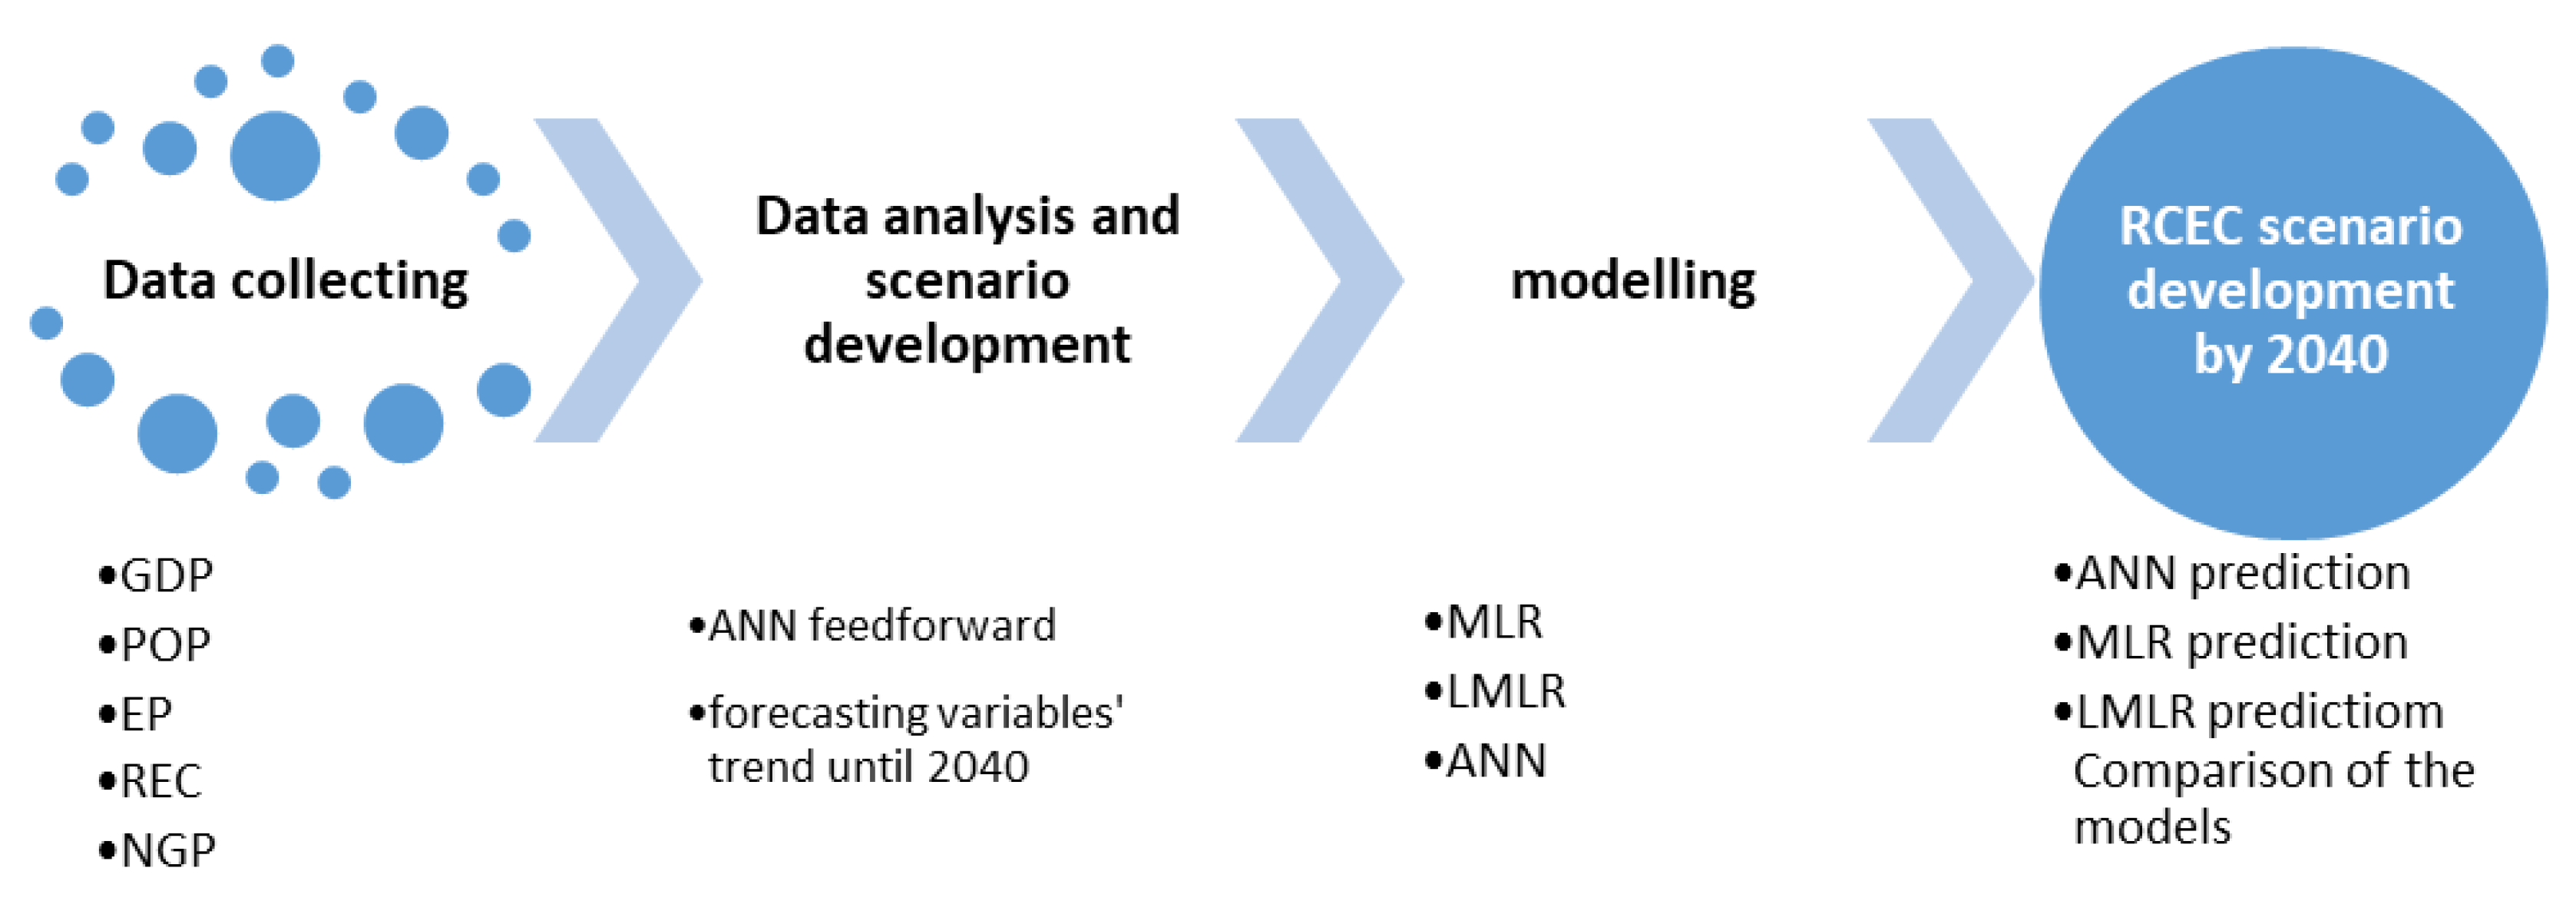
The process of modeling residential and commercial energy consumption in this paper includes four steps, which are presented in Figure 9. First, the POP, GDP, NGP, EP, and RESH datasets are collected from 1967 to 2017. Secondly, the growth rate of data and their trends are investigated to find a pattern for forecasting their future. Thirdly, the ANN feed forward model with multiple hidden layers is chosen to predict the growth of the variables. Based on the prediction of the ANN method, the growing behavior of the variables is forecasted by 2040. Finally, considering the prediction of variables, NARX, MLR, and LMLR models are developed to predict RCEC.

4.1. Multiple Linear Regression (MLR) and Logarithmic Multiple Linear Regression(LMLR) Models

Linear regression is a useful tool available for modeling relationships between variables. This method uses statistical data of independent variables to interpret a dependent variable [79]. In other words, MLR allows defining one response variable as a function of numerous predictor variables. MLR method tries to develop a relationship between a dependent variable and independent variables (the predictors) [80,81]. A simple relation for an MLR methodology is presented in Equation (1).
Y = β 0 + β 1 X 1 + β 2 X 2 + β 3 X 3 + + β n X n + ε
In Equation (1), Y is a response variable that represents the target variable, X 1 , X 2 , X 3 , X n are predictor variables, β 0 , β 1 , β 2 , β 3 , β n are regression coefficients, n is the number of predictor variables and ε is an error coefficient which explains the difference between observed data and predicted data.
Logarithmic linear regression is a statistical tool for modeling relationships between variables. Transforming variables in an MLR model is a useful way to cope with nonlinear problems. LMLR model is an MLR model with a Logarithmic transformation which is also used for modeling the energy consumption in residential and commercial sectors [82]. Indeed, in energy consumption modeling, RCEC is the response variable, and POP, GDP, NGP, EP, and RESH are the predictor variables as presented in Equations (2) and (3).
R C E C = β 0 + β 1 ( P O P ) + β 2 ( G D P ) + β 3 ( N G P ) + β 4 ( E P ) + β 5 ( R E S H ) + ε
l n ( R C E C ) = β 0 + β 1 l n ( P O P ) + β 2 l n ( G D P ) + β 3 l n ( N G P ) + β 4 l n ( E P ) + β 5 l n ( R E S H ) + ε
In Equations (2) and (3) β 0 , β 1 , β 2 , β 3 , β 4 and β 5 are regression coefficients; n is the number of POP, GDP, NGP, EP and RESH and ε is the error coefficient which explains the difference between observed data of RCEC and predicted data of RCEC.

4.2. Nonlinear AutoregRessive with eXogenous Input: NARX Model

Prediction in NARX is a kind of dynamic filtering in which past values of one or more time series are used to predict future values. Dynamic neural networks, which include tapped delay lines, are used for nonlinear filtering and prediction. These dynamic models are significant for analysis, simulation, monitoring, and control of a variety of systems [46].
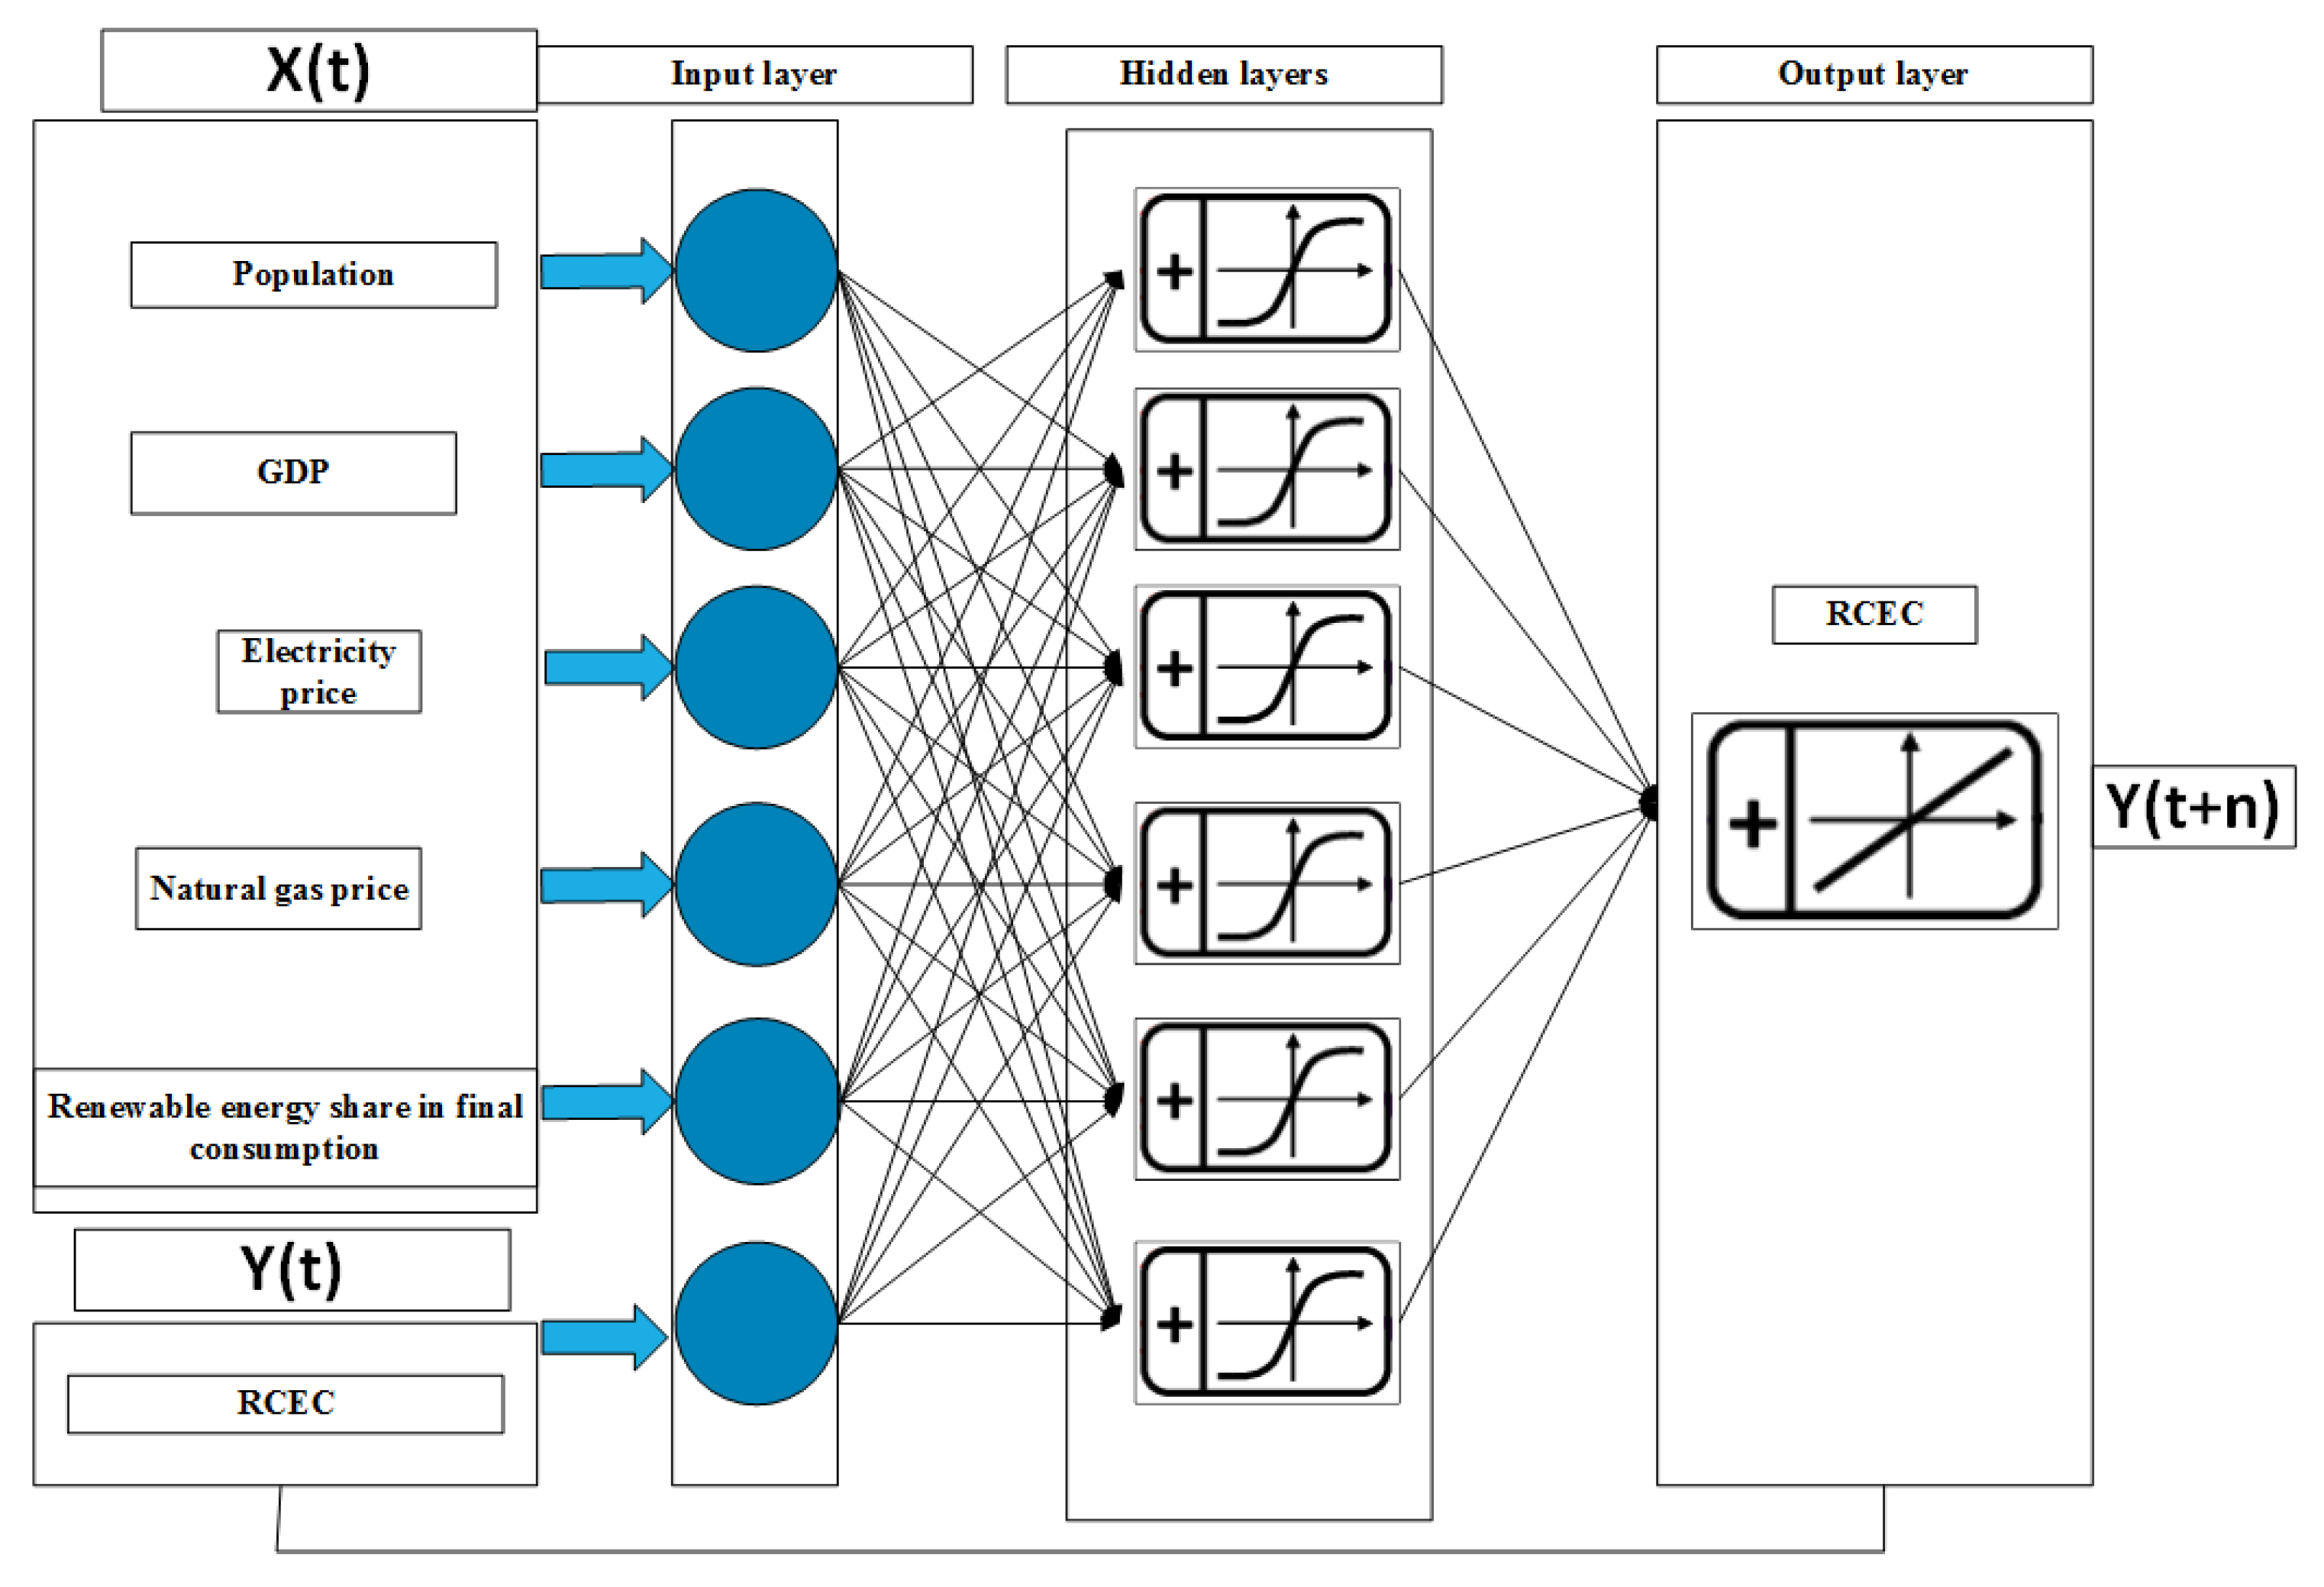
Figure 10 depicts a schematic neural network structure applied in our study. In our work, we collected data of RCEC as a dependent variable and POP, GDP, NGP, EP, and RESH as independent variables from 1967 to 2017. ANN is implemented in two ways in this paper. First, it is used as a tool to predict the future trend of independent variables, where we used a feed forward neural network. Next, we developed a scenario based on the results of variable prediction. We also used the ANN model to forecast RCEC by 2040 based on the scenarios. We also used a nonlinear autoregressive exogenous input(NARX) neural network with four layers and 23 neurons to predict RCEC. NARX can be expressed mathematically as in Equation (4).
Y ( t + n ) = f ( Y ( t + 1 ) , , Y ( t + n 1 ) , X ( t + 1 ) , , X ( t + n 1 ) ) ε
where Y ( t + n ) is the predicted value of RCEC, Y ( t + 1 ) , , Y ( t + n 1 ) are the past values of RCEC from t until t + n 1 , n is the number of time delays, and X ( t + 1 ) , , X ( t + n 1 ) are exogenous inputs to the model which are POP, GDP EP, NGP, and RESH, respectively.

5. Results and Discussion

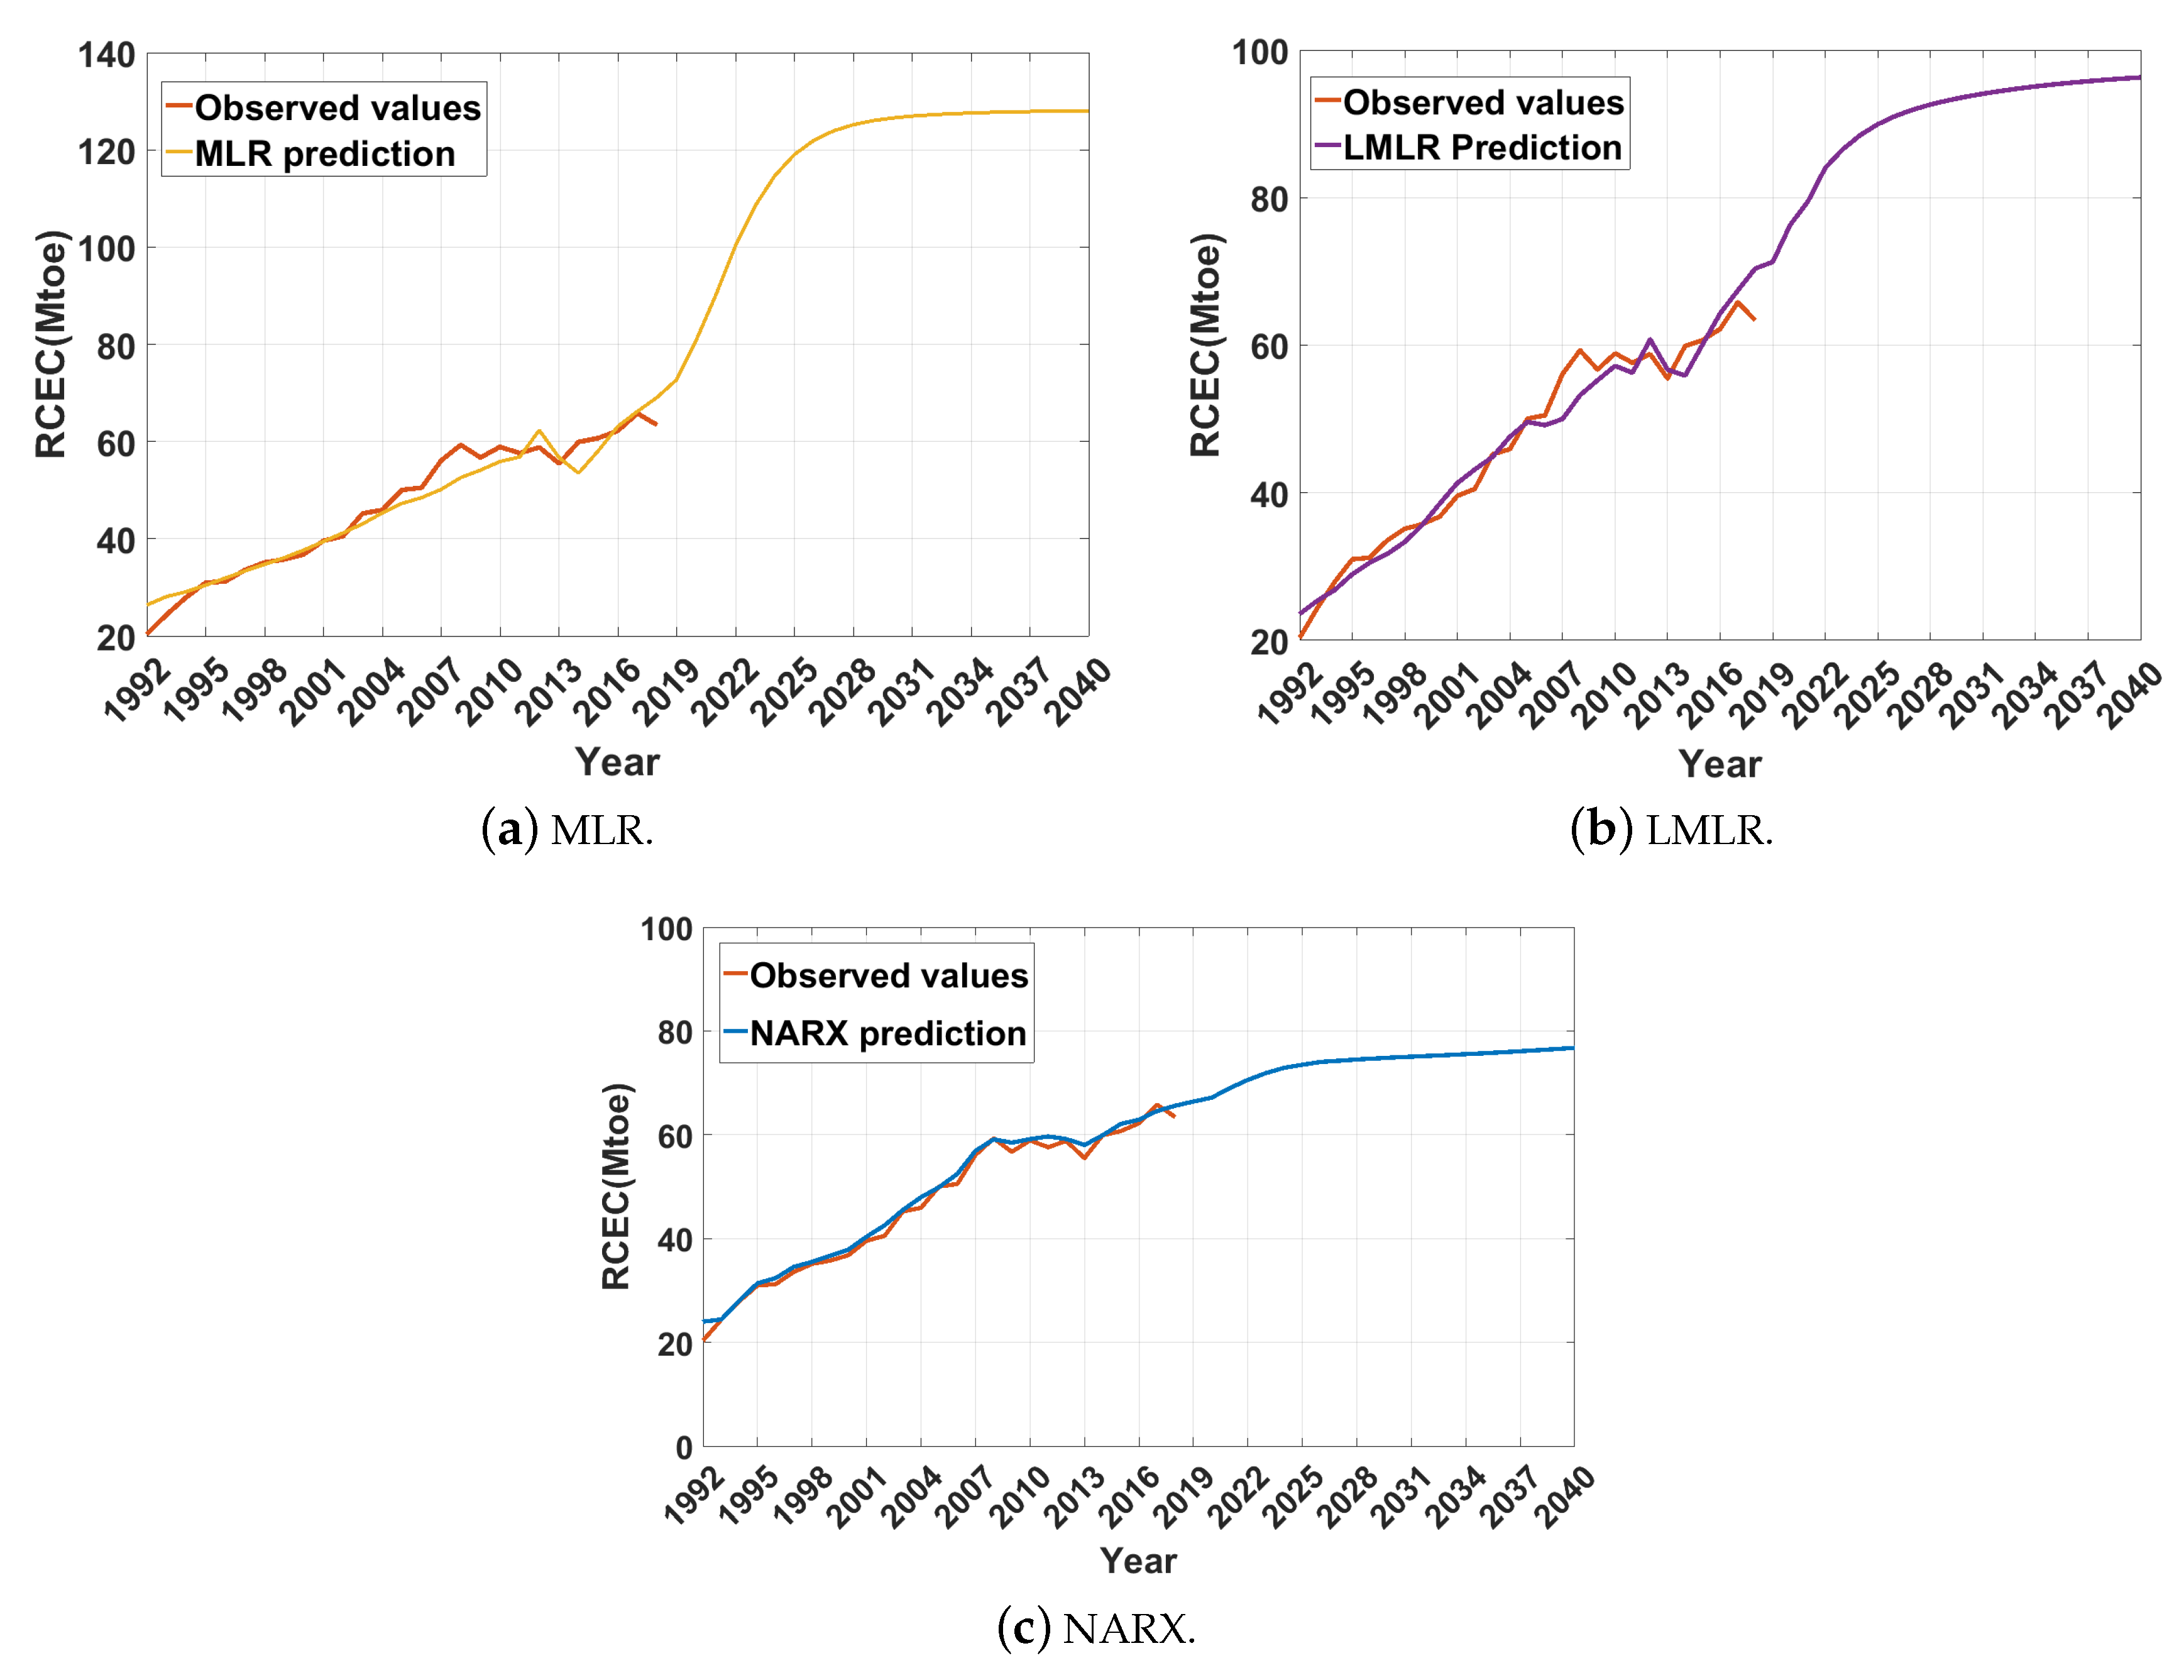
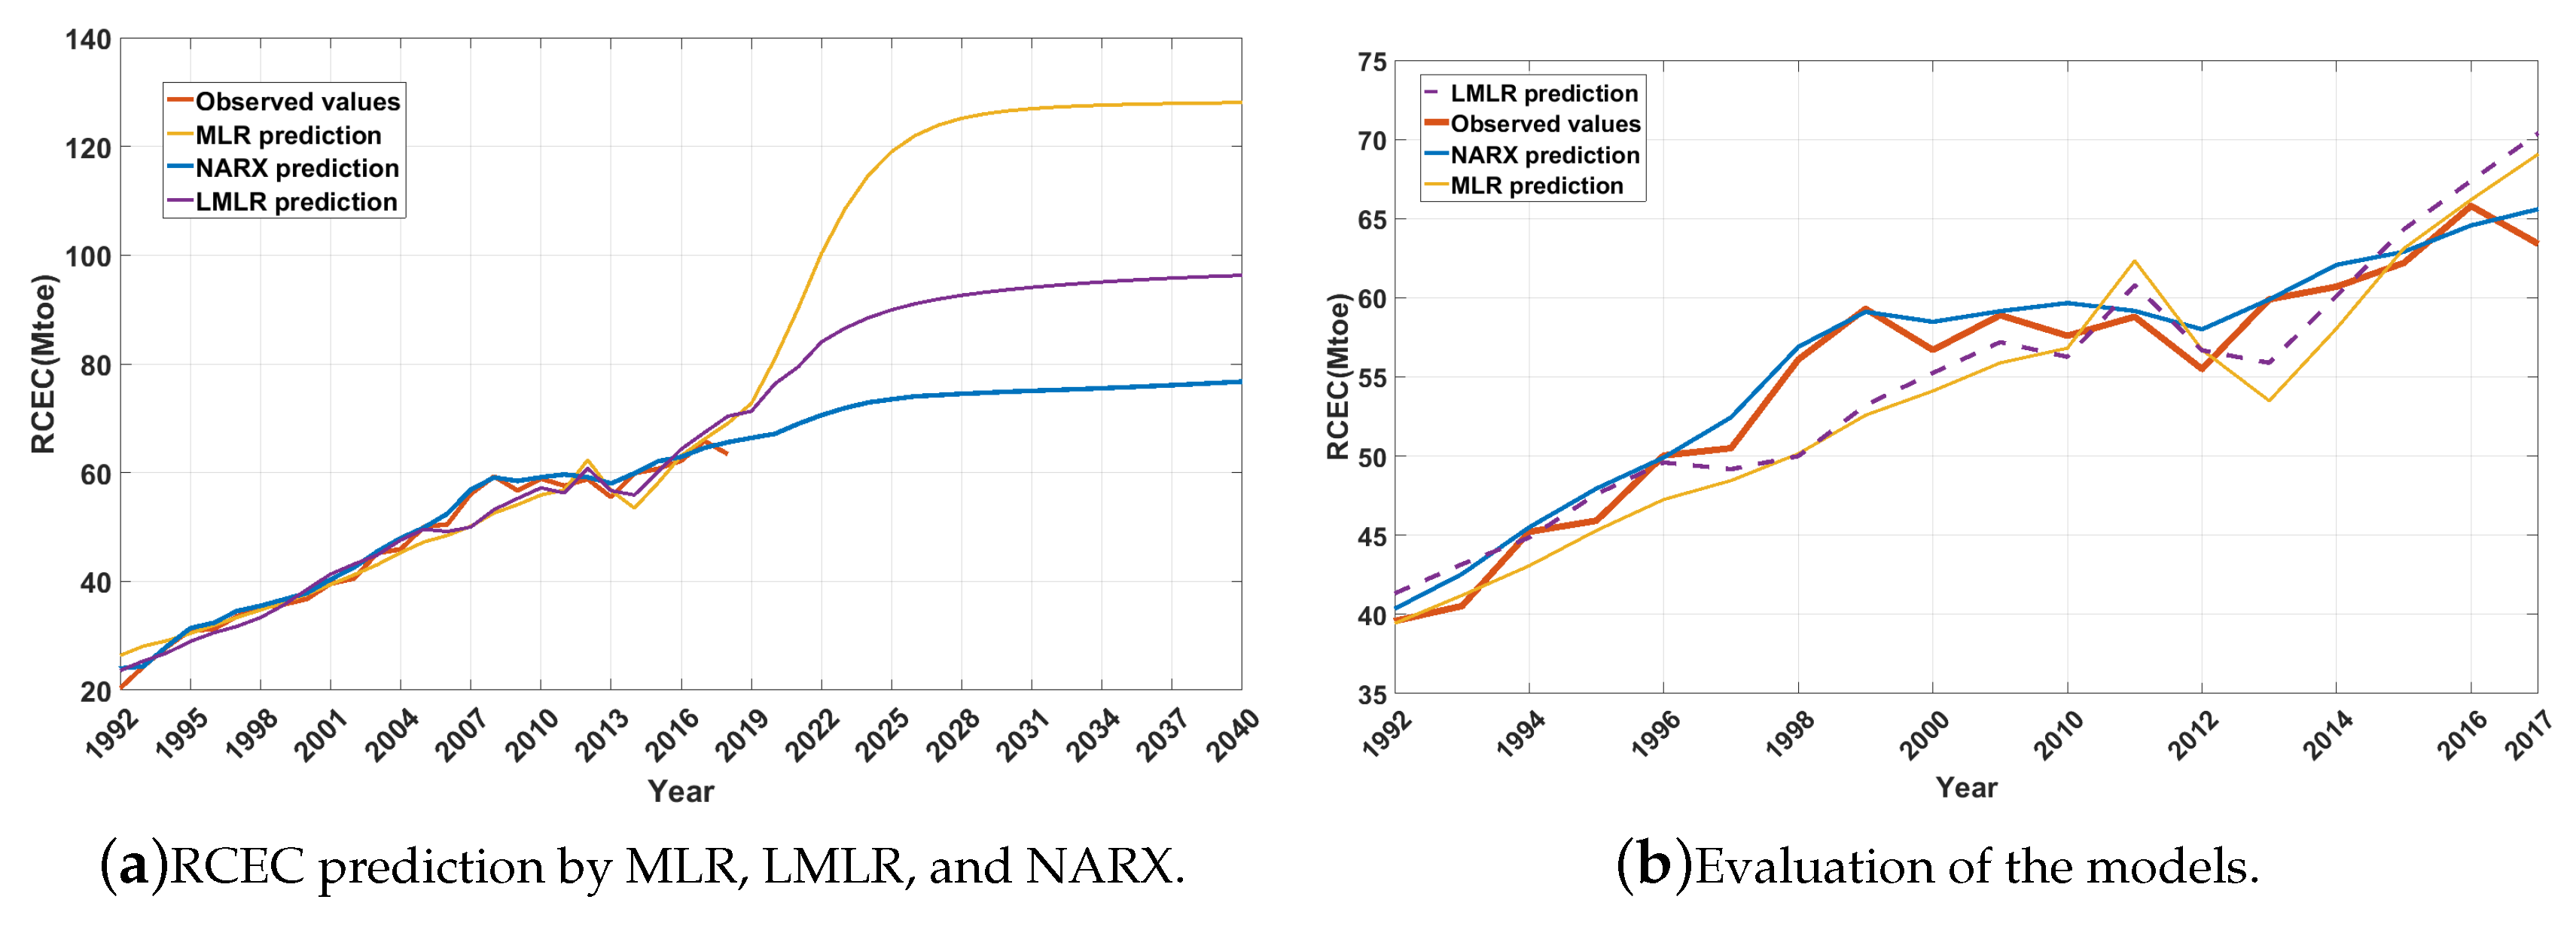
In this paper, Iranian RCEC is predicted by MLR, LMLR, and NARX models. Based on the results of RCEC models, Iranian residential and commercial energy consumption would have three different future scenarios. The results of MLR, LMLR, and NARX are depicted in Figure 11.
The MLR method forecasts a drastic increase in RCEC while LMLR and NARX methods anticipate RCEC growth with a gentle slope.
We proposed several performance metrics to validate these methods. The metrics will be explained in the following subsection. According to the results of these metrics, NARX is more accurate than LMLR, and LMLR is more precise in predicting RCEC than MLR.

5.1. Model Analyzing Measures

MSE is the second moment of the error, RMSE is the Root Mean Squared Error, and MAPE is Mean Absolute Percentage Error. MSE, RMSE, and MAPE are standard deviations of the prediction errors. MSE, RMSE, and MAPE show how much the prediction values are close to the fit line (regression line) [83,84]. MSE, RMSE and MAPE are formulated as in Equations (5)–(7) that Y i and Y i ^ are observed value and predicted value of the RCEC, respectively. The n and k show the number of evaluated pairs of datasets. They are representatives of the first and the last pair of RCEC values.
M S E = 1 n n = 1 k ( Y i Y i ^ ) 2
R M S E = 1 n n = 1 k ( Y i Y i ^ ) 2
M A P E = 1 n n = 1 k | Y i Y i ^ Y i | × 100
The R-Squared is the proportion of variance of the observed dataset to the variance of the predicted dataset. R-squared is a measure of accuracy, generally used as an index to compare the error of models [83].
R 2 = V A R y V A R y ^
In Equation (8) V A R y ^ , and VAR y are predicted and observed values of dataset.

5.2. MLR

According to the MLR coefficients in Table 2, RCEC is influenced by population growth, RESH, NGP, and EP, respectively. The RESH and NGP coefficients have negative values, which show that the growth of RESH and NGP would reduce RCEC. The R-squared and MSE values of the MLR model are 0.9727 and 13.63, which are acceptable for the MLR method. The RCEC is forecasted by MLR until 2040 in Figure 11a indicating a drastic growth with more than 100% in the next 20 years. The formulation of the MLR model for energy consumption in the residential and commercial sectors is presented in Equation (2).
In Table 2 the values of β represents the correlation between dependent variable and predictor variables. According to MLR coefficients, the population has the biggest positive impact on RCEC because its β coefficient has the highest value among others. However, negative coefficients represent the inverse relation between the RCEC and the predictor variables. For example, NGP and RESH have negative values of −0.0117 and −1.1572. This means that these coefficients will decrease the RCEC values.

5.3. LMLR

The developed logarithmic multi-variate linear regression (LMLR) model defines energy consumption in the residential and commercial sectors equation as presented in Equation (3). The coefficients of the variables in the LMLR equation are presented in Table 3.
Based on LMLR coefficients, the population is the most influential variable in forecasting RCEC. This means the government can control RCEC by controlling the population in a long-term period. As found in LMLR, the values of β associated with NGP and RESH have negative values. This explains that RCEC will reduce if those variables can be increased. Therefore, the strategy by increasing RESH will help the country to move toward a sustainable energy system by decreasing GHG emissions. This also decreases energy consumption in the residential and commercial sectors, which accounts for 34% of the total energy consumption.
The main factors of energy consumption in Iran are Population, GDP, EP, RESH, and NGP (as presented in Table 3). NGP coefficient shows that Iranian policies may affect RCEC from a long-term perspective as long as they continue to pay attention to the natural gas role in moving toward a sustainable energy system. The LMLR prediction as shown in Figure 11b, RCEC will exceed 96 Mtoe by 2040. In addition, the LMLR diagram demonstrates that RCEC will stabilize after 2025 with a steady growing trend.

5.4. ANN

NARX model develops complex interconnections between the variables and finally develops a function. The model can predict the target variable (RCEC) based on the growing behavior of the input variables and the target variable. In this paper, the implemented NARX model contains two input delays and four hidden layers. The model uses the time-series datasets of RCEC between 1967 and 2014 as target data. However, POP, GDP, NGP, EP, and RESH as exogenous inputs for the NARX model.
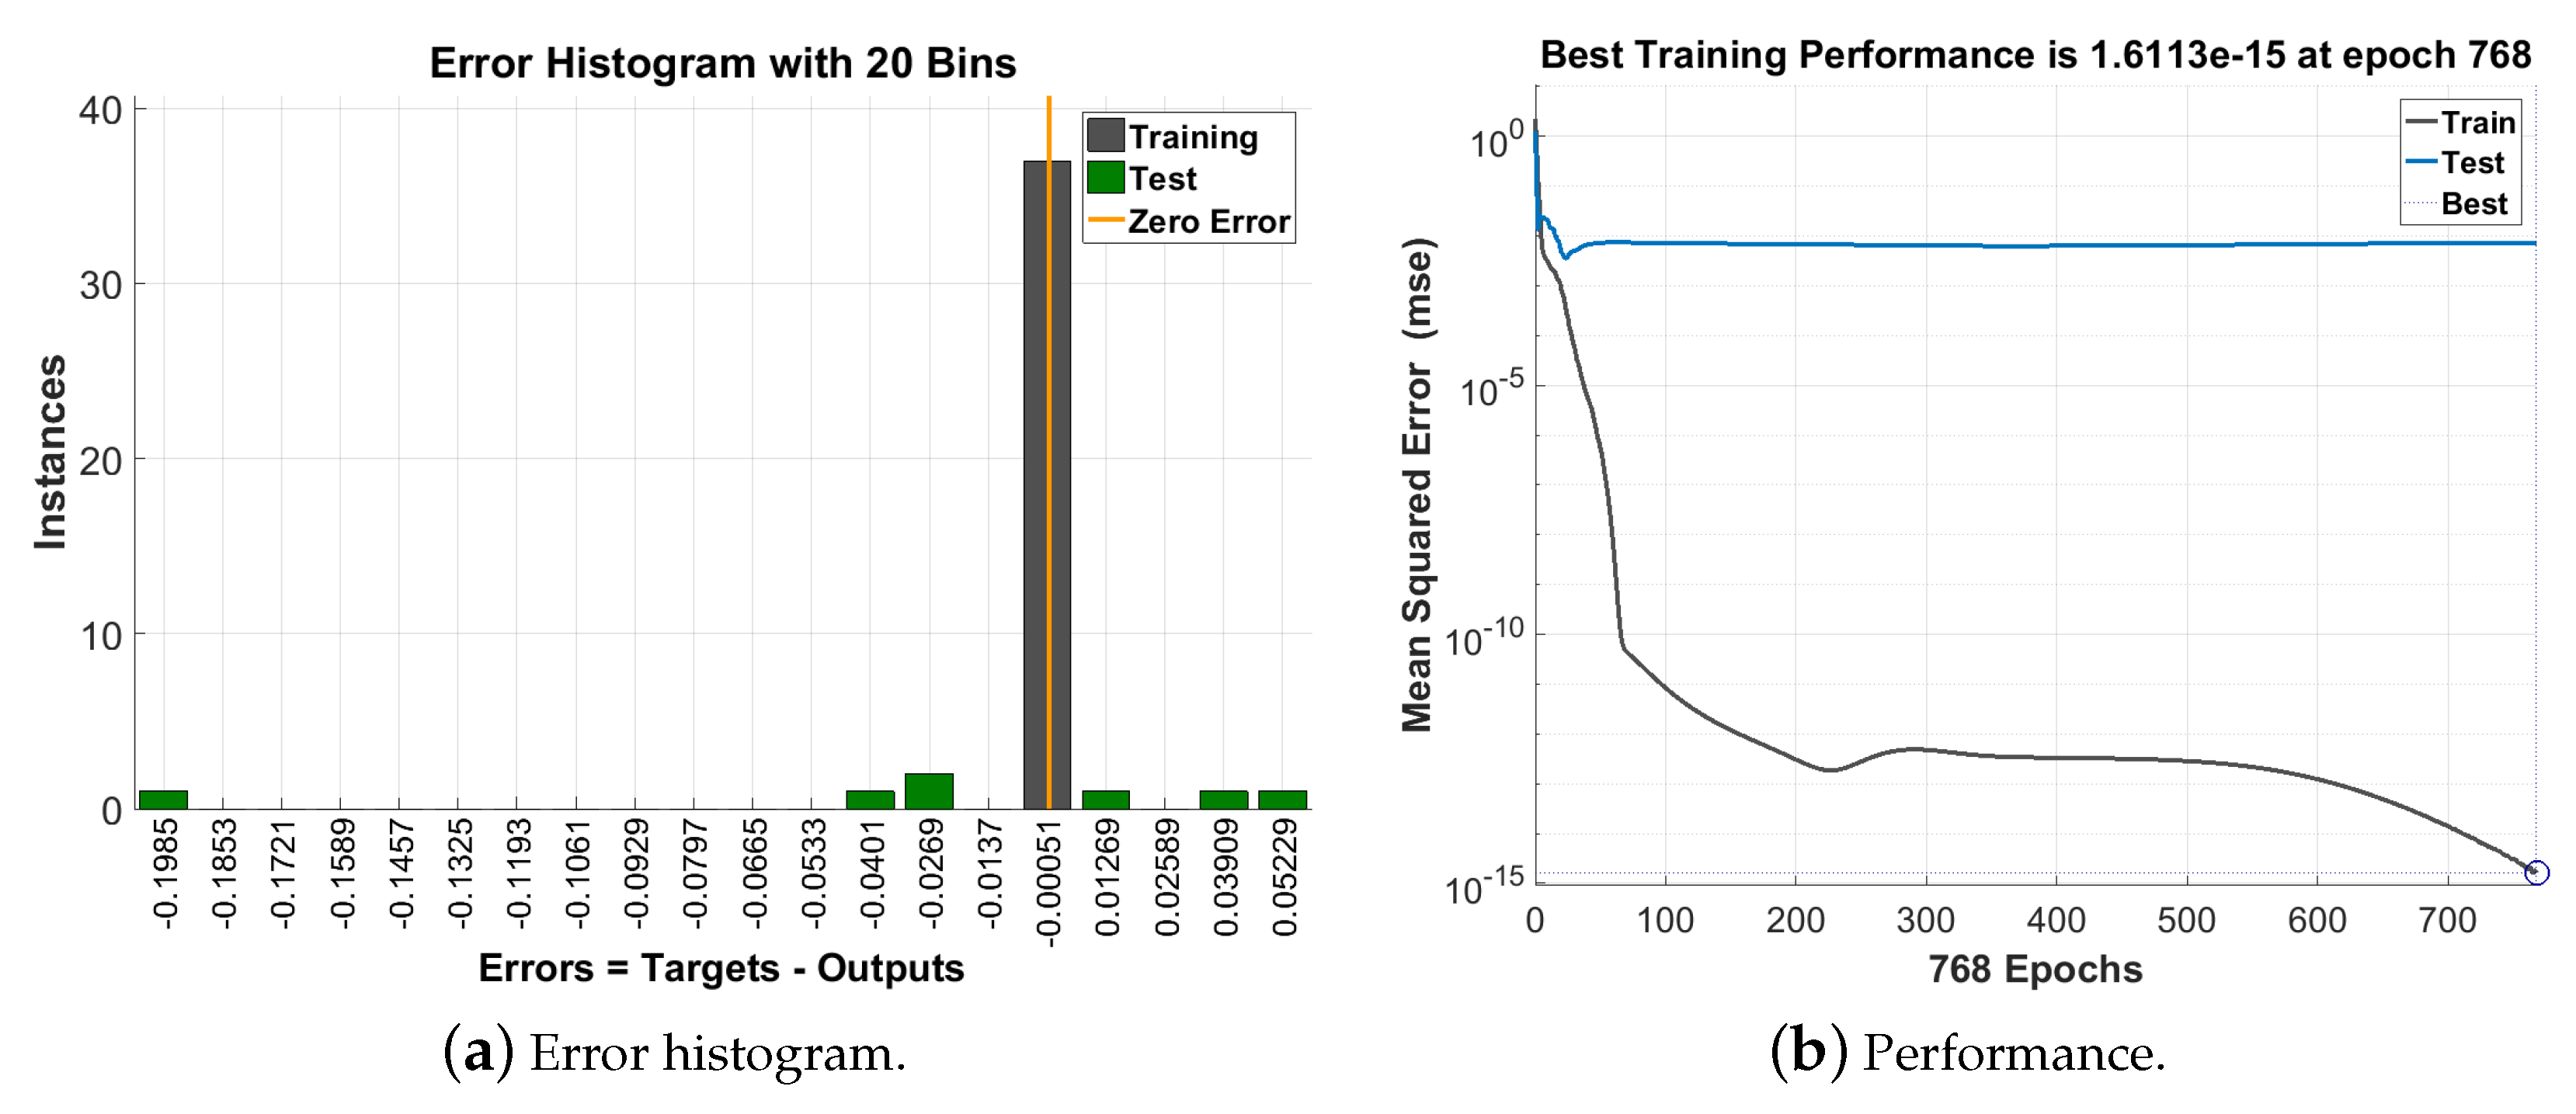
The dataset between 2014 and 2017 is used for evaluating model accuracy. The NARX, MLR, and LMLR results are compared with the observed data from 2014 to 2017 (depicted in Figure 14b). The results of model evaluation are presented in Figure 14. It can be seen that the NARX model has the highest precision between the remaining models. Figure 12a depicts an error histogram which is the histogram of the errors between target values and predicted values by the NARX model. This figure indicates the difference between the predicted values and the target values. ANN model is also validated by MSE, RMSE, MAPE and R-squared measures (regression-diagram) which are presented in Figure 12 and Figure 13, and Table 4 and Table 5, respectively.
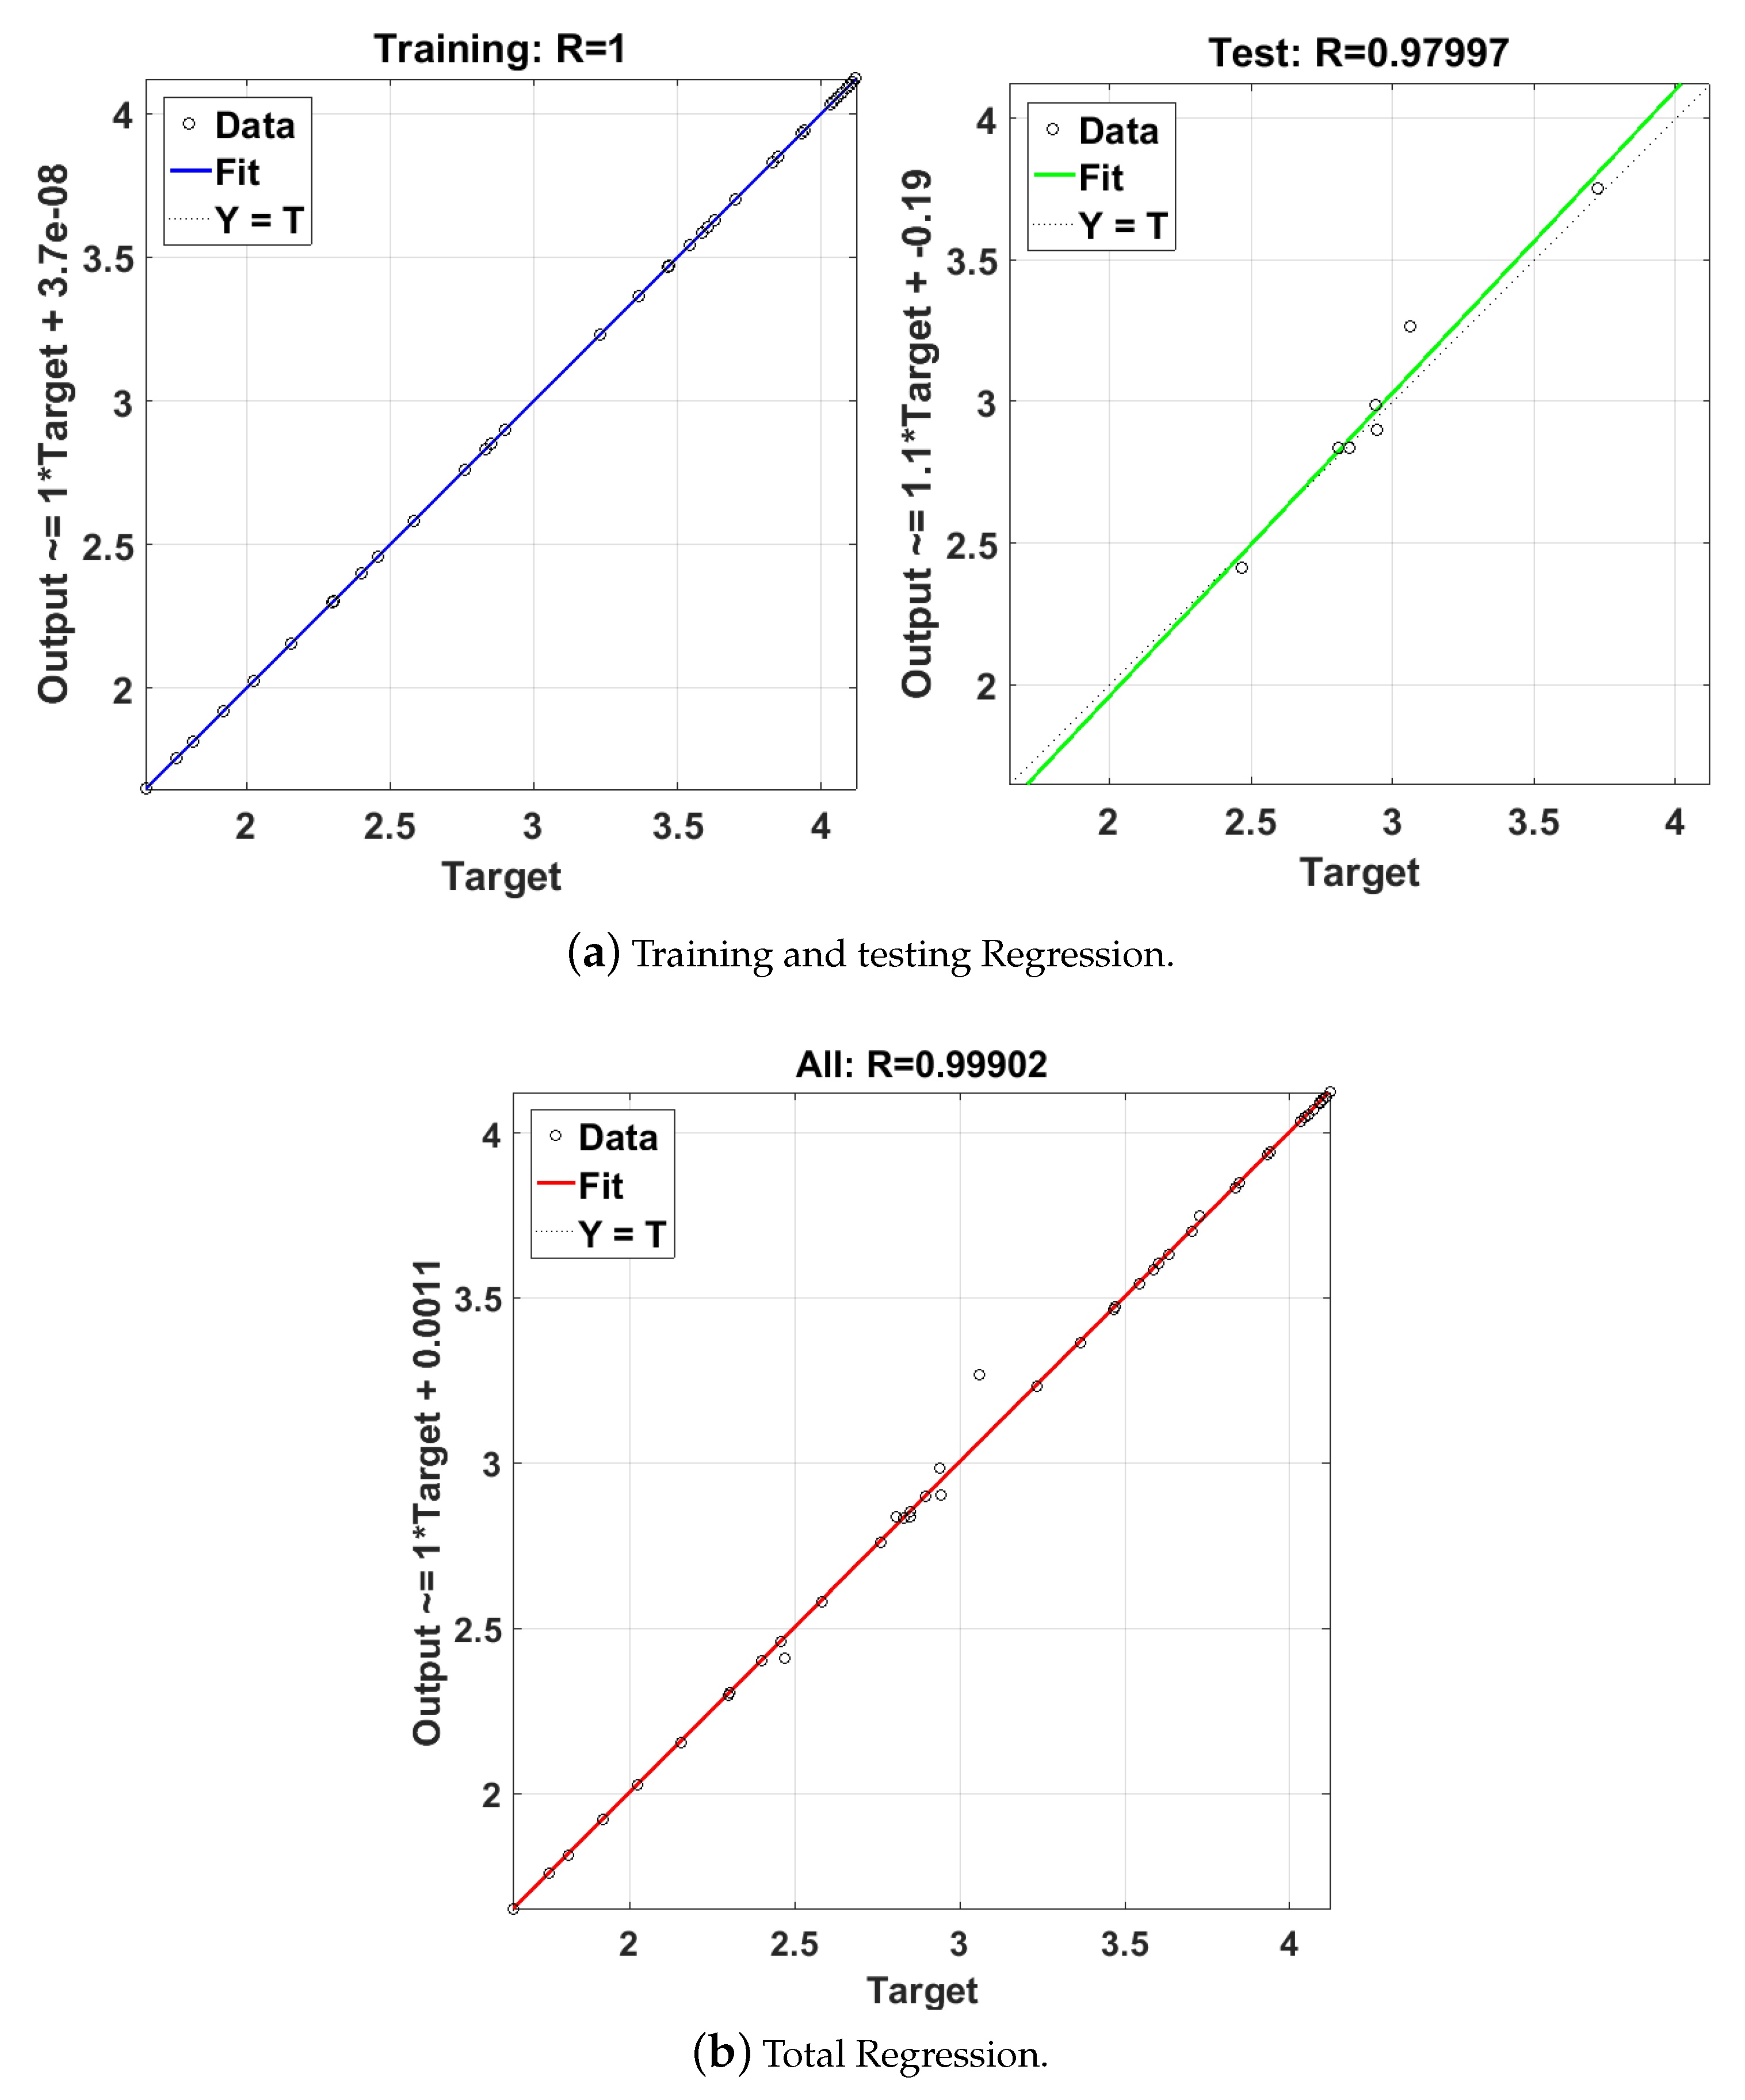
Figure 13 presents the regression plots between the target and the output of the NARX model, including for training, testing, and the total regression. The data points in the regression plots indicate the relationship between outputs and targets. The dashed line represents the reference line and the solid line embodies the best-fit regression line between outputs and targets. The R-value represents the outputs and targets relationship. R-squared is close to 1, it indicates that the modeling performance is almost perfect. On the other hand, R-squared close to zero shows that the modeling performance is weak because the target and the output relationship is poor. In this model, we found that the R-value is over 0.99 for the total response, which can be considered to be a satisfactory response.
Moreover, Figure 14a presents the forecast of RCEC. This explains that RCEC growth by the NARX model is expected to increase by 21.4% until 2040. The time-series of RCEC prediction is depicted in Figure 11c. The NARX model has been developed and validated using three different periods. First, we perform NARX training using the dataset from the years of 1992 to 2014. Second, from 2014 to 2017, we perform RCEC forecasting using the trained NARX where we can validate the forecasting results as shown above. Finally, using the validated NARX model, we perform RCEC forecasting from the years of 2018 to 2040.

5.5. Model Evaluation

RCEC dataset is categorized into two groups; the training group from 1967 to 2014, and the evaluating group, which includes the years of 2015, 2016, and 2017. MLR, LMLR, and NARX models are developed and compared to assess their accuracy. The results of the comparison are presented in Figure 14b. The prediction of NARX, MLR, and LMLR is represented using blue, yellow, and purple curves.
According to Figure 14, the results of NARX are closer to the training dataset as well as to the evaluation dataset than LMLR and MLR models. The LMLR model is more accurate than MLR. The evaluation dataset, NARX prediction, LMLR prediction, and MLR prediction are presented in Table 4. The MSE, RMSE, and MAPE measures are calculated from 2011 to 2017 for all models. Based on the results, the NARX method demonstrates the best performance in comparison with MLR and LMLR models. The conclusion is confirmed through the results presented in Table 4 and Table 5. Indeed, after NARX, LMLR lies in second place according to these metrics. Hence, based on the validation of three proposed RCEC models, it is more probable that RCEC will grow as the forecasting by NARX model.
A comparison between the present study and previous studies about Iranian residential and commercial energy consumption is presented in Table 6. The mean absolute percentage of error (MAPE) has been used as the metric for this comparison. Unfortunately, there are few studies in the literature about the forecasting of energy consumption in Iranian residential and commercial sectors. The comparison demonstrates that our proposed NARX model is not solely better than MLR and LMLR, but this is also the best model compared with the rest of the existing methods in the literature.

6. Conclusions

In this paper, we studied the energy consumption in Iranian residential and commercial sectors. Considering the effects of macro-economic and technological factors including population, gross domestic production, natural gas price, electricity price, and renewable energy share in final energy consumption; we developed three machine learning models to forecast energy consumption by 2040. The methods include multi-variable linear regression, logarithmic multi-variable linear regression, and nonlinear autoregressive with exogenous input artificial neural networks. First, we evaluated the trends of the mentioned variables and then a feed forward artificial neural network was chosen to forecast the variables by 2040. From the analysis of the variable coefficients, the prevalent variables are found to be population, GDP, EP, and RESH. In addition, the growth of the variables with a negative coefficient causes a decrease in RCEC. According to our results, renewable energy share and natural gas prices are found to be the variables with negative coefficients. This translates to the growth of these variables causes a reduction in energy consumption. According to the modeling results, a growing trend of RCEC until 2030 is expected, thereafter, RCEC would be stabilized based on the NARX and LMLR predictions. Based on the NARX, LMLR, and MLR models, Iranian RCEC would be 76.97, 96.42, and 128.09 Mtoe, respectively by 2040. According to the metrics of R-squared, MSE, RMSE, and MAPE, we found that the most accurate model is NARX following by LMLR and MLR for the Iran RCEC case study.
However, our top-down modeling, has various limitations, such as the unavailability of accurate data for other effective factors in Iran. Indeed, the non-sustainable energy market causes fundamental barriers to economic forecasting. Moving toward a sustainable energy system requires accurate energy models to anticipate energy demand and energy supply precisely. Improving census centers will assist modelers to develop more accurate energy models by providing hourly datasets of energy-related factors. From the model coefficients, the increase of renewable energy share in final consumption and natural gas price enables the reduction of RCEC in the country.

Author Contributions

S.A.N. and A.A. conceived of the presented idea. S.A.N. developed the theory and performed the computations. A.A. encouraged S.A.N. to consider the NARX neural networks method for modeling. M.Z. and S.A.N. investigated the influential factors in RCEC. S.M. and S.A.N. verified the regression methods. S.A.N., A.A., and S.M. prepared the initial version of the paper. N.H.M. and M.A.Z. revised the structure of the paper and paraphrased the paper. N.H.M. and M.A.Z. improved the machine learning models. N.H.M., S.A.N., and A.A. supervised the findings of this work. All authors discussed the results and contributed to the final manuscript. All authors have read and agreed to the published version of the manuscript.

Funding

This research received no external funding.

Acknowledgments

Open access funding provided by University of Helsinki. This work is supported by Helsinki Center for Data Science (HiDATA) program within Helsinki Institute for Information Technology (HIIT).

Conflicts of Interest

The authors declare no conflict of interest.

References

  1. Zanjirchi, S.M.; Shojaei, S.; Sadrabadi, A.N.; Jalilian, N. Promotion of solar energies usage in Iran: A scenario-based road map. Renew. Energy 2020, 150, 278–292. [Google Scholar] [CrossRef]
  2. Samadi, S.H.; Ghobadian, B.; Nosrati, M. Prediction and estimation of biomass energy from agricultural residues using air gasification technology in Iran. Renew. Energy 2020, 149, 1077–1091. [Google Scholar] [CrossRef]
  3. Fayaz, M.; Shah, H.; Aseere, A.M.; Mashwani, W.K.; Shah, A.S. A framework for prediction of household energy consumption using feed forward back propagation neural network. Technologies 2019, 7, 30. [Google Scholar] [CrossRef] [Green Version]
  4. International Institute for Sustainable Development (IISD). Global Energy Demand in 2018 Grew at Fastest Pace in a Decade. Available online: https://sdg.iisd.org/news/global-energy-demand-in-2018-grew-at-fastest-pace-in-a-decade/ (accessed on 26 August 2020).
  5. Amber, K.P.; Aslam, M.W.; Mahmood, A.; Kousar, A.; Younis, M.Y.; Akbar, B.; Chaudhary, G.Q.; Hussain, S.K. Energy consumption forecasting for university sector buildings. Energies 2017, 10, 1579. [Google Scholar] [CrossRef] [Green Version]
  6. IEA. Iran—Countries & Regions—IEA. Available online: https://www.iea.org/countries/Iran (accessed on 7 July 2020).
  7. Hossein Motlagh, N.; Mohammadrezaei, M.; Hunt, J.; Zakeri, B. Internet of Things (IoT) and the energy sector. Energies 2020, 13, 494. [Google Scholar] [CrossRef] [Green Version]
  8. Motlagh, N.H.; Khajavi, S.H.; Jaribion, A.; Holmstrom, J. An iot-based automation system for older homes: A use case for lighting system. In Proceedings of the 2018 IEEE 11th Conference on Service-Oriented Computing and Applications (SOCA), Paris, France, 20–22 November 2018; pp. 1–6. [Google Scholar]
  9. Nejat, P.; Jomehzadeh, F.; Taheri, M.M.; Gohari, M.; Majid, M.Z.A. A global review of energy consumption, CO2 emissions and policy in the residential sector (with an overview of the top ten CO2 emitting countries). Renew. Sustain. Energy Rev. 2015, 43, 843–862. [Google Scholar] [CrossRef]
  10. Hall, L.M.; Buckley, A.R. A review of energy systems models in the UK: Prevalent usage and categorisation. Appl. Energy 2016, 169, 607–628. [Google Scholar] [CrossRef] [Green Version]
  11. Pourvahidi, P.; Ozdeniz, M.B. Bioclimatic analysis of Iranian climate for energy conservation in architecture. Sci. Res. Essays 2013, 8, 6–16. [Google Scholar]
  12. Mehri, N.; Messkoub, M.; Kunkel, S. Trends, determinants and the implications of population aging in Iran. Ageing Int. 2020, 1–17. Available online: https://doi.org/10.1007/s12126-020-09364-z (accessed on 7 July 2020).
  13. Kim, M.; Jung, S.; Kang, J.W. Artificial Neural Network-Based Residential Energy Consumption Prediction Models Considering Residential Building Information and User Features in South Korea. Sustainability 2020, 12, 109. [Google Scholar] [CrossRef] [Green Version]
  14. Runge, J.; Zmeureanu, R. Forecasting energy use in buildings using artificial neural networks: A review. Energies 2019, 12, 3254. [Google Scholar] [CrossRef] [Green Version]
  15. Amjadi, M.; Nezamabadi-Pour, H.; Farsangi, M. Estimation of electricity demand of Iran using two heuristic algorithms. Energy Convers. Manag. 2010, 51, 493–497. [Google Scholar] [CrossRef]
  16. Pahlavan, S.; Jahangiri, M.; Shamsabadi, A.A.; Baharizadeh, A. Assessing the Current Status of Renewable Energies and Their Limitations in Iran. Int. J. Renew. Energy Dev. 2020, 9, 97–105. [Google Scholar] [CrossRef]
  17. Li, Z.; Han, Y.; Xu, P. Methods for benchmarking building energy consumption against its past or intended performance: An overview. Appl. Energy 2014, 124, 325–334. [Google Scholar] [CrossRef]
  18. Shahmoradi, A.; Shakouri, H. Investigation On The Impact Of An Energy De-subsidization Shock On The General Price Index Via A Nonlinear Inflation Model: Case Of Iran. Iran. Econ. Rev. 2010, 15, 33–51. [Google Scholar]
  19. Shakouri, H.; Kazemi, A. Selection of the best ARMAX model for forecasting energy demand: Case study of the residential and commercial sectors in Iran. Energy Effic. 2016, 9, 339–352. [Google Scholar] [CrossRef]
  20. Omrany, H.; Marsono, A.K. National building regulations of Iran benchmarked with Breeam and Leed: A comparative analysis for regional adaptations. Curr. J. Appl. Sci. Technol. 2016, 16, 1–15. [Google Scholar] [CrossRef]
  21. Suganthi, L.; Samuel, A.A. Energy models for demand forecasting—A review. Renew. Sustain. Energy Rev. 2012, 16, 1223–1240. [Google Scholar] [CrossRef]
  22. Swan, L.G.; Ugursal, V.I. Modeling of end-use energy consumption in the residential sector: A review of modeling techniques. Renew. Sustain. Energy Rev. 2009, 13, 1819–1835. [Google Scholar] [CrossRef]
  23. Laha, P.; Chakraborty, B. Energy model—A tool for preventing energy dysfunction. Renew. Sustain. Energy Rev. 2017, 73, 95–114. [Google Scholar] [CrossRef]
  24. Da Silva, F.L.; Souza, R.C.; Oliveira, F.L.C.; Lourenço, P.M.; de C. Fagundes, W. Forecast of long-term electricity consumption of the industrial sub-sector of pulp and paper in Brazil using a bottom-up approach. Procedia Comput. Sci. 2015, 55, 514–522. [Google Scholar] [CrossRef] [Green Version]
  25. Cayla, J.M.; Maizi, N.; Marchand, C. The role of income in energy consumption behaviour: Evidence from French households data. Energy Policy 2011, 39, 7874–7883. [Google Scholar] [CrossRef]
  26. Min, J.; Hausfather, Z.; Lin, Q.F. A high-resolution statistical model of residential energy end use characteristics for the United States. J. Ind. Ecol. 2010, 14, 791–807. [Google Scholar] [CrossRef]
  27. Moshiri, S.; Atabi, F.; Panjehshahi, M.H.; Lechtenböehmer, S. Long run energy demand in Iran: A scenario analysis. Int. J. Energy Sect. Manag. 2012, 6, 120–144. [Google Scholar] [CrossRef] [Green Version]
  28. Motlagh, N.H.; Zaidan, M.A.; Lagerspetz, E.; Varjonen, S.; Toivonen, J.; Mineraud, J.; Rebeiro-Hargrave, A.; Siekkinen, M.; Hussein, T.; Nurmi, P.; et al. Indoor air quality monitoring using infrastructure-based motion detectors. In Proceedings of the 2019 IEEE 17th International Conference on Industrial Informatics (INDIN), Helsinki-Espoo, Finland, 23–25 July 2019; Volume 1, pp. 902–907. [Google Scholar]
  29. Farzan, F.; Jafari, M.A.; Gong, J.; Farzan, F.; Stryker, A. A multi-scale adaptive model of residential energy demand. Appl. Energy 2015, 150, 258–273. [Google Scholar] [CrossRef]
  30. Fan, H.; MacGill, I.; Sproul, A. Statistical analysis of driving factors of residential energy demand in the greater Sydney region, Australia. Energy Build. 2015, 105, 9–25. [Google Scholar] [CrossRef]
  31. Dai, H.; Mischke, P.; Xie, X.; Xie, Y.; Masui, T. Closing the gap? Top-down versus bottom-up projections of China’s regional energy use and CO2 emissions. Appl. Energy 2016, 162, 1355–1373. [Google Scholar] [CrossRef]
  32. Palapanyakul, K.; Siripongwutikorn, P. Prediction model of short-term electrical load in an air conditioning environment. In Proceedings of the 2017 International Electrical Engineering Congress (iEECON), Pattaya, Thailand, 8–10 March 2017; pp. 1–4. [Google Scholar]
  33. Mustapa, R.F.; Dahlan, N.Y.; Yassin, A.I.M.; Nordin, A.H.M. Quantification of energy savings from an awareness program using NARX-ANN in an educational building. Energy Build. 2020, 215, 109899. [Google Scholar] [CrossRef]
  34. Brandt, A.R.; Dale, M.; Barnhart, C.J. Calculating systems-scale energy efficiency and net energy returns: A bottom-up matrix-based approach. Energy 2013, 62, 235–247. [Google Scholar] [CrossRef]
  35. Ozturk, H.K.; Canyurt, O.E.; Hepbasli, A.; Utlu, Z. Residential-commercial energy input estimation based on genetic algorithm (GA) approaches: An application of Turkey. Energy Build. 2004, 36, 175–183. [Google Scholar] [CrossRef]
  36. Bianco, V.; Manca, O.; Nardini, S. Electricity consumption forecasting in Italy using linear regression models. Energy 2009, 34, 1413–1421. [Google Scholar] [CrossRef]
  37. MohammadZadeh, S.; Masoumi, A.A. Modeling residential electricity demand using neural network and econometrics approaches. In Proceedings of the 40th International Conference on Computers & Indutrial Engineering, Awaji Island, Japan, 26–28 July 2010; pp. 1–6. [Google Scholar]
  38. Siller, T.; Kost, M.; Imboden, D. Long-term energy savings and greenhouse gas emission reductions in the Swiss residential sector. Energy Policy 2007, 35, 529–539. [Google Scholar] [CrossRef]
  39. Shabani, Z.D.; Shahnazi, R. Energy consumption, carbon dioxide emissions, information and communications technology, and gross domestic product in Iranian economic sectors: A panel causality analysis. Energy 2019, 169, 1064–1078. [Google Scholar] [CrossRef]
  40. Forouzanfar, M.; Doustmohammadi, A.; Menhaj, M.B.; Hasanzadeh, S. Modeling and estimation of the natural gas consumption for residential and commercial sectors in Iran. Appl. Energy 2010, 87, 268–274. [Google Scholar] [CrossRef]
  41. Ahmadvand, A.; Ghaderi, S.; Boustanpour, H. The analysis of residential energy consumption in Iran using system dynamic. In Proceedings of the 2010 IEEE Second International Conference on Computer Modeling and Simulation, Sanya, China, 22–24 January 2010; Volume 3, pp. 290–294. [Google Scholar]
  42. Murat, Y.S.; Ceylan, H. Use of artificial neural networks for transport energy demand modeling. Energy Policy 2006, 34, 3165–3172. [Google Scholar] [CrossRef]
  43. Boghetti, R.; Fantozzi, F.; Kämpf, J.H.; Salvadori, G. Understanding the performance gap: A machine learning approach on residential buildings in Turin, Italy. J. Phys. Conf. Ser. 2019, 1343, 012042. [Google Scholar] [CrossRef]
  44. Abiodun, O.I.; Jantan, A.; Omolara, A.E.; Dada, K.V.; Mohamed, N.A.; Arshad, H. State-of-the-art in artificial neural network applications: A survey. Heliyon 2018, 4, e00938. [Google Scholar] [CrossRef] [PubMed] [Green Version]
  45. Zaidan, M.A.; Wraith, D.; Boor, B.E.; Hussein, T. Bayesian proxy modelling for estimating black carbon concentrations using white-box and black-box models. Appl. Sci. 2019, 9, 4976. [Google Scholar] [CrossRef] [Green Version]
  46. Zaidan, M.A.; Motlagh, N.H.; Fung, P.L.; Lu, D.; Timonen, H.; Kuula, J.; Niemi, J.V.; Tarkoma, S.; Petaja, T.; Kulmala, M.; et al. Intelligent Calibration and Virtual Sensing for Integrated Low-Cost Air Quality Sensors. IEEE Sens. J. 2020. [Google Scholar] [CrossRef]
  47. Zaidan, M.; Haapasilta, V.; Relan, R.; Junninen, H.; Aalto, P.; Kulmala, M.; Laurson, L.; Foster, A. Predicting atmospheric particle formation days by Bayesian classification of the time series features. Tellus B Chem. Phys. Meteorol. 2018, 70, 1–10. [Google Scholar] [CrossRef] [Green Version]
  48. Zaidan, M.A.; Dada, L.; Alghamdi, M.A.; Al-Jeelani, H.; Lihavainen, H.; Hyvärinen, A.; Hussein, T. Mutual information input selector and probabilistic machine learning utilisation for air pollution proxies. Appl. Sci. 2019, 9, 4475. [Google Scholar] [CrossRef] [Green Version]
  49. Tkáč, M.; Verner, R. Artificial neural networks in business: Two decades of research. Appl. Soft Comput. 2016, 38, 788–804. [Google Scholar] [CrossRef]
  50. Alanis, A.Y.; Arana-Daniel, N.; Lopez-Franco, C. Artificial Neural Networks for Engineering Applications; Academic Press: Cambridge, MA, USA, 2019. [Google Scholar]
  51. Zaidan, M.A.; Canova, F.F.; Laurson, L.; Foster, A.S. Mixture of clustered Bayesian neural networks for modeling friction processes at the nanoscale. J. Chem. Theory Comput. 2017, 13, 3–8. [Google Scholar] [CrossRef] [PubMed] [Green Version]
  52. Rodrigues, F.; Cardeira, C.; Calado, J. Neural networks applied to short term load forecasting: A case study. In Smart Energy Control Systems for Sustainable Buildings; Springer: Berlin/Heidelberg, Germany, 2017; pp. 173–197. [Google Scholar]
  53. Ali, S.; Hasanien, H.M.; Al-Ammar, E.A. Application of an adaptive artificial neural network controller for improving the dynamic response of doubly fed induction generators-based wind farm. J. Bioinform. Intell. Control 2013, 2, 83–91. [Google Scholar] [CrossRef]
  54. Muyeen, S.; Hasanien, H.M.; Al-Durra, A. Transient stability enhancement of wind farms connected to a multi-machine power system by using an adaptive ANN-controlled SMES. Energy Convers. Manag. 2014, 78, 412–420. [Google Scholar] [CrossRef] [Green Version]
  55. Dong, Q.; Xing, K.; Zhang, H. Artificial neural network for assessment of energy consumption and cost for cross laminated timber office building in severe cold regions. Sustainability 2018, 10, 84. [Google Scholar] [CrossRef] [Green Version]
  56. Beyca, O.F.; Ervural, B.C.; Tatoglu, E.; Ozuyar, P.G.; Zaim, S. Using machine learning tools for forecasting natural gas consumption in the province of Istanbul. ENergy Econ. 2019, 80, 937–949. [Google Scholar] [CrossRef]
  57. Paluszek, M.; Thomas, S. Practical MATLAB Deep Learning: A Project-Based Approach; Apress: New York, NY, USA, 2020. [Google Scholar]
  58. Poznyak, T.I.; Chairez Oria, I.; Poznyak, A.S. Chapter3-Background on dynamic neural networks. In Ozonation and Biodegradation in Environmental Engineering; Poznyak, T.I., Chairez Oria, I., Poznyak, A.S., Eds.; Elsevier: Amsterdam, The Netherlands, 2019; pp. 57–74. [Google Scholar] [CrossRef]
  59. Haouraji, C.; Boujnah, M.; Farchi, A.; Mounir, I. Forecast of Electrical Energy Consumption in Residential Sector of Morocco. In Proceedings of the 2017 International Renewable and Sustainable Energy Conference (IRSEC), Tangier, Morocco, 4–7 December 2017; pp. 1–6. [Google Scholar]
  60. Biswas, M.R.; Robinson, M.D.; Fumo, N. Prediction of residential building energy consumption: A neural network approach. Energy 2016, 117, 84–92. [Google Scholar] [CrossRef]
  61. Safa, M.; Safa, M.; Allen, J.; Shahi, A.; Haas, C.T. Improving sustainable office building operation by using historical data and linear models to predict energy usage. Sustain. Cities Soc. 2017, 29, 107–117. [Google Scholar] [CrossRef]
  62. Ekonomou, L. Greek long-term energy consumption prediction using artificial neural networks. Energy 2010, 35, 512–517. [Google Scholar] [CrossRef] [Green Version]
  63. Ardakani, S.R.; Hossein, S.M.; Aslani, A. Statistical approaches to forecasting domestic energy consumption and assessing determinants: The case of Nordic countries. Strateg. Plan. Energy Environ. 2018, 38, 26–71. [Google Scholar] [CrossRef]
  64. Yin, Z.; Jia, B.; Wu, S.; Dai, J.; Tang, D. Comprehensive forecast of urban water-energy demand based on a neural network model. Water 2018, 10, 385. [Google Scholar] [CrossRef] [Green Version]
  65. Szoplik, J. Forecasting of natural gas consumption with artificial neural networks. Energy 2015, 85, 208–220. [Google Scholar] [CrossRef]
  66. Chae, Y.T.; Horesh, R.; Hwang, Y.; Lee, Y.M. Artificial neural network model for forecasting sub-hourly electricity usage in commercial buildings. Energy Build. 2016, 111, 184–194. [Google Scholar] [CrossRef]
  67. Protić, M.; Fathurrahman, F.; Raos, M. Modelling energy consumption of the republic of Serbia using linear regression and artificial neural network technique. Tehnički Vjesn. 2019, 26, 135–141. [Google Scholar]
  68. Abdollahpour, S.; Mansouri, E.; Khadivzadeh, T. A Comparative Review of the Relationship between Fertility Rate and Gender Equality. Women Health Bull. 2020, 7, 1–8. [Google Scholar]
  69. Hosseini, S.E.; Andwari, A.M.; Wahid, M.A.; Bagheri, G. A review on green energy potentials in Iran. Renew. Sustain. Energy Rev. 2013, 27, 533–545. [Google Scholar] [CrossRef]
  70. Mwai, A.M. The Relationship between Macroeconomic Variables and Share Prices of Companies Listed at the Nairobi Securities Exchange. Ph.D. Thesis, University of Nairobi, Nairobi, Kenya, 2013. [Google Scholar]
  71. Gharehgozli, O. An estimation of the economic cost of recent sanctions on Iran using the synthetic control method. Econ. Lett. 2017, 157, 141–144. [Google Scholar] [CrossRef]
  72. Hafeznia, H.; Pourfayaz, F.; Maleki, A. An assessment of Iran’s natural gas potential for transition toward low-carbon economy. Renew. Sustain. Energy Rev. 2017, 79, 71–81. [Google Scholar] [CrossRef]
  73. Moshiri, S. Energy price reform and energy efficiency in Iran. In IAEE Energy Forum; 2013; pp. 33–37. Available online: https://papers.ssrn.com/sol3/papers.cfm?abstract_id=2335755 (accessed on 7 July 2020).
  74. Vahl, F.P.; Casarotto Filho, N. Energy transition and path creation for natural gas in the Brazilian electricity mix. J. Clean. Prod. 2015, 86, 221–229. [Google Scholar] [CrossRef]
  75. Verbič, M.; Filipović, S.; Radovanović, M. Electricity prices and energy intensity in Europe. Util. Policy 2017, 47, 58–68. [Google Scholar] [CrossRef]
  76. Mohammadnejad, M.; Ghazvini, M.; Mahlia, T.; Andriyana, A. A review on energy scenario and sustainable energy in Iran. Renew. Sustain. Energy Rev. 2011, 15, 4652–4658. [Google Scholar] [CrossRef]
  77. Gorjian, S.; Zadeh, B.N.; Eltrop, L.; Shamshiri, R.R.; Amanlou, Y. Solar photovoltaic power generation in Iran: Development, policies, and barriers. Renew. Sustain. Energy Rev. 2019, 106, 110–123. [Google Scholar] [CrossRef]
  78. IRENA. Data & Statistics. Available online: https://www.irena.org/Statistics (accessed on 7 July 2020).
  79. Zelterman, D. Multivariable Linear Regression. In Applied Multivariate Statistics with R; Springer: Berlin/Heidelberg, Germany, 2015; pp. 231–256. [Google Scholar]
  80. Braun, M.; Altan, H.; Beck, S. Using regression analysis to predict the future energy consumption of a supermarket in the UK. Appl. Energy 2014, 130, 305–313. [Google Scholar] [CrossRef] [Green Version]
  81. Fumo, N.; Biswas, M.R. Regression analysis for prediction of residential energy consumption. Renew. Sustain. Energy Rev. 2015, 47, 332–343. [Google Scholar] [CrossRef]
  82. Benoit, K. Linear regression models with logarithmic transformations. Lond. Sch. Econ. Lond. 2011, 22, 23–36. [Google Scholar]
  83. Jain, V.; Chaudhary, G.; Taplamacioglu, M.C.; Agarwal, M. Advances in Data Sciences, Security and Applications: Proceedings of ICDSSA 2019; Springer: Berlin, Germany, 2019; Volume 612. [Google Scholar]
  84. Redell, N. Shapley Decomposition of R-Squared in Machine Learning Models. arXiv 2019, arXiv:1908.09718. [Google Scholar]
  85. Nazari, H.; Kazemi, A.; Hashemi, M.H.; Sadat, M.M.; Nazari, M. Evaluating the performance of genetic and particle swarm optimization algorithms to select an appropriate scenario for forecasting energy demand using economic indicators: Residential and commercial sectors of Iran. Int. J. Energy Environ. Eng. 2015, 6, 345–355. [Google Scholar] [CrossRef] [Green Version]
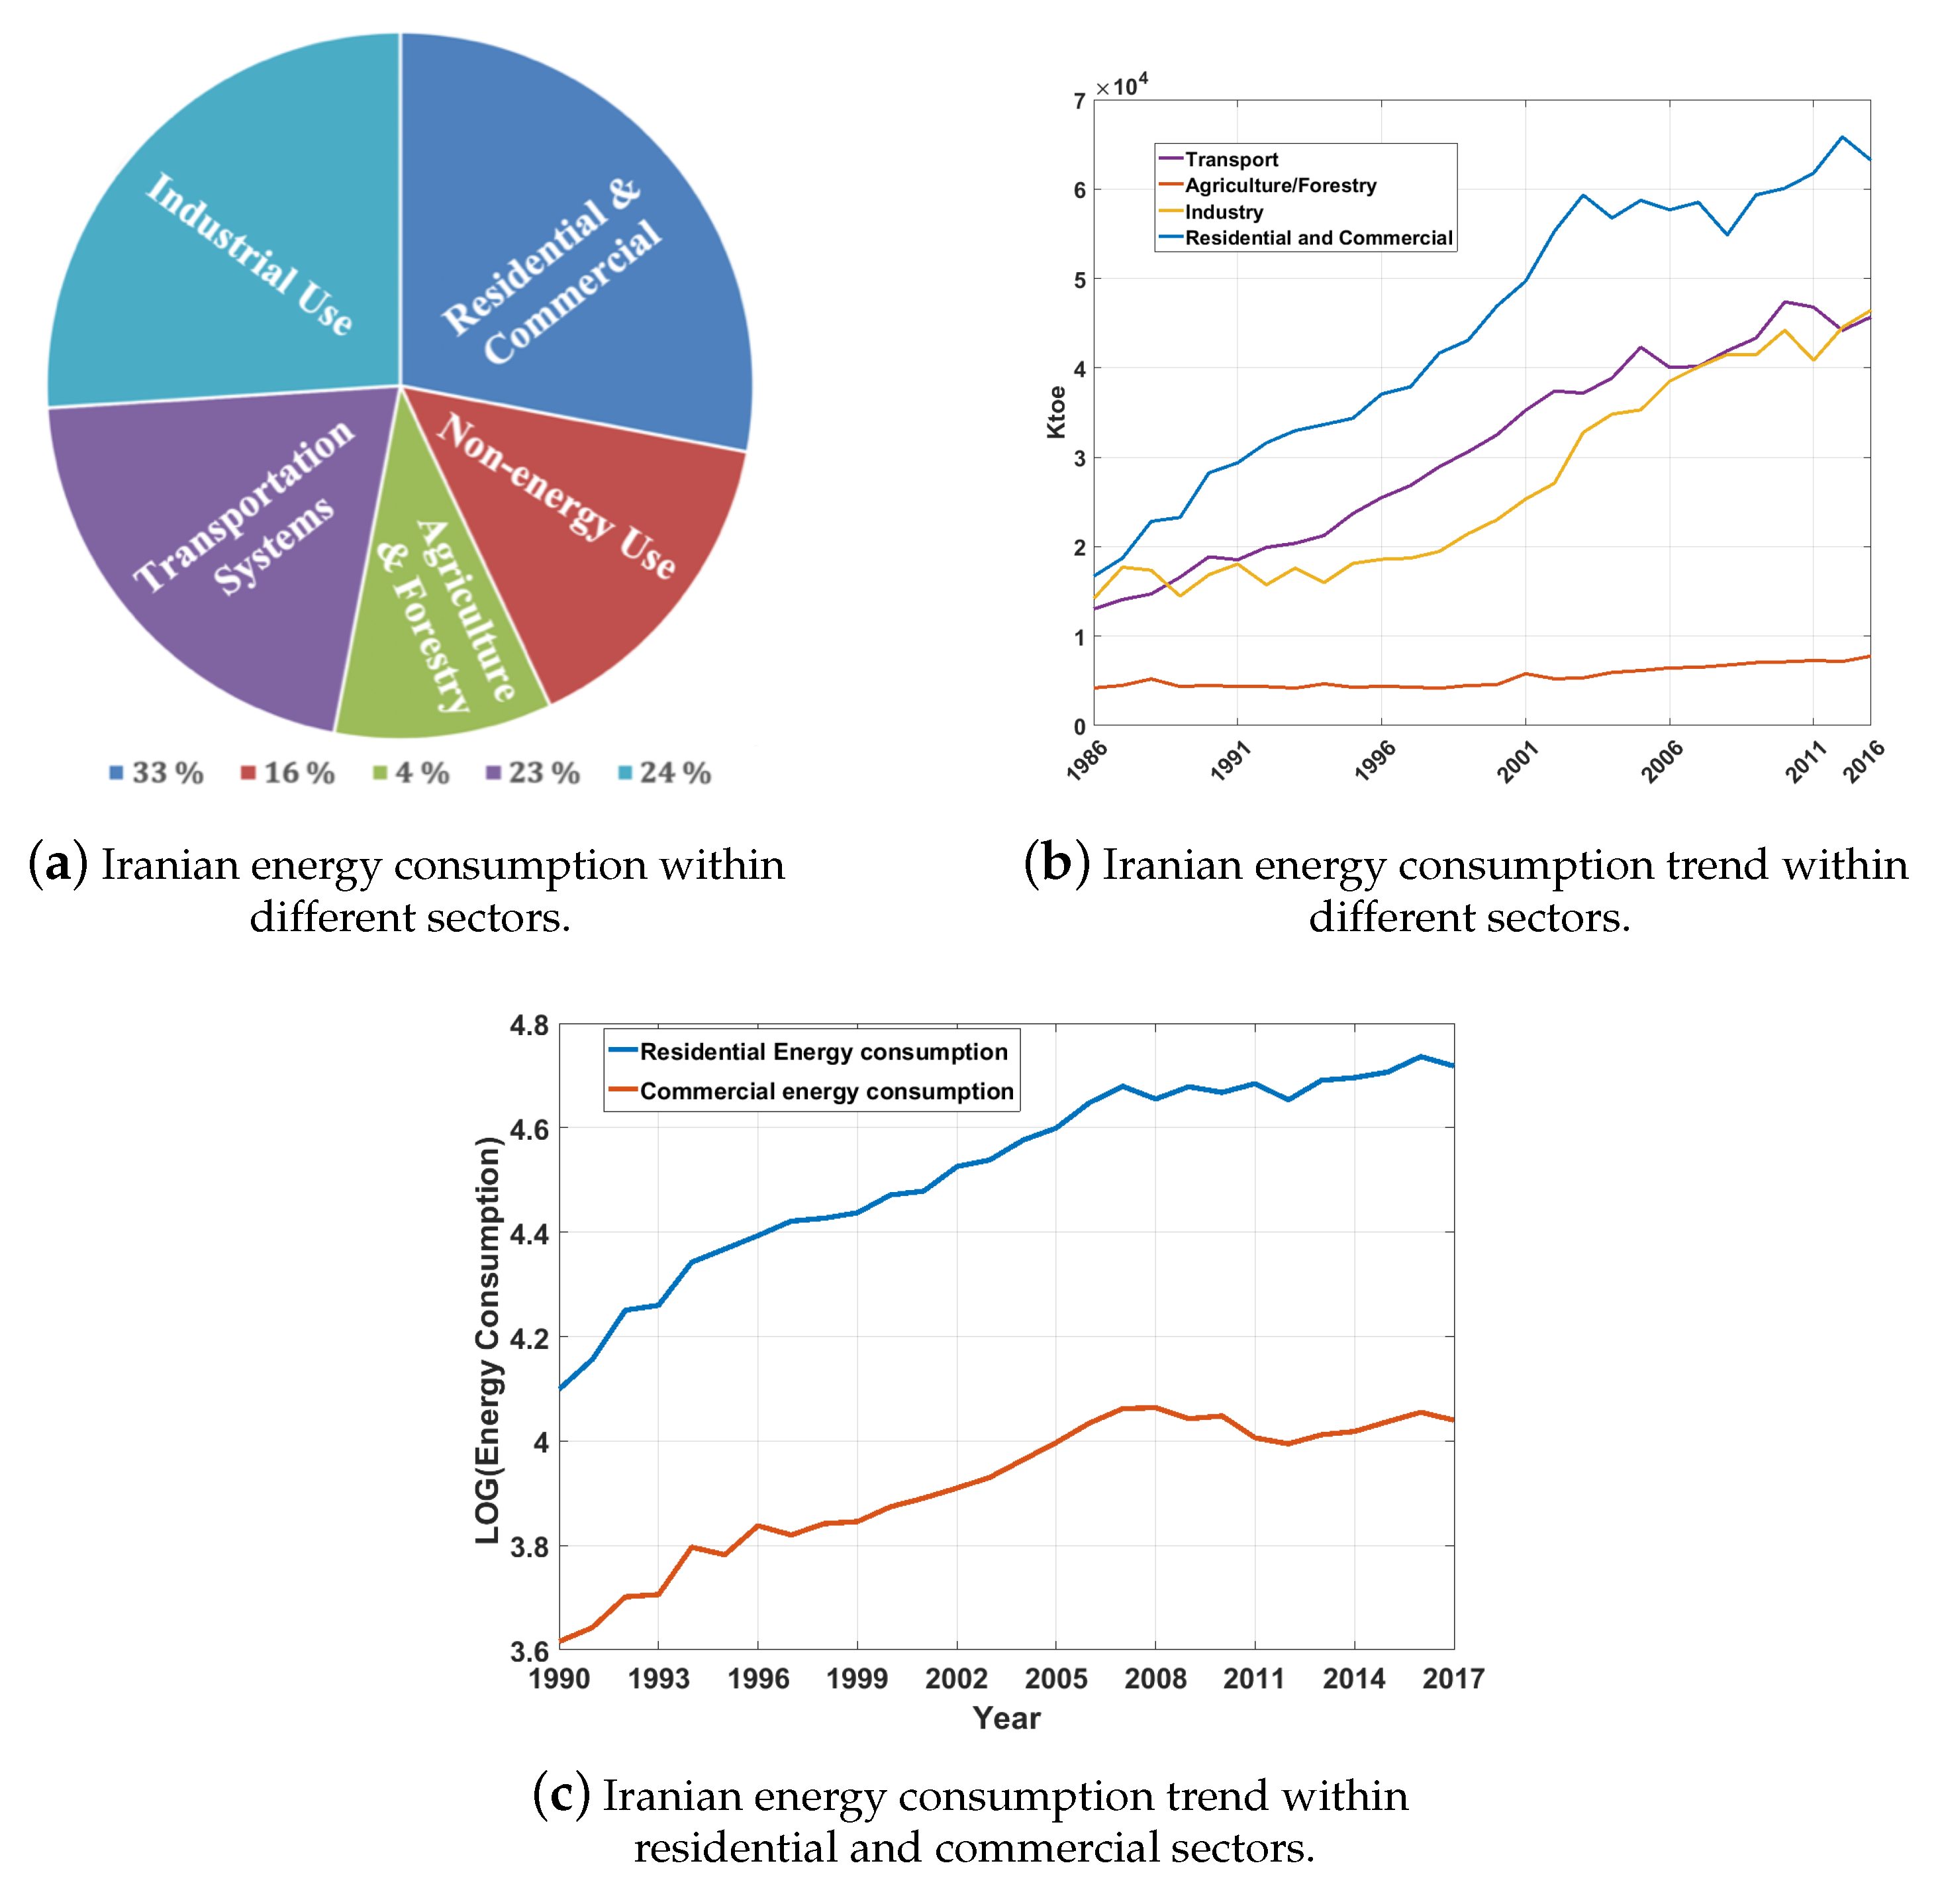
Figure 1. Energy consumption in Iran [6].
Energies 13 05171 g001
Figure 2. Artificial neural network classification.
Energies 13 05171 g002
Figure 3. Our approach for forecasting residential and commercial energy consumption.
Energies 13 05171 g003
Figure 4. Population and GDP trends in Iran.
Energies 13 05171 g004
Figure 5. Natural gas price trends.
Energies 13 05171 g005
Figure 6. Natural gas consumption in Iran by sector.
Energies 13 05171 g006
Figure 7. Iranian electricity price prediction and time series.
Energies 13 05171 g007
Figure 8. Iranian RESH prediction and RE capacity trend.
Energies 13 05171 g008
Figure 9. Model development chart.
Energies 13 05171 g009
Figure 10. NARX ANN structure.
Energies 13 05171 g010
Figure 11. Iranian RCEC prediction by 2040.
Energies 13 05171 g011
Figure 12. NARX error histogram and performance.
Energies 13 05171 g012
Figure 13. Regression diagram NARX.
Energies 13 05171 g013
Figure 14. Models evaluation and RCEC forecasting.
Energies 13 05171 g014
Table 1. Natural gas price and estimated natural gas price according to inflation rate.
YearNGPInflation RateNGP According to Inflation Rate
1991 4.6 20.7 4.6
19936 22.9 7.03
1995 14.9 49.4 14.205
199730 17.3 20.528
1999 43.2 20.1 29.117
2001 49.1 11.4 36.524
2003 60.6 15.6 48.893
2005 68.7 10.4 62.182
2007 98.2 18.4 82.385
2009 104.5 10.8 114.469
2011950 21.5 156.326
20131050 34.7 274.795
20151311 11.9 355.466
201615789 387.458
Table 2. MLR coefficients.
β 0 β 1 β 2 β 3 β 4 β 5
Value 34.4876 0.8241 5.7328 × 10 11 0.0117 0.0427 1.1572
VariableconstantPOPGDPNGPEPRESH
Table 3. LMLR coefficients.
β 0 β 1 β 2 β 3 β 4 β 5
Value 13.5287 2.066 0.3141 0.1077 0.1810 0.1781
VariableconstantPOPGDPNGPEPRESH
Table 4. Evaluation of RCEC prediction by MLR, LMLR and NARX.
Year/MtoeMLRLMLRNARXObserved Value
2011 62.34 60.79 59.17 58.8
2012 56.71 56.67 58.006 55.5
2013 53.5 55.88 59.89 59.9
2014 58.06 60.11 62.07 60.7
2015 63.11 64.32 62.9 62.2
2016 66.2 67.39 64.57 65.8
2017 69.077 70.39 65.6 63.4
MSE 0.476 0.3755 0.149
RMSE 0.783 0.761 0.495
MAPE 4.34 3.38 1.87
Table 5. Comparison of methods.
MethodR 2 MSE
LMLR 0.9907 0.0078
MLR 0.9727 13.63
NARX 0.99902 0.002652
Table 6. Comparison of previous studies in RCEC prediction and present study.
MethodMAPE(%)Source
GA-DEM linear 3.25  [85]
GA-DEM exponential 2.68  [85]
ARMAX 3.95  [19]
Logarithmic ARMAX 5.97  [19]
NARX 1.87 Present study
LMLR 3.38 Present study
MLR 4.34 Present study