Article

Multi-Objective Optimization of Gas Pipeline Networks

by
Andrzej J. Osiadacz
1,* and
Niccolo Isoli
2
1
Department of Building Installations, Hydrotechnics and Environmental Engineering, Warsaw University of Technology, 20, Nowowiejska Street, 00-653 Warsaw, Poland
2
Fluid Systems Ltd. 43, Opaczewska Street, room 13, 02-201 Warsaw, Poland
*
Author to whom correspondence should be addressed.
Energies 2020, 13(19), 5141; https://doi.org/10.3390/en13195141
Submission received: 18 July 2020 / Revised: 8 September 2020 / Accepted: 29 September 2020 / Published: 2 October 2020

Abstract

:
The main goal of this paper is to prove that bi-objective optimization of high-pressure gas networks ensures grater system efficiency than scalar optimization. The proposed algorithm searches for a trade-off between minimization of the running costs of compressors and maximization of gas networks capacity (security of gas supply to customers). The bi-criteria algorithm was developed using a gradient projection method to solve the nonlinear constrained optimization problem, and a hierarchical vector optimization method. To prove the correctness of the algorithm, three existing networks have been solved. A comparison between the scalar optimization and bi-criteria optimization results confirmed the advantages of the bi-criteria optimization approach.

1. Introduction

The introduction of a Third Party Access (TPA) regime has been a central element of liberalization of the gas industry. The objective is to foster competition in the gas market, improve supply efficiency and bolster infrastructural investments, thereby strengthening energy security. However, TPA provisions have a game-changing impact on the gas supply market by introducing competition, breaking the incumbent’s monopoly, lowering prices and adding complexities to service provision by the system operator. The main responsibility of the gas network operator is to maintain safe and efficient operation of the gas supply system in real time and to ensure security of supplies in the short, medium and long term. Operation optimization of natural gas pipelines has received increasing attentions due to such advantages as maximizing the operating economic benefit and the gas delivery amount.
This paper is concerned with the high-pressure gas networks under steady-state conditions. If we assume that the goal is to minimize the operational costs, then the steady-state optimization algorithm determines the pressure values in the network nodes, flow values in the pipes, flows in the compressor stations and the compression ratio of compressor stations, minimizing the objective function.
Different methods are proposed in the literature to solve the problem of this nature. In particular, non-linear models are applied because non-linearities can be represented in their original form. In [1] mixed integer non-linear programming is used to tackle the steady-state case; In [2] sequential linear programming is employed to study the behaviour of an integrated gas and power system. In [3] mixed integer linear programming is applied for the steady-state optimization of gas flows. Nowadays, it is possible to state that mixed integer linear programming techniques are mature because they are fast, robust, and are able to solve problems with up to hundreds of thousands of variables [4].
Several locally mixed integer linear programming formulations used to piecewise linearize a non-linear function have been proposed in the literature. A unified framework can be found in [5].
It should be noted that the gas network control is a complex process which can be operated on the basis of various criteria. The criteria are formulated by the network operator and depend primarily on the operating conditions of the network, structure of the network, its hydraulic properties and type of consumers. Under certain conditions, scalar optimization is sufficient to satisfy the operator requirement while in other cases one should look for compromise solutions, which are optimization problems with an objective function in the form of vector.
Solving the single objective optimization problems is far more common than solving the multi-objective problems, since there appears to be no generally effective and efficient method available for solving the multi-objective problems directly as they are. Typically, a multi-objective problem is to be effectively converted to a single objective problem before applying an optimization algorithm. This conversion can be done easily by first deciding the relative importance for each objective a priori. Then, for example, the decision-maker may combine the individual objective functions into a scalar cost function (linear or non-linear combination), which effectively converts a multi-objective problem into a single objective one.
Nonetheless, there are more and more papers in which the task of gas transmission system optimization is formulated as a multi-criteria task.
In [6] a bi-criteria optimization algorithm is formulated (running cost and maximum capacity) to solve a simple structure of the network, assuming a steady-state flow.
In [7] an algorithm for the optimization of design and operation of a gas transmission system is employed. The objective function consists of two components: one describes the costs of construction and operation of pipelines while the other specifies the costs of construction and operation of the compressor station. The problem was solved using mixed non-linear programming
In [8] an algorithm for investment and operational costs minimization of a high-pressure gas network is applied. The mixed integer non-linear programming was used to find optimal suction and discharge pressures of a fixed number of compressor stations, as well as the length and the diameter of the pipeline segments. The optimization goal was to minimize the annual costs, assuming 10-year investment depreciation. The main disadvantage of this algorithm is the assumption that pipeline diameters are treated as continuous variables.
In the paper by [9], a multi-objective ant colony optimization technique for pipeline optimization has been developed to solve the multi-objective gas pipeline transportation problem. The multi-objective problem considered is about minimizing fuel consumption in the compressors and maximizing the throughput.
In [10] a multi-objective optimization method to trade-off reliability and power demand in the decision-making process is developed. In the optimization, the steady-state behaviour of the natural gas pipeline networks is considered, but the uncertainties of the supply conditions and the customer consumptions are accounted for. The multi-objective optimization is about finding the operational strategies which minimize power demand and the risk of gas supply shortage.
In [11] three objective functions to simultaneously optimize: minimizing the fuel consumption in the compressor stations, maximizing the network throughput and maximizing the percentage of added hydrogen at the network entrance is employed. The NSGA-IIb genetic algorithm coupled with a Newton–Raphson procedure of the MATLAB toolbox (MathWorks, Inc., Natick, MA, USA) is implemented.
In [12] the short- and medium-term planning problems of the regimes of multi-line technical gas pipeline corridors (MLGP) of the Russian gas supply system is considered. The fall in gas production caused by depleted gas fields leads to a decrease in the load of some operating MLGPs.
The purpose of this article is to develop and test mathematical models and a computer program in order to support the adoption of dispatch solutions for managing modes of large MLGPs under conditions of incomplete loading.
The paper by [13] addresses the Line Pack Management of the “GZ1 Hassi R’mell-Arzew” gas pipeline. For a gas pipeline system, the decision-making on the gas line pack management scenarios usually involves a delicate balance between minimizing fuel consumption in the compression stations and maximizing the gas line pack. In order to select an acceptable Line Pack Management of Gas Pipeline scenario from these two angles for “GZ1 Hassi R’mell-Arzew” gas pipeline, the idea of multi-objective decision-making has been introduced.
Pipeline failures due to natural disasters, corrosion and manufacturing defects have generated a tremendous economic loss. To recover efficiently from the disruption with a minimum loss, [14] propose a multi-objective optimization model that minimizes both the loss from disruption and recovery time. Recovery on disrupted pipelines may incur an additional recovery cost but, on the other hand, it can alleviate the cost of unmet demand. Considering the gas production and transmission costs, we use multi-objective optimization to study the recovery decisions in a pipeline network.
The paper by [15] proposes the multi-objective optimization of the design of natural gas transmission networks to support the decision of regulatory authorities. Problem formulation involves two objective functions: minimization of the transportation fare and maximization of the transported gas volume. These design parameters of the pipeline project must be previously established by the regulatory agency, considering an attractive return on investment for the entrepreneurs and the demands of current and future consumers.

2. Bi-Criteria-Objective Function

In our case, the objective function is formulated in the following form:
f ( x _ ) = α 1 f 1 ( x _ ) + α 2 f 2 ( x _ )
where:
  • f1(x)—objective function for running cost;
  • f2(x)—objective function for gas line pack;
  • xT = [pt1, pt1,…, ptk]—vector of discharge pressure;
  • α1, α2—weighting factors (α1 + α2 = 1) indicating relative significance of the objective functions.
The first part of this function, which expresses the running cost of the compressors, should be minimized (minimization of the operating costs), and the second part, which expresses the line pack, should be maximized (ensuring delivery security). In order to establish a relationship between the two functions, weighting factors were used. In this case study, it was assumed that both functions are equally important for the user, therefore the weighting coefficients are equal to 0.5. Weights must be constant and must be functions of the original objectives. The values of the weighting factors are arbitrarily chosen by the user (transmission system operator). Depending on the hydraulic properties of the system, the capacity, the structure, the number of compressor stations and on the amount of the transported gas, the operator decides what is more important: the running cost of the compressor stations or security of gas supply.
The elements of vector x are discharge pressure values of the working compressor stations. Determining components of the x vector, which will minimize the formulated objective function is the solution to the bi-criteria optimization problem. This involves finding such discharge pressure values for each compressor station which will ensure that the operational costs of the transmission system will be a compromise between maximizing line pack costs and minimizing running costs.
Minimizing the running costs of the transmission system is equivalent to minimizing power consumption in the compressor stations. The total power consumption in the system is expressed by Equation (2):
f 1 ( x _ ) = i = 1 k N i = i = 1 k n · p a · Q s ,   i · Z s ,   i · T s η · 3600 · ( n 1 ) · T a · [ ( p d ,   i p s ,   i ) ( n 1 n ) 1 ]            [ W ]
where:
  • Ni—power consumption for the i-th compressor station [W];
  • n—isentropa exponent;
  • pa—absolute pressure [Pa];
  • Qs—volumetric gas flow through the i-th compressor station at standard conditions [m3/h];
  • Zs—gas compressibility factor for the suction [-];
  • Ts—temperature for the suction [K];
  • Ta—absolute temperature [K];
  • η—adiabatic efficiency;
  • pd,i—discharge pressure for the i-th compressor station [Pa];
  • ps,i—suction pressure in for the i-th compressor station [Pa];
  • k—number of switch-on compressor stations in the system [-].
The second part of the objective function relates to gas line pack in the network. Total gas volume in the network as a function of geometrical dimensions of the pipelines, and gas parameters can be expressed by the following Equation (3):
V = i = 1 m π 4 · T a p a · ( p av ,   i Z i · T ) · D i 2 · L i            [ m 3 ]
p av = 2 3 ( p x + p y 2 p x + p y )            [ Pa ]
where:
  • V—volume of gas in the network [m3];
  • pav,i—average pressure in the i-th pipeline [Pa];
  • px—pressure at the sending node of the pipeline [Pa];
  • py—pressure at the receiving node of the pipeline [Pa];
  • Zi—gas compressibility factor for the i-th pipeline [-];
  • T—gas temperature in the pipeline [K];
  • Di—internal diameter of the i-th pipeline [m];
  • Li—length of the i-th pipeline [m];
  • m—number of pipelines in the system [-].
In order to compare the power consumption as a result of running cost minimization with power consumption as a result of line pack maximization, the second term of objective function was expressed by Equation (5):
f 2 ( x _ ) = N s = i = 1 m Q v ,   i · Δ p i            [ W ]
where:
  • Ns—power loss corresponding to given flow parameters [W],
  • Qv,i—volumetric gas flow through the i-th pipeline at real conditions [m3/s],
  • Δ p i —pressure drop for the i-th pipeline [Pa].
The results of calculations (see Table 1) have shown that the greater line pack in the network, the higher operational costs of the compressor station. Calculations were made on the pipeline with an internal diameter of 0.7 m and a length of 50 km.
This means that the first part of the objective function is to be minimized and the second part is to be maximized. We are searching for an appropriate discharge pressure values for working compressor stations which will ensure a compromise between these two components.

3. Constraints

For high pressure gas networks, operating above 7.0 Bar-gauge, the Panhandle equation is used. For each pipe k [having node l (k) at its left, and r (k) at its right] the pressure drop equation has the form:
p l ( k ) 2 p r ( k ) 2 = KQ 1 , 854
where:
  • p—pressure;
  • Q—flow through pipe.
K = 18 , 43 L E 2 D 4 , 854
where:
  • L—pipe length;
  • D—pipe diameter;
  • E—pipe efficiency stated as a constant (~0.9).
For the whole of the network, the equality constraints are the following (more details in [16,17]):
A · Q K · F L = 0   ( Kirchhoff s   first   law )
Δ P + A T · P = 0   ( Kirchhoff s   sec ond   law )
Δ P = K f T · Q   ( flow   equation )
where:
  • A—the nodal-branch incidence matrix (dim A = n × m);
  • n—the number of nodes;
  • m—the number of branches;
  • P—the vector of squared nodal pressures (dim P = n × 1);
  • K—the unit - nodal incidence matrix (dim K = n × r);
  • r—the number of units;
  • F—the vector of flows through units (dim F = r × 1);
  • L—the vector of loads;
  • ΔP—the vector of squared drop pressures (dim ΔP = m × 1);
  • Kf—the vector of pipe constants (dim Kf = m × m);
  • Q—the vector of flows through pipes (dim Q = m × 1).

3.1. Operational Constraints

The gas transmission system contains three types of controllable units, referred to as “non-pipe elements”. The upper and lower bounds are placed on all non-pipe element flows, as well as inlet and outlet pressures. These apply only when the non-pipe element is switched on.
In addition, bounds may be placed on any pressure in the network (including outlets and inlets). Sources and regulators are modelled using linear constraints, which are bounds on the pressure and flow. Compressors have both linear and non-linear constraints.

3.1.1. Compressors

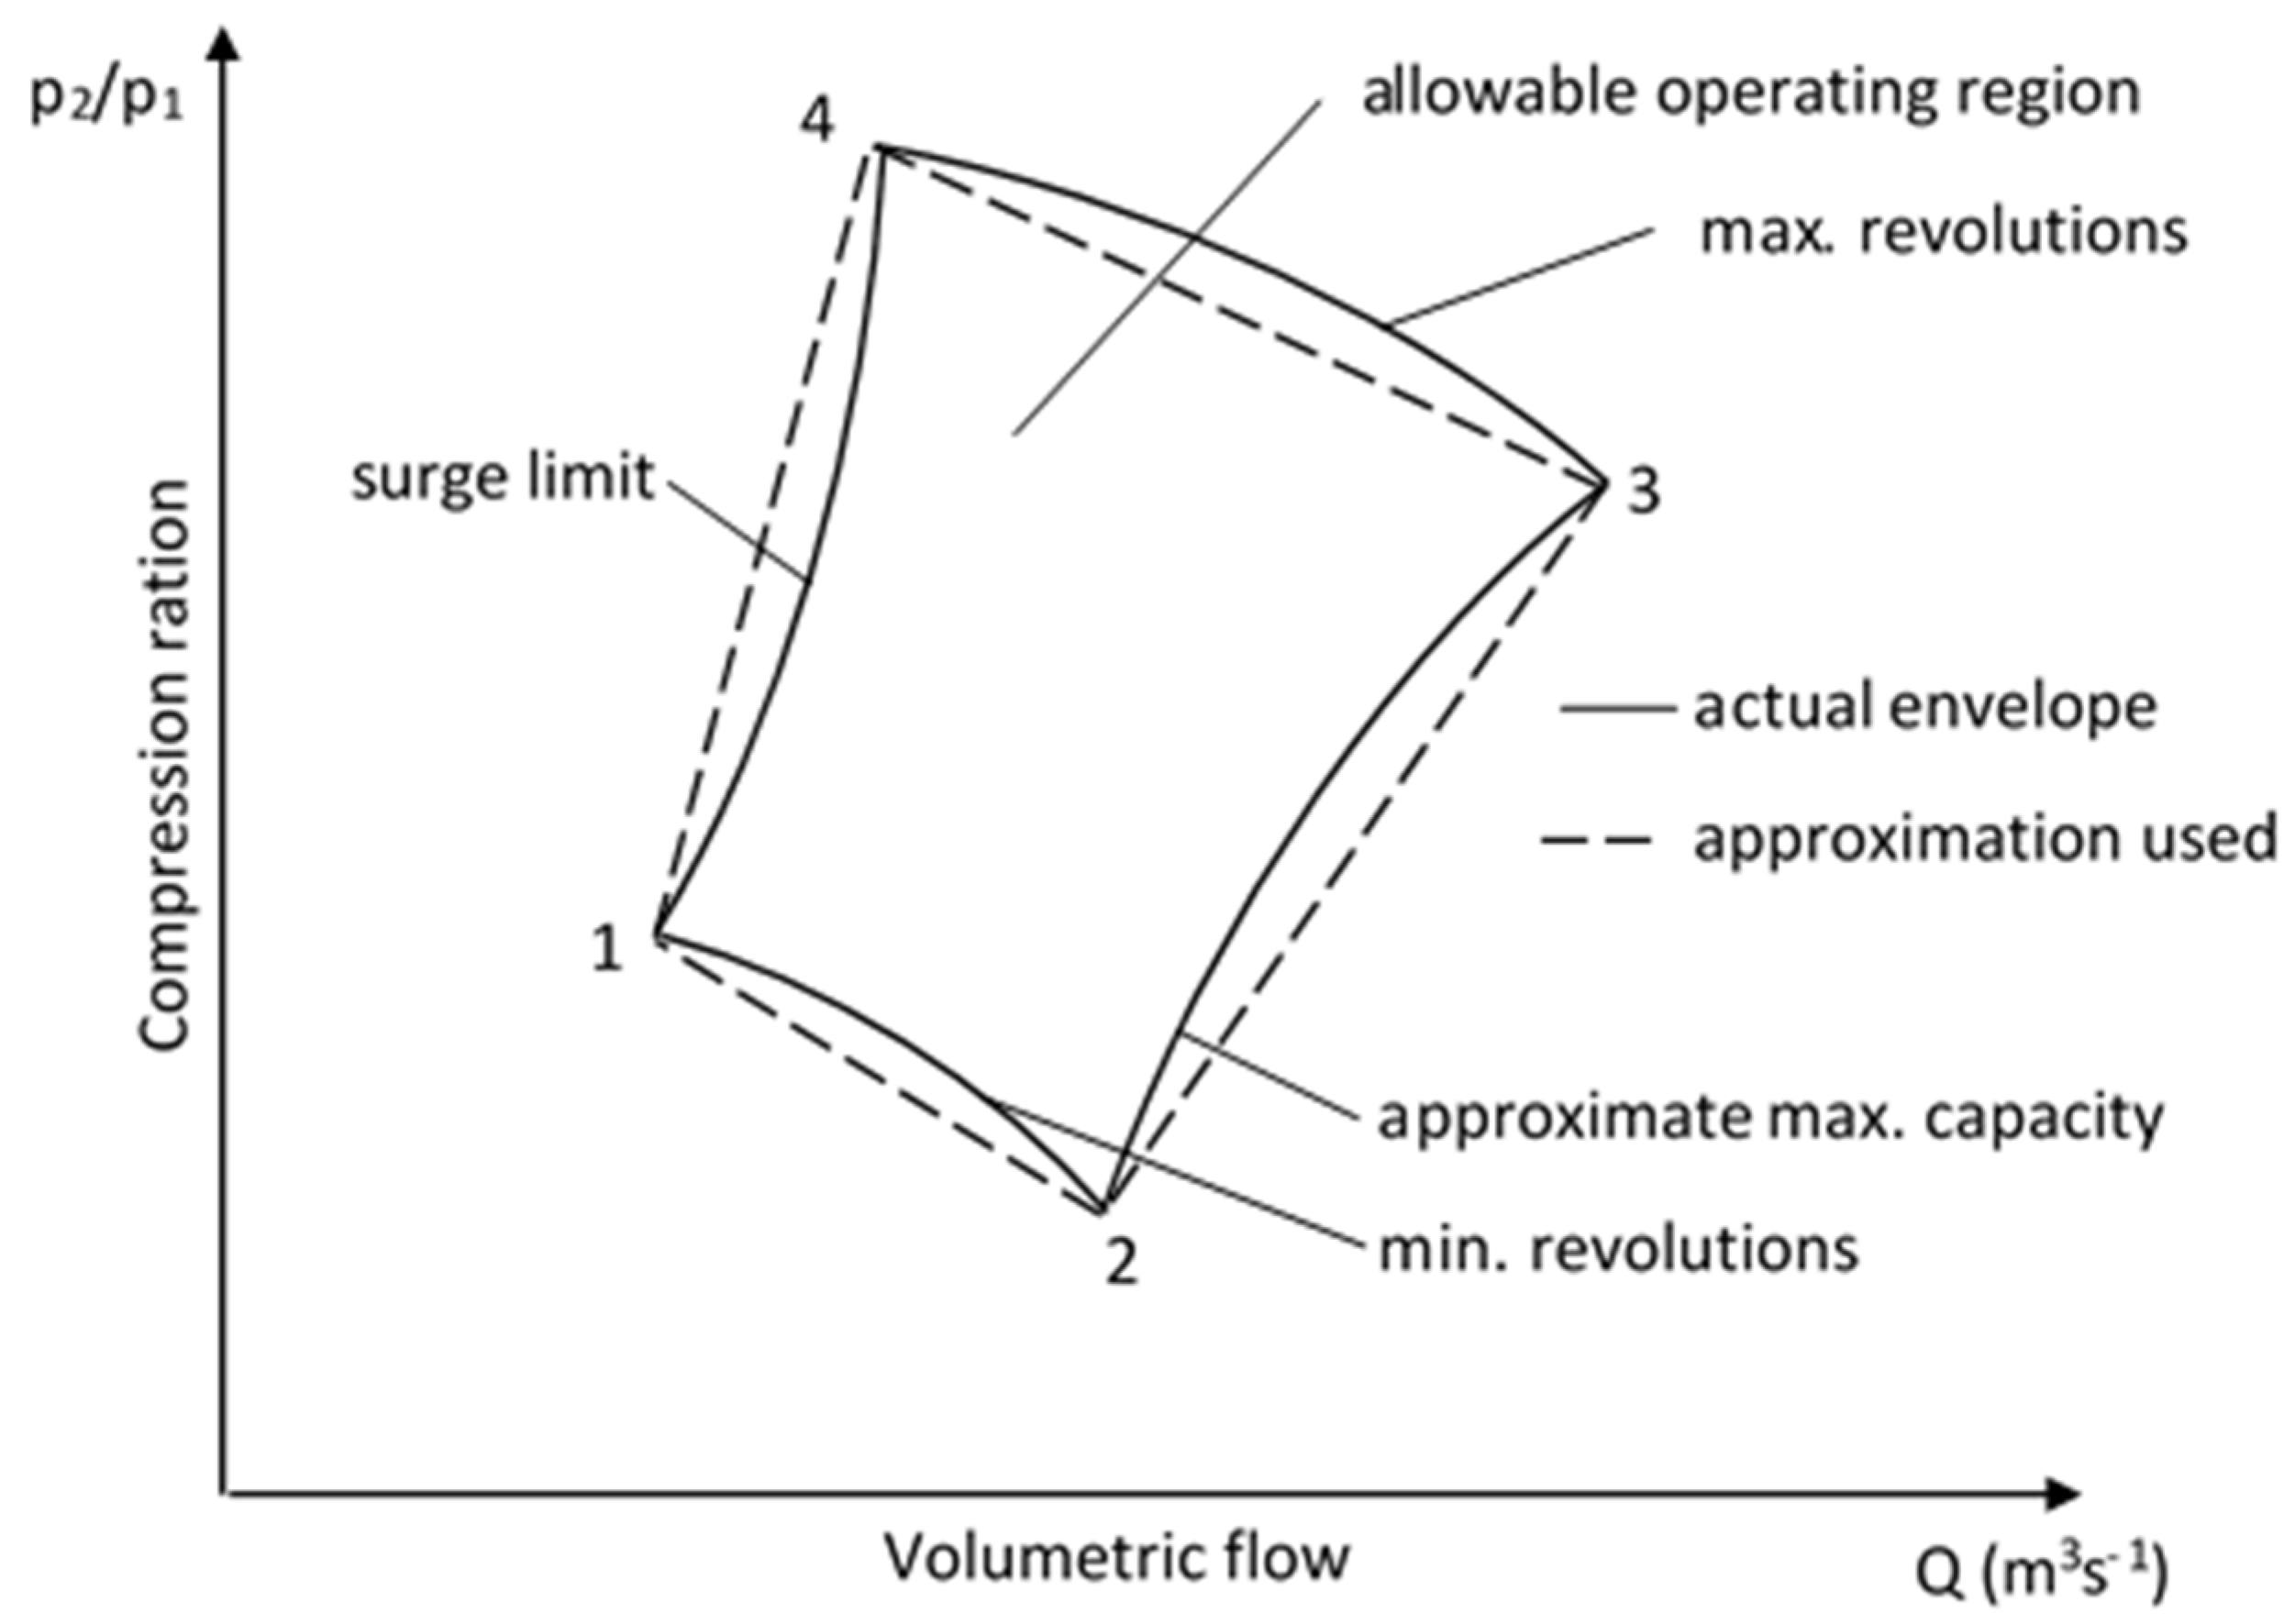
The centrifugal compressors used on the transmission system have specific characteristics. The operating regime can be expressed by what is known as an “envelope” (Figure 1). If the increase in pressure produced by a machine is plotted graphically against the flow, four limits which enclose an area in which the compressor can properly run emerge. The limits are defined as:
  • “surge”: this is the point at which the flow through the compressor becomes so low that a reversal of flow can occur, which can be damaging to the compressor by causing high stress in the bearings or in the impeller;
  • “choke”: at the opposite end of the diagram, a compressor can reach choke. When the pressure ratio is low, there comes a point at which no further increase in the flow through the compressor is possible;
  • “maximum and minimum speed”: obviously a compressor can run up to a given maximum speed consistent with machine safety, and equally there is a minimum speed line.
The surge line is formulated by the inequality:
a 1 · Q 2 b 1 · Q + 1 p d p s
where:
  • Q—the flow through compressor (m3/h) and a1, b1 are specified coefficients.
The choking line is formulated by the inequality:
a 2 · Q 2 b 2 · Q + 1 p d p s
By construction, compressors have a maximum and a minimum speed limit. Operating beyond this upper limit may result in damaging the compressor. On the other hand, an unacceptable efficiency occurs while operating below the lower limit. These constraints are formulated by the inequality:
RPMAX a + b 1 Q + c p d p s d ( p d p s ) 2 e ( p d p s ) Q RPMIN
where:
  • RPMAX—maximum speed (R.P.M.);
  • RPMIN—minimum speed (R.P.M.);
  • a, b, c, d, e—coefficients.
For the purpose of the developed algorithm, non-linear constraints of the envelope have been linearized [18,19]. Linearization is obtained in the form of a convex quadrangle describing the operative envelope from the outside. The latter is transformed to a set of linear inequalities in terms of pressure and volumetric flow.
When a converged optimum solution is obtained, the real envelopes are inspected to ensure that no violations are present.
Since all the compressors do not usually have the same characteristics, problems may occur when running different types of compressors at the same time. For instance, in a series arrangement the maximum flow limit through one of the compressors may be lower than for the rest of the compressors, therefore, a flow limit is imposed on those compressors with a higher flow constraint. This is stated by the inequality:
Q max Q
where:
  • Qmax—maximum compressor flow;
  • Q—compressor inlet flow.
For the parallel arrangement, all the pressure ratios have to be equal. Therefore, the compressor with the lowest pressure ratio imposes a limit on the rest of the compressors with a higher pressure ratio. This is stated by the inequality,
C R max p d p s
where:
  • CRmax—maximum compressor ratio.
Finally, the compressors have a maximum power, which should not be exceeded. Developing more power than indicated by the limit may destroy the compressor. The power required by the prime mover is stated by Equation (1).
N N max

3.1.2. Regulators

Flow through regulators is always unidirectional, which is stated by:
p o > p i
where:
  • po—outlet nodal pressure;
  • pi—inlet nodal pressure.
There is an equation which relates inlet-outlet pressure difference with the flow. If, for instance, the maximum drop pressure characteristic is known for a particular regulator, the maximum permissible flow can be obtained through this equation, and vice versa. In our problem, we do not use that equation; instead, we use the maximum flow obtained from that equation. The flow inequality constraint is
Q max Q
where:
  • Qmax—maximum flow through the regulator;
  • Q—actual flow through the regulator.
Finally, the outlet pressure remains constant for any flow rate. This is stated by:
p o = constant

3.1.3. Valves

There are several types of valves, for our purposes only the isolating valves are of interest. These are used to interrupt the flow and to shut off sections of the network. In our problem valves are represented by two inequalities. The first one states that pressure difference is always greater upstream, i.e.,
p o > p i
where:
  • po—outlet pressure;
  • pi—inlet pressure.
There is an equation for valves which relates their flow within the pressure difference throughout the valve. Since the maximum flow through the valve is given by the constructors, we can obtain the maximum pressure difference from the valve equation. Thus, we only need to define one constraint. In our problem, we have chosen the flow inequality:
Q max Q
where:
  • Qmax—maximum flow through the valve;
  • Q—actual flow through the valve.

3.1.4. Compressor Stations

The inequality constraints imposed on each compressor station are as follows:
εmax ≥ ε ≥ εmin
pd ≤ pd max
N ≤ Nmax
Qf ≤ Qmax
where:
  • εmin—minimum ratio [-];
  • εmax—maximum compression ratio [-];
  • ε—compression ratio [-];
  • pd max—maximum discharge pressure [Pa];
  • pd—discharge pressure [Pa];
  • Nmax—maximum power of the compressor station [W];
  • N—compressor station power [W];
  • Qmax—maximum flow through the compressor station [m3/h];
  • Qf—flow through the compressor station [m3/h].

3.1.5. Nodes and Pipelines

Constraints for nodes and pipelines are as follows:
pmax ≥ p ≥ pmin
w ≤ wmax
where:
  • pmin—minimum nodal pressure [Pa];
  • pmax—maximum nodal pressure [Pa];
  • p—pressure value at node [Pa];
  • wmax—maximum gas velocity in the pipeline [m/s];
  • w—gas velocity in the pipeline [m/s].

4. Bi-Criteria Algorithm

To prove the advantages of the bi-criteria method over the scalar method to control the gas transmission system, a comparative analysis using both methods was performed for the same gas structures [20]. An arithmetic average of the optimization results of running cost minimization and line pack maximization calculated using scalar optimization were compared with vector optimization results. The Rosen method was chosen for scalar optimization The Rosen method was also used, together with hierarchical method to develop the bi-criteria algorithm. The choice of methods was based on the literature analysis and our own research.

4.1. Rosen Method

The Rosen’s gradient projection method [21,22,23,24] is an alternative to the Zoutendijk’s method [25]. Both methods are based on the concept of feasible directions. The Zountendijk’s method, however, requires a solution of an auxiliary linear optimization problem to find a usable direction, while the Rosen’s method uses the projection of the negative of the objective function gradient onto the active constraints. The Rosen’s method requires linear constraints. In other words, it is assumed that non-linear constraints have first been linearized at some point in the design space. However, in general, the objective function remains non-linear. The Rosen method is the most common in the group of feasible directions methods due to its effectiveness. The key factor of this method is the direction gradient projection on the surface tangent to the constraints. At the current point, the constraints given by the equation
g j ( x _ )   0 ,    j = 1 , 2 , , m
can be split into two groups:
-
active constraints gj(x) = 0, j = j1, j2, …, jp;
-
non-active constraints gj(x) < 0, j j1, j2, …, jp.
The gradients of the p active constraints are given by:
g j ( x _ ) = [ a 1 j ,   a 2 j , , a nj ] T ,    j = j 1 , j 2 , , j p
dim x = n × 1.
Matrix N(n × p) is given by:
N _ = [ g j 1 ,   g j 2 , , g jp ]
Matrix:
P _ = I _ N _ ( N _ T N _ ) 1 N _ T
is called the projection matrix.
It projects the vector–∇f(x) onto the intersection of all the hyperplanes perpendicular to the vectors ∇g(x).
It is assumed that the constraints which are active are independent so that the columns of the matrix N will be linearly independent and hence (NT N) will be non-singular.
The new iteration point is given by
x _ k + 1 = x _ k + α   S _ k
where:
  • α—is a step length along the search direction Sk.
S _ k = P _ k   f ( x _ k ) P _ k   f ( x _ k )
Solution search is along such a direction S which is periodically updated. This method eliminates the constraints which do not contribute to improving the search direction from the projection matrix.

4.2. Hierarchical Method

A survey of current continuous non-linear multi-objective optimization concepts and methods is presented in [10,26,27,28,29,30,31]. The authors conclude that the selection of a specific method depends on the type of information provided in the problem, the user’s preferences, the solution requirements, and the availability of software. A hierarchical method has been chosen because in this method the objectives are ranked by the user in order of importance. The optimum solution x* is then found by minimizing the objective functions starting with the most important ones and then proceeding according to the order of importance of the objectives. Let the subscripts of the objectives indicate not only the objective function number, but also the priorities of the objectives.
Thus, f1(x) and fk(x) denote the most and least important objective functions, respectively. The first problem is formulated as:
min f 1 ( x _ )
subject to:
g j ( x _ )   0 ,    j = 1 , 2 , , m
and its solution x1 and f1(x1) is obtained.
Then the second problem is formulated as:
min f 2 ( x _ )
subject to:
g j ( x _ )   0 ,    j = 1 , 2 , , m
f 1 ( x 1 _ ) = f 1
This procedure is repeated until all the k objectives have been considered. For the i-th problem we have:
min f i ( x _ )
subject to:
g j ( x _ )   0 ,    j = 1 , 2 , , m
f i ( x _ ) = f i
Finally, the xk solution is taken as the desired x * solution of the multi-objective optimization problem.

5. Results

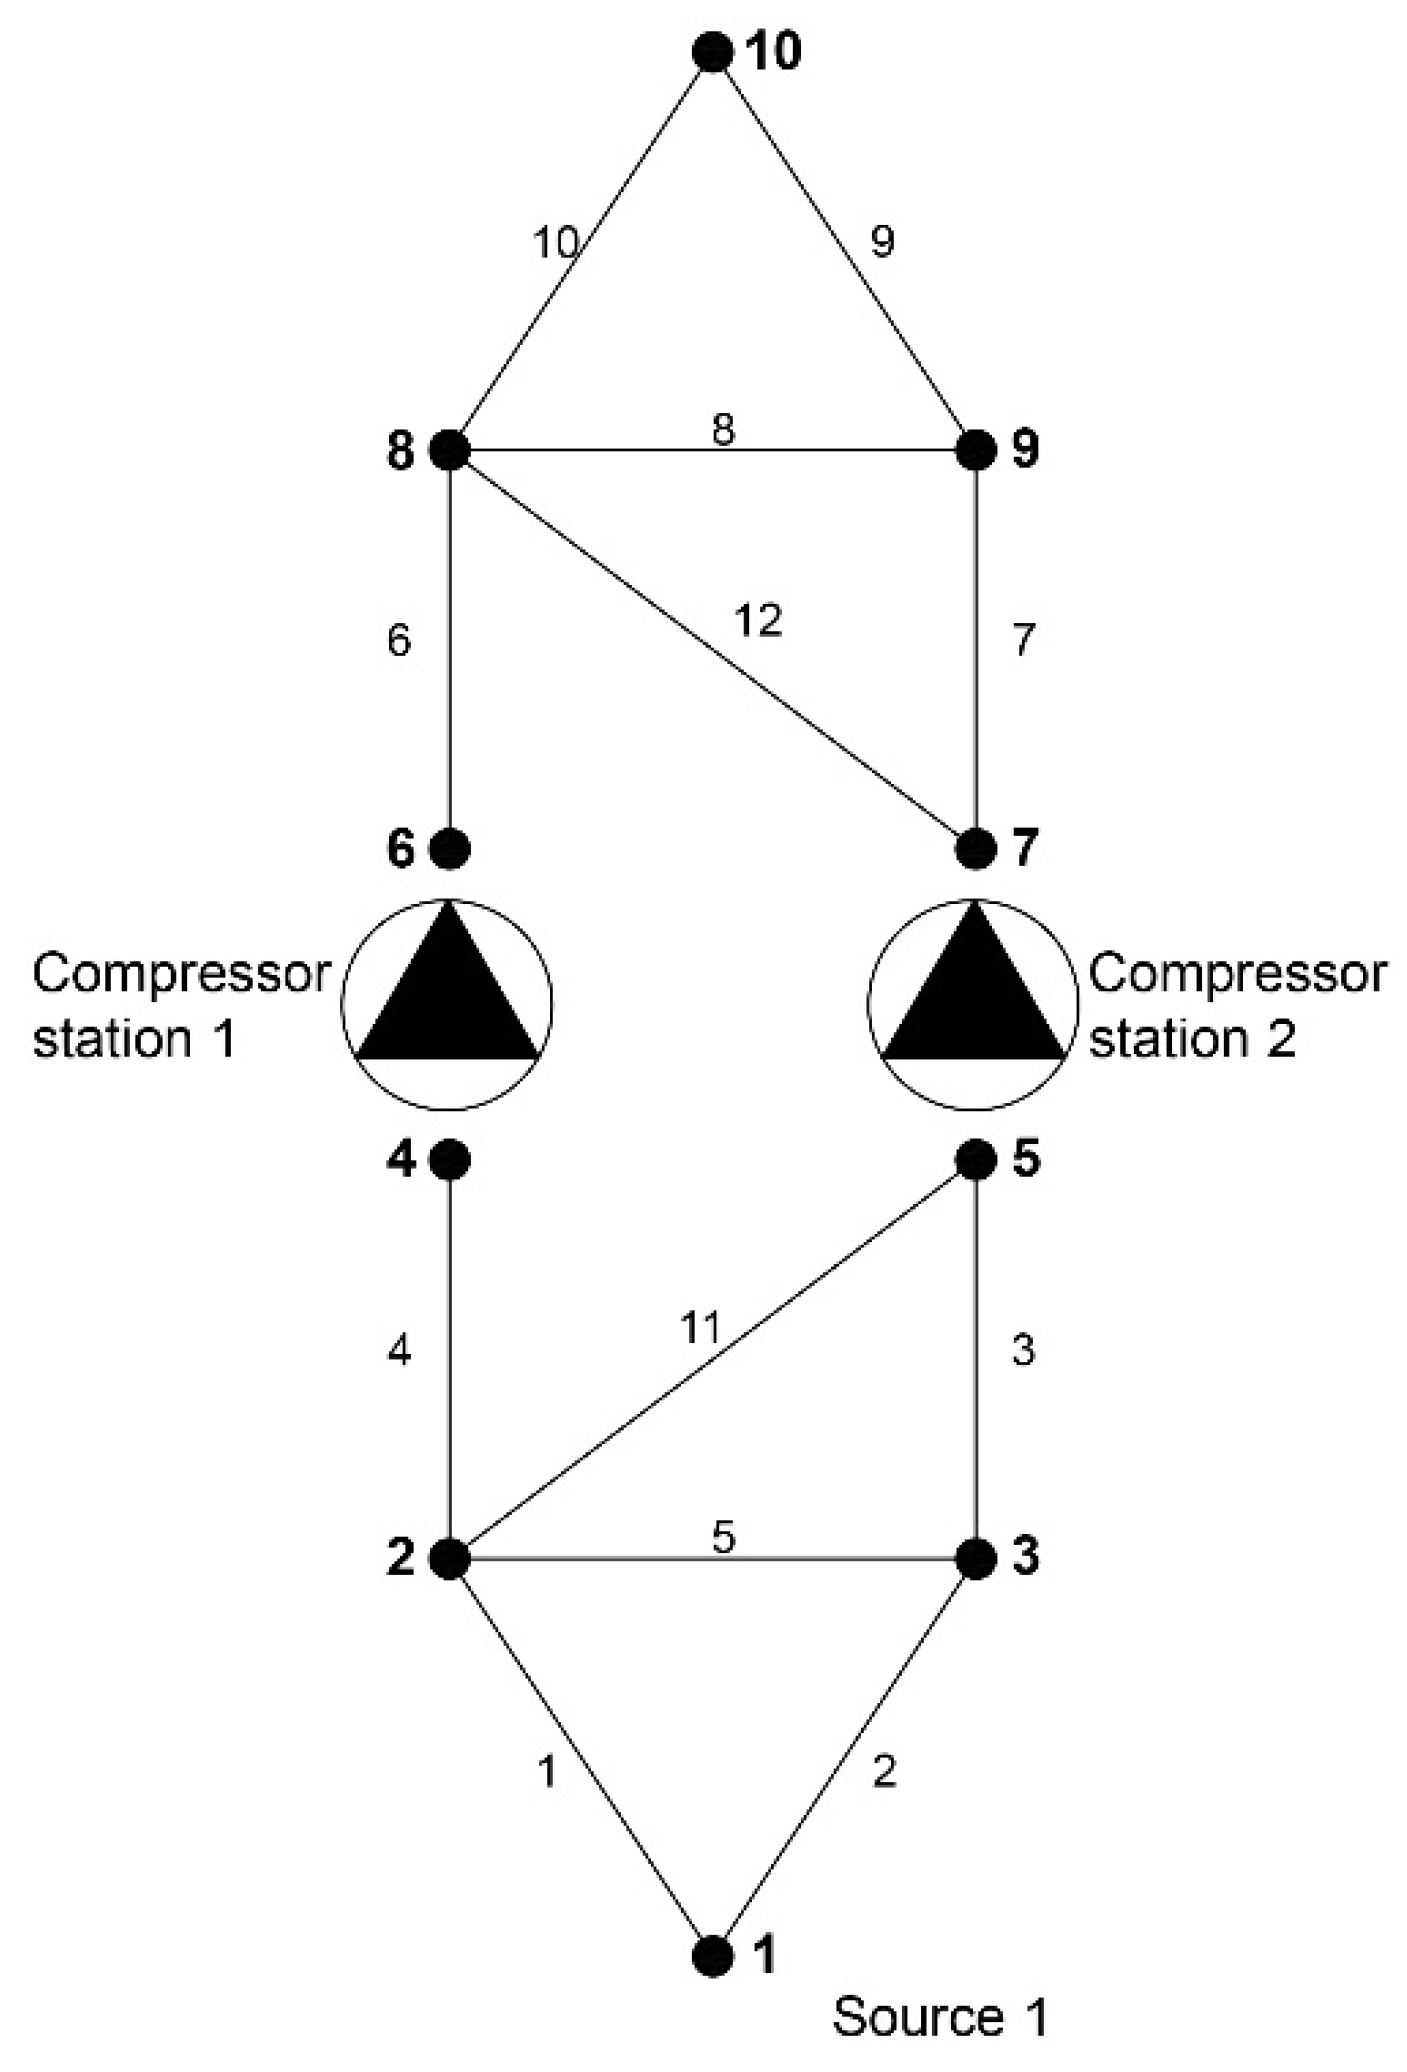
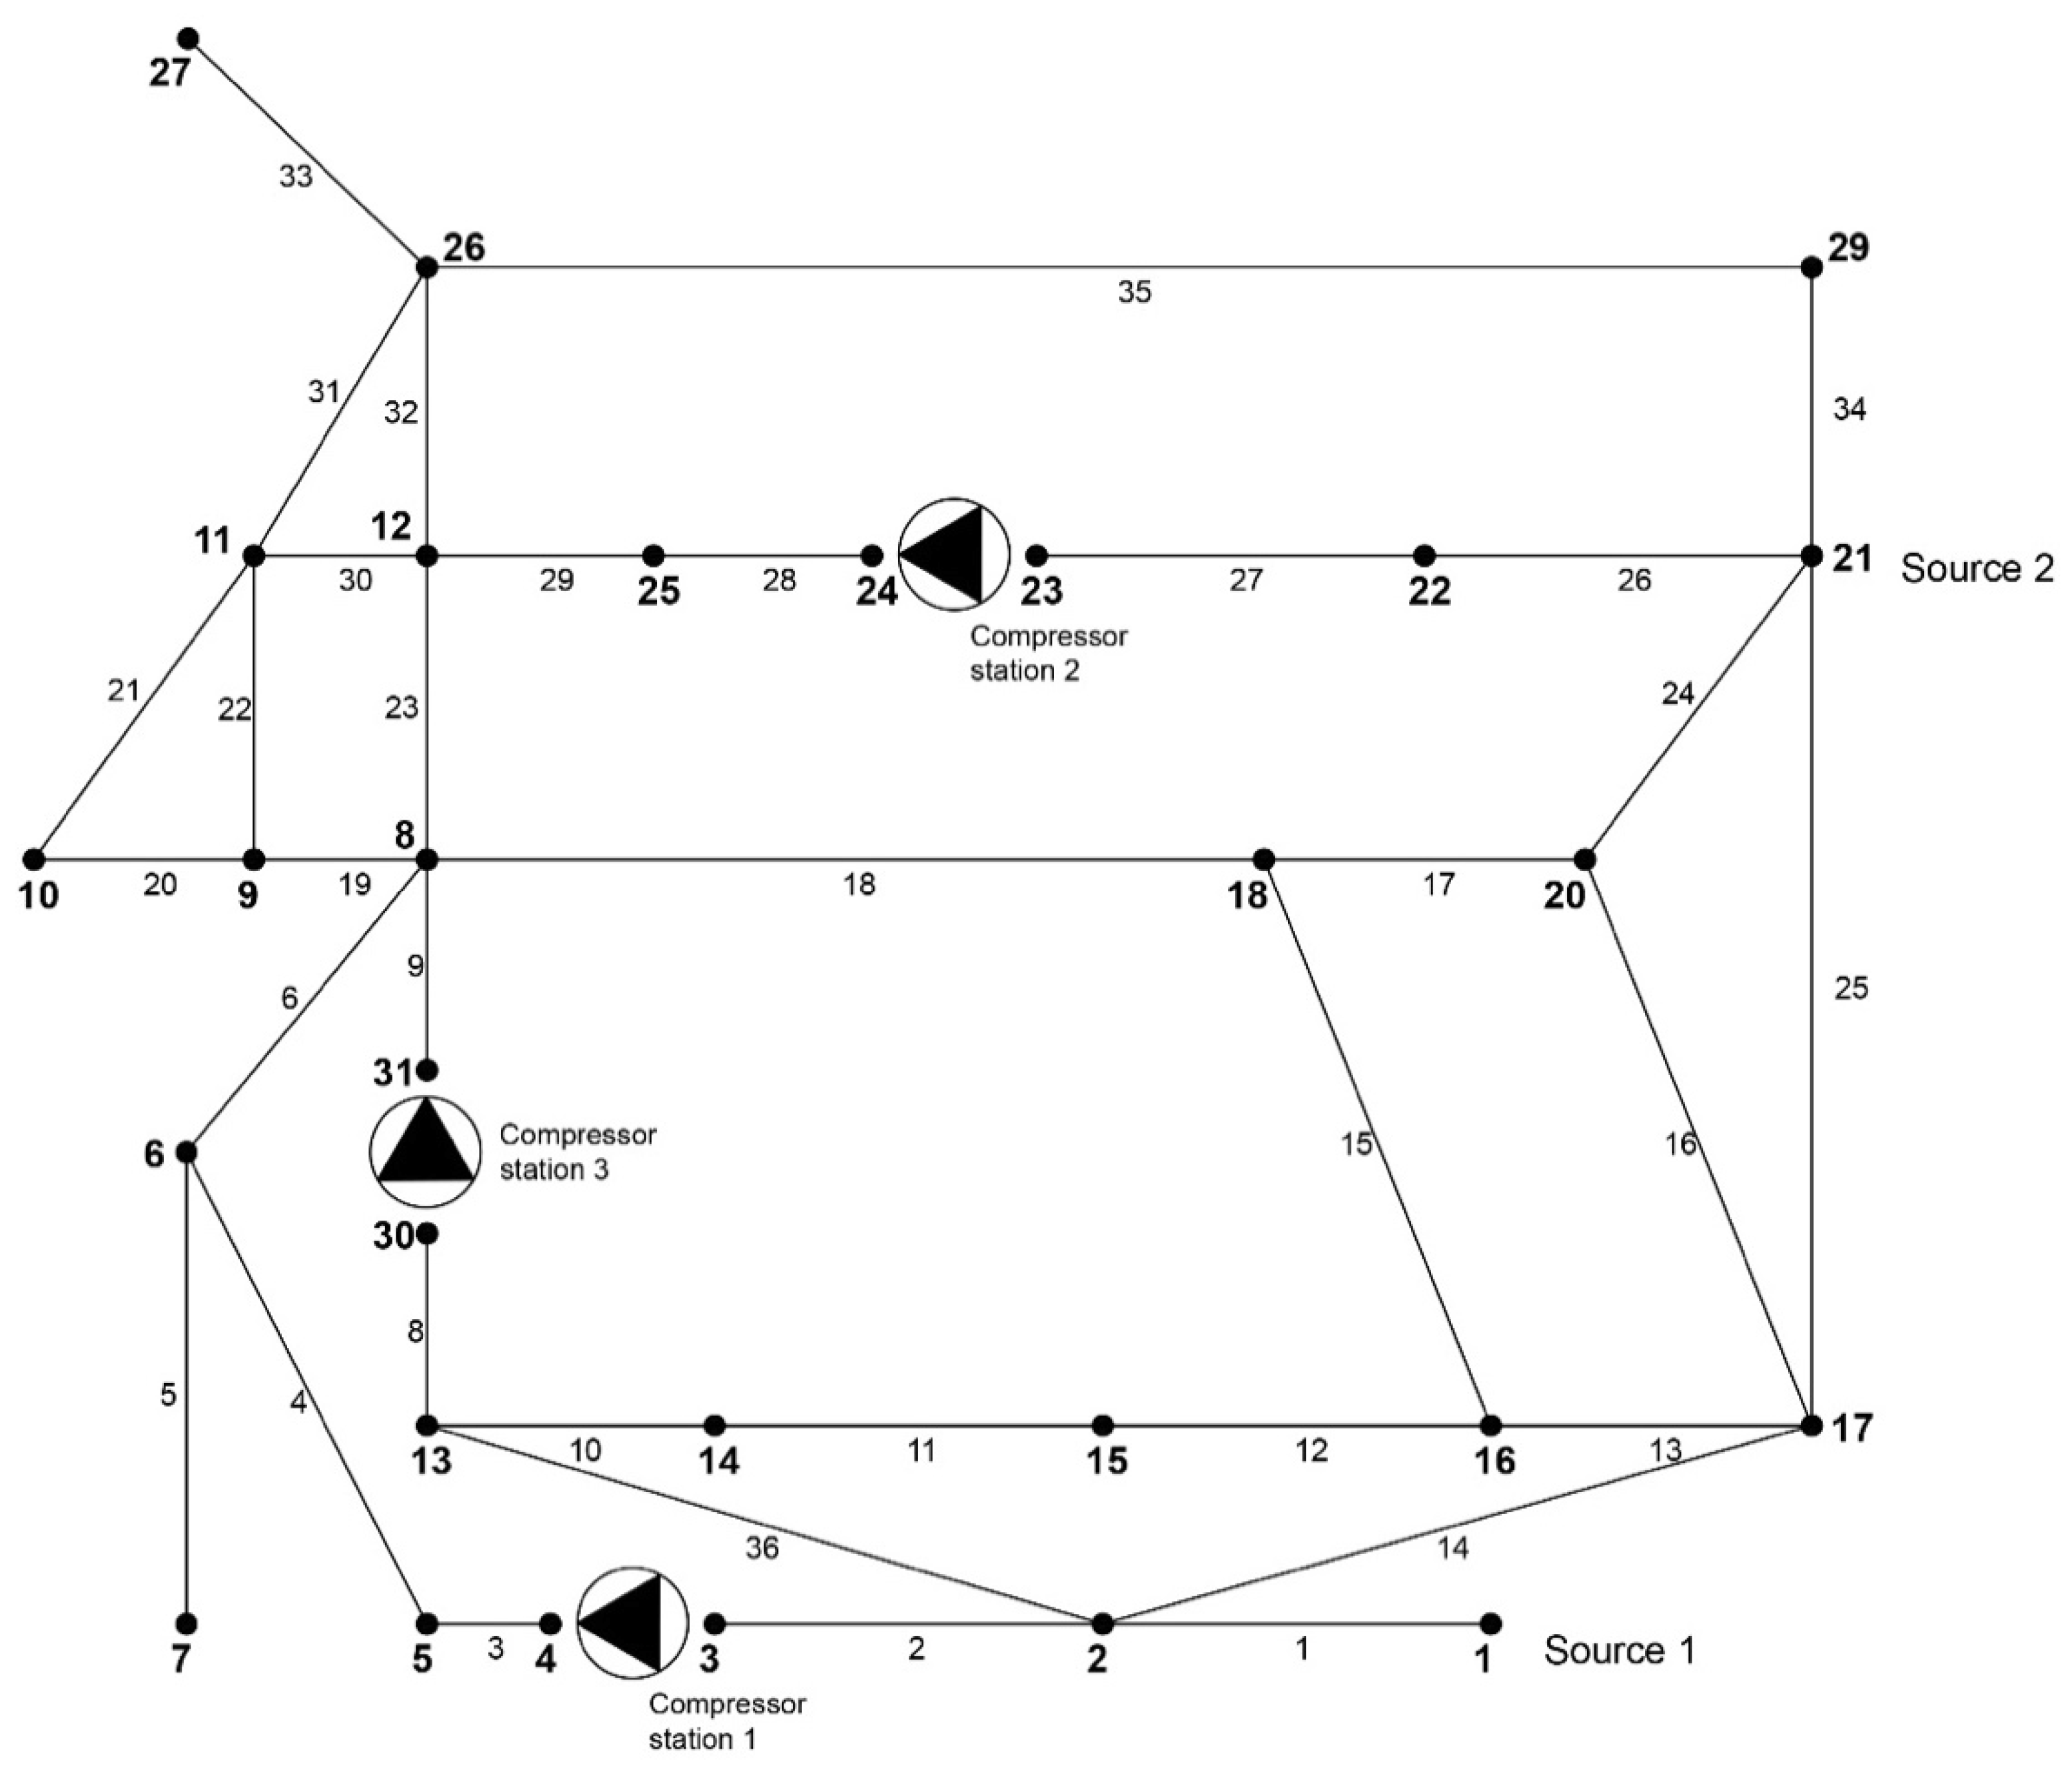
Optimization was performed for three different gas network structures which are presented in Figure 2, Figure 3 and Figure 4.

5.1. Network 1

Pipeline geometry of network 1 is presented in Table 2.
Nodal input data of network 1 is presented in Table 3.
Optimization results for network 1 are presented in Table 4.

5.2. Network 2

Pipeline geometry of network 2 is presented in Table 5.
Nodal input data of network 2 is presented in Table 6.
Optimization results are presented in Table 7.

5.3. Network 3

Pipeline geometry of network 3 is presented in Table 8.
Nodal input data of network 3 is presented in Table 9.
Optimization results for network 3 are presented in Table 10.

6. Results Analysis

Table 11 presents the results of the tested networks. In each scenario, the bi-criteria optimization objective function value was lower than the value of arithmetic average of the objective function of minimizing power and maximizing gas capacity.
The difference increases as the dimension of the network increases. For networks 1, 2 and 3, the differences are 10%, 17% and 28%, respectively. Comparison of optimization results is presented in Figure 5.
The costs of compressor stations electric energy consumption were calculated for each scenario assuming that 1 kWh of electricity costs 0.55 Polish zloty (PLN). They are shown in Table 12 and Table 13.
Cost minimization should not be the only criterion to manage the transmission system. It should be noted that the operator is responsible for gas delivery to the customer under specific terms. It may occur that in certain situations (forecast error, sudden change in ambient temperature, inconsistent gas consumption with the contract by one of the recipients), the operator will not be able to ensure the gas supply under specific parameters resulting from the concluded contracts. Security of supply in all conditions can be achieved by increasing the gas line pack in the network, which in turn results in increased system operational costs. This means that gas transmission system optimization should take into account two factors: minimization of fuel consumption in terms of operating costs and maximization of gas line pack in the system in terms of ensuring delivery security. Therefore, the algorithm should find a compromise solution between these two factors.
The presented tables clearly show that using bi-criteria optimization to manage the gas transmission network is cheaper than in the case of scalar optimization treated as an arithmetic average of the objective function of power minimization and line pack maximization.
7. Conclusions

The results of the study confirm that bi-criteria optimization allows for much cheaper gas transmission system management. It should be noted that the steady gas flow state in the case of transmission system is only an approximation of the reality. The next stage for the bi-criteria optimization algorithm is its adaptation for the transient flow model.

Author Contributions

Conceptualization, A.J.O.; methodology A.J.O. and N.I.; software, N.I.; validation, A.J.O. and N.I.; formal analysis, A.J.O. and N.I.; investigation, A.J.O. and N.I.; resources, A.J.O.; data curation, A.J.O. and N.I.; writing—original draft preparation, A.J.O. and N.I.; writing—review and editing, A.J.O.; visualization, N.I.; supervision, A.J.O.; project administration, A.J.O. All authors have read and agreed to the published version of the manuscript.

Funding

This research received no external funding.

Conflicts of Interest

The authors declare no conflict of interest.

References

  1. Selot, A.; Kuok, L.K.; Robinson, M.; Mason, T.L.; Barton, P.I. A short-term operational planning model for natural gas production systems. AIChE J. 2008, 54, 495–515. [Google Scholar] [CrossRef]
  2. Chaudry, M.; Jenkins, N.; Strbac, G. Multi-time period combined gas and electricity network optimisation. Electr. Power Syst. Res. 2008, 78, 1265–1279. [Google Scholar] [CrossRef]
  3. Möller, M. Mixed Integer Models for the Optimisation of Gas Networks in the Stationary Case. Ph.D. Thesis, TU Darmstadt, Darmstadt, Germany, 2004. [Google Scholar]
  4. Geißler, B.; Martin, A.; Morsi, A.; Schewe, L. Using Piecewise Linear Functions for Solving MINLPs. In Recent Developments in Discontinuous Galerkin Finite Element Methods for Partial Differential Equations; Springer Science and Business Media LLC: Berlin, Germany, 2011; Volume 154, pp. 287–314. [Google Scholar]
  5. Vielma, J.P. Mixed-integer models for non-separable piecewise-linear optimization: Unifying framework and extensions. Oper. Res. 2010, 58, 303–315. [Google Scholar] [CrossRef]
  6. Lewandowski, A.; Osiadacz, A. Multiple Criteria Interactive Control of the Natural Gas Distribution Network; Springer Science and Business Media LLC: Berlin, Germany, 2005; Volume 67, pp. 600–604. [Google Scholar]
  7. Ruan, Y.; Liu, Q.; Zhou, W.; Batty, B.; Gao, W.; Ren, J.; Watanabe, T. A procedure to design the mainline system in natural gas networks. Appl. Math. Model. 2009, 33, 3040–3051. [Google Scholar] [CrossRef]
  8. Tabkhi, F.; Pibouleau, L.G.; Domenech, S.; Hernandez-Rodriguez, G.; Azzaro-Pantel, C. Improving the performance of natural gas pipeline networks fuel consumption minimization problems. AIChE J. 2009, 56, 946–964. [Google Scholar] [CrossRef]
  9. Arya, A.K.; Honwad, S. Multi-objective optimization of a gas pipeline network: An ant colony approach. J. Pet. Explor. Prod. Technol. 2018, 8, 1389–1400. [Google Scholar] [CrossRef] [Green Version]
  10. Su, H.; Zio, E.; Zhang, J.; Li, X.; Chi, L.; Fan, L.; Zhang, Z. A method for the multi-objective optimization of the operation of natural gas pipeline networks considering supply reliability and operation efficiency. Comput. Chem. Eng. 2019, 131, 106584. [Google Scholar] [CrossRef]
  11. Rodrigez, G.H. Multi-Objective Optimization of Natural Gas Transportation Networks. Ph.D. Thesis, INP Toulouse, Toulouse, France, 2011. [Google Scholar]
  12. Sukharev, M.; Popov, R.; Balchenko, A. Multiple-criteria decision analysis for cross-country gas pipelines. EDP Sci. 2019, 102, 03010. [Google Scholar] [CrossRef]
  13. Chebouba, A. Multi objective optimization of line pack management of gas pipeline system. J. Phys. Conf. Ser. 2015, 574, 012114. [Google Scholar] [CrossRef]
  14. He, F.; Nwafor, J. Gas pipeline recovery from disruption using multi-objective optimization. In Proceedings of the 2017 IEEE International Symposium on Technologies for Homeland Security, Waltham, MA, USA, 25–26 April 2017. [Google Scholar]
  15. Alves, F.D.S.; De Souza, J.N.M.; Costa, A.L.H. Multi-objective design optimization of natural gas transmission networks. Comput. Chem. Eng. 2016, 93, 212–220. [Google Scholar] [CrossRef]
  16. Osiadacz, A. Simulation and Analysis of Gas Networks; Gulf Publishing Company: Houston, TX, USA, 1987. [Google Scholar]
  17. Osiadacz, A. Steady-State Simulation of Gas Network; Fluid Systems Ltd.: Warsaw, Poland, 2001. (In Polish) [Google Scholar]
  18. Osiadacz, A. Simulation and Optimization of Large Systems; Clarendon Press: Oxford, UK, 1988; pp. 193–207. [Google Scholar]
  19. Wilson, J.G.; Wallace, J.; BP, F. Steady-State Optimisation of Large Gas Transmission Systems in Simulation and Optimization of Large Systems; Osiadacz, A.J., Ed.; Clarendon Press: Oxford, UK, 1988. [Google Scholar]
  20. Isoli, N. Bi-Criterial Optimization for the Control of Gas Transmission Network. Ph.D. Thesis, Warsaw University of Technology, Warsaw, Poland, 2020. [Google Scholar]
  21. Bazara, M.S.; Sherali, H.D.; Shetty, C.M. Nonlinaear Programming: Theory and Algorithms; Wiley: Hoboken, NJ, USA, 2005. [Google Scholar]
  22. Edgar, T.F.; Himmelblau, D.M. Optimization of Chemical Processes; McGraw-Hill Book Company: New York, NY, USA, 1998. [Google Scholar]
  23. Fletcher, R. Practical Methods of Optimization; John Wiley & Sons: Hoboken, NJ, USA, 1999. [Google Scholar]
  24. Notenboom, R.P. Structural Optimization by Rosen’s Gradient Projection Method; Report LR-450; Delft University of Technology: Delft, The Netherlands, 1984. [Google Scholar]
  25. Nocedal, J.; Wright, S.J. Numerical Optimization; Springer: New York, NY, USA, 1999. [Google Scholar] [CrossRef] [Green Version]
  26. Marler, T.; Arora, J.S. Survey of multi-objective optimization methods for engineering. Struct. Multidiscip. Optim. 2004, 26, 369–395. [Google Scholar] [CrossRef]
  27. Marler, R.T.; Arora, J.S. The weighted sum method for multi-objective optimization—New insights. Struct. Multidise. Optim. 2010, 41, 853–862. [Google Scholar] [CrossRef]
  28. Jahn, J. Vector Optimization, Theory, Application and Extensions; Springer: Berlin, Germany, 2004. [Google Scholar]
  29. Miettinen, K. Nonlinear Multi-Objective Optimization, International Series in Operations Research & Management Science; Springer Science + Business Media LLC: Berlin, Germany, 2004. [Google Scholar]
  30. Osiadacz, A.; Isoli, N. Application of Bi-Criteria Optimization for the Control of Gas Transmission System; Gaz Woda i Technika Sanitarna Nr 4: Warsaw, Poland, 2019. (In Polish) [Google Scholar]
  31. Steuer, R.E. Multiple Criteria Optimization: Theory, Computation, and Application; John Wiley & Sons: Hoboken, NJ, USA, 1986. [Google Scholar]
Figure 1. Compressor envelope.
Energies 13 05141 g001
Figure 2. Structure of network 1. The network consists of: number of pipelines—17; number of nodes—20; number of sources—1; number of compressor stations—2; source pressure—5000 kPa.
Energies 13 05141 g002
Figure 3. Structure of network 2. The network consists of: number of pipelines—12; number of nodes—10; number of sources—1; number of compressor stations—2; source pressure—4000 kPa.
Energies 13 05141 g003
Figure 4. Structure of network 3. The network consists of: number of pipelines—35; number of nodes—29; number of sources—2; number of compressor stations—3; source 1 pressure—5000 kPa; source 2 pressure—5000 kPa.
Energies 13 05141 g004
Figure 5. Comparison of optimization results.
Energies 13 05141 g005
Table 1. Pressure drop, volumetric flow rate for real and standard conditions.
ΔpQrzQnM
MPam3/hm3/hKg
0.510,136348,984249,735
1.013,747512,169366,511
1.516,161649,293464,637
2.017,936774,327554,112
2.519,303892,367638,582
3.020,3871,005,880719,812
3.521,2651,116,246798,791
4.021,9881,224,318876,128
4.522,5901,330,654952,222
5.023,0981,435,6401,027,351
Table 2. Pipeline geometry of network 1.
PipelineLDPipelineLD
ID(m)(mm)ID(m)(mm)
164,4809001010,400600
253,2809001113,120400
313,600900128640700
413,280900131760600
528,000900141760700
664007001519,680600
732,8009001613,920700
834,0809001725,440700
926,880900
Table 3. Nodal input data of the network 1.
NodePressureDemandNodePressureDemand
ID(kPa)(m3/h)ID(kPa)(m3/h)
15000011-150,000
2-012-40,000
3-30,00013-20,000
4-014-55,000
5-50,00015-0
6-016-30,000
7-017-100,000
8-018-100,000
9-30,00019-160,000
10-110,00020-0
Table 4. Optimization results for network 1.
CompressorPsuctionPdischargePower
Station(kPa)(kPa)(kW)
Scalar Optimization—Power Minimization
1473757591907
2462356613447
Scalar Optimization—Line Pack Maximization
1473775004643
2462372007779
Bi-Criteria Optimization
1473763272861
2462362415171
Table 5. Pipeline geometry of network 2.
PipelineLDPipelineLD
ID(m)(mm)ID(m)(mm)
150,0007007100,000700
250,000700850,000700
3100,000700950,000700
4100,0007001050,000700
550,0007001150,000700
6100,00070012100,000700
Table 6. Nodal input data of network 2.
NodePressureDemand
ID(kPa)(m3/h)
14000-
2-100,000
3-100,000
4-0
5-0
6-0
7-0
8-100,000
9-100,000
10-300,000
Table 7. Optimization results for network 2.
CompressorPsuctionPdischargePower
Station(kPa)(kPa)(kW)
Scalar Optimization—Power Minimization
1306337151066
2317537151767
Scalar Optimization—Line Pack Maximization
1311949002353
2315548005096
Bi-Criteria Optimization
1306340391599
2317540392651
Table 8. Pipeline geometry of network 3.
PipelineLDPipelineLD
ID(m)(mm)ID(m)(mm)
150,0009142065,000914
235,0009142150,000914
320,0009142280,000914
480,00091423120,000914
585,0009142460,000914
695,0009142580,000914
885,0009142640,000914
960,0009142750,000914
1035,0009142860,000914
1145,00091429115,000914
1265,0009143035,000914
1370,0009143175,000914
14150,0009143290,000914
1520,0009143380,000914
1655,0009143480,000914
1765,0009143550,000914
1840,0009143660,000914
1955,000914
Table 9. Nodal input data of network 3.
NodePressureDemandNodePressureDemand
ID(kPa)(m3/h)ID(kPa)(m3/h)
14000016-117,987
2-117,98717-117,987
3-018-117,987
4-019-117,987
5-117,98720-117,987
6-117,9872140000
7-117,98722-117,987
8-117,98723-0
9-117,98724-0
10-117,98725-117,987
11-117,98726-117,987
12-117,98727-117,987
13-117,98729-117,987
14-117,98730-0
15-031 0
Table 10. Optimization results for network 3.
CompressorPsuctionPdischargePower
Station(kPa)(kPa)(kW)
Scalar Optimization—Power Minimization
145834864707
2462251091297
3437748481109
Scalar Optimization—Line Pack Maximization
1423853004021
2443153002782
3409451003078
Bi-Criteria Optimization
1444148111061
2450651421946
3427249041664
Table 11. Power consumption for each optimization scenario.
ScenarioCompression Stations Total Power
(kW)
Network 1Network 2Network 3
Scalar optimization – power minimization535428333113
Scalar optimization – line pack maximization12,42274499881
Arithmetic mean of scalar optimization888851416497
Bi-criteria optimization 803242504671
Table 12. Comparison of optimization results—24 h scenario.
NetworkTotal Power24 h Energy ConsumptionGross Cost
(kW)(kWh)(PLN)
Arithmetic Mean of Scalar Optimization
18888213,312117,321.60
25141123,3846,786,120
36497155,92885,760.40
Bi-Criteria Optimization
18032192,768106,022.40
24250102,00056,100.00
34671112,10461,657.20
Table 13. Comparison of optimization results—1 year scenario.
NetworkTotal Power1 year Energy ConsumptionGross Cost
(kW)(kWh)(PLN)
Arithmetic Mean of Scalar Optimization
1888877,858,88042,822,384
2514145,035,16024,769,338
3649756,913,72031,302,546
Bi-Criteria Optimization
1803270,360,32038,698,176
2425037,230,00020,476,500
3467140,917,96022,504,878