Article

Influence of Blasting Vibration of MLEMC Shaft Foundation Pit on Adjacent High-Rise Frame Structure: A Case Study

Faculty of Engineering, China University of Geosciences, No.388, Lumo Road, Wuhan 430074, China
*
Author to whom correspondence should be addressed.
Energies 2020, 13(19), 5140; https://doi.org/10.3390/en13195140
Submission received: 14 August 2020 / Revised: 24 September 2020 / Accepted: 27 September 2020 / Published: 2 October 2020

Abstract

:
The construction of metro line energy management center (MLEMC) is one of the important parts of metro line, which is the key organization to realize the energy consumption management of the metro operation. To protect the safety of adjacent high-rise buildings during the blasting of subway foundation pit engineering, it is crucial to study the response characteristics of building structures. This paper takes the MLEMC vertical pit blasting project of Wuhan Metro Line 8 as an example. The law of blasting vibration attenuation along the earth’s surface and the vibration velocity response characteristics of the building structure were analyzed by small explosive test. LSDYNA numerical model was established, and the reliability of the model and parameters was verified by experimental data. Combined with the relevant specifications, the maximum charge in single delay was calculated and analyzed. The numerical model of the maximum charge in single was established, and the prediction model of the vibration velocity related to the floors of high-rise buildings was further proposed. Combined with the failure principle of reinforced concrete structure, the safety of high-rise buildings under blasting vibration was analyzed and evaluated.

1. Introduction

In October 2019, there are 41 cities with operating metros in China. A total of 4600 km of metros have been built in Chinese cities. In the construction of subway deep foundation pit, hard rock excavation is often faced. As an efficient method of rock excavation, blasting has been widely used in foundation pit construction. The metro line energy management center (MLEMC), as the key organization to realize the energy consumption management of metro operation, is always set in the middle of the line. However, in the complex urban environment, the construction of the MLEMC shaft foundation pit is always close to the high-rise buildings. The vibration induced by rock blasting has a detrimental effect on the adjacent high-rise building. To ensure the safety of adjacent high-rise buildings in the course of blasting construction, it is pivotal to evaluate and control the impact of blasting vibration load on high-rise buildings.
At present, many researchers have done vast researches on the response characteristics of buildings (structures) under blasting vibration [1,2,3,4]. However, most of the related studies focus on the analysis of building structures under the impact induced by metro tunnel blasting and open-pit mine blasting. When studying the effect of blasting vibration on high-rise buildings, many researchers and experts have found that the vibration velocity has an elevation amplification effect. For example, Athanasopoulos and Pelekis [5] conducted field monitoring of the vibration velocity of high-rise buildings and found that the vertical vibration velocity had obvious amplification effect. Zhu et al. [6] indicated that the larger the height difference, the more obvious the elevation amplification effect in the same condition. Roy [7] considered the dynamic response and resonance of the surface structures subject to blasting vibration and analyzed the elevation amplification effect and attenuation law, and then evaluated and analyzed the vibration waves with different frequencies. Dowding et al. [8] evaluated the influence of ultra-high frequency induced by rock blasting excitation on multi-story buildings and concluded that there was a significant discrepancy in the frequency, phase, and amplitude of the vertex angle and corner of the structure when the excitation frequency was much higher than the natural vibration frequency of the structure.
In the existing researches, peak particle velocity (PPV) of the structures or surface is regarded as an important parameter to evaluate the dynamic response of the structure under the blasting impact. Ma et al. [9] compared the attenuation law of PPV between AUTODYNA and field measured and carried out parameter analysis on the structure type and field conditions and estimated the safety distance in the project as well. Gad et al. [10] obtained a simplified method to estimate the ground PPV causing cracks by monitoring the houses near the coal mine for more than a year and measured the dynamic response of the houses. However, under the condition of blasting vibration, high-rise buildings have an elevation amplification effect, so the dynamic response of the whole building needs to be analyzed.
In recent years, numerical simulation has been widely used in blasting engineering. Xie et al. [11] verified the reliability of the numerical simulation by using the data of the field monitoring, then changed the initiation sequence and blasting direction through vibration velocity and acceleration analysis to minimize the impact of open deep hole blasting on adjacent buildings. Borvik et al. [12] studied the response of the structure to the plane explosion load by using the finite element method.
For further investigation, the impact of blasting vibration on the structure as well as its key parts (such as beams, columns, and plates), a large number of experts and researchers utilized numerical calculation methods to analyze the dynamic response of the frame structure. Wu et al. [13] used Autodyna3D to analyze the dynamic response and damage of the masonry structure and reinforced concrete frame filled with masonry under explosion ground motion. Sielicki et al. [14] studied the damage behavior of reinforced concrete support under explosion load by field test and numerical simulation software Abaqus. Jayasooriya et al. [15] used SAP2000 and LS-DYNA software to analyze the impact of the explosion load on the frame structure.
In addition, some researchers found that the structural damage under the blasting vibration condition is closely related to the vibration frequency. Dhakal et al. [16,17] analyzed the dynamic response of reinforced concrete beam-column joints to different excitation frequencies varying from quasi-static load to dynamic load and discussed the relationship among blasting vibration frequency, amplitude, and structure shear force, and analyzed the influencing factors of structure damage. Bayraktar et al. [18] analyzed the dynamic characteristics of buildings with the verification of modal analysis theory and modal test experiments based on the monitoring data of reinforced concrete buildings.
In order to better guide the site construction, this paper will take Chinese current norms as the standard for research. This paper is aimed at investigating the dynamic performance of adjacent high-rise RC frame buildings of 17 stories building [19,20] under blasting vibration caused by foundation pit blasting excavation, and the excavation blasting engineering of the MLEMC shaft foundation pit between Hongshan Road station and Xiaohongshan station of Wuhan Metro Line 8 is taken as a case (Section 2). Firstly, a small charge blasting experiment with vibration velocity monitoring is conducted, the law of blasting vibration along the ground surface and the vibration response characteristics of high-rise buildings under blasting are analyzed, and a prediction model of the attenuation law of vibration along the surface is proposed (Section 3). Secondly, based on the case, a numerical model is established, and the reliability of the numerical model, parameters, and calculated results are verified with field measured data (Section 4). Finally, the maximum charge in one delay to protect the adjacent high-rise building is proposed based on the safety control standard of blasting vibration for high-rise buildings. Combined with numerical calculation and verification, the influence of maximum charge in one delay to the response of adjacent high-rise building is analyzed, and a model for predicting the vibration velocity of each floor is established, and the safety and stability of the high-rise building is evaluated by considering the failure stress principle of reinforced concrete high-rise buildings.

2. Overview of MLEMC Shaft Foundation Pit Engineering

Wuhan Rail Transit Line 8 connects Wuhan Hankou Houhu Residential area, Yongqing Business District, Wuchang Xudong, Commercial Circle, Donghu Scenic Area, Guozihu Administrative District, Jiejiekou Commercial Circle, and Nanhu Residential Area, which promotes the transportation link between the north area of Hankou and the south area of Wuchang, and it is the main rain transit line crossing the Yangzi river in Wuhan rail transit network. The total length of the line is 38.96 km, all of which are underground lines, with 26 stations. The geographic location is shown in Figure 1.
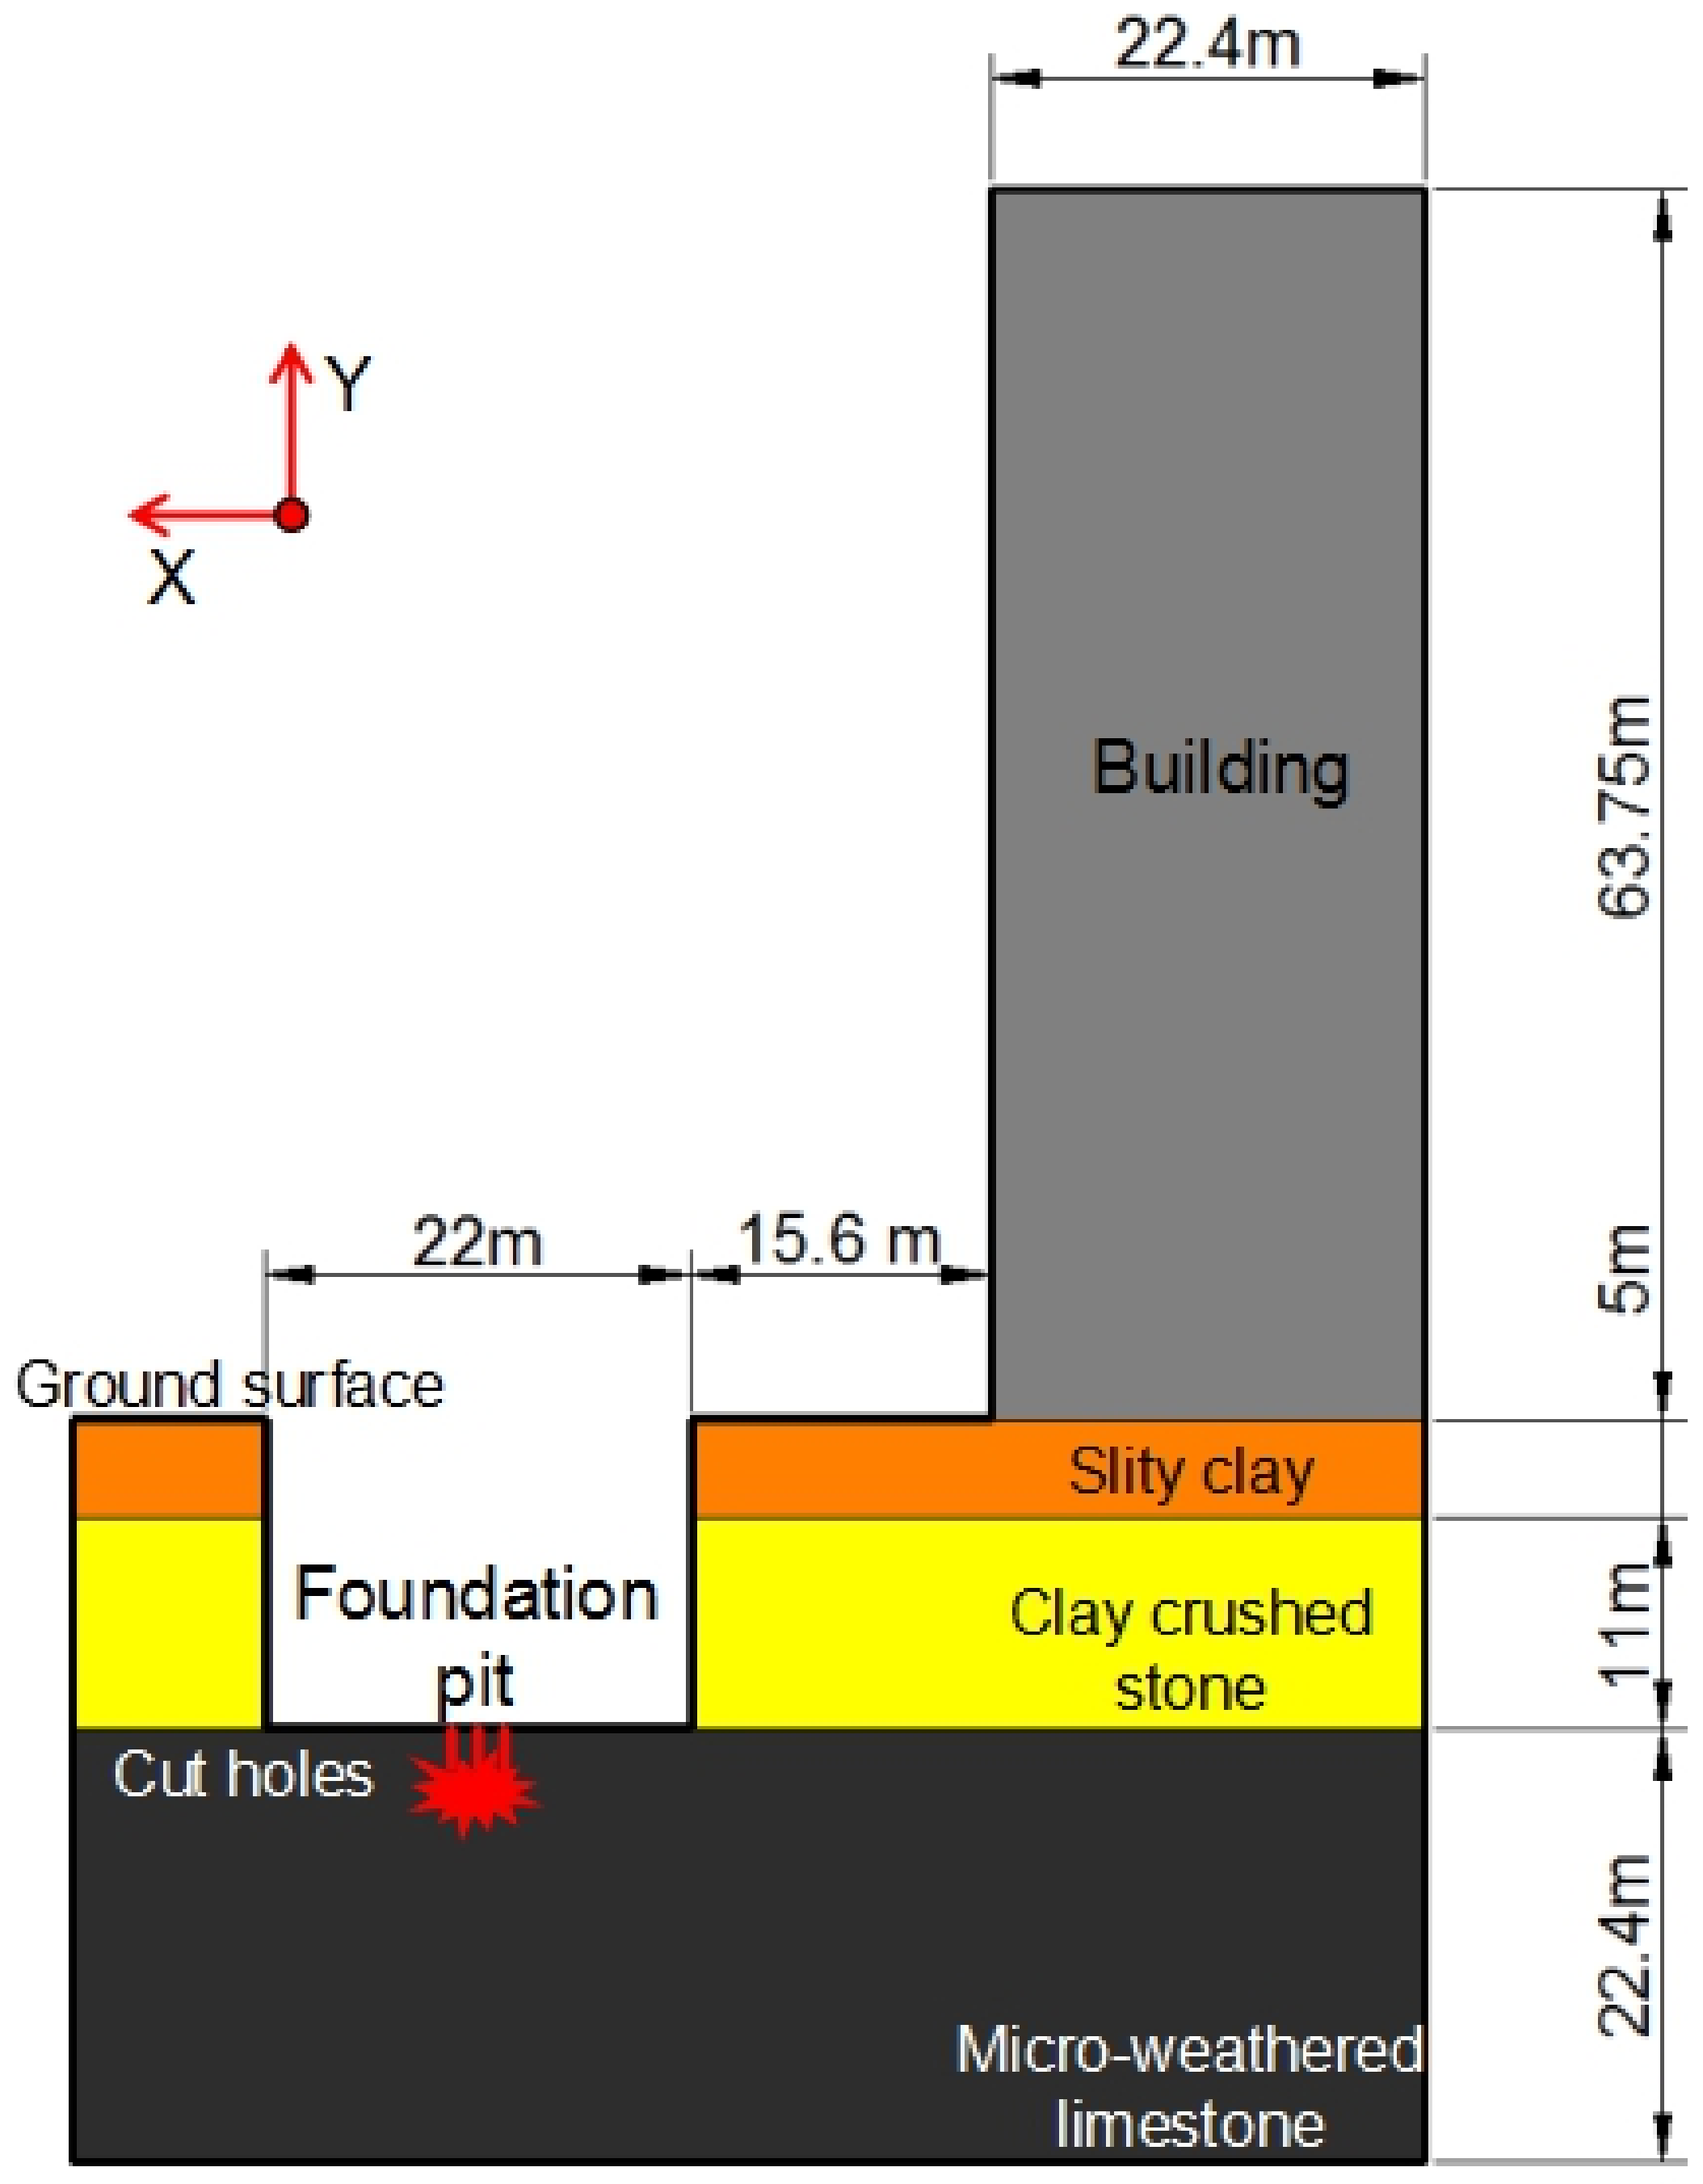
In this project, the MLEMC vertical pit is 22 m long, 18 m wide, and about 38 m deep, and the area is flat. According to the engineering geology survey, the geotechnical strata in the field are mainly divided into three parts. The first layer is a silty clay layer with a thickness of about 5 m. The second layer is a layer of clay and gravel with a thickness of about 11 m. The third layer is the micro or moderately weathered limestone, buried depth ranging from 45 to 11.4 m, which is hard rock. The foundation pit was dug to a depth of 16 m, and because the rock is hard, the drilling and blasting method was adopted.
According to the requirements of the project, No. 2 rock emulsion explosives are used for blasting and the excavation depth per round is 2.5 m. The diameter of the blasthole is 40 mm and the hole depth is 2.0 m. The inclined underholing is adopted. The distance between cutting hole, auxiliary hole and perimeter hole is 1.6 m, 1.2 m, and 1.0 m, respectively. According to the related specification and the practical situation of field engineering, the controlled vibration velocity of the earth’s surface particle in each direction was determined to be 2 cm·s−1. Chinese Regulations permits analyzing of the particle vibration velocity, as the one maximal component from the three orthogonal components.
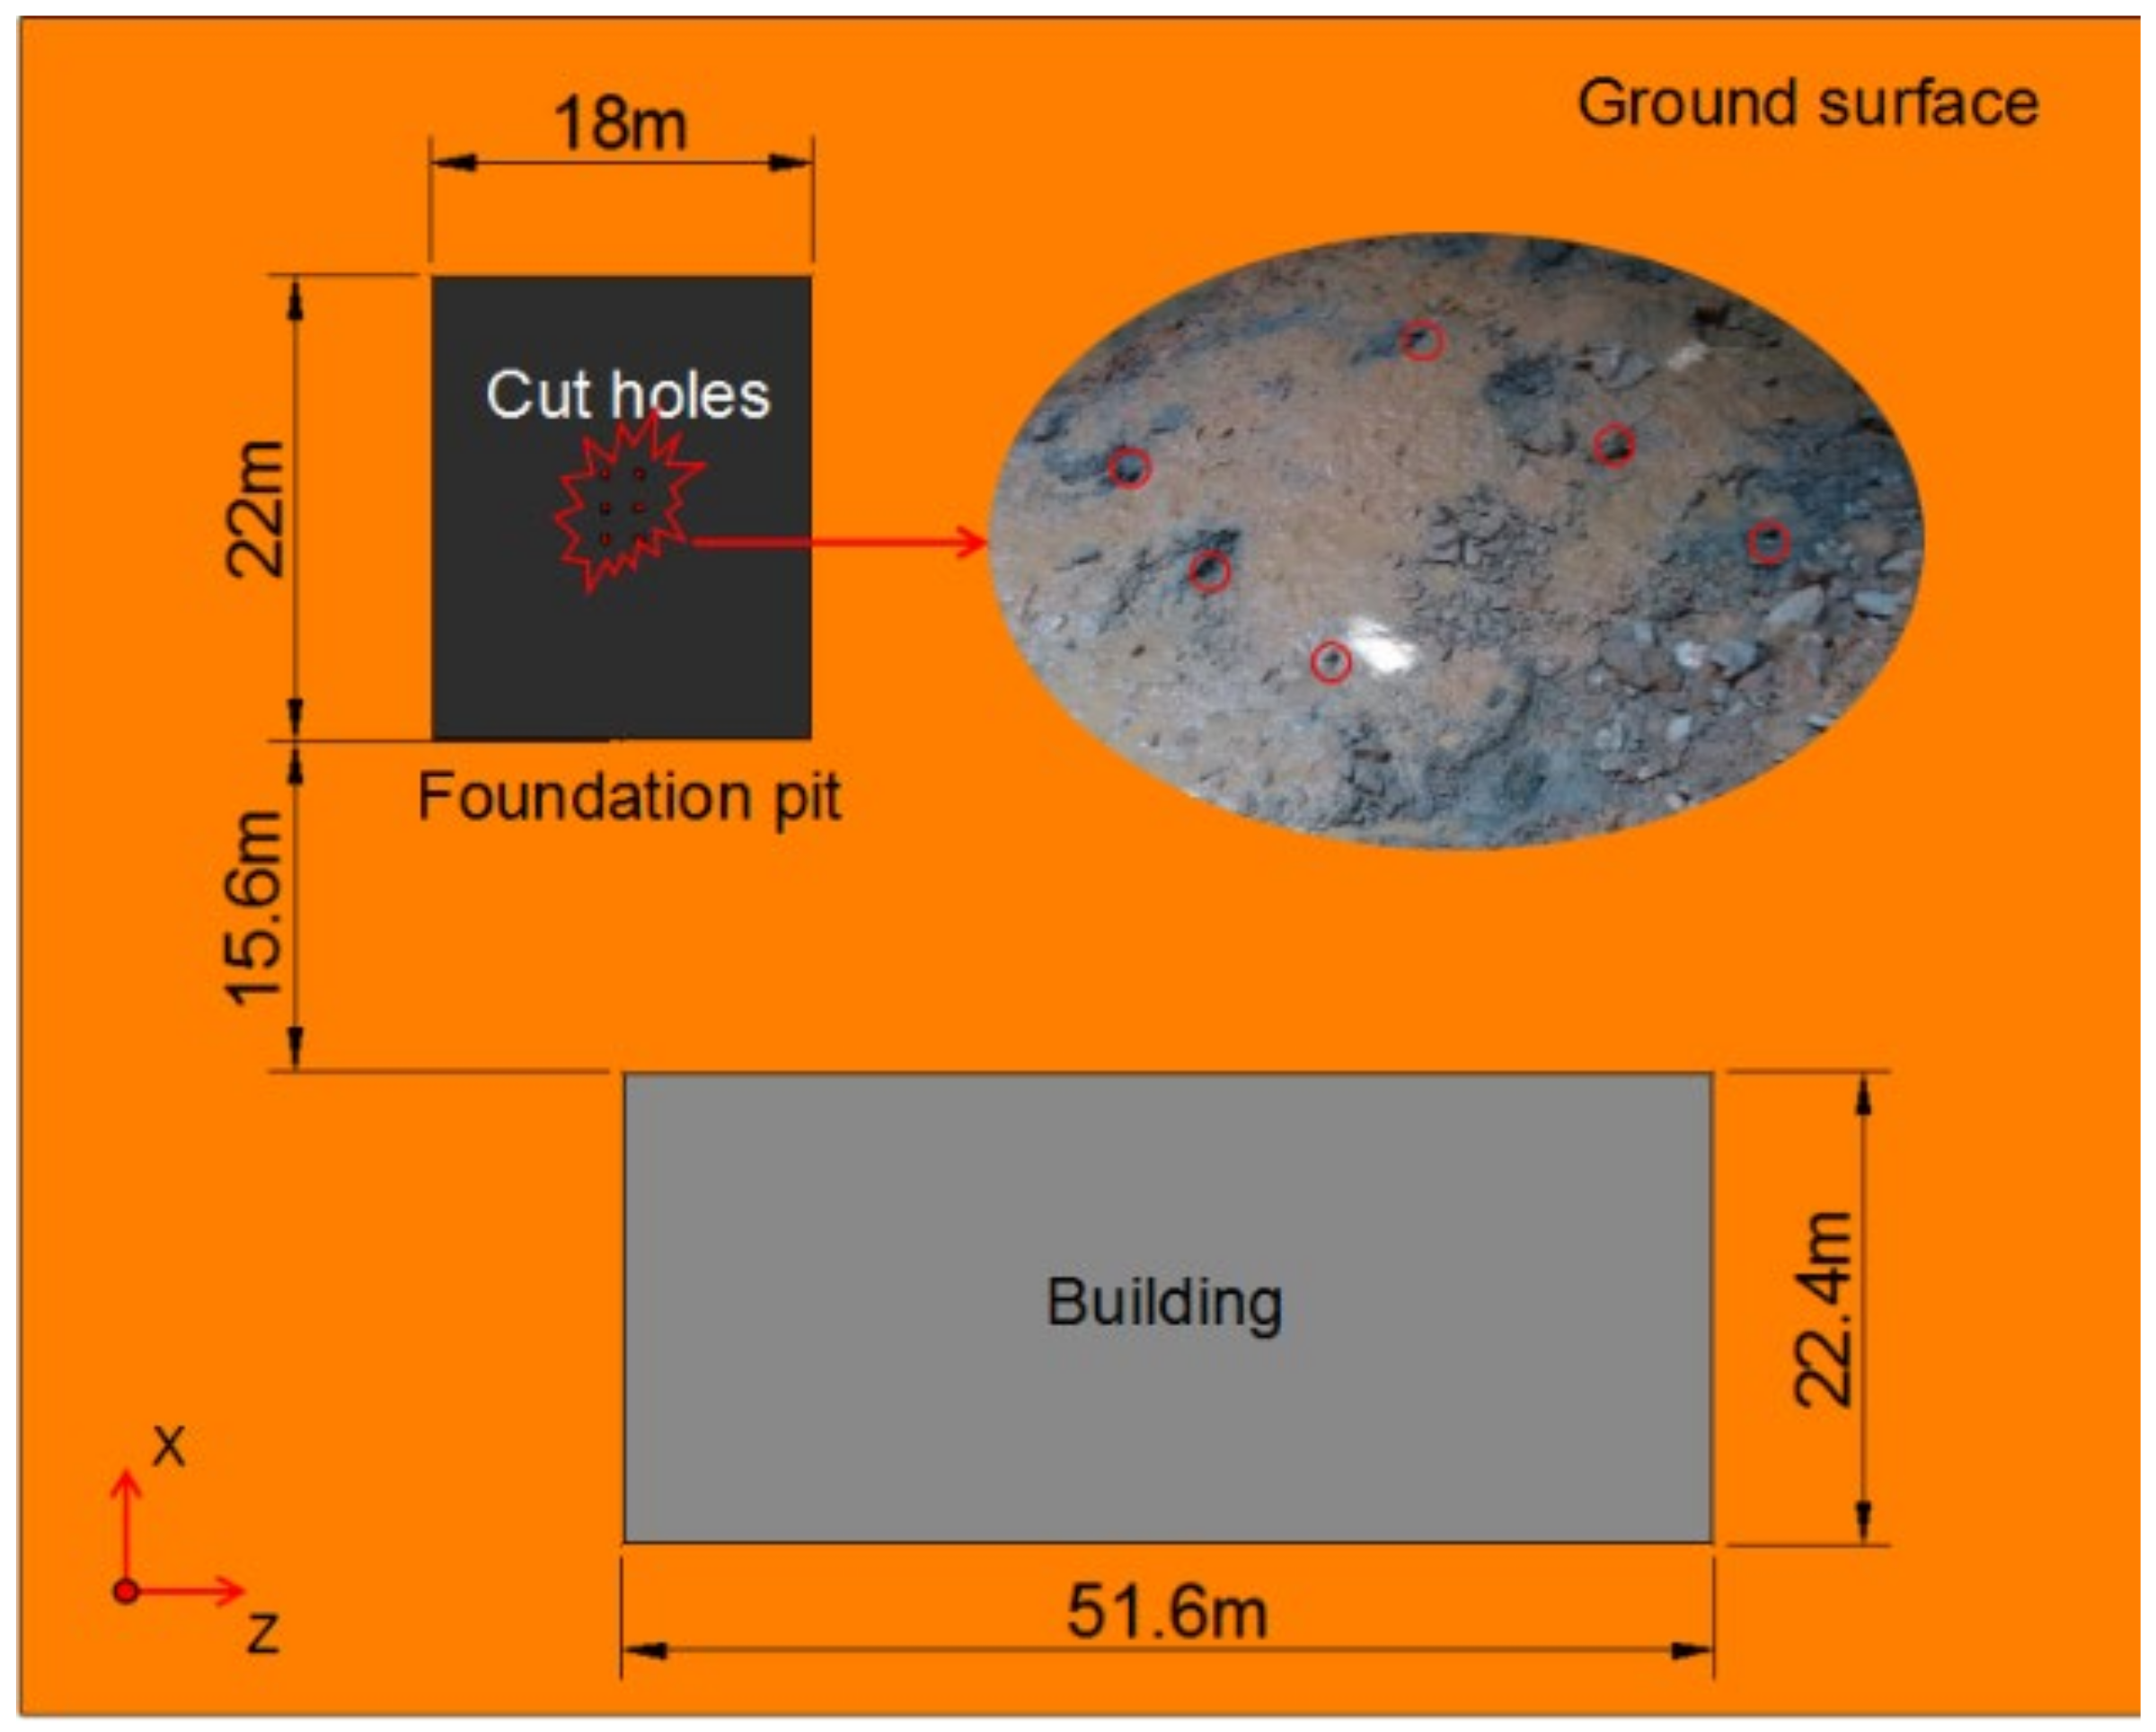
The relative position of discussed high-rise building and the foundation pit in this paper is shown in Figure 2 and Figure 3. The building has 17 floors above the ground and one underground, with a raft foundation buried at a depth of 5 m. This paper is aimed to analyze and evaluate the impact of foundation pit blasting excavation on the adjacent high-rise building.

3. Field Blasting Experiment and Vibration Monitoring Analysis

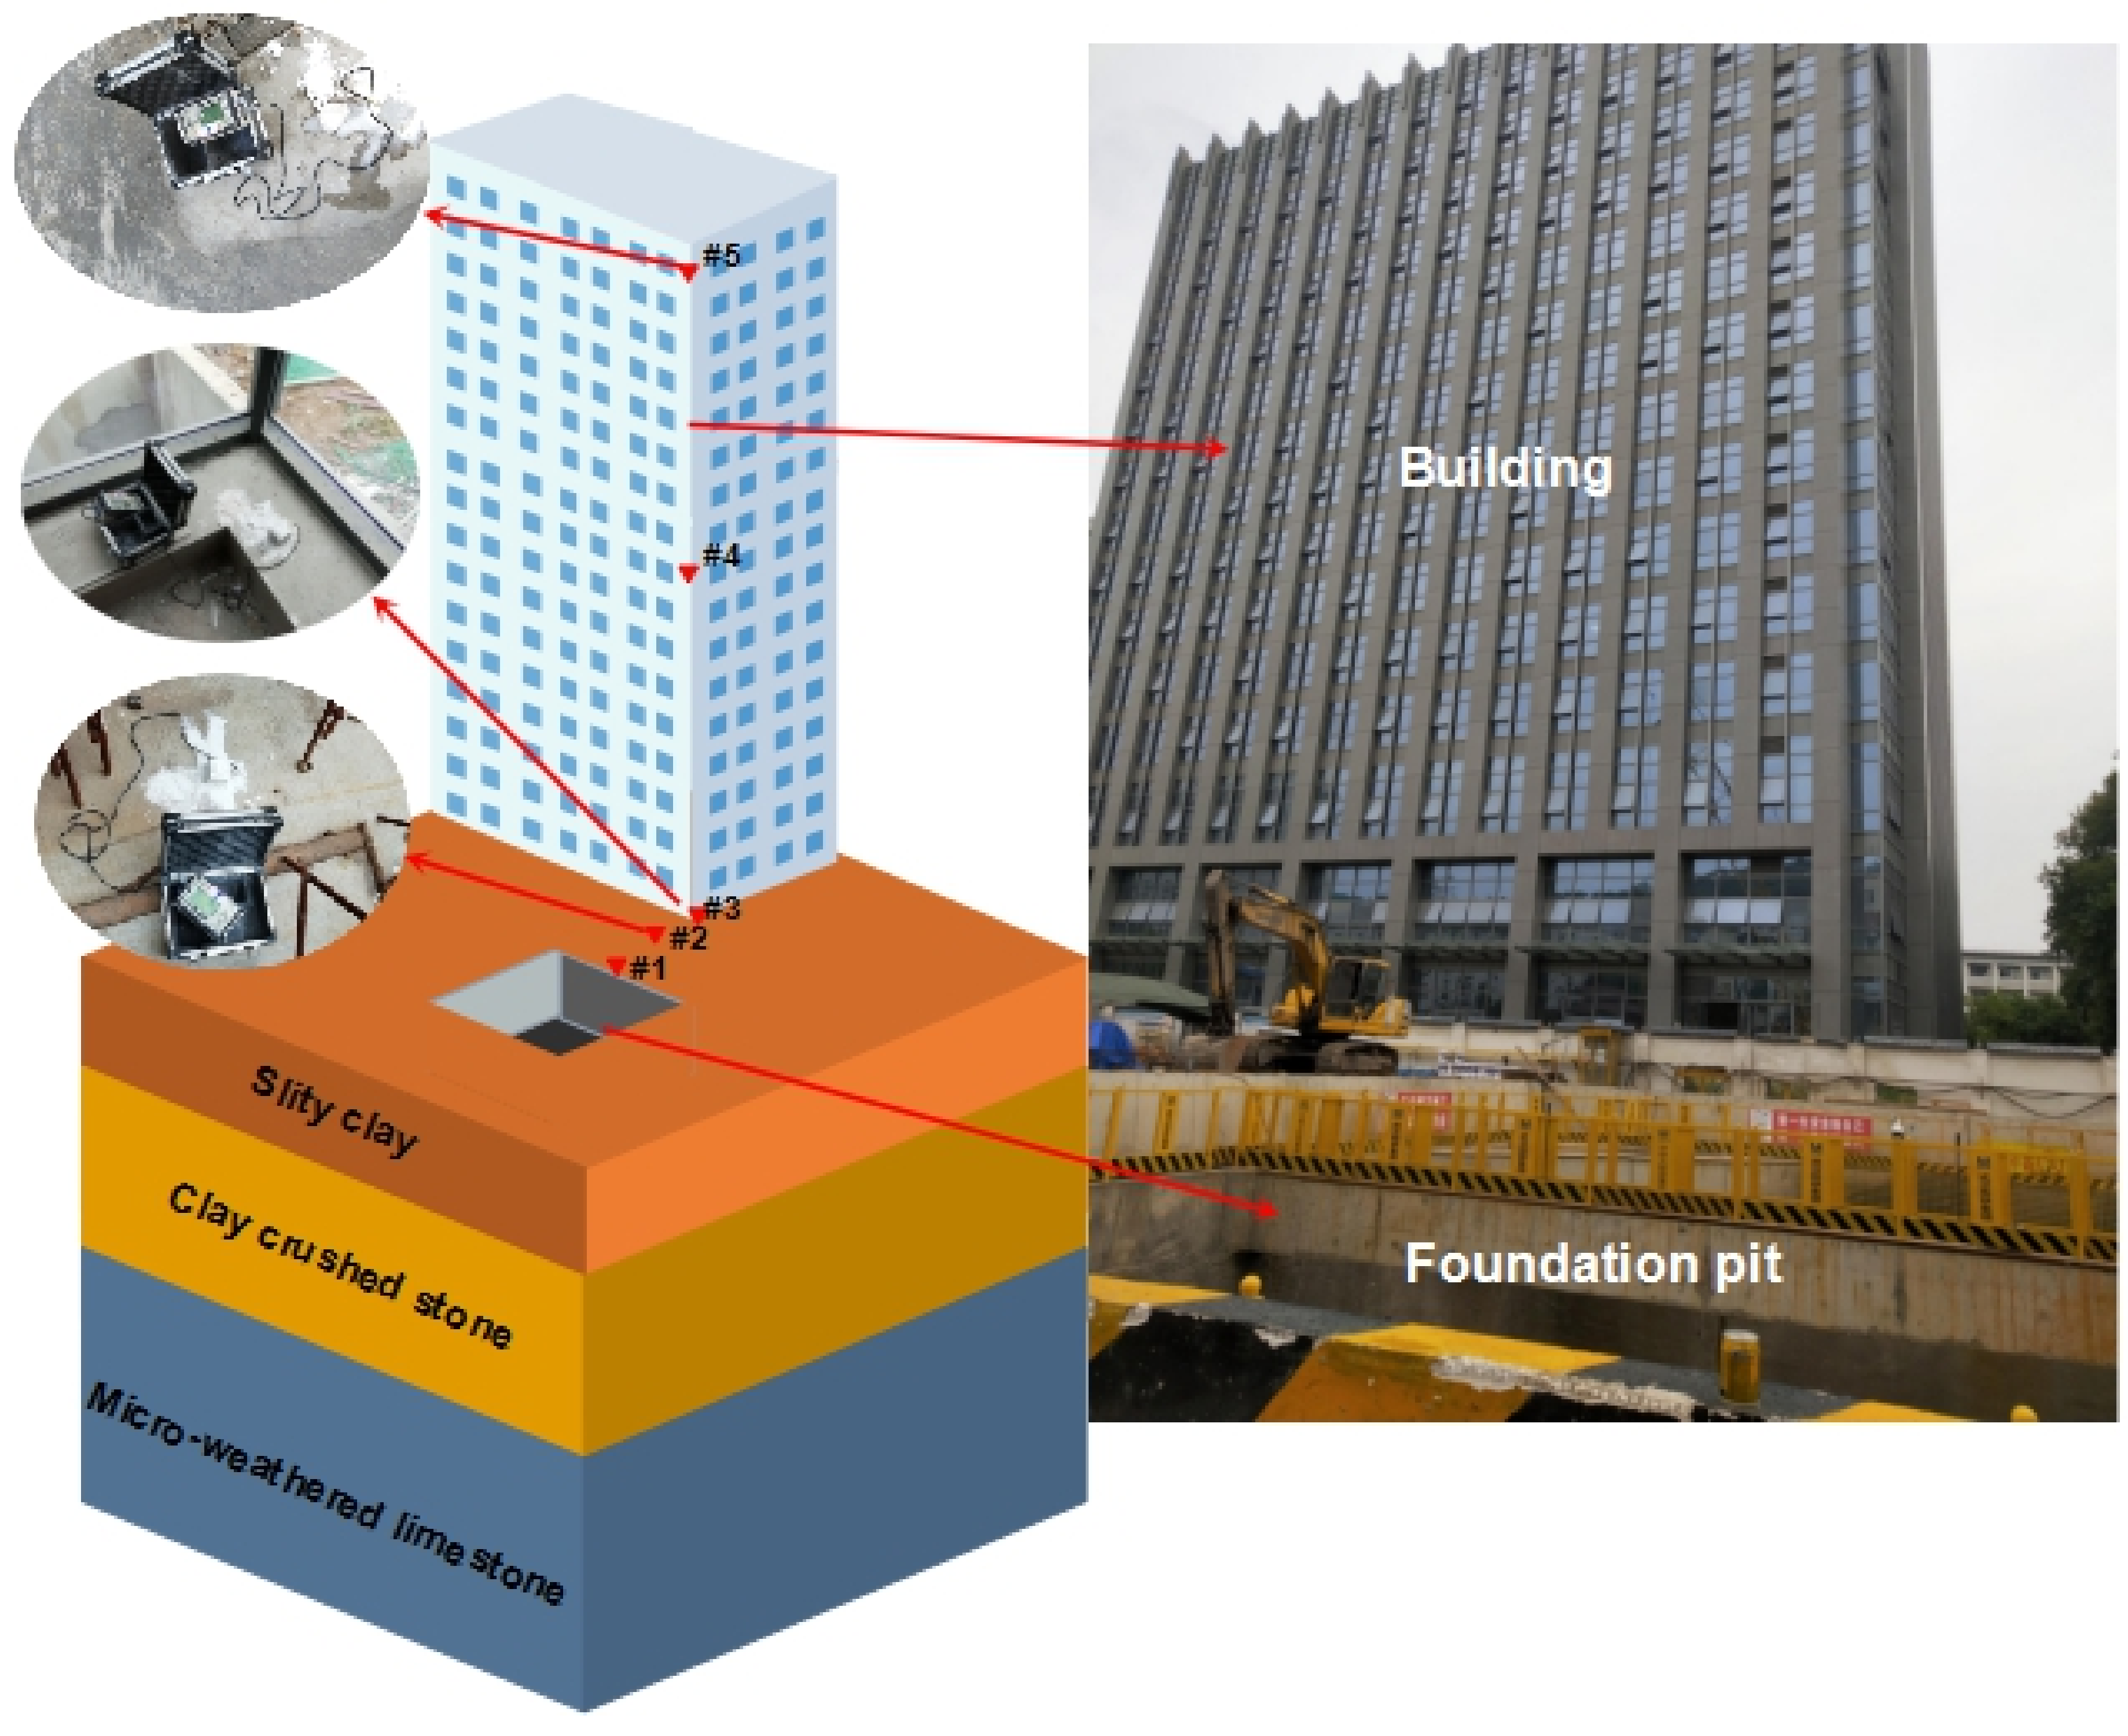
In order to carry out efficient blasting engineering, the influence of blasting vibration on the high-rise building near the foundation pit is controlled. Combined with the engineering geological condition and the surrounding environment, the monitoring scheme was designed, and the small explosive test was carried out. Duo to the elevation amplification effect, namely, the vibration velocity of the top floor of the building will be great than that of the first floor. Therefore, vibration monitoring points are set up on the first floor and the top floor. The arrangement of measuring points is shown in Figure 4. The TC-4850 blasting monitoring device with three vector detectors as well as the Blasting Vibration Analysis software are employed to monitor the vibration velocity induced by the explosion. A total of five blasting experiments are carried out. The first two experiments adopt small charge and the vibration velocity measured in the field experiments is relatively small. Then the charge in one delay is increased to 6 kg and 8 kg. Meanwhile, the working condition with the same charge and different excavation depth is created to analyze the impact of excavation depth on high-rise building.

3.1. Experiments Results and Analysis

The results of vertical vibration velocity recorded from five blasting experiments are shown in Table 1. Table 2 shows the vibration velocity of each component of the monitoring points in the building.
It can be seen from the data in Table 2 that the vibration velocity in the horizontal direction is much lower than that in the vertical direction. The horizontal vibration velocity also decreases with the decrease of detonation center distance and the increase of explosives. The radial vibration velocity pointing to the detonation center is greater than the tangential vibration velocity perpendicular to the direction.
The blasting test results show that, under the same dosage, the amplification factor of vibration velocity of high-rise buildings does not increase with the increase of depth. The vibration velocity of high-rise buildings has obvious amplification effect, and its amplification factor is between 1.19 and 1.26. In stress wave transmission, the vibration velocity in high-rise building is not simply increased with the increase of floors, the vibration velocity of the ninth floor is dramatically smaller than that of the first floor and the top floor. According to the test results, the dominant frequency of the monitoring points 3–5 of the building is mostly concentrated in 20~30 Hz, while the natural vibration frequency of buildings is concentrated in 1~5 Hz. Therefore, the natural vibration frequency of the building is far less than the frequency of blasting seismic wave [21]. Therefore, the vibration caused by shaft excavation blasting cannot cause the resonance of high-rise buildings, which indicates that the construction of this blasting project is safe for high-rise buildings.
From the perspective of structural stiffness. As high-rise buildings rise in height, structural stiffness decreases. The lower the stiffness is, the higher the vibration velocity is. Because the stiffness of the first floor is greater than that of the top floor. When the blasting stress wave increases with the increase of floors, the influence of the gradual increase of the detonation center distance is greater than that of the decrease of stiffness, and then the attenuation effect is more obvious. When the floor continues to rise, the influence of stiffness reduction is greater than that of core distance increase, so the vibration velocity will increase with the rise of the floor.
According to the field test data, the vertical velocity component of blasting vibration is larger than the horizontal velocity component [22].

3.2. Blasting Vibration Attenuation Rule and Establishment of Prediction Model

According to the results of literature on the vibration attenuation law of rock blasting [23,24], it can be seen that the blasting seismic wave will be affected and attenuated during the ground propagation process. The blasting depth of foundation pit also affects the propagation of blasting stress wave in rock and soil. Table 3 presents the main variables of blasting stress wave attenuation.
Dimensional analysis of Buckingham’s theorem [25], the PPV of the soil surface can be expressed as
v = Φ ( Q , μ , c , ρ , r , d , a , f , t )
where variables Q, r, and c are independent and satisfy the following formulas according to Buckingham’s Pi-Theorem in dimension analysis.
π = v Q α r β c γ ,   π 1 = μ Q α r β c γ ,   π 2 = ρ Q α r β c γ , π 3 = d Q α r β c γ , π 4 = a Q α r β c γ ,     π 5 = f Q α r β c γ ,   π 6 = t Q α r β c γ
where α , β , and γ are undetermined coefficients. Based on the dimensional homogeneous theory, then
π = v c ,   π 1 = μ r ,   π 2 = ρ Q r 3 , π 3 = d r ,   π 4 = a r 1 c 2 ,   π 5 = f r 1 c ,   π 6 = t r c 1
Substituting Equation (3) into Equation (1) finds,
v c = Φ ( μ r , ρ Q r 3 , d r , a r 1 c 2 , f r 1 c , t r c 1 )
Parameter π7 obtained from π2, π3 and π4, such as,
π 7 = ( π 2 1 3 ) β 1 π 3 β 2 = ( ρ 3 r Q 3 ) β 1 ( d r ) β 2
where β1 and β2 are unknown exponents of π2 and π3, respectively.
Let ρ and c be constants, according to Equation (4), the relation between v and v ( 1 Q 1 / 3 r 1 ) β 1 ( d r ) β 2 is
ln v = α 1 + β 1 ln ( Q 3 r ) + α 2 + β 2 ln ( d r )
Let ln v 0 = α 1 + β 1 ln ( Q 3 r ) , then
ln v 0 = α 1 + ( β 1 ln Q ) / 3 β 1 ln r
where α1, α2, and α3 are given coefficient in the transformation of the formula. −β1lnr indicates that PPV is inversely proportional to r. α1 + (β1lnQ)/3 indicates the influence of explosive medium and explosive mass.
Let ln k 1 = ln α 1 , then
v 0 = k 1 ( Q 3 r ) β 1
Equation (8) is the Sadovski’s formula without considering foundation pit excavation depth variation [26]. Substituting Equation (8) into Equation (6) finds,
ln v = ln v 0 + α 2 + β 2 ln ( d r )
Let: ln k 2 = ln α 2 , then Equation (9) can be expressed as
v = k 1 k 2 ( Q 3 r ) β 1 ( d r ) β 2
Let k = k 1 k 2 , the PPV prediction model representing the foundation pit surface is as follows:
v = k ( Q 3 r ) β 1 ( d r ) β 2
where k is the influence coefficient of the field site, β1 is the PPV attenuation coefficient, and β2 is the effect coefficient of foundation pit blasting source depth.
According to Equation (11), vibration velocity is affected by the explosion depth of foundation pit.
Based on the analysis above. The regression analysis of the test results in Table 2 is carried out by using Formula (11). The surface PPV prediction model representing the impact of foundation pit blasting excavation is obtained. In addition, contrastive analysis is conducted between the classical Sadovski’s formula and the obtained prediction model (Equation (11)) to evaluate the rationality and accuracy of the obtained prediction model based on the correlation coefficient of the fitting curve. The analysis results are shown in Table 4.
It can be seen from Table 4.
  • According to the newly obtained prediction model (Equation (11)), the surface PPV fitting degree calculated is higher than the classical Sadovski formula. This indicates that PPV attenuation is more complex due to the influence of foundation pit depth, and the classical formula has certain limitations. The prediction model can well reflect the law of vibration wave affected by depth during the ground propagation of foundation pit blasting.
  • According to the PPV regression analysis, the newly established PPV prediction model has a high accuracy, and the correlation coefficient is 0.857. Therefore, the following prediction model can be used to calculate the PPV of foundation pit blasting surface.
    v = 99.42 ( Q 3 r ) 1.453 ( d r ) 0.41

4. Verification and Analysis of Numerical Model of High-Rise Building

FEM software ANSYS/LS-DYNA with numerical model and parameters reliability verification is used to simulate the dynamic response of adjacent high-rise building and analyze the relation between vibration velocity and the floors of the high-rise building under blasting vibration.

4.1. Establishment of Numerical Model

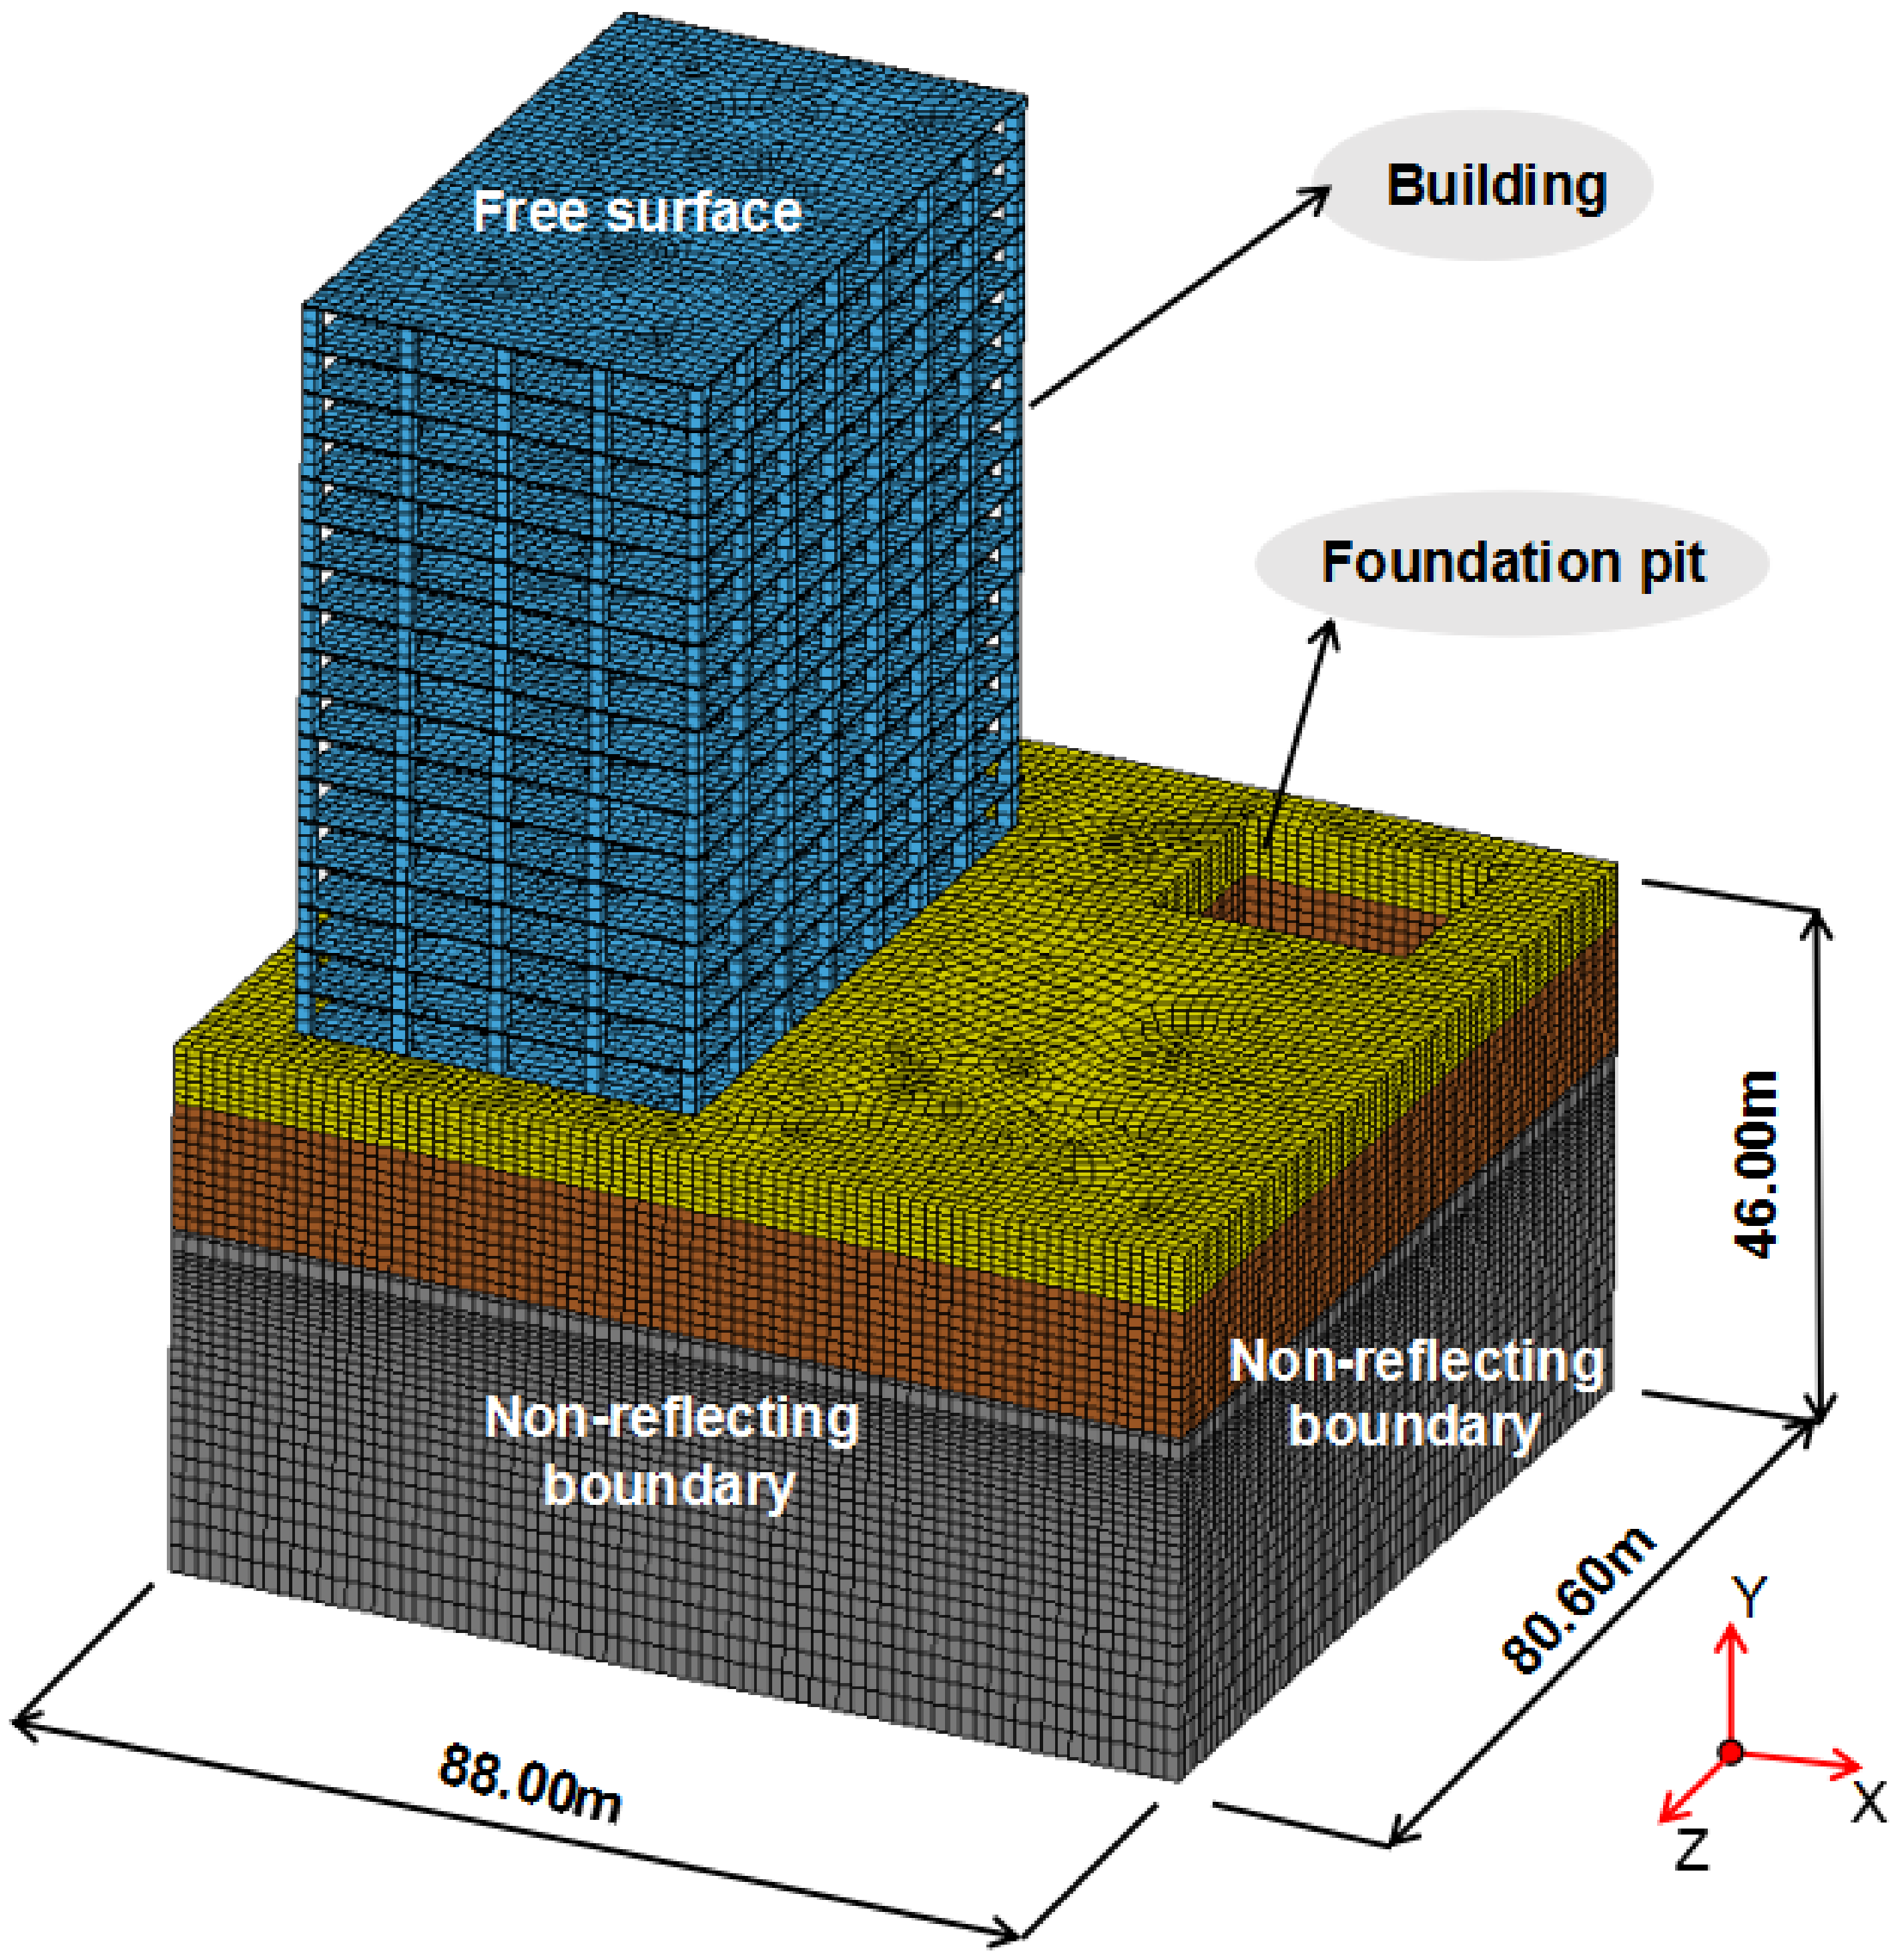
According to the engineering geology, blasting experiment parameters and the location of the building and the foundation pit (Section 2). The 8-node solid 164 element is used to establish the model. The euler grids are adopted to simulate the explosive, plugging mud, rock, and soil. The thickness of rock and soil layer is 46 m, the overall model size is 80.6 m × 88.0 m × 109.75 m, the floor slab thickness is 25 cm, and column section of the floor beam is 120 cm × 120 cm. In the blasting experiment parameters, the blasthole diameter is 40 mm, the pitch of holes is 2 m, the blasthole depth is 2 m, the coupling charge height is 1.5 m, and the bottom priming in one delay time and cm-g-μs unit is adopted, the time step is 400 ms. The surface of soil and the high-rise building are set to be the free surface and all other surfaces are set to be non-reflecting boundary. The model dimension, boundary condition, and mesh zoning are shown in Figure 5.

4.2. Parameters of Numerical Simulation

4.2.1. Parameters of High-Rise Building

Since it is difficult to simulate the bond between concrete and the reinforcing steel bar. So, the equivalent modulus method is used to model the reinforced concrete materials. The method of equivalent modulus of reinforced concrete from Shen et al. [27] and Kong et al. [28] is applied to the study of the elastic-plastic constitutive model of reinforced concrete. The reinforced concrete is equivalent to a homogeneous material. According to the ratio of reinforcement, the contribution of reinforcement to element stiffness is calculated and then distributed to the whole element. The element is regarded as a continuous homogeneous material. The elastic modulus of reinforced concrete is
E e = E c + A s A t E s = E c + W E s
where Ee—elastic modulus of reinforced concrete. Ec—elastic modulus of concrete. Es—elastic modulus of steel. As—sectional area of reinforcement. At—total area of member section. W—reinforcement ratio.
According to the related standard, the reinforcement of beam: 0.2% ≤ Wbeam ≤ 2.5%. The reinforcement of column: 0.5% ≤ Wcolumn ≤ 5%. In this paper, the reinforcement ratio of beams and columns is set at 2.5%. The steel bar is HRB400, whose elastic modulus is 200 GPa, the concrete is C40, whose elastic modulus is 32.5 GPa. Substituting all parameters into Equation (12), and the equivalent modulus of reinforced concrete is 37.5 GPa. Due to the small charge in the experiment, the reinforced concrete is inelastic deformation stage and can be regarded as elastic material under small blasting loads. So, *MAT_ELASTIC is used to simulate the reinforced concrete. Its parameters are shown in Table 5.

4.2.2. Explosive Parameters

No. 2 rock emulsion explosive is used in this blasting, and the maximum charge for a single hole is 2 kg. *MAT_HIGH_EXPLOSIVE_BURN is used to simulate the explosive. The specific parameters of explosives are shown in Table 6. The explosive density is 1100 kg/m and the explosive detonation velocity is 4000 m/s. The Jones–Wilkins–Lee (JWL) EOS is a model for predicting explosion pressures over a large range [29]. It can be expressed as follows:
p = A ( 1 ω R 1 V ) e R 1 V + B ( 1 ω R 2 V ) e R 2 V + ω E 0 V
where V is relative specific volume; E0 is internal energy per unit volume; and A, B, R1, R2, and ω are material constants.

4.2.3. Rock Parameters

Since the rock and soil are discontinuous and inhomogeneous, so the bedrock cannot be directly described by mathematical equations at present. The rock is usually assumed to be continuous and isotropic in general engineering numerical simulation. In this paper, the geotechnical mass is postulated to be a homogeneous elastoplastic material, and the constitutive model is simplified.
The bedrock in the foundation pit is less weathered limestone. *MAT_ PLASTIC_ KINEMATIC material model was used to simulate the less weathered limestone. Its mechanical properties are shown in Table 7.

4.2.4. Soil Parameters

*MAT_DRUCKER_PRAGER material model was used to simulate the silty clay and the clay crushed stone, and its mechanical parameters are shown in Table 8.

4.3. Reliability Verification of Numerical Model and Parameters

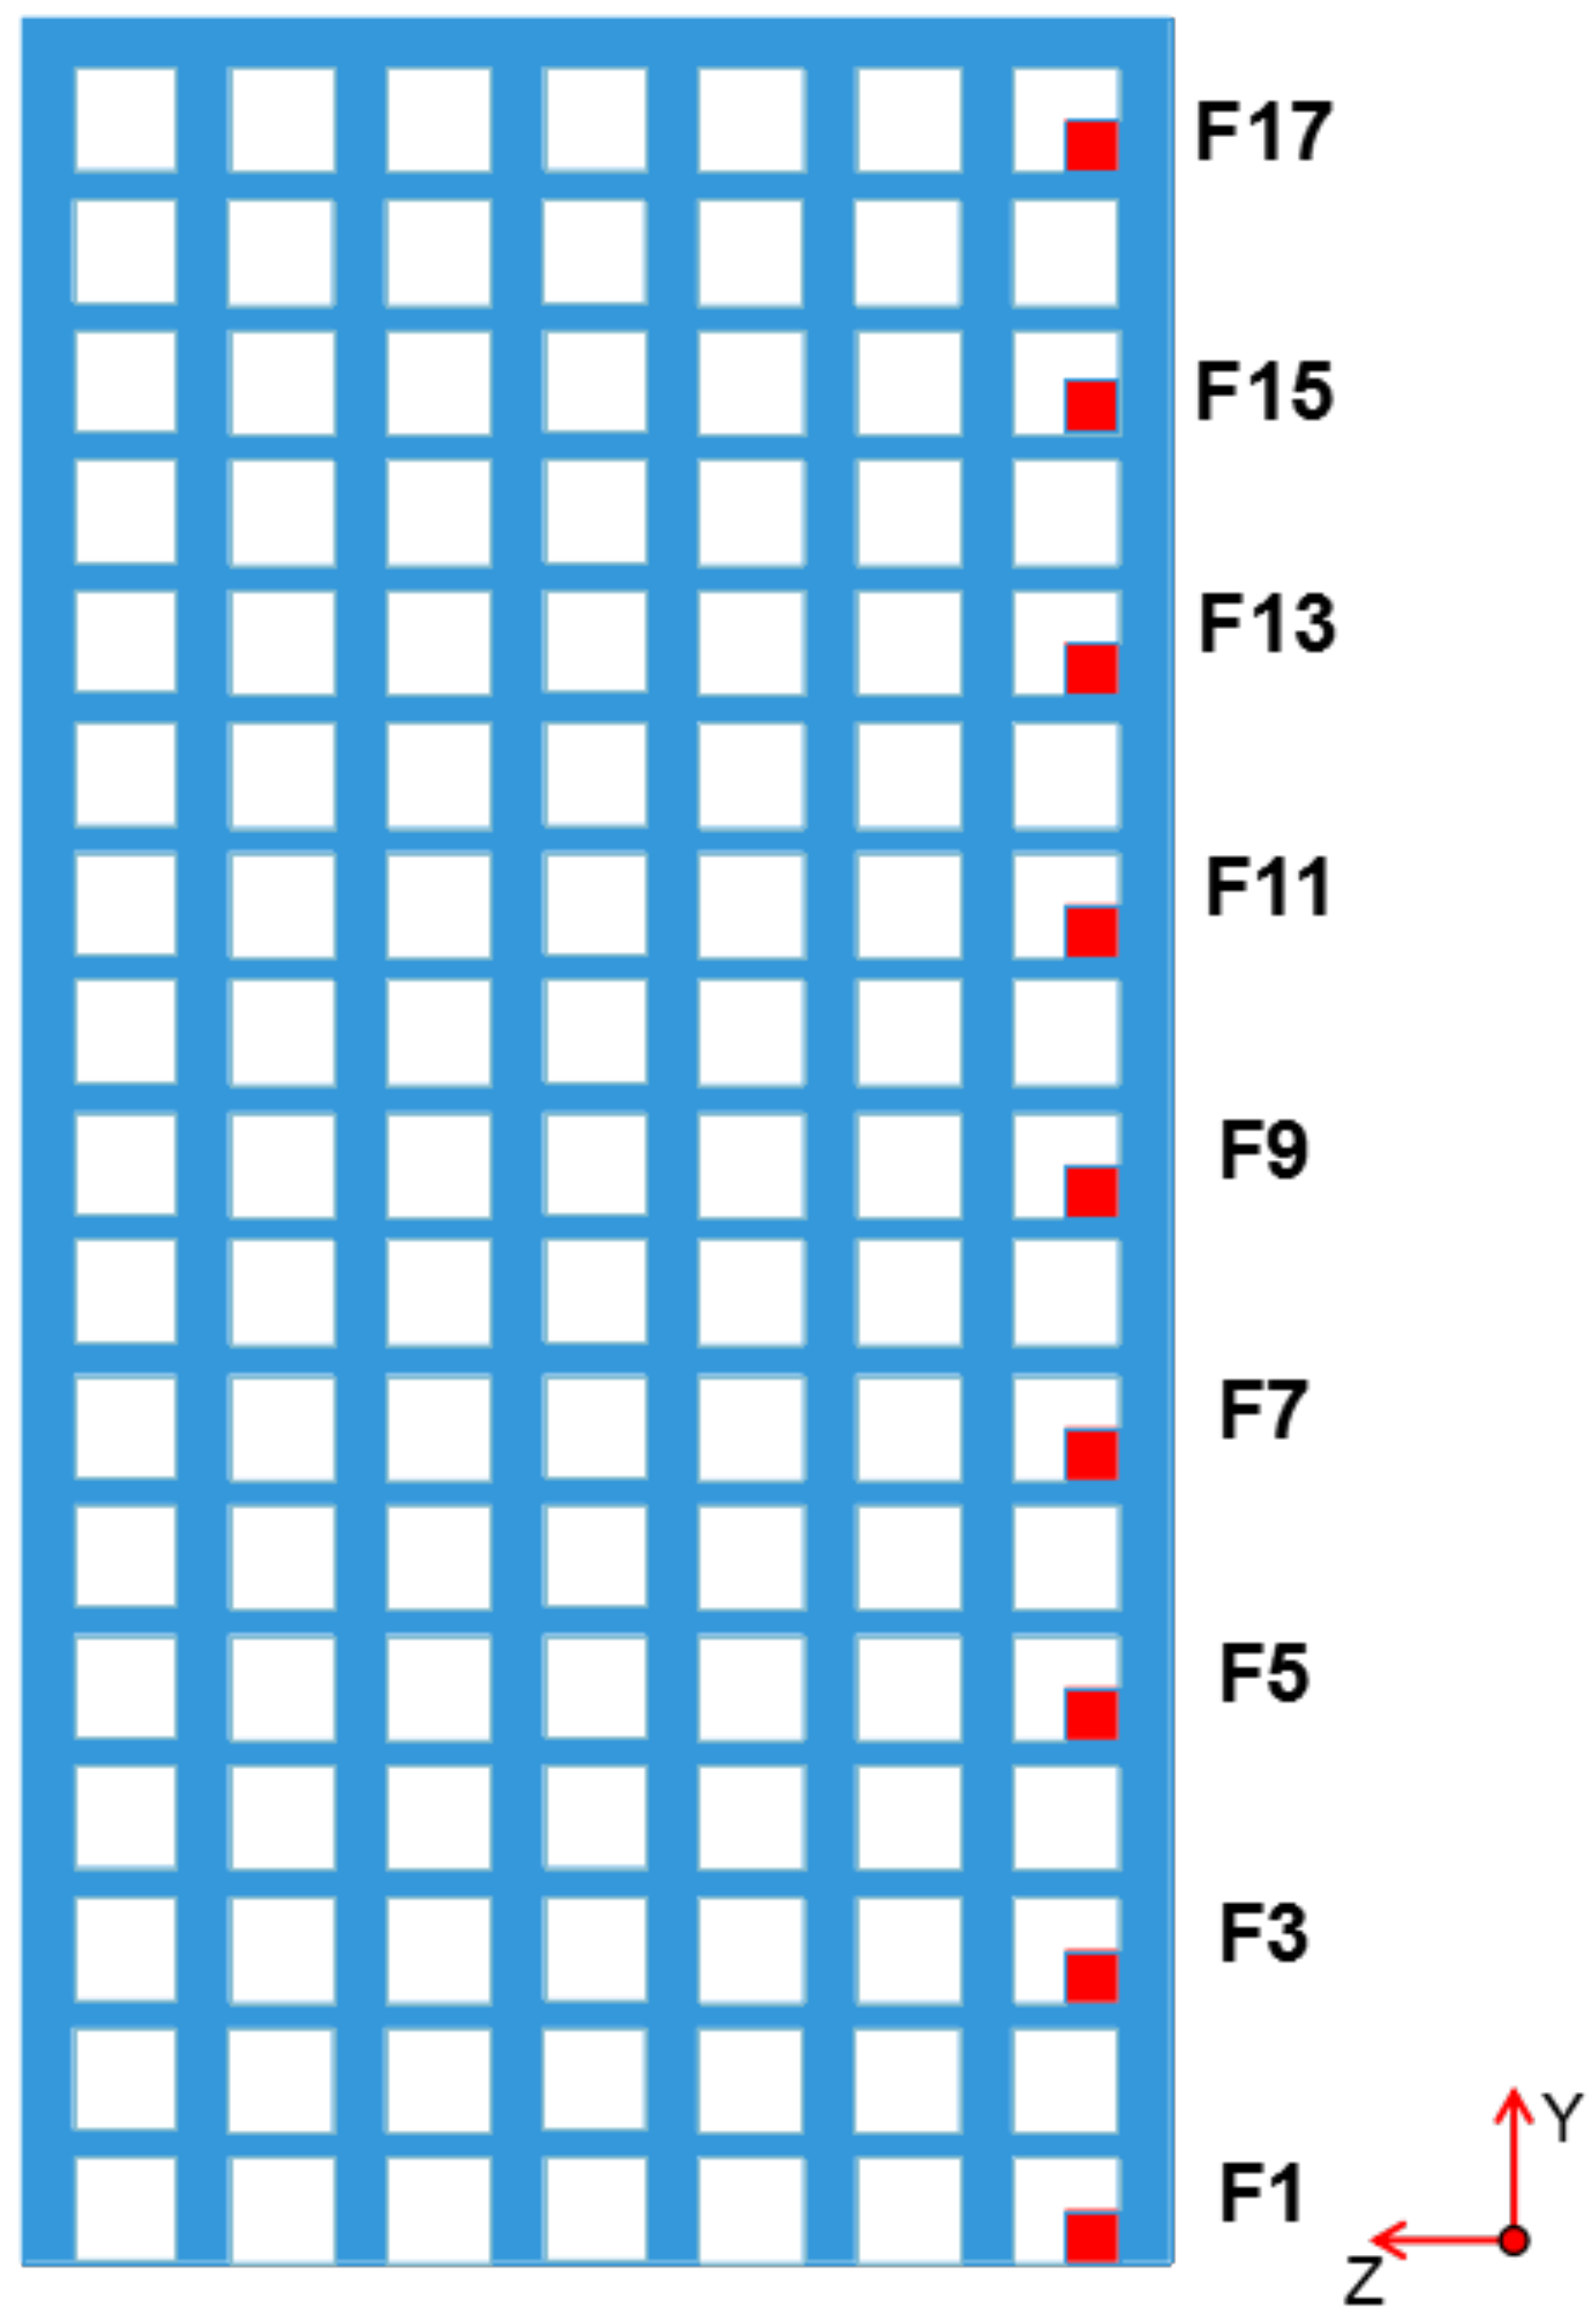
To obtain well-documented experiment data which can reflect the variation of PPV along the floor for the verification of the numerical model, as is shown in Figure 6, a series of monitoring points in the corner post where the is the joint of beam and column toward the blasting side of the building are placed with vibration velocity devices.
The blasting vibration velocity encompasses components in three directions. The vertical PPV is on average 11 times higher than the horizontal PPV [30]. Moreover, the vertical constraint degree of the structure is much higher than that of the horizontal constraint degree. The natural frequency of the structure in the vertical direction is closer to the main frequency of the blasting vibration than that in the horizontal direction. Therefore, the vibration of the structure in the vertical direction is mainly analyzed in this paper.
The vertical vibration velocity of point F12 on the top floor and point F1 on the first floor is shown in Table 9. The maximum rate of deviation between the simulation results and field experiments from Table 1 is only 8.12%, which is the basically same. Moreover, the vibration velocity curves on the first floor both in numerical simulation and field experiments are contrastively drawn in Figure 7. The results show that the numerical simulation method is feasible to study the performance of adjacent high-rise buildings under blasting vibration during foundation pit construction.

5. Influence of Blasting Vibration on the High-Rise Frame Building

According to the safety regulation for blasting of China (GB6722-2014), the allowable safety vibration velocity of industrial and commercial building is 2.5–5.0 cm/s. Considering that the high-rise building is newly built, and its structural resistance has not reached the maximum value. Suppose the allowable safety velocity of the high-rise building in this paper is 2 cm·s−1 to ensure the safety of the high-rise building. Due to the elevation amplification effect, and the amplification factor is between 1.19 and 1.26 (Section 3). So, the allowable safety velocity on the first floor is 1.59 cm·s−1 when the amplification factor is considered to be 1.26. The vibration velocity on the first floor which is the velocity on the ground surface conforms to the empirical formula Equation (12). So, the maximum charge in a single delay can be obtained by Equation (12) which is 15 kg. Therefore, in the numerical model, the depth of the foundation pit is set to be 20 m, and the maximum charge in a single delay is set to be 15 kg.

5.1. Modal Analysis of Natural Frequency of High-Rise Buildings

The widely sued model analysis method is utilized to verify whether the natural frequency of high-rise buildings is close to the dominant frequency of the blast wave which may cause resonance damage to the building [31], and expressed as
M S U ¨ + K S U = 0
where MS is the mass matrix, KS is stiffness matrix, U is displacement vector, U ¨ is mass of nodal acceleration.
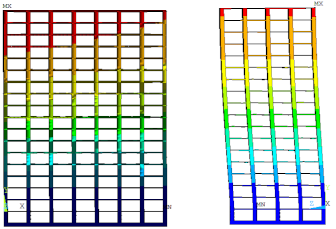
ANSYS/Multiphysics is employed to conduct the model analysis and determine the vibration characteristics of the high-rise building, namely the natural frequency and the mode of vibration. The element is selected as SOILD185, and the numerical model in the model analysis is the same as that in the ANSYS/LS-DYNA. The first 3rd order natural vibration frequencies and mode of vibration are calculated and shown in Table 10.
The code and standard [32] stipulated that basic natural vibration period of reinforced concrete shear wall structures can be calculated according to the following formula:
T = 0.03 + 0.03 H B 3
where T is the natural vibration period of the house. H is the total height of the building (m). B is the width of the building (m). In this project, the high-rise building: H = 63.75 m, B = 51.6 m.
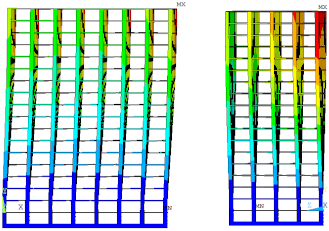
The natural frequency calculated by the equation is 1.839 Hz, which is close to the first 3rd order natural vibration frequencies in modal analysis. According to the research [33], the natural frequency calculated by the code and standard in China is slightly larger than the natural frequency of the building. Therefore, the modal analysis results are accurate. It can be seen from the figure in the Table 10 that the period of the first 3rd mode of vibration is getting smaller. The period of the 1st and 2nd mode of vibration is obviously larger than the period of the 3rd mode of vibration, proving that the higher the order of the mode is, the smaller the period of the structure is, which conforms to the mode theory. Based on the first 3rd order mode of vibration diagram from Table 9, it can be seen that the first order mode of vibration of the building is an overall translation along the Z direction, the second order mode of vibration is the translation along the X direction, and the third mode of vibration twist about the Y-axis. Moreover, Table 9 shows that the natural frequency is less than 2 Hz, which is far smaller than the blasting seismic wave frequency of 20–30 Hz. The high-rise buildings will not resonate during blasting excavation of the foundation pit.

5.2. Vibration Velocity Analysis of the High-Rise Building

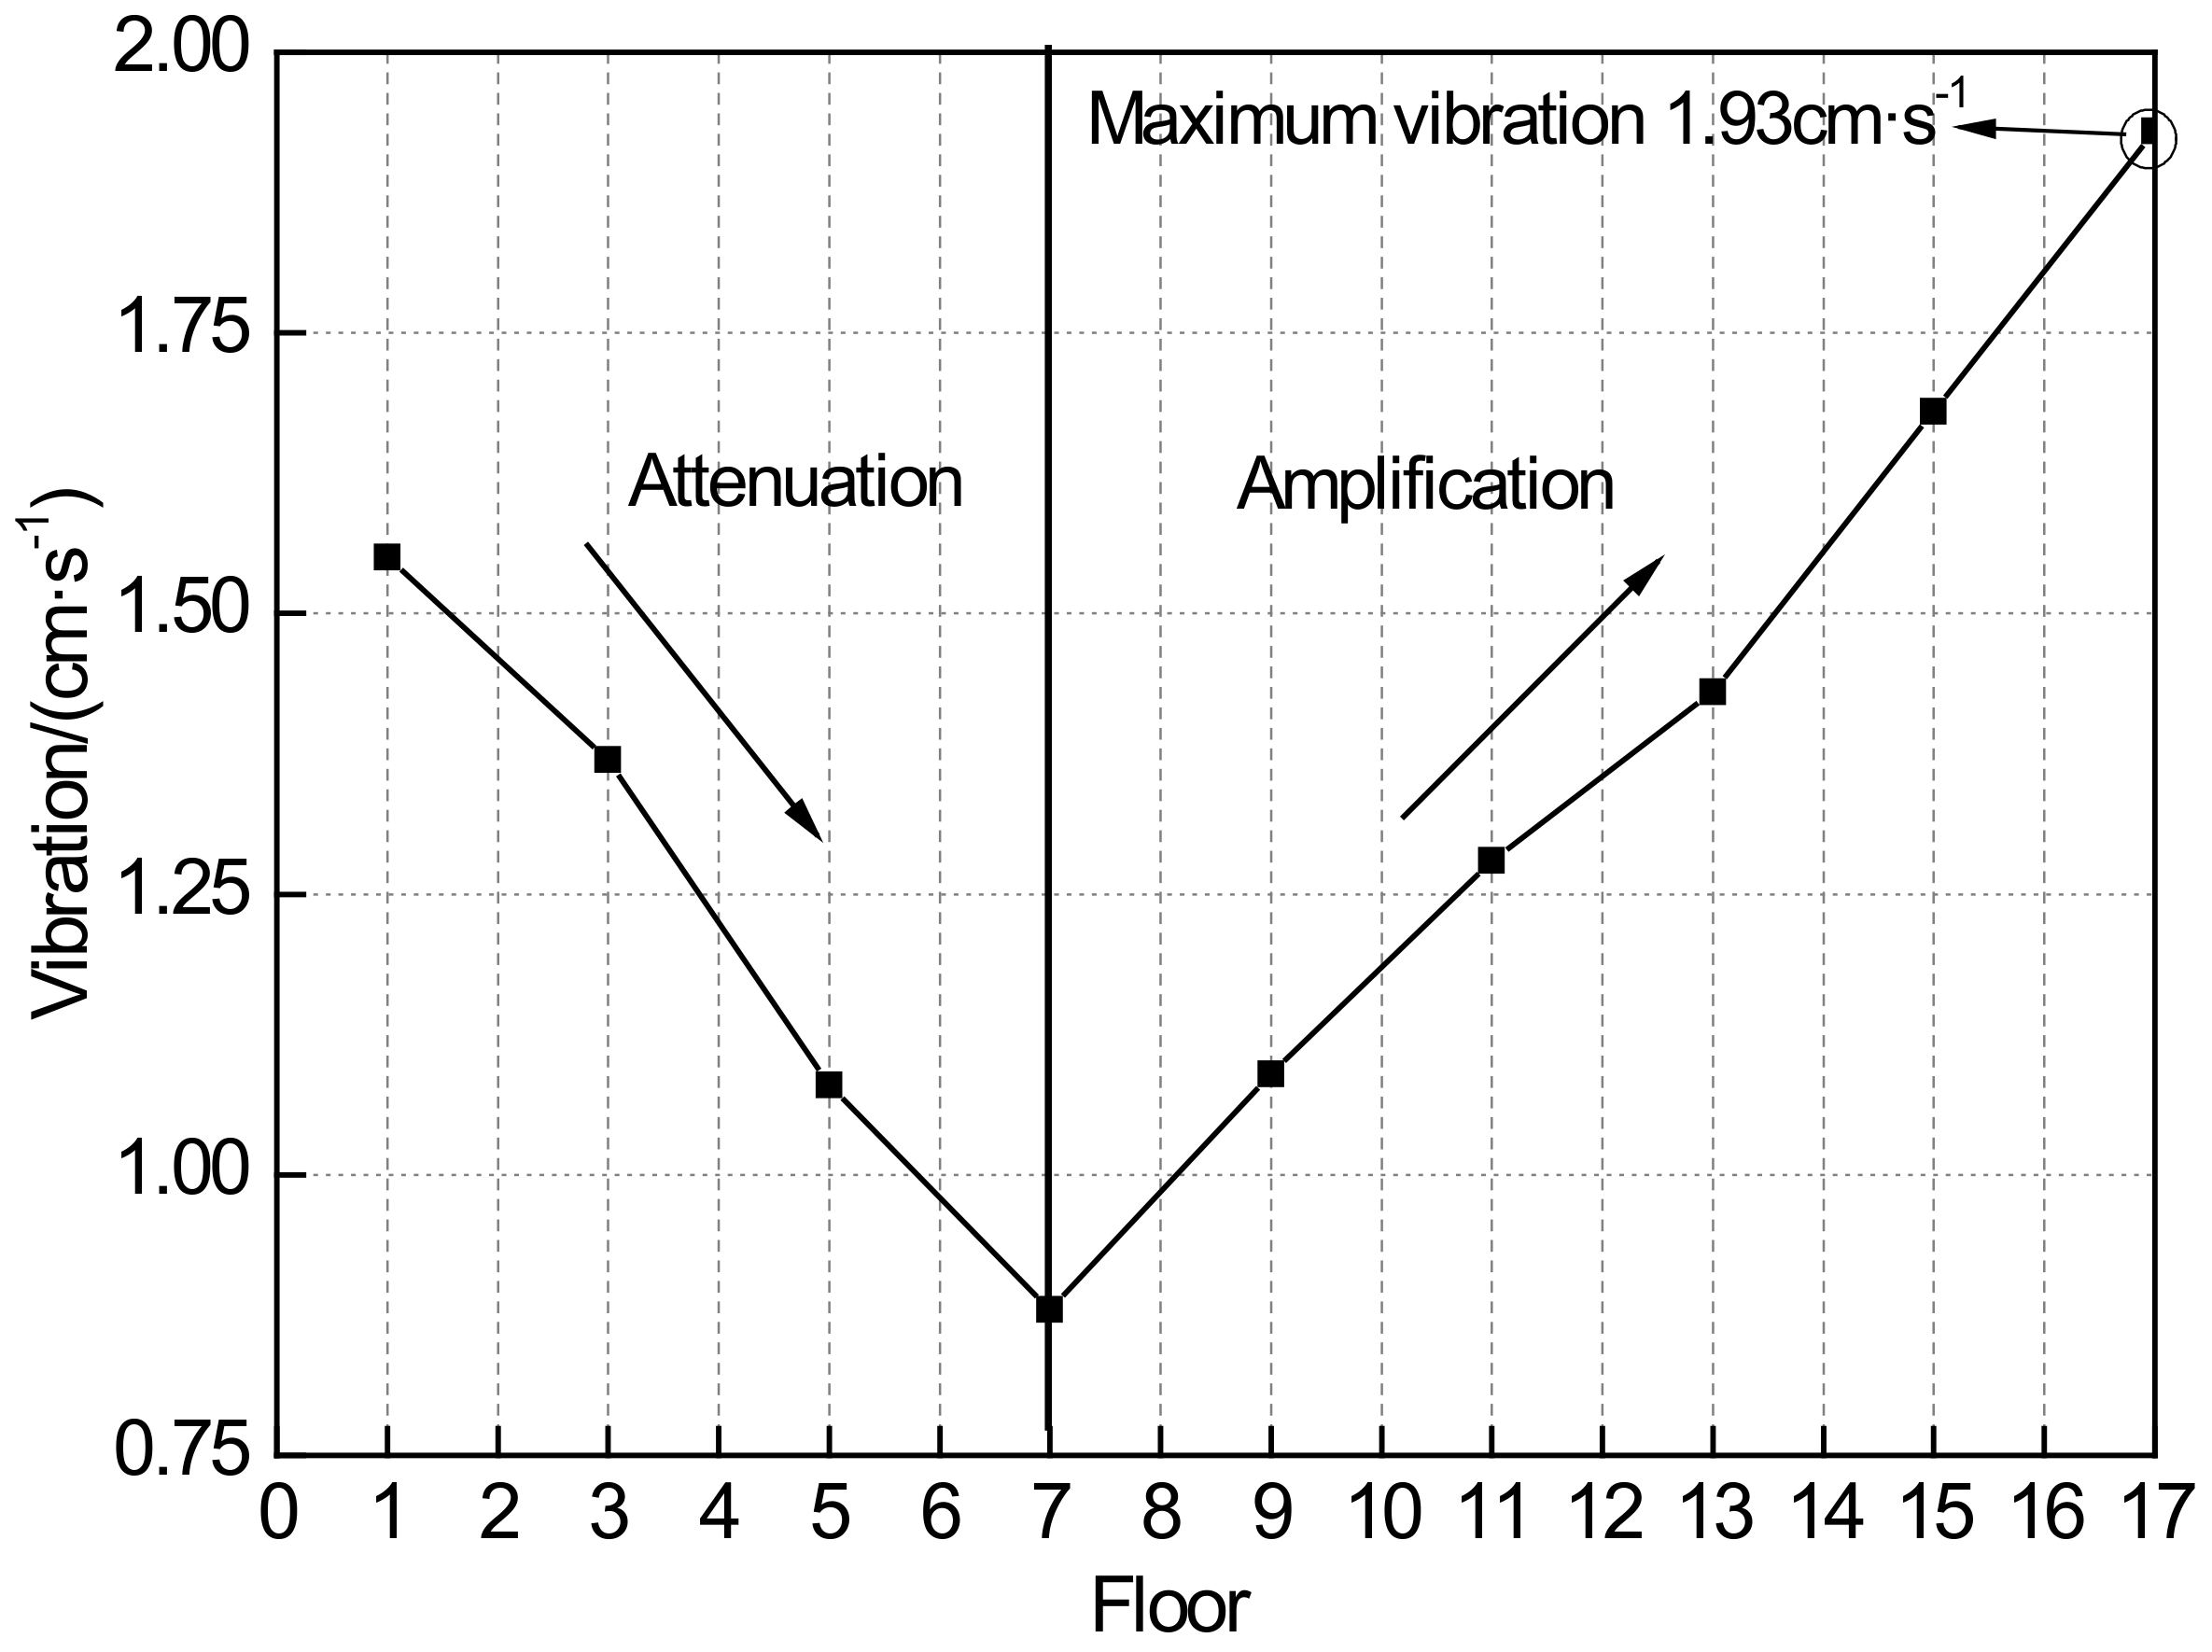
When the excavation depth is 20 m and the explosive charge is 15 kg, the vibration velocity of each monitoring point in Figure 6 is shown in Figure 8. As shown in Figure 8, the vibration varies with the floor, and it can be found that the vertical vibration velocity at the monitoring point first decreases and then increases with the rise of the floor; that is, the seventh floor is the dividing line. Floors 1–7 are located in the attenuation zone of vibration velocity, and floors 7–17 are located in the amplification zone of vibration velocity. The vibration velocity of the first floor is 1.55 cm·s−1, and the error of deviation is only 2.5% compared with the vibration velocity of the first floor of 1.59 cm·s−1 predicted by the Equation (11). The vibration velocity of the top floor is 1.93 cm·s−1, less than the control velocity of 2 cm·s−1, so the predicted maximum charge in a single delay meets the requirements of allowable safety velocity.
From the Figure 8, it is indicated that under the impact of the blasting vibration wave, the variation of vibration velocity of high-rise buildings is divided into two processes: attenuation and amplification. No elevation amplification effect occurs in the floor 1–7, the PPV still attenuation with the increase of the standoff distance, which is compliant with the classical Sadovski’s formula [34].
When the floor is 7–17, the elevation amplification effect occurs, and the vibration velocity is in the amplification stage, with the PPV increase of 119%. The main reason for the amplification area is that the top floor is less constrained, then the amplification effect appears compared with the bottom floor with a larger constraint. Moreover, with the rise of the floor, namely the elevation, the attenuation effect of blasting vibration velocity is gradually less significant than the amplification effect, and then the amplification effect is dominant. Therefore, there is an obvious elevation amplification effect for the high-rise building [35].
The reason of this phenomenon is analyzed from the aspect of structural stiffness. As high-rise buildings rise in height, structural stiffness decreases [36]. The lower the stiffness is, the higher the vibration velocity is. Because the stiffness of the first floor is greater than that of the top floor. When the blasting stress wave increases with the increase of floors, the influence of the gradual increase of the detonation center distance is greater than that of the decrease of stiffness, and then the attenuation effect is more obvious. When the floor continues to rise, the influence of stiffness reduction is greater than that of core distance increase, so the vibration velocity will increase with the rise of the floor.

5.3. Dynamic Stress Analysis of the High-Rise Building

Reinforced concrete materials are heterogeneous, anisotropic, and multicomponent, and because of the existence of steel bars, it is more difficult to determine its dynamic characteristics. The existence of steel bars in reinforced concrete materials will enhance the tensile strength of concrete. Since the tensile strength of concrete is much lower than the compressive strength, tensile strength plays a decisive role in the reliability and safety of structures in many cases. Therefore, it is feasible to select the ultimate tensile strength as the safety criterion of concrete to evaluate the dynamic response of structures under blasting vibration load.
Under dynamic load, the ultimate tensile strength of concrete is higher than that of static concrete [37]. According to Chinese current code for Seismic Design of Hydraulic Buildings [38], the standard value of dynamic tensile strength of concrete can be 10% of the standard value of dynamic compressive strength. The concrete used in high-rise buildings is C40 and its ultimate tensile strength is 2.39 MPa. Therefore, under the action of dynamic load, the ultimate tensile strength is 2.63 MPa.
The monitoring points in Figure 6 are selected to discuss the relationship between the dynamic tensile stress σ and the floor n. The peak dynamic stress of each monitoring point was fitted, as shown in Figure 9. Equation (17) can be obtained through the fitting results. The curve in Figure 9 is the decreasing part of the curve in quadratic Equation (17). The results show that the detonation distance is inversely proportional to the stress. The maximum dynamic tensile stress is 100.1 kPa at the monitoring point F1, which is smaller than the ultimate dynamic tensile strength of reinforced concrete (2.63 MPa). The stress is very small and has a limited impact on the building structure.
σ ( n ) = 0.3482 n 2 + 0.2386 n + 99.865

5.4. Prediction Model of Blasting Vibration Velocity of High-Rise Buildings

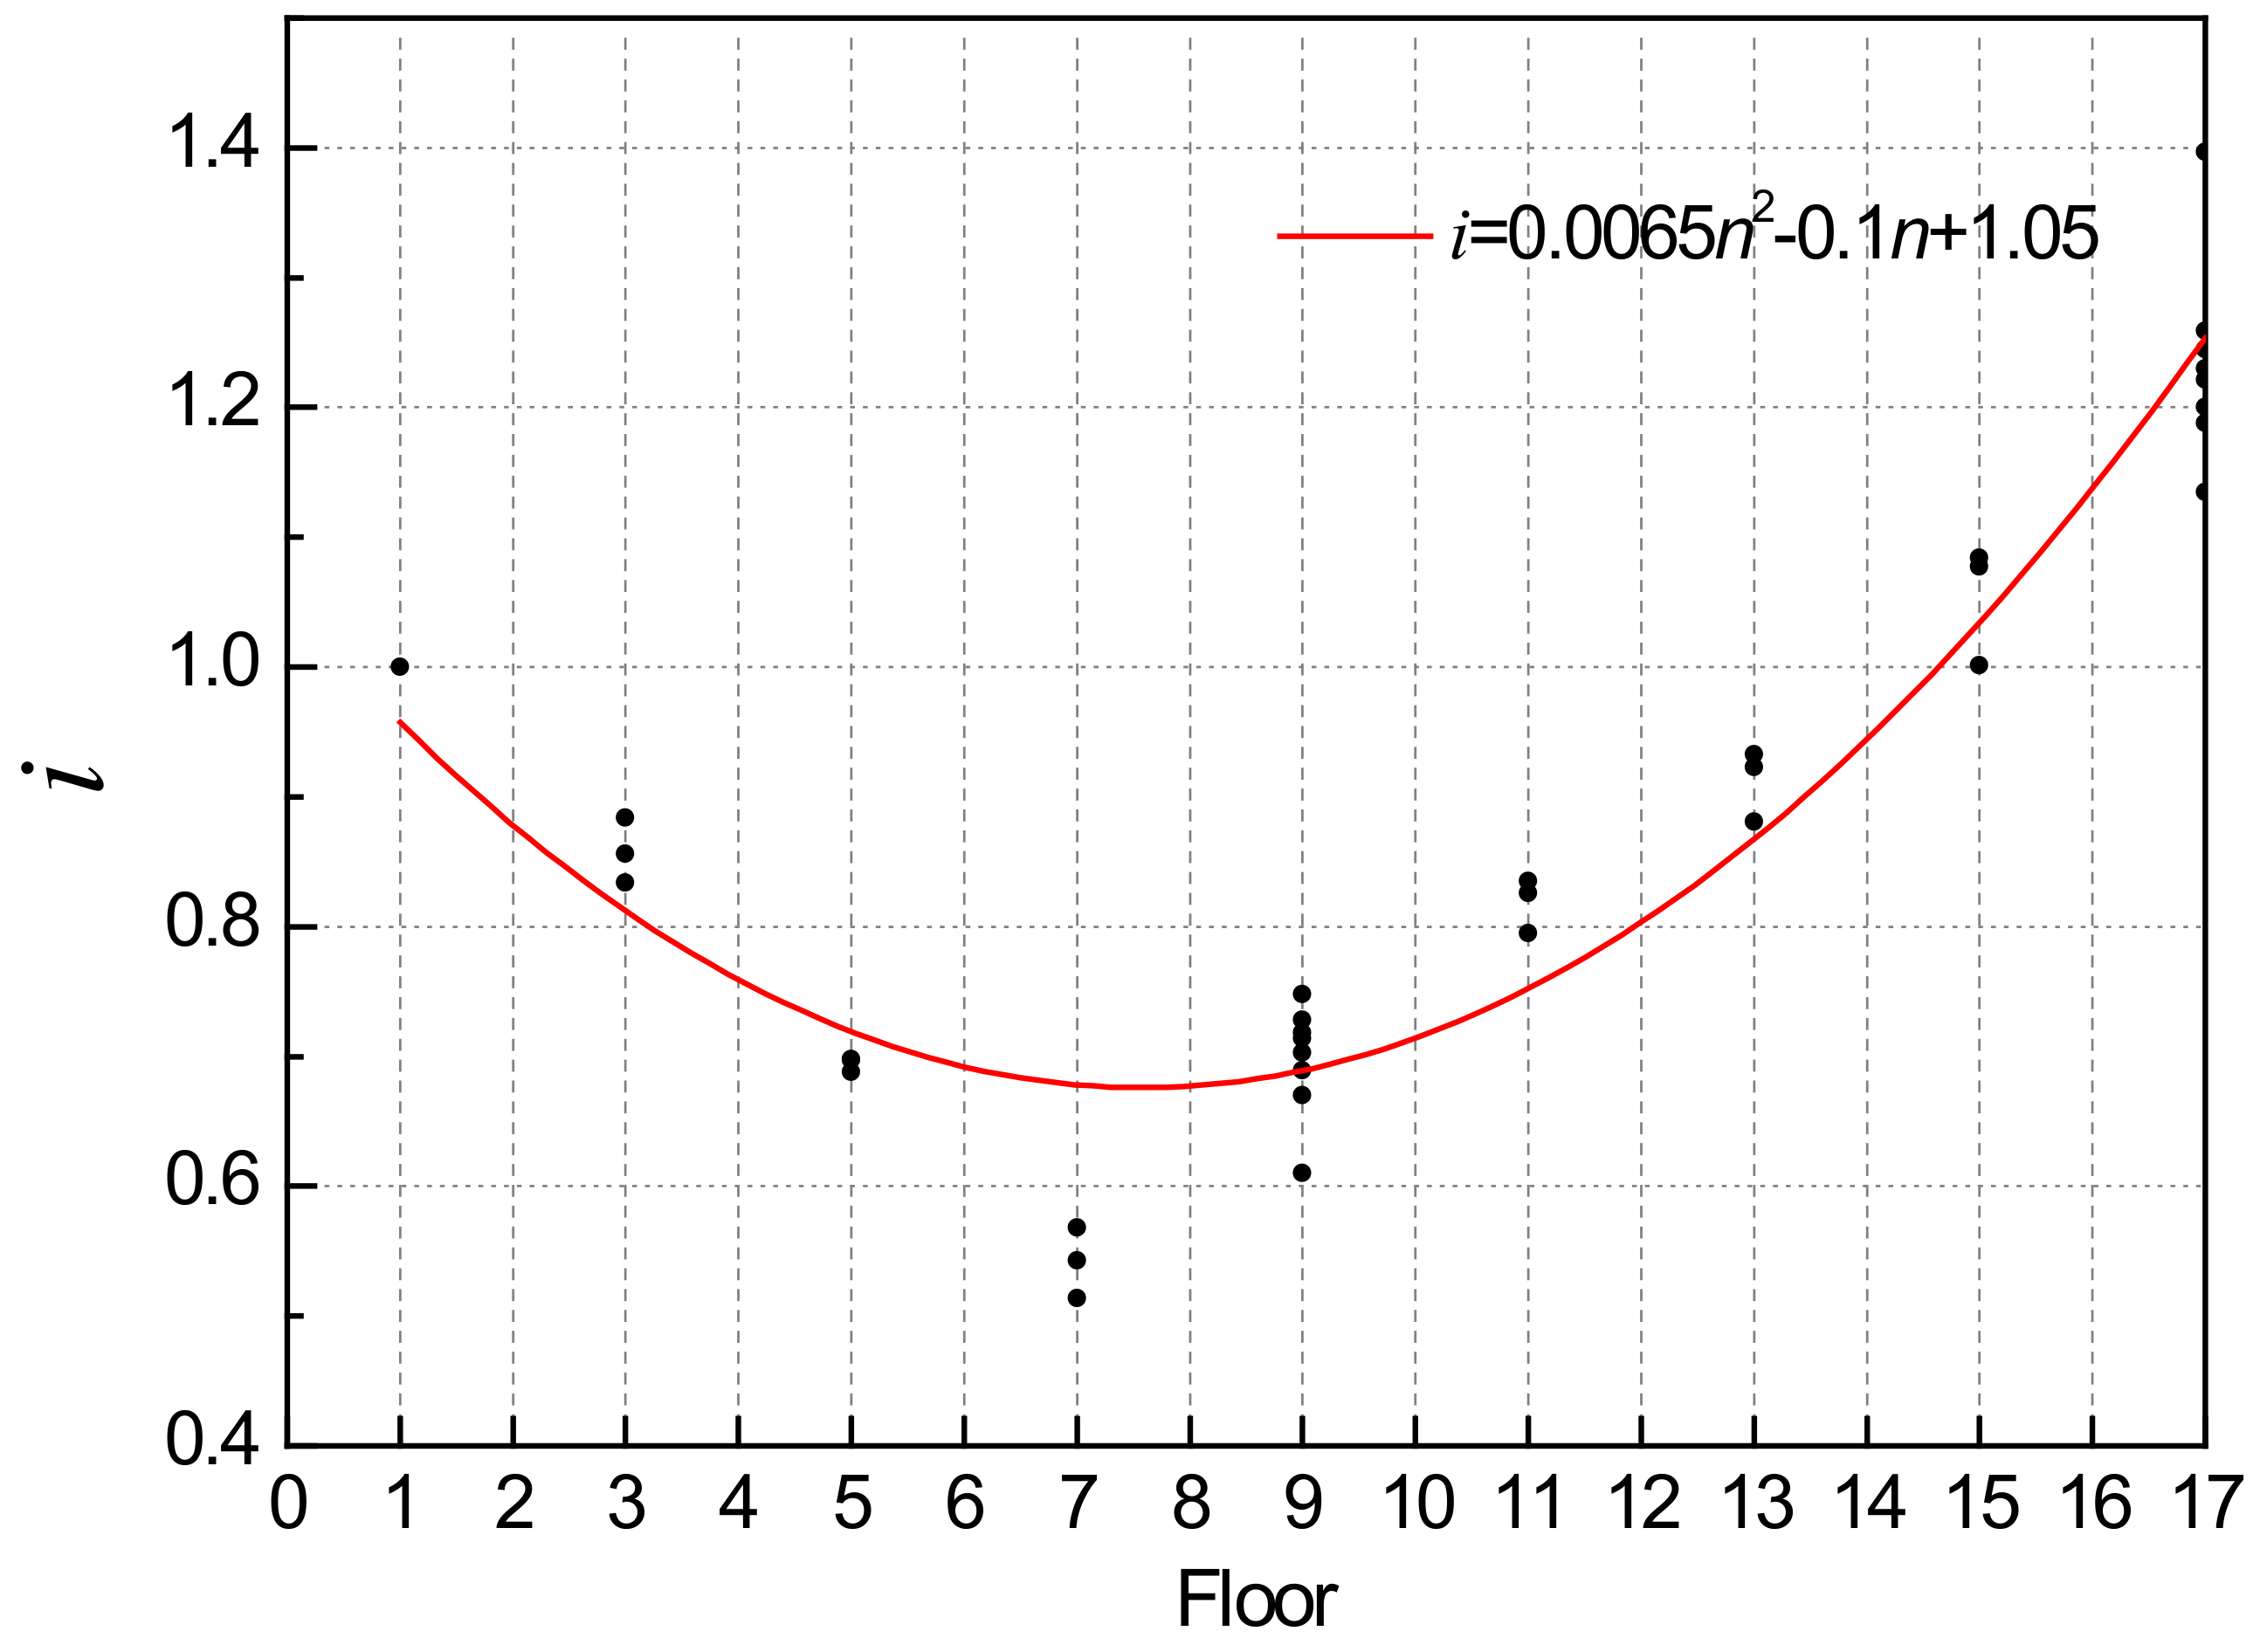
To analyze the response characteristics of high-rise buildings under different blasting conditions, the blasting dynamic numerical calculation test is carried out by combining the above numerical model and parameters. The vertical blasting vibration velocity of floors from F1 to F17 in numerical simulation was monitored. Meanwhile, in the process of analysis, the vibration velocity (VF1) of the first floor is assumed to be a known quantity, and the ratio of the vibration velocity of the other floors (VFn) to the vibration velocity of the first floor (VF1) is defined as the coefficient i, and then the coefficient i was fitted to the floors. The fitted data included five working conditions of the blasting experiment, and three working conditions of the numerical model: 1. Excavate to 20 m depth and charge 15 kg; 2. Excavate to 16 m depth and charge 6 kg; and 3. Excavate to 22 m depth and charge 15 kg, and the data of eight working conditions were shown in Table 11. The quadratic parabola obtained by fitting is shown in Figure 10, and the formula is as Equation (18), R2 = 0.915, indicating a high correlation between floor and ratio i. Based on Figure 10, it can be seen that the fitting curve of floor n to raito i conforms to parabolic law. The ratio i of the F1–F7 floor gradually decreases and is less than one. When the floor continues to rise, the ratio i starts to increase and reaches the maximum value in the F17 floor. Which is consistent with the previous conclusions. In other words, the vibration velocity of the high-rise building is not simply amplified under the blasting vibration condition. F1–F7 floor is located in the vibration velocity attenuation zone, while the F7–F17 floor is located in the vibration velocity amplification zone. Analysis and prediction should be conducted for the protection of the adjacent buildings in practical engineering.
i = V F n V F 1 = 0.0065 n 2 0.1 n + 1.05
where i is the ratio of vibration velocity between other floors and the first floor. n is the floor. VFn is the vibration velocity of floor n. VF1 is the vibration velocity of the first floor.
Because of the particularity of the frame structure, the vibration velocity does not conform to the attenuation model of surface vibration velocity proposed above. Moreover, the first floor of the building is located on the ground surface in accordance with Equation (12), so the first floor can be assumed to be a known quantity and Equation (19) can be obtained. Therefore, when working conditions are given, the vibration velocity of each floor can be predicted with the following equation:
V F n = 99.42 ( Q 3 r ) 1.453 ( d r ) 0.41 ( 0.0065 n 2 0.1 n + 1.05 )

6. Conclusions

In order to ensure the safety of high-rise buildings under blasting vibration of foundation pit excavation, based on the relevant Regulations of China, the response characteristics of structures under blasting vibration are analyzed through blasting test and numerical simulation, so as to guide the actual engineering construction. The article research conclusion is as follows.
It can be concluded from the experiments that the vertical vibration velocity of high-rise buildings has elevation amplification effect during the blasting seismic wave propagation of blasting vibration. Furthermore, the vibration velocity of the top floor is 1.19 to 1.26 times that of the first floor. Under the same charge and different excavation depth, as the excavation depth increases, the vibration velocity is still decreasing, and the amplification of high-rise buildings is unaffected. The maximum error between the field measured data and the numerical simulation results is 8.12%, which verifies the reliability of the numerical simulation. The numerical simulation results show that the vibration velocity of high-rise buildings decays first and then increases with the increase of floors during the propagation of blasting seismic waves. The model analysis shows that the natural frequency of the building is much lower than that of the blasting seismic wave. Therefore, under the action of blasting vibration, high-rise buildings will not have resonance damage. The empirical attenuation formula of PPV was fitted by field measurement, and the maximum charge in a single delay is 15 kg. Based on this formula, the vertical PPV of the top floor reached 1.93 cm·s−1, less than the allowable safety velocity of 2 cm·s−1. Under this working condition, the blasting vibration has limited influence on the building, the 15 kg can be used as the maximum charge in a single delay for the protection of the construction of this project. The vibration velocity prediction model can be used to predict the vibration velocity of high-rise buildings.

Author Contributions

Investigation, Y.Z.; resources, C.Z. and N.J.; data curation, T.W. and B.Z.; writing—original draft preparation, N.J. and Y.Z.; writing—review and editing, N.J. and Y.Z.; supervision, C.Z.; project administration, N.J.; funding acquisition, N.J. All authors have read and agreed to the published version of the manuscript.

Funding

The research was funded by the National Natural Science Foundation of China (Grant No. 41807265 and No. 41972286), and the Natural Science Foundation of Hubei Province of China (Grant No. 2019CFB224).

Acknowledgments

The authors greatly appreciate the comments from the reviewers, whose comments helped to improve the quality of the paper.

Conflicts of Interest

The authors declare no conflict of interest.

List of Symbols

PPVPeak particle velocity
EeElastic modulus of reinforce concrete
EsElastic modulus of steel
AtThe total area of member section
WbeamThe reinforcement of beam
ρDensity
EThe elastic modulus
E0Internal energy per unit volume
σ0The yield stress
βHardening parameter
ΦThe internal friction angle
MSMass matrix
UDisplacement vector
TThe natural vibration period of the house
BThe width (m) of the building
f ¯ The dynamic tensile strength
γ The strain rate of concrete.
iThe ratio of vibration velocity between other floors and the first floor
σ(n)The dynamic tensile stress of floor n
VF1The vibration velocity of the first floor
JWLJones–Wilkens–Lee parameters
EcElastic modulus of concrete
AsThe sectional area of reinforcement
WReinforcement ratio
WcolumnThe reinforcement of column
μThe Poisson ratio
VThe relative specific volume respective
R1, R2,
A, B, ω
Material constants
EtanMinimum bending stiffness
RKFThe shape parameter of failure surface
CThe cohesion
KSStiffness matrix
U ¨ Mass of nodal acceleration
HThe total height of the building
αThe growth factor of dynamic tensile strength
f s t The static tensile strength
γ s t The quasi-static strain rate of concrete
nThe floor
VFn The vibration velocity of floor n.
VF17 The vibration velocity of the seventeenth floor

References

  1. Smith, P.D.; Rose, T.A. Blast loading and building robustness. Prog. Struct. Eng. Mater. 2002, 4, 213–223. [Google Scholar] [CrossRef]
  2. Ngo, T.; Mendis, P.; Gupta, A.; Ramsay, J. Blast loading and blast effects on structures—An overview. Electron. J. Struct. Eng. 2007, 7, 76–91. [Google Scholar]
  3. Henrych, J.; Abrahamson, G.R. The dynamics of explosion and its use. J. Appl. Mech. 1980, 47, 218. [Google Scholar] [CrossRef]
  4. Singh, P.K.; Roy, M.P. Damage to surface structures due to blast vibration. Int. J. Rock Mech. Min. Sci. 2010, 47, 949–961. [Google Scholar] [CrossRef]
  5. Athanasopoulos, G.A.; Pelekis, P.C. Ground vibrations from sheetpile driving in urban environment: Measurements, analysis, and effects on buildings and occupants. Soil Dyn. Earthq. Eng. 2020, 19, 371–387. [Google Scholar] [CrossRef]
  6. Zhu, W.H.; Ming, F.; Li, X.P. Elevate effect analysis of frame structure response under blasting seismic wave. J. Coal 2011, 36, 411–415. [Google Scholar]
  7. Roy, P.P. Technical Note Characteristics of ground vibrations and structural response to surface and underground blasting. Geotech. Geol. Eng. 1998, 16, 151–166. [Google Scholar] [CrossRef]
  8. Dowding, C.H.; Aimone-Martin, C.T.; Meins, B.M.; Hamdi, E. Large structure response to high frequency excitation from rock blasting. Int. J. Rock Mech. Min. Sci. 2018, 111, 54–63. [Google Scholar] [CrossRef]
  9. Ma, G.; Hao, H.; Zhou, Y. Assessment of structure damage to blasting induced ground motions. Eng. Struct. 2000, 22, 1378–1389. [Google Scholar] [CrossRef]
  10. Gad, E.F.; Wilson, J.L.; Moore, A.J.; Richards, A.B. Effects of mine blasting on residential structures. J. Perform. Constr. Facil. 2005, 19, 222–228. [Google Scholar] [CrossRef]
  11. Xie, C.Y.; Luo, Z.Q.; Jia, N.; Xiong, L.X.; Cheng, G.H. Dynamic effects of open blasting vibration on adjacent buildings and measures for vibration reduction. J. Vib. Shock 2013, 32, 187–193. [Google Scholar]
  12. Børvik, T.; Hanssen, A.G.; Langseth, M.; Olovsson, L. Response of structures to planar blast loads–A finite element engineering approach. Comput. Struct. 2009, 87, 507–520. [Google Scholar] [CrossRef]
  13. Wu, C.; Hao, H.; Lu, Y. Dynamic response and damage analysis of masonry structures and masonry infilled RC frames to blast ground motion. Eng. Struct. 2005, 27, 323–333. [Google Scholar] [CrossRef]
  14. Sielicki, P.W.; Sumelka, W.; Łodygowski, T. Close Range Explosive Loading on Steel Column in the Framework of Anisotropic Viscoplasticity. Metals 2019, 9, 454. [Google Scholar] [CrossRef] [Green Version]
  15. Jayasooriya, R.; Thambiratnam, D.P.; Perera, N.J.; Kosse, V. Blast and residual capacity analysis of reinforced concrete framed buildings. Eng. Struct. 2011, 33, 3483–3495. [Google Scholar] [CrossRef]
  16. Dhakal, R.P.; Pan, T.C.; Irawan, P.; Tsai, K.C.; Lin, K.C.; Chen, C.H. Experimental study on the dynamic response of gravity-designed reinforced concrete connections. Eng. Struct. 2005, 27, 75–87. [Google Scholar] [CrossRef]
  17. Dhakal, R.P.; Pan, T.C. Response characteristics of structures subjected to blasting-induced ground motion. Int. J. Impact Eng. 2003, 28, 813–828. [Google Scholar] [CrossRef]
  18. Bayraktar, A.; Türker, T.; Altunişik, A.C.; Sevim, B. Evaluation of blast effects on reinforced concrete buildings considering Operational Modal Analysis results. Soil Dyn. Earthq. Eng. 2010, 30, 310–319. [Google Scholar] [CrossRef]
  19. Lu, X.; Lu, X.Z.; Guan, H.; Ye, L.P. Collapse simulation of reinforced concrete high-rise building induced by extreme earthquakes. Earthq. Eng. Struct. Dyn. 2013, 42, 705–723. [Google Scholar] [CrossRef] [Green Version]
  20. Rezaei Rad, A.; Banazadeh, M. Probabilistic risk-based performance evaluation of seismically base-isolated steel structures subjected to far-field earthquakes. Buildings 2018, 8, 128. [Google Scholar] [CrossRef] [Green Version]
  21. Wang, X.G.; Yu, Y.L. On several problems of safety criterion for blasting vibration. Eng. Blasting 2001, 7, 88–92. [Google Scholar]
  22. Jiang, N.; Zhou, C. Blasting vibration safety criterion for a tunnel liner structure. Tunn. Undergr. Space Technol. 2012, 32, 52–57. [Google Scholar] [CrossRef]
  23. Jiang, N.; Gao, T.; Zhou, C.; Luo, X. Effect of excavation blasting vibration on adjacent buried gas pipeline in a metro tunnel. Tunn. Undergr. Space Technol. 2018, 81, 590–601. [Google Scholar] [CrossRef]
  24. Jiang, N.; Zhou, C.; Lu, S.; Zhang, Z. Propagation and prediction of blasting vibration on slope in an open pit during underground mining. Tunn. Undergr. Space Technol. 2017, 70, 409–421. [Google Scholar] [CrossRef]
  25. Langhaar, H.L. Dimensional Analysis and Theory of Models; Wiley: New York, NY, USA, 1951; Volume 2. [Google Scholar]
  26. AQSIQ. GB6722-2014 Safety Regulations for Blasting Beijing; China WaterPower Press: Beijing, China, 2014. [Google Scholar]
  27. Shen, X.P.; Wang, C.Y.; Zhou, L. A damage plastic constitutive model for reinforced concrete and its engineering application. Eng. Mech. 2007, 24, 122–128. [Google Scholar]
  28. Kong, D.D.; Zhao, Y.H.; Wang, P.; Zhang, S.Q. Equivalent Modulus Method in Finite Element Analysis of Reinforced Concrete Materials. J. Shenyang Jianzhu Univ. (Nat. Sci. Ed.) 2005, 21, 200–203. [Google Scholar]
  29. Yi, C.; Sjöberg, J.; Johansson, D. Numerical modelling for blast-induced fragmentation in sublevel caving mines. Tunn. Undergr. Space Technol. 2017, 68, 167–173. [Google Scholar] [CrossRef]
  30. Chen, Y.L.; Ma, J.J.; Li, Y.N.; Wang, L.F.; Tian, S.L. Numerical Simulation of Blasting Vibration Response of Structure Building Framework. Blasting 2018, 35, 154–160. [Google Scholar]
  31. Hosseini, M.S.; Cordisco, F.A.; Zavattieri, P.D. Analysis of bioinspired non-interlocking geometrically patterned interfaces under predominant mode I loading. J. Mech. Behav. Biomed. Mater. 2019, 96, 244–260. [Google Scholar] [CrossRef]
  32. Ministry of Construction, PRC. GB50009-2012 Load Code for Building Structures; China Building Industry Press: Beijing, China, 2012.
  33. Tan, D.X.; Zhou, Y.; Mi, S.T.; Yi, W.J.; Xie, L.M.; Jiang, Y.Z. Ambient vibration dynamic test and finite element analysis for high-rise buildings. China Civ. Eng. J. 2015, 9, 41–50. [Google Scholar]
  34. Xu, H.Z. Dynamic Buckling Study of Beam-Slab Structures under Impact Loading. Master’s Thesis, Dalian University of Technology, Dalian, China, 2001. [Google Scholar]
  35. Wu, X.; Zhang, Y.P.; Guo, Q.F. Influence of the Step Elevation on Blasting Seismic Wave. Appl. Mech. Mater. 2017, 858, 131–136. [Google Scholar] [CrossRef]
  36. Li, Y.; Wang, S.; Wei, L. Discussion on calculation methods of lateral stiffness of high-rise building structure. Build. Struct. 2020, 50, 44–49. [Google Scholar]
  37. Lu, Y.B.; Li, Q.M. About the dynamic uniaxial tensile strength of concrete-like materials. Int. J. Impact Eng. 2011, 38, 171–180. [Google Scholar] [CrossRef]
  38. Ministry of Water Resources, PRC. DL5073-2000 Code for Seismic Design of Hydraulic Buildings; China Electric Power Press: Beijing, China, 2001.
Figure 1. Location of the foundation pit.
Energies 13 05140 g001
Figure 2. Location plan of high-rise building and foundation pit.
Energies 13 05140 g002
Figure 3. Profile of high-rise building and foundation pit relative position.
Energies 13 05140 g003
Figure 4. Layout of monitoring points.
Energies 13 05140 g004
Figure 5. Zoning and boundary condition.
Energies 13 05140 g005
Figure 6. Monitoring points of building.
Energies 13 05140 g006
Figure 7. Vibration velocity curves of numerical simulation and field test.
Energies 13 05140 g007
Figure 8. PPV variation on the different floor.
Energies 13 05140 g008
Figure 9. Relationship between dynamic stress and floor.
Energies 13 05140 g009
Figure 10. Fitting curve of floor n to ratio i.
Energies 13 05140 g010
Table 1. Experiment results.
ExperimentMonitoring PointsExcavation Depth (m)Standoff Distance (m)Charge in
One Delay
(kg)
Vibration Velocity
(cm·s−1)
Dominant Frequency (Hz)Velocity Amplification Factor of the Top (VF17/VF1)
I#116.00024.0830.6000.49343.2401.190
#216.00030.5290.6000.33528.750
#316.00037.5770.6000.23931.250
#416.0000.6000.17424.440
#516.0000.6000.28418.850
II#116.00024.0830.8000.58836.2101.230
#216.00030.5290.8000.37928.670
#316.00037.5770.8000.29125.750
#416.0000.8000.19538.450
#516.0000.8000.35820.140
III#116.00024.0836.0001.77326.4701.260
#216.00030.5296.0001.19229.640
#316.00037.5776.0000.79051.230
#416.0006.0000.59124.530
#516.0006.0000.99515.760
IV#118.00025.4566.0001.66834.8701.220
#218.00031.6236.0001.15318.760
#318.00038.4716.0000.75343.570
#418.0006.0000.51924.410
#518.0006.0000.91928.340
V#118.00025.4568.0001.89852.4301.200
#218.00031.6238.0001.38425.760
#318.00038.4718.0000.99729.480
#418.0008.0000.60828.990
#518.0008.0001.19631.570
Table 2. The vibration velocity of each component of the monitoring point in the building.
ExperimentMonitoring PointsVertical Vibration Velocity (cm·s−1)Tangential Vibration Velocity (cm·s−1)Radial Vibration Velocity (cm·s−1)
I#30.2390.0310.042
#40.1740.0240.033
#50.2840.0510.057
II#30.2910.0980.101
#40.1950.0440.058
#50.3580.0990.100
III#30.7900.1330.142
#40.5910.0980.112
#50.9950.1480.267
IV#30.7530.1450.136
#40.5190.0840.099
#50.9190.1840.236
V#30.9970.1550.234
#40.6080.1010.233
#51.1960.2310.297
Table 3. Variables related to ground vibration subjected to foundation pit blasting.
CategoryVariablesDimension
Dependent variable Vibration displacement μL
Peak particle velocity υLT−1
Particle vibration acceleration αLT−2
Frequency fT−1
Independent variableCharge QM
Distance between structure and blasting source rL
Foundation pit excavation depth dL
Density of rock mass ρML−3
Phase velocity cLT−1
Detonation time tT
Note: L symbolizes the concept of length, M symbolizes the concept of mass, and T symbolizes the concept of time.
Table 4. Prediction formulas of peak particle velocity (PPV) on the ground surface.
Classical Sadovski’s Formula (Equation (8))Correlation CoefficientObtained Formula
(Equation (11))
Correlation Coefficient
v = 146.344 ( Q 3 R ) 1.688 0.723 v = 99.42 ( Q 3 r ) 1.453 ( d r ) 0.41 0.857
Table 5. Mechanical parameters of reinforced concrete materials.
Density ρ/(g·cm−3)Elastic Modulus E/GPaPoisson’s Ratio μ
2.537.50.19
Table 6. Detonation product state equation related parameters.
ρ/(g·cm−3)V/(cm·μs−1)A/GPaB/GPaR1R2ωE0/GPa
1.100.4214.418.24.20.90.154.19
Table 7. Less weathered limestone mechanical parameters.
ρ/(g·cm−3)E/GPaμσ0/GPaEtan/GPaβ
2.68450.250.50.020.5
Note: (1) σ0 is yield stress; (2) Etan is minimum bending stiffness; (3) β is hardening parameter.
Table 8. Filling and clay crushing stone mechanics parameters.
Categoryρ/(g·cm−3)E/GPaμRKFφC/GPaSTR-LIM
Silty clay1.980.0070.180.60.1740.0150.005
Clay crushed stone1.990.0110.190.50.2620.0350.005
Note: (1) RKF is the shape parameter of the failure surface.
Table 9. Comparison of PPVs.
LocationSimulationField ExperimentError of Deviation
First floor/(cm·s−1)0.7610.7903.67%
Ninth floor/(cm·s−1)0.5430.5918.12%
Top floor/(cm·s−1)1.0630.9956.83%
Table 10. The first 3th order natural vibration frequencies and mode of vibration.
SETNatural Vibration Frequency/HzMode of Vibration
10.70421 Energies 13 05140 i001
21.25467 Energies 13 05140 i002
31.63751 Energies 13 05140 i003
Table 11. VFn and ratio i.
Working ConditionsFloor FnVibration Velocity VFni = VFn/VF1
Field test I10.2391.000
90.1740.728
170.2841.188
Field test II10.2911.000
90.1950.670
170.3581.230
Field test III10.7901.000
90.5910.748
170.9951.259
Field test IV10.7531.000
90.5190.689
170.9191.221
Field test V10.9971.000
90.6080.610
171.1961.200
Numerical simulation I
(Excavation depth: 20 m
Charge of explosives: 15 kg)
11.5521.000
31.3690.884
51.0810.697
70.8780.568
91.0900.703
111.2820.826
131.4300.923
151.6811.084
171.9281.245
Numerical simulation II (Excavation depth: 16 m
Charge of explosives: 6 kg)
10.7611.000
30.6350.834
50.5240.688
70.3910.514
90.5430.714
110.6050.795
130.7100.933
150.8201.077
171.0631.397
Numerical simulation III
(Excavation depth: 22 m
Charge of explosives: 15 kg)
11.3531.000
31.1580.856
50.9440.698
70.7350.543
90.9710.718
111.1540.835
131.1920.881
151.3541.001
171.5361.135